 Open Access Article
Utility of a novel turn-off fluorescence probe for the determination of tranilast, an adjunctive drug for patients with severe COVID-19
Diaa Dagher *a,
Heba Elmansi
 a,
Jenny Jeehan Nasr
 a and
Nahed El-Enanyab
aDepartment of Pharmaceutical Analytical Chemistry, Faculty of Pharmacy, Mansoura University, Mansoura 35516, Egypt. E-mail: diaadagher@mans.edu.eg
bDepartment of Pharmaceutical Chemistry, Faculty of Pharmacy, New Mansoura University, New Mansoura 7723730, Egypt
First published on 9th August 2022
Abstract
Tranilast (TR) could be investigated as a suitable anti-inflammatory and NLRP3 inflammasome inhibitor medication for the treatment of COVID-19 acute patients. Owing to its importance, our study was constructed for the determination of TR using a new, fast, sensitive, and reliable green spectrofluorimetric method. TR was quantified in this study by forming a complex with the acriflavine (AC) reagent. The reaction between TR and AC quenched the fluorescence of AC through the formation of an ion-association complex and the response was measured at 493 nm after excitation at 263 nm. It was observed that the quenching of the fluorescence of AC was linear (r = 0.9998) with the concentration of TR in the range of 1.0–15.0 μg mL−1. The limit of detection was 0.224 μg mL−1, and the limit of quantification was 0.679 μg mL−1. The fluorescence quenching mechanism was carefully studied and was confirmed to be able to analyze TR in its pure form and its prepared pharmaceutical dosage form. To validate the method, the international conference of harmonization (ICH) Q2R1 guidelines were followed. The statistical assessment of the proposed and comparison methods revealed no significant differences between them. Moreover, the green criteria of the method were evaluated and confirmed.
1 Introduction
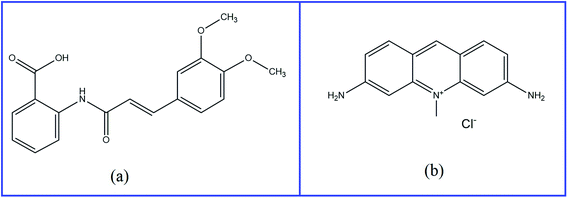
Coronavirus disease (COVID-19), which is caused by the SARS-CoV-2 strain,1 was first reported in humans in China in December 2019. Subsequently, it spread worldwide and infected millions of people; therefore, it has been considered a global pandemic. A primary reason for death in people with COVID-19 is a cytokine storm that causes acute inflammatory acute pneumonia.2 As a result of the acute inflammation and cytokine storm acute lung injury and respiratory distress syndrome have been reported.3 There is an immediate need to develop a treatment for COVID-19. Several antiviral, antibacterial, antiparasitic, and antiinflammatory medications have been utilized to counter its global spread. SARS-CoV-2 has been previously shown to activate the NLRP3 inflammasome and cause acute inflammation.4 Tranilast (TR), as an antiinflammatory drug, has the potential to prevent the exacerbation of COVID-19 by influencing a variety of pathways, including the inhibition of the NLRP3 inflammasome; cytokines (IL-5, IL-13, IL-17, IL-33, and TGF-b), signaling pathways (NF-κB); chemokines (CCL5 and CXCL9); and cell adhesion molecules (ICAM1). Therefore, along with other antiviral medications, TR could be investigated as a possible adjuvant treatment for people with acute COVID-19.4,5TR (Fig. 1A) is chemically named 2-[[(E)-3-(3,4-dimethoxyphenyl)prop-2-enoyl]amino]benzoic acid. Initially, TR was discovered as an antiallergic agent prescribed for diseases as bronchial asthma, allergic rhinitis, allergic conjunctivitis, atopic dermatitis, hypertrophic scars, and keloids.6–11 Its mechanism of action involves the suppression of the release of chemical mediators, such as histamine, as well as leukotriene from mast cells.12,13 Subsequently, TR is effective in the management of various types of cancer, such as pancreatic, gastric, prostate, and uterine leiomyoma cell cancers.14–17 Therefore, it is important to find a suitable method for its determination.
Acriflavine (AC) (Fig. 1B) is chemically named 3,6-diamino-10-methylacridin-10-ium chloride.18 It is a dye that is considered a local antiseptic, anticancer, and antibacterial agent.19 It has recently been utilized as a fluorescent reagent for the estimation of a variety of drugs, such as ascorbic acid,20 ketoprofen, and diclofenac sodium.21 This chemical reaction is based mainly on the quenching of its fluorescence in a quantitative way that could permit drug determination.
The literature survey represented limited methods for the determination of TR, including spectrophotometry22 and high-performance liquid chromatography (HPLC).23–25 These methods suffer from many limitations, such as low sensitivity,22–25 long chromatographic run times,23–25 complicated sample preparation25 and using non-green solvents.23–25 For example: the reported methods23,25 use high methanol percentage up to 60% and the reported method24 use high percentage of acetonitrile which is considered a toxic and non-green solvent. Our study aimed to examine AC quenching for the quick spectrofluorimetric determination of TR depending on the carboxylic group in TR that could interact with AC at an appropriate pH. As far as we know, there have been no previous published spectrofluorimetric methods for the determination of TR in its pure and pharmaceutical forms. Furthermore, the accessibility and usability of the spectrofluorimetric approach could be advantageous in quality control labs with inadequate sophistication or costly techniques. The proposed approach offers other merits, such as sensitivity, selectivity, low cost, and time saving. The green criteria of the proposed approach were assessed using the two following different tools: the analytical ecoscale26 and Green Analytical Procedure Index (GAPI).27
2 Experimental
2.1 Instrumentation
• To measure the fluorescence intensity, a Cary Eclipse fluorescence spectrophotometer was used. It was equipped with a xenon flash lamp that was adjusted to use a voltage of 700 V, a slit width of 5 nm, and 1 cm quartz cell to record the fluorescence in the wavelength range of 200–550 nm. The quenching of AC fluorescence was measured at 495 nm after excitation at 263 nm and smoothing factor of 20.• Absorbance measurements used in the official method were scanned using a Shimadzu dual-beam UV-Visible Spectrophotometer model 1650, Tokyo, Japan.
• A Sonic IV model-SS101H 230 (USA) was used for sonication.
• To adjust the pH, A Jenway 3510 pH meter was used.
• A water bath from England Cambridge Ltd (Shaker) was used to monitor the temperature.
2.2 Chemicals and materials
• TR was bought from Xiamen Keerda Bio-Tech Co., Ltd (Fujian, China), with a purity of 98%.• AC was supplied from Sigma-Aldrich, Germany.
• Organic solvents (HPLC grade) such as methanol, ethanol, propanol, and n-butanol were purchased from Fisher Scientific UK, Loughborough Leics (UK).
• Different surfactants including carboxy methylcellulose (CMC), sodium dodecyl sulphate (SDS), Tween 80, and cetrimide were bought from El-Nasr Pharmaceutical Chemicals Co., Abu Zaabal, Egypt.
• Talc, calcium stearate, crystalline cellulose, and maize starch were provided from El-Nasr Pharmaceutical Chemicals Co., Abu Zaabal, Egypt.
• Acetic acid, boric acid, phosphoric acid, and sodium hydroxide were used for the preparation of the Britton–Robinson (BR) buffer and were all supplied from Sigma-Aldrich, Germany.
2.3 Samples and standard solutions preparation
• A stock solution of TR was prepared by dissolving 10 mg of TR in 100 mL of ethanol to obtain a concentration of 100 μg mL−1 for the drug.• An aqueous solution of AC was prepared at a concentration of 2 × 10⁻⁶ M by transferring 2.5 mL of a 2 × 10⁻⁴ M AC stock solution (prepared by dissolving 0.026 g of AC in 500 mL distilled water) into a 250 mL volumetric flask and completing it to the mark with distilled water.
• BR buffer was prepared over a pH range of 2–12 by mixing 0.04 M acetic acid, 0.04 M phosphoric acid, and 0.04 M boric acid and adjusting the pH by 0.2 M sodium hydroxide.
• The surfactants were prepared as 1.0% w/v solutions in distilled water.
2.4 Procedures for constructing a calibration graph
Aliquots of TR (1.0–15.0 μg mL−1) were sequentially transferred into 10- mL volumetric flasks. Thereafter, 1.2 mL of the BR buffer solution (pH 7) and 1.0 mL of AC solution (2 × 10⁻⁶ M) were added, and the solution was diluted to 10.0 mL with ethanol, shaken well, and set aside for 5 min. The fluorescence quenching was recorded at 495 nm after excitation at 263 nm, as shown in Fig. 2. The study was conducted against a blank measurement simultaneously. The calibration graph was constructed by plotting the decrease in the fluorescence intensity,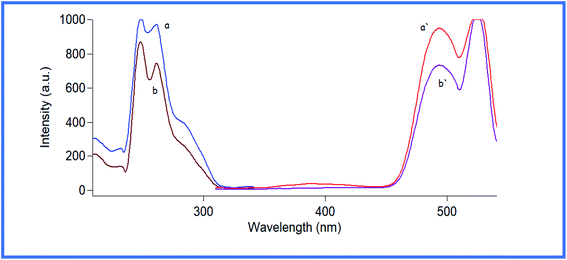 | ||
| Fig. 2 Fluorescence excitation and emission spectra of: (a and a′) 2 × 10⁻⁶ M acriflavine. (b and b′) 2 × 10⁻⁶ M acriflavine with 8 μg ml−1 tranilast. | ||
ΔF (ΔF = FI (blank) − FI (TR − AC ion − pair complex)), versus the final drug concentration in μg mL−1, thereafter, the regression analysis was carried out.
2.5 Procedures for laboratory-prepared mixture content of capsules
TR is available under the trade name of Rizaben® capsules. These capsules are not available in Egypt; therefore, the mixture contents were prepared in the laboratory. The proposed method could determine the active ingredient in the presence of pharmaceutical excipients. TR capsules with a concentration of 100 mg per capsule were prepared using 20 mg of talc, 7 mg of calcium stearate, 15 mg of crystalline cellulose, and 15 mg of maize starch.28 Upon mixing, a precise weight of the drug equivalent to 10 mg TR was transferred into a 100 mL volumetric flask. Thereafter, 70 mL of ethanol was added, followed by 20 min of sonication, and the flask was completed to the mark with ethanol. The solution was filtered using a 0.45 μm syringe filter; the filtrate was diluted with ethanol, and the general procedures described under “constructing a calibration graph” were followed.3 Results and discussion
According to a review of the existing literature, no spectrofluorimetric methods for determining TR have been published. Any process that causes a decrease in the fluorescence intensity of an analyte is known as fluorescence quenching.29 Different molecular interactions involving energy transfer, ground-state complex formation, excited-state reactions, molecular rearrangements, and collisional quenching can cause the quenching process.29 In this study, a rapid, facile, sensitive, selective, and green spectrofluorimetric method was used for the estimation of TR using AC dye depending on the fact that AC exhibits native fluorescence at 493 nm (λex, 263 nm), and this fluorescence intensity decreased after the addition of TR to AC at a pH of 7, as shown in Fig. 2.3.1 Optimization of experiment parameters
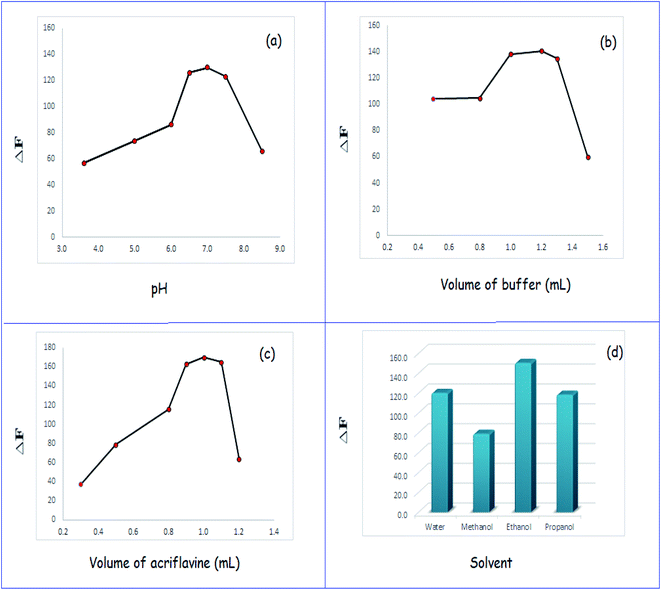
Various criteria that could influence the reaction were studied to determine optimal conditions for the formed ion-association complex. The parameters investigated include the following: pH and volume of buffer, volume of reagent, diluting solvents, and type of surfactants.3.2 Mechanism of the reaction between TR and AC
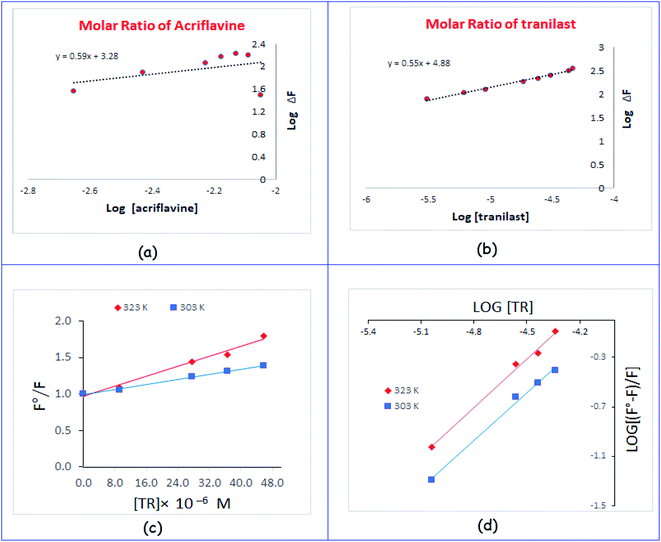
![[thin space (1/6-em)]](https://www.rsc.org/images/entities/char_2009.gif) F vs. log[AC] and log[TR] exhibited straight lines, and the values of the slopes were 0.59 and 0.55, respectively, as shown in Fig. 4a and b. It was concluded that the molar reactivity of the reaction was 0.59/0.55, i.e. the reaction between AC and TR proceeded at a ratio of 1
F vs. log[AC] and log[TR] exhibited straight lines, and the values of the slopes were 0.59 and 0.55, respectively, as shown in Fig. 4a and b. It was concluded that the molar reactivity of the reaction was 0.59/0.55, i.e. the reaction between AC and TR proceeded at a ratio of 1![[thin space (1/6-em)]](https://www.rsc.org/images/entities/char_2009.gif) :
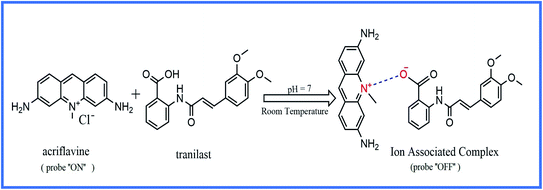
:![[thin space (1/6-em)]](https://www.rsc.org/images/entities/char_2009.gif) 1. The ratio could be deduced by the presence of one carboxylic group in TR. At a specific pH, an AC positively charged nitrogen atom reacted with a TR negatively charged carboxylate group. Therefore, electrostatic forces contributed to the formation of an ion-association complex, as shown in Scheme 1.
1. The ratio could be deduced by the presence of one carboxylic group in TR. At a specific pH, an AC positively charged nitrogen atom reacted with a TR negatively charged carboxylate group. Therefore, electrostatic forces contributed to the formation of an ion-association complex, as shown in Scheme 1.
 | (1) |
The intercept of the straight line is one and the slope is Stern–Volmer constant (Ksv). The linear relationship (r = 0.997 and 0.991) between F0/F and [Q] indicated the presence of a single type of quenching process, either dynamic or static quenching. Fig. 4c shows an increase in Ksv values from 8.8 × 10³ to 17.2 × 10³ L mol−1 with an increase in temperature from 303 to 323 K, indicating dynamic quenching.31–33
Additionally, the bimolecular quenching constant (Kq) could be calculated from the following equation:33
 | (2) |
 | (3) |
![[thin space (1/6-em)]](https://www.rsc.org/images/entities/char_2009.gif) :
:![[thin space (1/6-em)]](https://www.rsc.org/images/entities/char_2009.gif) 1) between AC and TR obtained from the limiting logarithmic method.
1) between AC and TR obtained from the limiting logarithmic method.
Moreover, the Kb value was used to calculate Gibb's free energy (G0), as demonstrated in the following equation:
ΔG0 = −RT![[thin space (1/6-em)]](https://www.rsc.org/images/entities/char_2009.gif) ln ln![[thin space (1/6-em)]](https://www.rsc.org/images/entities/char_2009.gif) Kb, Kb,
| (4) |
3.3 Validation of the proposed method
This method was validated following the international conference of harmonization (ICH) Q2R1 guidelines,36 as shown in Table 1. The inspected parameters include linearity, range, limit of detection (LOD), limit of quantitation (LOQ), precision, accuracy, robustness, and selectivity.| Parameter | TR |
|---|---|
| Range (μg mL−1) | 0.679–15.0 |
| Linearity range (μg mL−1) | 1.0–15.0 |
| Intercept (a) | 67.98 |
| Slope (b) | 19.61 |
| Correlation coefficient (r) | 0.9998 |
| S.D. of residuals (Sy/x) | 2.11 |
| S.D. of intercept (Sa) | 1.331 |
| S.D. of slope (Sb) | 0.149 |
| Percentage relative standard deviation, %RSD | 0.993 |
| %Error | 0.351 |
| Limit of detection, LOD (μg ml−1) | 0.224 |
| Limit of quantitation, LOQ (μg ml−1) | 0.679 |
| ΔF = 67.98 + 19.61C (r = 0.9998) |
A correlation coefficient with a high value (r > 0.999) was used to confirm linearity.37 The linearity was determined by calculating the percentage relative standard deviation (%RSD) and displaying the variances around the slopes (Sb) with a negligible value to designate a small degree of available data around the regression line. Other statistical characteristics include the intercept standard deviation (Sa) and standard deviation of the residuals (Sy/x) were then shown in Table 1.37
where Sa is the standard deviation of the intercept, and b is the slope of the calibration curve. The LOD and LOQ values were 0.224 and 0.679 μg mL−1, respectively, indicating the sensitivity of the proposed method,36 as shown in Table 1.
| Compound | Proposed method | Comparison method22 | |||
|---|---|---|---|---|---|
| Conc. taken (μg mL−1) | Conc. found (μg mL−1) | % founda | Conc. taken (μg mL−1) | % founda | |
| a N.B. Each result is the average of three separate determinations. The figures between parentheses are the tabulated t and F values at P = 0.05.37 | |||||
| TR | 1.0 | 0.984 | 98.4 | 3.0 | 99.33 |
| 2.0 | 2.028 | 101.4 | 6.0 | 100.68 | |
| 3.0 | 3.003 | 100.1 | 9.0 | 99.77 | |
| 6.0 | 6.035 | 100.58 | |||
| 8.0 | 7.957 | 99.46 | |||
| 10.0 | 9.95 | 99.5 | |||
| 14.0 | 14.145 | 101.04 | |||
| 15.0 | 14.903 | 99.35 | |||
| Mean | 99.98 | 99.93 | |||
| ± S.D. | 0.99 | 0.69 | |||
| t-Test | 0.07 (2.26)* | ||||
| F-Test | 2.06 (19.35)* | ||||
Precision was evaluated by examining different concentrations of TR three times in three replicates in the same day (intraday precision) and on different sequent days (interday precision). Low values of percentage relative standard deviations (%RSD < 2%) and percentage error (%Error < 1%) indicated the repeatability and reproducibility of the proposed method, as shown in Table 3.
| Proposed method | ||||
|---|---|---|---|---|
| Conc. (μg mL−1) | 3.0 | 10.0 | 15.0 | |
| a N. B. Each result is the average of three separate determinations. | ||||
| Intraday | % founda | 100.18 | 99.16 | 99.29 |
| 101.71 | 100.54 | 100.62 | ||
| 100.40 | 100.29 | 100.02 | ||
| Mean | 100.77 | 99.997 | 99.98 | |
| S.D. | 0.83 | 0.73 | 0.67 | |
| %RSD | 0.82 | 0.73 | 0.67 | |
| %Error | 0.47 | 0.42 | 0.39 | |
| Interday | % found | 99.12 | 98.90 | 98.38 |
| 101.07 | 100.70 | 99.84 | ||
| 99.82 | 100.40 | 101.46 | ||
| Mean | 100.0 | 100.0 | 99.9 | |
| S.D. | 0.99 | 0.97 | 1.54 | |
| %RSD | 0.99 | 0.97 | 1.54 | |
| %Error | 0.57 | 0.56 | 0.89 | |
| Parameters | Proposed method | Comparison method22 | |||
|---|---|---|---|---|---|
| Conc. taken (μg mL−1) | Conc. found (μg mL−1) | % founda | Conc. taken (μg mL−1) | % founda | |
| a N. B. Each result is the average of three separate determinations. The figures between parentheses are the tabulated t and F values at P = 0.05.37 | |||||
| TR | 5.0 | 4.946 | 98.92 | 3.0 | 101.02 |
| 10.0 | 9.935 | 99.35 | 5.0 | 98.28 | |
| 15.0 | 14.991 | 99.94 | 9.0 | 99.02 | |
| Mean | 99.40 | 99.44 | |||
| ± S.D. | 0.51 | 1.16 | |||
| t-Test | 0.05 (2.78)* | ||||
| F-Test | 1.0 (19.00)* | ||||
4 Application of the proposed method
4.1 Assay of laboratory prepared capsules
As TR could be estimated in bulk powder; therefore, it was relevant to test TR in a laboratory-prepared capsule. The results of the proposed approach were compared with those of the reported method using Student's t-test and variance ratio F-test.37 As evidenced by the t and F values, there were no significant differences between the proposed and reported approaches considering accuracy and precision, as shown in Table 4.4.2 Evaluation of the greenness of the proposed approach
Ecofriendly greenness lies at the core of each analytical procedure. In this study, we employed two techniques; Green Analytical Procedure Index (GAPI) and analytical ecoscale, to evaluate the greenness of this approach.The analytical ecoscale26 is a semiquantitative tool that for assessing the greenness of the method. The analytical ecoscale score is achieved by calculating penalty points of the amount of reagent, hazards, instrumentation energy, and waste and subtracting the total penalty points from 100. Herein, the results are ranked on a scale, where scores > 75 rank the approach as excellent green, scores > 50 represent an acceptable green approach, and scores < 50 represent an inadequate green approach. The score of the proposed approach was 85, which revealed an excellent green methodology (Table 5).
| Item | Penalty points |
|---|---|
| 1. Analytical eco-scale score26 | |
| (1) Reagent; volume (ml) | |
| Ethanol; <10 ml | 4 |
| Acriflavine; 1 ml | 6 |
| BR buffer; 1.2 ml | 2 |
| (2) Spectrofluorimeter; <0.1 KW h per sample | 0 |
| (3) Occupational hazard | 0 |
| (4) Waste | 3 |
| Total penalty points | 15 |
| Analytical eco-scale score | 85 |
![[thin space (1/6-em)]](https://www.rsc.org/images/entities/char_2009.gif) |
|
| 2. Green analytical procedure index (GAPI)27 | |
 |
|
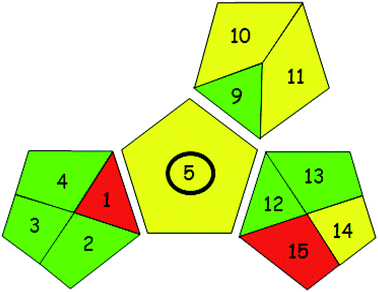
Recently, GAPI27 was developed as a new tool to evaluate the greenness of analytical methods. It uses five pictograms to analyze and calculate the impact of each stage of an analytical process on the environment with three color codes; green, yellow, and red indicating low, medium, and high environmental impact, respectively. New criteria such as health and safety were considered by this tool. When GAPI was applied to our proposed method, we observed that the majority of GAPI criteria were fulfilled. Criteria 1 and 15 were colored in red, while criteria 5, 10, 11, and 12 were colored in yellow, as shown in Table 5.
5 Conclusion
In our study, AC was utilized to form an ion-association complex with TR. Sensitivity, selectivity, reliability, precision, cost, and time saving were the advantages of the proposed method. The quenching of the fluorescence of AC was linear (r = 0.9998) with the concentration of TR in the range of 1.0–15.0 μg mL−1 with limit of detection = 0.224 μg mL−1. In this method, there was no requirement for sample pretreatment or extraction with organic solvents, which was the most significant advantage of this method, compared with other reported methods. The suggested procedures were used for routine assays with high sample throughput in bulk and pharmaceutical dosage forms. This method is a viable choice for quality control because of its simplicity and low environmental impact. The usage of fluorimetry as a cost-effective technique is also an advantage. The eco-friendly property and dependence on ethanol diluting solvent added to the facility of the method.Ethics permission
No study on humans or animals has been included.Author contributions
Diaa Dagher carried out the lab work, and statistical calculations. Heba Elmansi, Jenny Nasr, and Nahed El-Enany supervised the whole research and the manuscript. All authors participated in study and approved the manuscript.Conflicts of interest
No competing interests.References
- C.-C. Lai, T.-P. Shih, W.-C. Ko, H.-J. Tang and P.-R. Hsueh, Severe acute respiratory syndrome coronavirus 2 (SARS-CoV-2) and coronavirus disease-2019 (COVID-19): The epidemic and the challenges, Int. J. Antimicrob. Agents, 2020, 55, 105924 CrossRef CAS PubMed.
- D. Wang, B. Hu, C. Hu, F. Zhu, X. Liu, J. Zhang, B. Wang, H. Xiang, Z. Cheng and Y. Xiong, Clinical characteristics of 138 hospitalized patients with 2019 novel coronavirus–infected pneumonia in Wuhan, China, JAMA, 2020, 323, 1061–1069 CrossRef CAS PubMed.
- L. E. Gralinski and V. D. Menachery, Return of the Coronavirus: 2019-nCoV, Viruses, 2020, 12, 135 CrossRef PubMed.
- A. Saeedi-Boroujeni, M.-R. Mahmoudian-Sani, R. Nashibi, S. Houshmandfar, S. Tahmaseby Gandomkari and A. Khodadadi, Tranilast: a potential anti-Inflammatory and NLRP3 inflammasome inhibitor drug for COVID-19, Immunopharmacol. Immunotoxicol., 2021, 1–12 Search PubMed.
- A. Saeedi-Boroujeni, R. Nashibi, A. A. Ghadiri, M. Nakajima, S. Salmanzadeh, M.-R. Mahmoudian-Sani, M. G. Hanafi, A. Sharhani and A. Khodadadi, Tranilast as an Adjunctive Therapy in Hospitalized Patients with Severe COVID-19: A Randomized Controlled Trial, Arch. Med. Res., 2022, 53(4), 368–377 CrossRef CAS PubMed.
- H. Shioda, A double blind controlled trial of N-(3′, 4′-dimethoxycinnamoyl) anthranilic acid on children with bronchial asthma. N-5'Study Group in Children, Allergy, 1979, 34, 213–219 CrossRef CAS PubMed.
- N. Kondo, O. Fukutomi, M. Shinbara and T. Orii, Inhibition of interferon-γ and interleukin-2 production from lymphocytes stimulated with food antigens by an anti-allergic drug, Tranilast, in patients with food-sensitive atopic dermatitis, Biotherapy, 1994, 8, 19–22 CrossRef CAS PubMed.
- T. Pfab and B. Hocher, Tranilast and hypertensive heart disease: further insights into mechanisms of an anti-inflammatory and anti-fibrotic drug, J. Hypertens., 2004, 22, 883–886 CrossRef CAS PubMed.
- H. Azuma, K. Banno and T. Yoshimura, Pharmacological properties of N-(3′, 4′-dimethoxycinnamoyl) anthranilic acid (N-5′), a new anti-atopic agent, Br. J. Pharmacol., 1976, 58, 483–488 CrossRef CAS PubMed.
- M. Isaji, M. Nakajoh and J. Naito, Selective inhibition of collagen accumulation by N-(3, 4-dimethoxycinnamoyl) anthranilic acid (N-5') in granulation tissue, Biochem. Pharmacol., 1987, 36, 469–474 CrossRef CAS PubMed.
- S. Shigeki, T. Murakami, N. Yata and Y. Ikuta, Treatment of keloid and hypertrophic scars by iontophoretic transdermal delivery of tranilast, Scand. J. Plast. Reconstr. Surg. Hand Surg., 1997, 31, 151–158 CrossRef CAS PubMed.
- A. Koda, H. Nagai, S. Watanabe, Y. Yanagihara and K. Sakamoto, Inhibition of hypersensitivity reactions by a new drug, N (3′, 4′-dimethoxycinnamoyl) anthranilic acid (N-5′), J. Allergy Clin. Immunol., 1976, 57, 396–407 CrossRef CAS PubMed.
- H. Komatsu, M. Kojima, N. Tsutsumi, S. Hamano, H. Kusama, A. Ujiie, S. Ikeda and M. Nakazawa, Study of the mechanism of inhibitory action of tranilast on chemical mediator release, Jpn. J. Pharmacol., 1988, 46, 43–51 CrossRef CAS PubMed.
- M. Hiroi, M. Onda, E. Uchida and T. Aimoto, Anti-tumor effect of N-[3, 4-dimethoxycinnamoyl]-anthranilic acid (tranilast) on experimental pancreatic cancer, J. Nippon Med. Sch., 2002, 69, 224–234 CrossRef CAS PubMed.
- H. Shime, M. Kariya, A. Orii, C. Momma, T. Kanamori, K. Fukuhara, T. Kusakari, Y. Tsuruta, K. Takakura and T. Nikaido, Tranilast inhibits the proliferation of uterine leiomyoma cells in vitro through G1 arrest associated with the induction of p21waf1 and p53, J. Clin. Endocrinol. Metab., 2002, 87, 5610–5617 CrossRef CAS PubMed.
- M. Yashiro, K. Murahashi, T. Matsuoka, K. Nakazawa, H. Tanaka, H. Osaka, T. Koyama, M. Ohira and K. H. Chung, Tranilast (N-3, 4-dimethoxycinamoyl anthranilic acid): a novel inhibitor of invasion-stimulating interaction between gastric cancer cells and orthotopic fibroblasts, Anticancer Res., 2003, 23, 3899–3904 CAS.
- K. Izumi, A. Mizokami, Y. Q. Li, K. Narimoto, K. Sugimoto, Y. Kadono, Y. Kitagawa, H. Konaka, E. Koh and E. T. Keller, Tranilast inhibits hormone refractory prostate cancer cell proliferation and suppresses transforming growth factor β1-associated osteoblastic changes, Prostate, 2009, 69, 1222–1234 CrossRef CAS PubMed.
- International Union of Pure and Applied Chemistry [Online], available: https://iupac.org/, 18-6-2021.
- C. Manivannan, K. M. Sundaram, M. Sundararaman and R. Renganathan, Investigation on the inclusion and toxicity of acriflavine with cyclodextrins: a spectroscopic approach, Spectrochim. Acta, Part A, 2014, 122, 164–170 CrossRef CAS PubMed.
- L. I. Abd Ali, A. F. Qader, M. I. Salih and H. Y. Aboul-Enein, Sensitive spectrofluorometric method for the determination of ascorbic acid in pharmaceutical nutritional supplements using acriflavine as a fluorescence reagent, Luminescence, 2019, 34, 168–174 CrossRef CAS PubMed.
- F. Ibrahim, H. Elmansi and R. Aboshabana, Assessment of two analgesic drugs through fluorescence quenching of acriflavine as a new green methodology, Microchem. J., 2021, 164, 105882 CrossRef CAS.
- Z. Weiwei, Assay of Tranilast Capsules by UV Spectrophotometry [J], Acad. J. Guangdong Coll. Pharm., 1996, 4, 249–251 Search PubMed.
- F. Zhao, Y. Yuan, L. Tan and X. Zhang, Determination of tranilast in human plasma by reversed-phase high performance liquid chromatography and its pharmacokinetics, Chin. J. Chromatogr., 1998, 16, 78–79 CAS.
- K. Tadano, Y. Yuhki, I. Aoki, K. Miyazaki and T. Arita, High-performance liquid chromatographic determination of tranilast in plasma, J. Chromatogr. B: Biomed. Sci. Appl., 1985, 341, 228–231 CrossRef CAS.
- D. K. Slobodzian, J. Y.-K. Hsieh and W. F. Bayne, Simultaneous determination of tranilast and metabolites in plasma and urine using high-performance liquid chromatography, J. Chromatogr. B: Biomed. Sci. Appl., 1985, 345, 345–354 CrossRef CAS.
- A. Gałuszka, Z. M. Migaszewski, P. Konieczka and J. Namieśnik, Analytical Eco-Scale for assessing the greenness of analytical procedures, TrAC, Trends Anal. Chem., 2012, 37, 61–72 CrossRef.
- J. Płotka-Wasylka, A new tool for the evaluation of the analytical procedure: Green Analytical Procedure Index, Talanta, 2018, 181, 204–209 CrossRef PubMed.
- dpkitaoka [Online], available: https://www.dpkitaoka.com/, 5-7-2021.
- J. R. Lakowicz, Principles of fluorescence spectroscopy, Springer science & business media, 2013 Search PubMed.
- J. Rose, Advanced Physicochemical Experiments Pitman, London, England, 1964 Search PubMed.
- X. Wang, P. Wu, Y. Lv and X. Hou, Ultrasensitive fluorescence detection of glutaraldehyde in water samples with bovine serum albumin-Au nanoclusters, Microchem. J., 2011, 99, 327–331 CrossRef CAS.
- Q. Wu, C. Li, Y. Hu and Y. Liu, Study of caffeine binding to human serum albumin using optical spectroscopic methods, Sci. China, Ser. B: Chem., 2009, 52, 2205 CrossRef CAS.
- S. Afkham, J. Hanaee, M. Zakariazadeh, F. Fathi, S. Shafiee and S. Soltani, Molecular mechanism and thermodynamic study of Rosuvastatin interaction with human serum albumin using a surface plasmon resonance method combined with a multi-spectroscopic, and molecular modeling approach, Eur. J. Pharm. Sci., 2022, 168, 106005 CrossRef CAS PubMed.
- S. Bi, L. Ding, Y. Tian, D. Song, X. Zhou, X. Liu and H. Zhang, Investigation of the interaction between flavonoids and human serum albumin, J. Mol. Struct., 2004, 703, 37–45 CrossRef CAS.
- P. D. Ross and S. Subramanian, Thermodynamics of protein association reactions: forces contributing to stability, Biochemistry, 1981, 20, 3096–3102 CrossRef CAS PubMed.
- Guideline IHT, Validation of analytical procedures: text and methodology, Q2 (R1), 2005, vol. 1, p. 05 Search PubMed.
- J. Miller and J. C. Miller, Statistics and chemometrics for analytical chemistry, Pearson education, 2018 Search PubMed.
| This journal is © The Royal Society of Chemistry 2022 |

