DOI:
10.1039/D2RA01994A
(Paper)
RSC Adv., 2022,
12, 15623-15630
Non-isothermal crosslinking of ethylene vinyl acetate initiated by crosslinking agents: kinetic modelling†
Received
28th March 2022
, Accepted 17th May 2022
First published on 23rd May 2022
Abstract
The non-isothermal crosslinking process of ethylene vinyl acetate (EVA) initiated by several crosslinking agents was studied by using differential scanning calorimetry (DSC). The crosslinking agent tert-butylperoxy 2-ethylhexyl carbonate (TBEC) exhibited much shorter reaction time and lower reaction temperature. The effect of the crosslinking agent TBEC on the EVA crosslinking process was further analyzed by using Avrami, Ozawa, Mo and Flynn-Wall-Ozawa (FWO) methods, respectively. The small fluctuations in the values of Avrami exponent n and Mo parameter a indicate that the EVA crosslinking mechanism is basically unchanged with increasing heating rate and crosslinking agent content. The change of the Ozawa exponent m is presumably due to the increase in viscosity of EVA/TBEC samples during the crosslinking process. The heating/cooling function F(T) values and the activation energy Ea are dependent on the conversion rate α. In addition, Ea shows irregular changes in the early stages of crosslinking, and increases with the increase of conversion rate α in the later stages of crosslinking.
1. Introduction
The rapid growth of solar photovoltaics (PV) is critical to meet the growing demand for clean energy, and to decarbonize global power systems as well. Currently, wafer-based crystalline silicon (c-Si) PV modules are widely used in solar installations worldwide. A typical PV module consists of front glass, polymer encapsulant, PV cell, and backsheet (Fig. 1).1,2 The encapsulant is one of the important layers in the structure of the PV module, as the long-term reliability of the PV module is dependent on the effectiveness of the encapsulation material in preventing corrosion of the solar cells under extreme environmental conditions.3,4
 |
| | Fig. 1 Components of a PV module. | |
In early 1970s, polydimethylsiloxane (PDMS) was used as an encapsulant because of its excellent intrinsic stability against thermal-induced stress and ultraviolet (UV) light-induced stress.5,6 Later, many alternative materials such as ethylene vinyl acetate copolymer (EVA), polyvinyl butyral (PVB), thermoplastic polyolefin (TPO), and thermoplastic polyurethane (TPU) methacrylate polyethylene copolymer acids were developed.3,7 Nowadays, EVA is widely used in PV modules as an encapsulation material due to its excellent high transmittance, resistance to UV radiation, good adhesion to glass, and relative good weather resistance properties.8–12
Some additives, such as crosslinking agent, UV absorber, light stabilizer, antioxidant, etc.8 were added to prevent the degradation reaction of EVA during long-term operation,13,14 in order to achieve the feasible and economical goal of 25–30 years of stable operation.15,16 The type of crosslinking agent has a significant impact on the kinetics of the lamination process, which further affects the energy consumption and the cost of the production. Considering that the crosslinking agent plays an important role in the lamination process, it is crucial to find a crosslinking agent with high crosslinking rate at relative low processing temperature to meet the industrial needs.1,17 The organic peroxide thermochemical crosslinking agent is widely used due to its controllable decomposition rate, low amount of by-products, and economical process.18 Traditionally, the crosslinking of EVA was mainly initiated by dicumyl peroxide (DCP). In recent years, modified organic peroxides, including tert-butylperoxy 2-ethylhexyl carbonate (TBEC), 2,5-dimethyl-2,5-di(tert-butylperoxy) hexane (DBPH), benzoyl peroxide (BPO), etc.19–23 have been used to improve the crosslinking efficiency of EVA. Therefore, understanding the effect of the crosslinking agent on the crosslinking process of EVA samples is of crucial importance in selecting a suitable crosslinking agent and optimizing the lamination process.24
The crosslinking process of EVA in the solid or melting state follows a complex mechanism involving several reaction steps, and the apparent activation energy and rate of EVA crosslinking reaction increase with increasing of the vinyl acetate (VA) content.25 Several mathematical models of non-isothermal kinetics, such as Avrami, Ozawa, and Mo methods, have been developed to describe the crystallization kinetics.26–29 These models also fit well with experimental data in the study of apparent kinetic parameters of crosslinking reactions of EVA with a VA content of 18 wt%.30 In the above-mentioned work, only EVA with low VA content (<28 wt%) was studied. However, the VA content is usually in a range of 28–33 wt% for PV applications.1 It is necessary to expand the knowledge of the crosslinking kinetics of EVA in order to further improve its long-term performance for photovoltaic encapsulation.
In this work, the effect of crosslinking agents on the crosslinking process of EVA was systematically investigated. The non-isothermal DSC analysis was first performed to obtain the crosslinking temperature, crosslinking rate, and crosslinking enthalpy of four crosslinking agents, including DCP, TBEC, DBPH, and BPO. Then, the kinetic parameters of EVA/TBEC crosslinking process were investigated by using Avrami, Ozawa, Mo, and Flynn-Wall-Ozawa (FWO) methods, respectively.
2. Materials and methods
2.1 Material
The granulated EVA copolymer (KA-40) with vinyl acetate content of 28 wt%, a melt flow index of 20 g/10 min, a melting point of 65 °C, and density of 0.945 g cm−3 was supplied by the Polyolefin Company Pte. Ltd. (Singapore). The weight-average molecular weight (Mw) of EVA is 101![[thin space (1/6-em)]](https://www.rsc.org/images/entities/char_2009.gif) 000 g mol−1, and the dispersibility index (Mw/Mn) is 2.09.
000 g mol−1, and the dispersibility index (Mw/Mn) is 2.09.
The TBEC was purchased from Shanghai Qinshang Chemical Co. Ltd. with a purity of 95%. The DCP was purchased from Shanghai Lingfeng Chemical Reagent Co. Ltd. with a purity of 99.5%. The DBPH was purchased from Shanghai Maclean Biochemical Technology Co. Ltd. with a purity of 93%. The BPO was purchased from Adamas with a purity of 98%.
2.2 EVA/crosslinking agent compounding
The granulated EVA copolymer was mixed with 0.4, 0.8, and 1.6 wt% of crosslinking agent, respectively. Then, the mixture was treated by melt compounding in a twin-screw extruder (Thermo minilab II) with a screw speed of 100 rpm at 90 °C for 5 min. Then, the samples were cooled to room temperature.
2.3 Differential scanning calorimetric (DCS) analysis
The non-isothermal crosslinking experiments of EVA/(crosslinking agent) were carried out using a TA instrument Discovery DSC. The heat flow versus temperature (or time) curves for each sample were collected in scanning mode from 40 to 250 °C under N2 atmosphere (50 mL min−1) at five different heating rates of 2.5, 5, 10, 20, 40 °C min−1 using 3–10 mg of the sample, respectively.
The conversion rate α at time t is calculated according to the eqn (1):31,32
| |
 | (1) |
where Δ
Ht is the heat of reaction at time
t, and Δ
Htotal is the total heat of reaction at a certain heating rate.
Crosslinking time t can be obtained from eqn (2):33
| |
 | (2) |
where
T0 is the onset temperature of the crosslinking process,
T is the temperature at the crosslinking time
t and
ϕ is the heating/cooling rate.
3. Results and discussion
3.1 DSC analysis
The characterization of the crosslinking process of the EVA/(crosslinking agent) (0.8 wt%) was carried out by DSC analysis at the heating rate of 10 °C min−1. Fig. 2 shows the DSC curves for four different EVA/(crosslinking agent) samples. The calculated conversion rate α versus time t is shown in Fig. 3. The reaction time t, onset temperature Tonset, peak temperature Tpeak, and enthalpy ΔH measured by DSC of four EVA samples with different crosslinking agents are listed in Table 1.
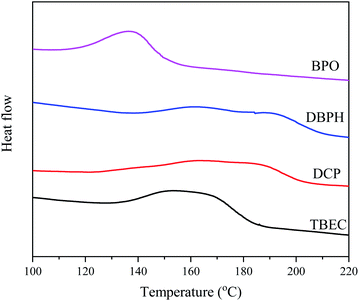 |
| | Fig. 2 DSC curves for EVA samples with 0.8 wt% of crosslinking agent at the heating rate of 10 °C min−1. | |
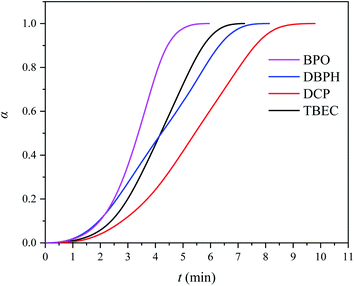 |
| | Fig. 3 Conversion rate α vs. time t curves for EVA samples with 0.8 wt% of crosslinking agent at the heating rate of 10 °C min−1. | |
Table 1 Times, onset temperatures, peak temperatures and enthalpies obtained by DSC analysis
| Crosslinking agent |
t (min) |
Tonset (°C) |
Tpeak (°C) |
ΔH (J g−1) |
| BPO |
5.97 |
101 |
138 |
7.03 |
| DBPH |
8.15 |
134 |
190 |
8.07 |
| DCP |
9.81 |
115 |
167 |
10.09 |
| TBEC |
7.25 |
116 |
162 |
9.68 |
Among four considered crosslinking agents, the EVA/BPO sample shows the lowest onset temperature (Tonset), peak temperature (Tpeak), and the shortest reaction time t (Table 1). However, the decomposition product from BPO contains aromatic compounds, which is unfavorable for EVA anti-discoloration performance.8 The EVA/TBEC sample shows lower onset temperature (Tonset), peak temperature (Tpeak), and shorter reaction time t than the EVA/DCP and EVA/DBPH samples. Both the EVA/TBEC and EVA/DCP samples have large reaction enthalpy ΔH, which is related to the hydrogen abstracting ability of the radicals decomposed by TBEC and DCP during the crosslinking process. The high hydrogen abstracting ability of the radicals from TBEC and DCP can induce the formation of a denser cross-linked network from EVA, resulting in a higher enthalpy change of the reaction.19,20,34 Thus, the crosslinking agent TBEC, which exhibits a high reaction rate and low reaction temperature, was selected to investigate the crosslinking kinetics of EVA.
The non-isothermal DSC curves of EVA/TBEC samples are shown in Fig. 4. The peak temperature is constant as the amount of TBEC increased, indicating that the peak temperature is not dependent on the TBEC content (Fig. 4a). The peak temperature increases with the heating rate increased, which indicates that the peak temperature of EVA/TBEC sample is strongly dependent on the heating rate (Fig. 4b). At the same heating rate, the enthalpy ΔH increases with increasing of the TBEC content (Table 2), which suggests that the enthalpy ΔH is dependent on the TBEC content. Generally, at the same TBEC content, ΔH decreases slightly with increasing of the heating rate.
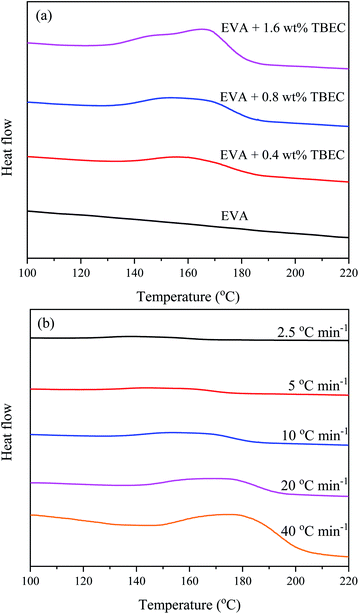 |
| | Fig. 4 Non-isothermal DSC curves for (a) different TBEC contents at the same heating rate (10 °C min−1), and (b) the same TBEC content (0.8 wt%) at different heating rates. | |
Table 2 Crosslinking enthalpies and peak temperatures for different contents at different heating rates
| TBEC content |
ϕ (°C min−1) |
ΔH (J g−1) |
Tpeak (°C) |
| 0.4 wt% |
2.5 |
6.46 |
141 |
| 5 |
6.19 |
149 |
| 10 |
6.49 |
160 |
| 20 |
5.23 |
170 |
| 40 |
5.17 |
178 |
| 0.8 wt% |
2.5 |
11.40 |
140 |
| 5 |
10.20 |
157 |
| 10 |
9.81 |
162 |
| 20 |
8.08 |
175 |
| 40 |
9.25 |
179 |
| 1.6 wt% |
2.5 |
15.77 |
150 |
| 5 |
16.17 |
158 |
| 10 |
15.58 |
166 |
| 20 |
15.87 |
174 |
| 40 |
15.80 |
182 |
Fig. 5 displays the curves of the crosslinking conversion rate α versus time t for EVA samples with different TBEC contents at different heating rates. The same S-shape appeared in all curves indicates a fast-crosslinking process during the initial stages and a slow crosslinking process in the later stages. As expected, the reaction rate of EVA/TBEC samples increase with increasing of the heating rate.
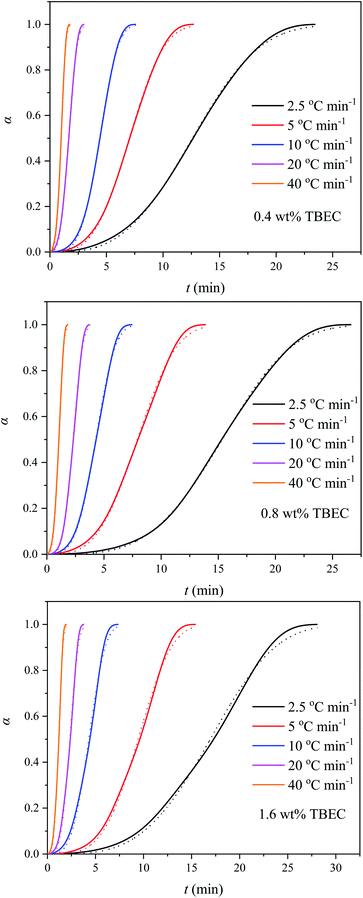 |
| | Fig. 5 Conversion rates of EVA samples with different TBEC contents at different heating rates. Dashed lines are fitted values by eqn (3). | |
3.2 Non-isothermal kinetics
The crosslinking process of EVA usually includes multiple reaction steps with different activation energies. The apparent kinetic parameters of EVA crosslinking can be obtained by fitting the experiments to the mathematical models. The kinetic parameters and activation energies of crosslinking process for the EVA/TBEC samples are investigated by using Avrami, Ozawa, Mo, and FWO methods, respectively.
3.2.1 Avrami method. The classical Avrami model was developed to study the kinetics of the isothermal phase change.35 The degree of the phase change is calculated according to eqn (3):where n is the Avrami exponent, the value of which depends on the type of nucleation and growth process of the crystallization process. t and Zt are crystallization time and crystallization rate constant, respectively.The double logarithmic form of eqn (3) is given by
| |
ln[−ln(1 − α)] = ln![[thin space (1/6-em)]](https://www.rsc.org/images/entities/char_2009.gif) Zt + n Zt + n![[thin space (1/6-em)]](https://www.rsc.org/images/entities/char_2009.gif) ln ln![[thin space (1/6-em)]](https://www.rsc.org/images/entities/char_2009.gif) t t
| (4) |
By analyzing the plot of ln[−ln(1 −
α)]
versus ln
![[thin space (1/6-em)]](https://www.rsc.org/images/entities/char_2009.gif) t
t, the Avrami exponent
n and the rate constant
Zt can be calculated with the slope and intercept obtained by linear fitting. Considering that the DSC analysis of the crosslinking process is under non-isothermal conditions, the modified rate constant
Zc is introduced by Jeziorny.
36 The corrected rate constant
Zc expression is given by
eqn (5)| |
 | (5) |
where
ϕ is the heating/cooling rate.
With the rate constant Zc, the reaction half-life time t1/2 can be calculated from eqn (6).
| |
 | (6) |
The curves of the crosslinking conversion α versus time t fitted with eqn (3) are shown in Fig. 5. The Avrami exponent n, rate constant Zc, half-life time t1/2, and correlation coefficient r obtained by curve fitting are listed in Table 3. These parameter values are different from those obtained by linear fitting with eqn (4) (Fig. S1 and Table S1 in the ESI†), which is due to the curve fitting process aims to minimize the level of error throughout the entire curve.37 In general, the fitted curves are in good agreement with experimental data. The Avrami exponent n is in the range of 3.11–3.97, indicating that the EVA/TBEC crosslinking process is independent of the TBEC content. The obtained n values are higher than those reported by Bianchi et al.,30 which is presumably due to the different VA content in the EVA samples. The reaction constant Zc increases with increasing of the heating rate. However, at the same heating rate, similar reaction constants are obtained with different TBEC contents, which suggests that the reaction constant Zc is independent of the TBEC content and is a function of the temperature. In addition, the reaction half-life time t1/2 decreases with increasing of the heating rate. The correlation coefficient r is in a range of 0.9989–0.9999, indicating that the Avrami model appropriately describes the crosslinking process of EVA/TBEC samples.
Table 3 Non-isothermal crosslinking kinetic parameters calculated from curve fitting procedures of Avrami method
| TBEC content |
ϕ (°C min−1 |
n |
Zc |
t1/2 (min |
r |
| 0.4 wt% |
2.5 |
3.11 |
0.04 |
2.57 |
0.9998 |
| 5 |
3.35 |
0.25 |
1.35 |
0.9998 |
| 10 |
3.89 |
0.54 |
1.07 |
0.9999 |
| 20 |
3.24 |
0.91 |
0.92 |
0.9997 |
| 40 |
3.43 |
0.99 |
0.90 |
0.9997 |
| 0.8 wt% |
2.5 |
3.66 |
0.02 |
2.81 |
0.9999 |
| 5 |
3.36 |
0.23 |
1.39 |
0.9995 |
| 10 |
3.63 |
0.57 |
1.06 |
0.9997 |
| 20 |
3.97 |
0.83 |
0.95 |
0.9997 |
| 40 |
3.38 |
0.99 |
0.90 |
0.9995 |
| 1.6 wt% |
2.5 |
3.60 |
0.01 |
2.92 |
0.9990 |
| 5 |
3.85 |
0.17 |
1.45 |
0.9991 |
| 10 |
3.64 |
0.57 |
1.06 |
0.9989 |
| 20 |
3.81 |
0.84 |
0.95 |
0.9989 |
| 40 |
3.69 |
0.98 |
0.91 |
0.9991 |
3.2.3 Mo method. Mo and co-workers established the relationship between the heating/cooling rate ϕ and time t at a certain degree of crystallinity by combining the Avrami method and the Ozawa method,39 which is expressed aswhere F(T) = (K(T)/Zt)1/m indicates the heating/cooling rate to reach the specified crystallinity within unit crystallization time, and a is the ratio of Avrami exponent n to Ozawa exponent m.Fig. 7 shows ln![[thin space (1/6-em)]](https://www.rsc.org/images/entities/char_2009.gif) ϕ versus ln
ϕ versus ln![[thin space (1/6-em)]](https://www.rsc.org/images/entities/char_2009.gif) t plots for different TBEC contents at different degrees of conversion. The fitted lines are also in good agreement with the experiments. The non-isothermal crosslinking kinetic parameters calculated by Mo method are summarized in Table 5. The parameter a is independent of the TBEC content and the heating rate, which remains almost unchanged as the conversion rate and the TBEC content increased. F(T) reflects the heating rate required per unit of reaction time.40 The value of F(T) increases with the conversion rate α, indicating that the crosslinking of the EVA/TBEC samples is hard to proceed at high conversion rate.
t plots for different TBEC contents at different degrees of conversion. The fitted lines are also in good agreement with the experiments. The non-isothermal crosslinking kinetic parameters calculated by Mo method are summarized in Table 5. The parameter a is independent of the TBEC content and the heating rate, which remains almost unchanged as the conversion rate and the TBEC content increased. F(T) reflects the heating rate required per unit of reaction time.40 The value of F(T) increases with the conversion rate α, indicating that the crosslinking of the EVA/TBEC samples is hard to proceed at high conversion rate.
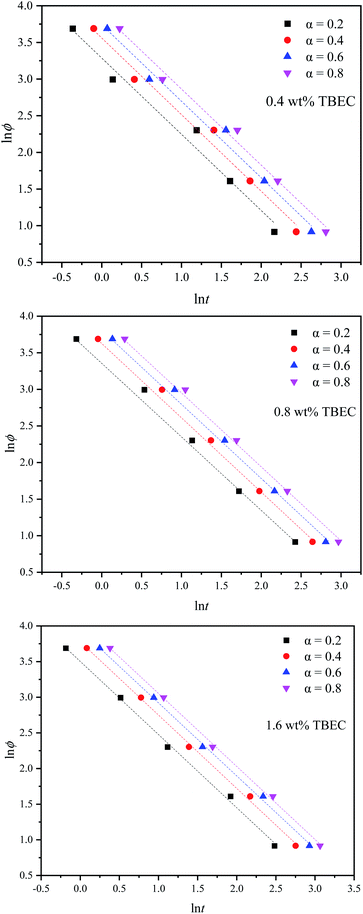 |
| | Fig. 7 Mo plots for EVA samples with different TBEC contents at various conversion rates. Dashed lines are fitted values by eqn (9). | |
Table 5 Non-isothermal crosslinking kinetic parameters calculated by Mo method
| TBEC content |
α |
a |
F(T) |
r |
| 0.4 wt% |
0.2 |
1.04 |
26.77 |
0.9895 |
| 0.4 |
1.05 |
35.19 |
0.9924 |
| 0.6 |
1.04 |
42.16 |
0.9941 |
| 0.8 |
1.04 |
49.52 |
0.9952 |
| 0.8 wt% |
0.2 |
1.03 |
31.13 |
0.9977 |
| 0.4 |
1.05 |
40.69 |
0.9986 |
| 0.6 |
1.05 |
48.82 |
0.9990 |
| 0.8 |
1.04 |
56.72 |
0.9993 |
| 1.6 wt% |
0.2 |
1.03 |
33.20 |
0.9988 |
| 0.4 |
1.03 |
43.72 |
0.9992 |
| 0.6 |
1.02 |
51.69 |
0.9994 |
| 0.8 |
1.02 |
58.97 |
0.9994 |
3.2.4 Activation energy analysis. The isoconversion method is a common method to obtain the local activation energy during the phase change, among which the integral isoconversion FWO method is widely used.41–46 The approximated FWO method proposed by Doyle47 is given as| |
 | (10) |
According to eqn (10), the slope is obtained by linear fitting of the plot lnϕ versus 1/T at a certain conversion rate α. Thus, the corresponding activation energy Ea is given by the slope of the fitted line at a certain conversion rate α. The FWO analysis plots at different TBEC contents are depicted in Fig. 8. The FWO fits are also in good agreement with the experiments from r values (Table S2 in the ESI†). The activation energy Ea versus conversion rate α plot is shown in Fig. 9.
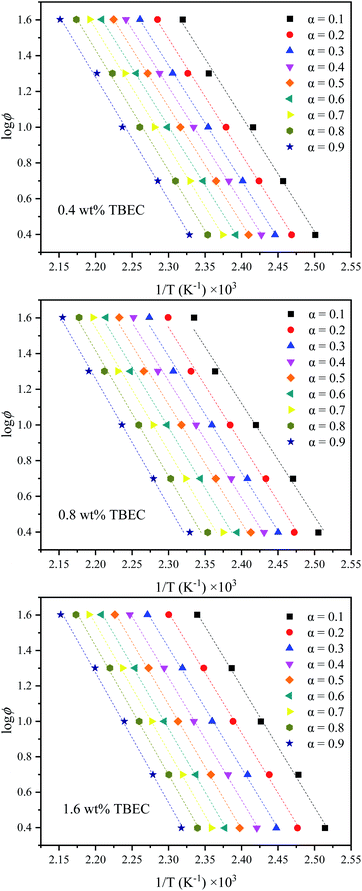 |
| | Fig. 8 FWO analysis at specific conversion rates α. Dashed lines are fitted values by eqn (10). | |
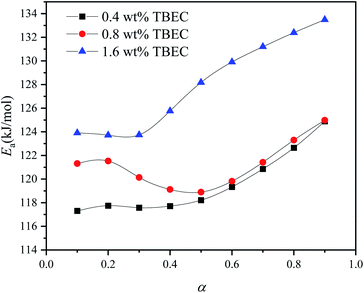 |
| | Fig. 9 Activation energies (Ea) calculated by FWO method for EVA samples with different TBEC content at various conversion rates α. | |
The activation energies Ea of EVA/TBEC crosslinking with different TBEC contents at various conversion rates (α) are in a range from 117 to 134 kJ mol−1. The activation energies of samples with TBEC content of 0.4 wt% and 1.6 wt% change irregularly when α is less than 0.3, while increases significantly with α increasing in the range from 0.3 to 1. For the sample with TBEC content of 0.8 wt%, the regular change of the activation energy occurs only when α is larger than 0.5. The reason for the irregular change is that the molecular chain can move freely in the insufficiently crosslinked EVA.25 However, the viscosity of the EVA/TBEC sample increases with the conversion rate α further increasing, which inhibits the macromolecular chain movement of EVA and prohibits further crosslinking. Thus, the energy barrier of crosslinking increases as the reaction proceeds. This also supports the analysis of the reason for the changes in K(T) and F(T) parameters as mentioned above.
4. Conclusions
In this work, the non-isothermal crosslinking process of different crosslinking agents is analyzed by DSC method. The crosslinking agent TBEC, which is more favorable for EVA anti-discoloration performance than BPO, shows a higher crosslinking rate and lower crosslinking temperature in the crosslinking process with comparison to DCP and DBPH. Then, the DSC data of EVA samples with different TBEC contents are analyzed at different heating rates. The peak temperature of EVA/TBEC sample is strongly dependent on the heating rate. The crosslinking rate increased with the heating rate.
The non-isothermal kinetics of the EVA/TBEC samples crosslinking process are investigated by using Avrami, Ozawa, Mo, and FWO methods, respectively. The Avrami exponent n is in a range of 3.11–3.97, indicating that the EVA/TBEC crosslinking process is independent of the TBEC content. The change of the Ozawa exponent m is presumably due to the increase in viscosity of EVA/TBEC samples during the crosslinking process. The heating/cooling function F(T) values and the activation energy Ea are dependent on the conversion rate α. In addition, Ea shows irregular changes in the early stage of crosslinking, while increase with increasing of the conversion rate α in the later stage of crosslinking.
Author contributions
Fanwei Zeng: conceptualization, design of experiment, investigation, writing; Xing Guo and Xuelian He: validation, characterization; Li Sun and Zhen Liu: review and editing; Zuoxiang Zeng: project administration, funding.
Conflicts of interest
There are no conflicts to declare.
Acknowledgements
We thank the National Natural Science Foundation of China (22108072; 22171084). The authors thank the financial support by Shanghai Pujiang Program (18PJ1402500), and the Open Project of State Key Laboratory of Chemical Engineering (SKL-ChE-18C01) at the East China University of Science and Technology.
References
- M. C. C. d. Oliveira, A. S. A. Diniz Cardoso, M. M. Viana and V. d. F. C. Lins, Renew. Sust. Energ. Rev., 2018, 81, 2299–2317 CrossRef.
- A. Sinha, O. S. Sastry and R. Gupta, Sol. Energy Mater. Sol. Cells, 2016, 155, 234–242 CrossRef CAS.
- B. Adothu, P. Bhatt, S. Chattopadhyay, S. Zele, J. Oderkerk, H. P. Sagar, F. R. Costa and S. Mallick, Sol. Energy, 2019, 194, 581–588 CrossRef CAS.
- A. Dadaniya and N. V. Datla, Sol. Energy Mater. Sol. Cells, 2019, 201, 110063 CrossRef CAS.
- M. A. Green, Prog. Photovolt: Res. Appl., 2005, 13, 447–455 CrossRef.
- M. D. Kempe, 2008 33rd IEEE Photovoltaic Specialists Conference, 2008, pp. 1–6, DOI:10.1109/PVSC.2008.4922771.
- M. D. Kempe, 2011 37th IEEE Photovoltaic Specialists Conference, 2011, pp. 000085–000090, DOI:10.1109/PVSC.2011.6185851.
- A. W. Czanderna and F. J. Pern, Sol. Energy Mater. Sol. Cells, 1996, 43, 101–181 CrossRef CAS.
- J. Schlothauer, S. Jungwirth, M. Koehl and B. Roeder, Sol. Energy Mater. Sol. Cells, 2012, 102, 75–85 CrossRef CAS.
- M. Gagliardi, P. Lenarda and M. Paggi, Sol. Energy Mater. Sol. Cells, 2017, 164, 93–106 CrossRef CAS.
- C. Abderafi, L. Remi and B. David, J. Photonics Energy, 2013, 3, 1–11 Search PubMed.
- A. El Amrani, A. Mahrane, F. Y. Moussa and Y. Boukennous, Int. J. Photoenergy, 2007, 2007, 1–5 CrossRef.
- S. S. Ghadikolaei, A. Omrani and M. Ehsani, Thermochim. Acta, 2017, 655, 87–93 CrossRef CAS.
- J. Jin, S. Chen and J. Zhang, Polym. Degrad. Stab., 2010, 95, 725–732 CrossRef CAS.
- B. Ottersböck, G. Oreski and G. Pinter, Polym. Degrad. Stab., 2017, 138, 182–191 CrossRef.
- G. Perrakis, A. C. Tasolamprou, G. Kenanakis, E. N. Economou, S. Tzortzakis and M. Kafesaki, OSA Continuum, 2020, 3, 1436–1444 CrossRef CAS.
- S. Jiang, K. Wang, H. Zhang, Y. Ding and Q. Yu, Macromol. React. Eng., 2015, 9, 522–529 CrossRef CAS.
- O. Bianchi, R. Fiorio, J. N. Martins, A. J. Zattera, C. H. Scuracchio and L. B. Canto, J. Elastomers Plast., 2009, 41, 175–189 CrossRef CAS.
- A. Thitithammawong, C. Nakason, K. Sahakaro and J. Noordermeer, Polym. Test., 2007, 26, 537–546 CrossRef CAS.
- I. Hudec, R. Sýkora and J. Kruželák, Rubber Chem. Technol., 2017, 90, 60–88 CrossRef.
- H. Y. Xue, W. H. Ruan, M. Q. Zhang and M. Z. Rong, Express Polym. Lett., 2014, 8, 116–122 CrossRef.
- J. Kruželák, A. Kvasničáková and I. Hudec, Ind. Eng. Chem. Res., 2020, 3, 120–128 Search PubMed.
- Y. T. Sung, C. K. Kum, H. S. Lee, J. S. Kim, H. G. Yoon and W. N. Kim, Polymer, 2005, 46, 11844–11848 CrossRef CAS.
- K. Thaworn, P. Buahom and S. Areerat, Polym. Chem., 2012, 02, 77–85 CrossRef CAS.
- C. P. Liu, W. F. Song, Q. X. Lu and M. F. Chen, Ind. Eng. Chem. Res., 2014, 53, 10080–10089 CrossRef CAS.
- R. Zhang and X. He, RSC Adv., 2015, 5, 130–135 RSC.
- X. Jin, X. Chen, Q. Cheng, N. Zhang, S. Cai and J. Ren, RSC Adv., 2017, 7, 46014–46021 RSC.
- A. Dołęga and P. M. Zieliński, J Non Cryst Solids, 2022, 575, 121198 CrossRef.
- X. Zhao, T. Wang, S. Hong, D. Sun, N. Wang, G. Chae and Y. Qi, RSC Adv., 2019, 9, 35280–35288 RSC.
- O. Bianchi, R. V. B. Oliveira, R. Fiorio, J. D. N. Martins, A. J. Zattera and L. B. Canto, Polym. Test., 2008, 27, 722–729 CrossRef CAS.
- M. Á. Vargas-Hernández, B. Sulbarán-Rangel and H. Vázquez-Torres, Thermochim. Acta, 2020, 684, 178485 CrossRef.
- S. Kumar, S. K. Samal, S. Mohanty and S. K. Nayak, J. Therm. Anal. Calorim., 2019, 137, 1567–1578 CrossRef CAS.
- L. Wang, F. Zhang, Y. Bai and L. Ding, Thermochim. Acta, 2016, 645, 43–49 CrossRef CAS.
- A. J. Zattera, O. Bianchi, R. V. B. Oliveira, L. B. Canto, C. A. Ferreira and M. Zeni, Prog. Rubber Plast. Recycl. Technol., 2006, 22, 69–87 CrossRef CAS.
- M. Avrami, J. Chem. Phys., 1940, 8, 212–224 CrossRef CAS.
- A. Jeziorny, Polymer, 1978, 19, 1142–1144 CrossRef CAS.
- C. A. Kelly and M. J. Jenkins, Polym J, 2022, 54, 249–257 CrossRef CAS.
- T. Ozawa, Polymer, 1971, 12, 150–158 CrossRef CAS.
- T. Liu, Z. Mo, S. Wang and H. Zhang, Polym. Eng. Sci., 1997, 37, 568–575 CrossRef CAS.
- C. Jiao, Z. Wang, X. Liang and Y. Hu, Polym. Test., 2005, 24, 71–80 CrossRef CAS.
- M. Wang and L. Chen, J. Cryst. Growth, 2021, 565, 126159 CrossRef CAS.
- J. C. Domínguez, J. C. Grivel and B. Madsen, Thermochim. Acta, 2012, 529, 29–35 CrossRef.
- W. Bessa, D. Trache, M. Derradji and A. F. Tarchoun, ChemistrySelect, 2020, 5, 5374–5386 CrossRef CAS.
- J. Li, J. Huang and R. Yin, RSC Adv., 2019, 9, 27305–27317 RSC.
- X. Xiong, X. Guo, R. Ren, L. Zhou and P. Chen, Polym. Test., 2019, 77, 105917 CrossRef.
- W. Wu, C. Wan, S. Wang and Y. Zhang, RSC Adv., 2013, 3, 26166–26176 RSC.
- C. D. Doyle, J. Appl. Polym. Sci., 1962, 6, 639–642 CrossRef CAS.
|
| This journal is © The Royal Society of Chemistry 2022 |
Click here to see how this site uses Cookies. View our privacy policy here.  Open Access Article
 ,
Zuoxiang Zeng
 and
Zhen Liu
 *
*
![[thin space (1/6-em)]](https://www.rsc.org/images/entities/char_2009.gif) 000 g mol−1, and the dispersibility index (Mw/Mn) is 2.09.
000 g mol−1, and the dispersibility index (Mw/Mn) is 2.09.


![[thin space (1/6-em)]](https://www.rsc.org/images/entities/char_2009.gif) Zt + n
Zt + n![[thin space (1/6-em)]](https://www.rsc.org/images/entities/char_2009.gif) ln
ln![[thin space (1/6-em)]](https://www.rsc.org/images/entities/char_2009.gif) t
t
![[thin space (1/6-em)]](https://www.rsc.org/images/entities/char_2009.gif) t, the Avrami exponent n and the rate constant Zt can be calculated with the slope and intercept obtained by linear fitting. Considering that the DSC analysis of the crosslinking process is under non-isothermal conditions, the modified rate constant Zc is introduced by Jeziorny.36 The corrected rate constant Zc expression is given by eqn (5)
t, the Avrami exponent n and the rate constant Zt can be calculated with the slope and intercept obtained by linear fitting. Considering that the DSC analysis of the crosslinking process is under non-isothermal conditions, the modified rate constant Zc is introduced by Jeziorny.36 The corrected rate constant Zc expression is given by eqn (5)

![[thin space (1/6-em)]](https://www.rsc.org/images/entities/char_2009.gif) K(T) − m
K(T) − m![[thin space (1/6-em)]](https://www.rsc.org/images/entities/char_2009.gif) ln
ln![[thin space (1/6-em)]](https://www.rsc.org/images/entities/char_2009.gif) ϕ
ϕ
![[thin space (1/6-em)]](https://www.rsc.org/images/entities/char_2009.gif) ϕ for different TBEC contents at temperature ranging from 145 to 165 °C. Table 4 lists the Ozawa exponent m, the heating response function K(T), and the correlation coefficient r calculated from the Ozawa curves fitted at different temperatures. The Ozawa model also shows a good correlation to the experimental data.
ϕ for different TBEC contents at temperature ranging from 145 to 165 °C. Table 4 lists the Ozawa exponent m, the heating response function K(T), and the correlation coefficient r calculated from the Ozawa curves fitted at different temperatures. The Ozawa model also shows a good correlation to the experimental data.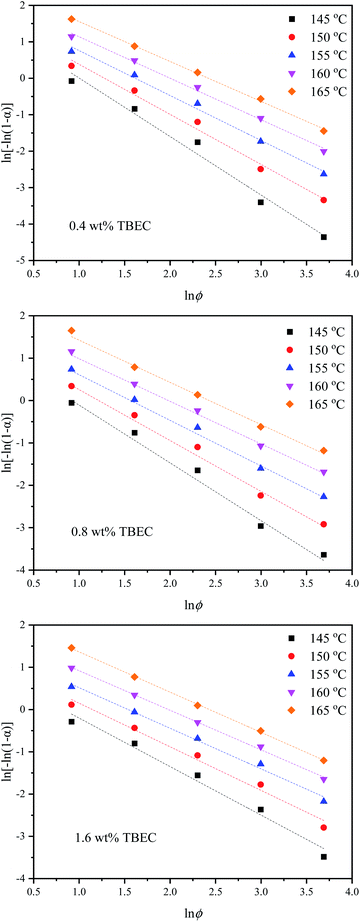
![[thin space (1/6-em)]](https://www.rsc.org/images/entities/char_2009.gif) ϕ = ln
ϕ = ln![[thin space (1/6-em)]](https://www.rsc.org/images/entities/char_2009.gif) F(T) − a
F(T) − a![[thin space (1/6-em)]](https://www.rsc.org/images/entities/char_2009.gif) ln
ln![[thin space (1/6-em)]](https://www.rsc.org/images/entities/char_2009.gif) t
t
![[thin space (1/6-em)]](https://www.rsc.org/images/entities/char_2009.gif) ϕ versus ln
ϕ versus ln![[thin space (1/6-em)]](https://www.rsc.org/images/entities/char_2009.gif) t plots for different TBEC contents at different degrees of conversion. The fitted lines are also in good agreement with the experiments. The non-isothermal crosslinking kinetic parameters calculated by Mo method are summarized in Table 5. The parameter a is independent of the TBEC content and the heating rate, which remains almost unchanged as the conversion rate and the TBEC content increased. F(T) reflects the heating rate required per unit of reaction time.40 The value of F(T) increases with the conversion rate α, indicating that the crosslinking of the EVA/TBEC samples is hard to proceed at high conversion rate.
t plots for different TBEC contents at different degrees of conversion. The fitted lines are also in good agreement with the experiments. The non-isothermal crosslinking kinetic parameters calculated by Mo method are summarized in Table 5. The parameter a is independent of the TBEC content and the heating rate, which remains almost unchanged as the conversion rate and the TBEC content increased. F(T) reflects the heating rate required per unit of reaction time.40 The value of F(T) increases with the conversion rate α, indicating that the crosslinking of the EVA/TBEC samples is hard to proceed at high conversion rate.


