 Open Access Article
Solid state molybdenum carbide nanomotors driven via high temperature carbon-decomposition catalytic reactions†
Tomoya Egoshi,
Naoki Uemura and
Tokushi Kizuka *
*
Department of Materials Science, Faculty of Pure and Applied Sciences, University of Tsukuba, 1-1-1, Tennoudai, Tsukuba, Ibaraki 305-8573, Japan. E-mail: kizuka@ims.tsukuba.ac.jp
First published on 3rd May 2022
Abstract
The motion of solid state nanomotors, i.e., molybdenum carbide nanoparticles, which were driven via carbon-decomposition catalytic reactions at ∼2900 K, was directly observed by in situ transmission electron microscopy. The nanomotors exhibited unidirectional linear motions inside the hollow space of multiwall carbon nanotubes, reciprocating motions around the nanotube endcaps, and rotational motions in the hollow spaces of carbon nanocapsules. The inner atomic wall-layers of carbon nanotubes and nanocapsules were consumed during the nanomotor motions.
Introduction
The transportation vehicles of the nanometer-sized materials, i.e., nanomotors, are the state-of-the-art technologies contributing to the development of various fine functional and mechanical devices applicable to nanoscale construction, energy storage, archival nanomemories, and drug delivery, and the power sources of nanomachines.1–9 The developed nanomotors are nanoparticles and nanorods of gold (Au), iridium, iron (Fe), Fe carbide, liquid gallium, and Au–ruthenium bimetals.5–14 Such nanomotors are driven by the application of electric voltages, light, magnetic fields, and ultrasound.5,6,12–21 In particular, nanomotors using the guide rails of inner hollow spaces of carbon nanotubes (CNTs) realize high-precision one dimensional motion.7 The motion process of a nanomotor in a CNT via electric voltage application was observed, and it has been discussed whether the driving force is a thermal gradient due to Joule-heating or an electron wind force.12In the present study, the high temperature dynamics of a molybdenum (Mo) plate and the aggregates of multiwall CNTs and carbon nanocapsules (CNCs) during laser irradiation were in situ observed inside a transmission electron microscope (TEM). Due to the laser heating, Mo carbide (MoC) nanoparticles were formed inside the hollow spaces of CNTs and CNCs. The variation in morphologies and the motion of the nanoparticles was investigated.
Results
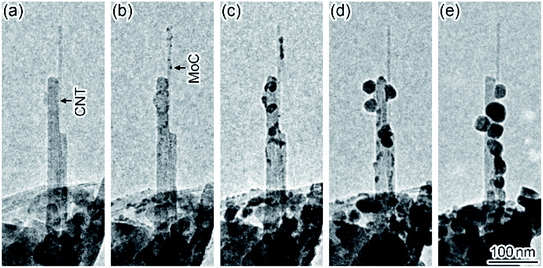
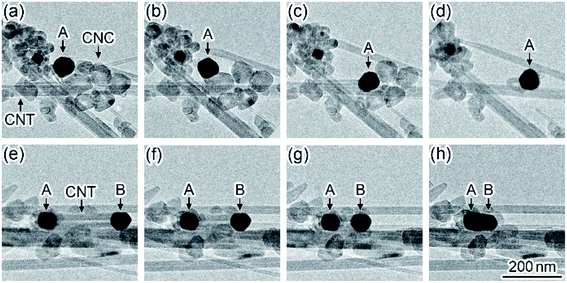
Fig. 1 shows a time series of TEM images observed in the formation dynamics of nanoparticles on CNTs during in situ laser irradiation (see Movie S1, ESI†). First, the CNTs were observed on the micrometer-sized perforated carbon-coated film supported by a Mo holey plate before the laser irradiation (Fig. 1(a)). When the laser irradiation density was increased from zero to 5 × 10⁷ W m−2, nanoparticles with a diameter of approximately 5 nm were formed on the CNTs (Fig. 1(b)). These nanoparticles were identified to be Mo carbide (MoC) having a sodium chloride structure with a lattice constant of 0.427 nm.22 Thus, Mo atoms evaporated from the Mo plate and were deposited on the CNTs during the laser heating, followed by the carbonization at a high temperature. When the irradiation density was increased to 6 × 10⁷ W m−2, these nanoparticles grew and coalesced; their particle size was increased to 30 nm (Fig. 1(c)–(e)). After subsequent laser irradiation, it was observed that the CNTs broke due to the carbonization in another region (Fig. S1, ESI†).Fig. 2 shows a time series of TEM images observed in the motion of MoC nanoparticles in an aggregate of CNTs and CNCs during in situ laser irradiation (see Movie S2, ESI†). When the irradiation density was increased to 2 × 10⁷ W m−2, a MoC nanoparticle with a diameter of 70 nm moved ((A) in Fig. 2(a)), resulting in the contact with several CNCs and their consumption (Fig. 2(b)–(d)). As the irradiation continued, nanoparticle (A) moved to the neighboring region and was brought into contact with the left-side tip of a CNT (Fig. 2(e)). Subsequently, another MoC nanoparticle was attached in the right-side tip of this CNT ((B) in Fig. 2). Thus, the CNT was sandwiched by nanoparticles (A) and (B). Then, the CNT was consumed by nanoparticles (A) and (B) during their approach process (Fig. 2(f) and (g)). Finally, the CNT disappeared so that the distance between these nanoparticles became zero; the nanoparticles coalesced (Fig. 2(h)). The motion speed of nanoparticle (B) in Fig. 2(e)–(h) was 28 nm s−1, corresponding to the consumption speed of the CNT. In this process, the size of each nanoparticle was maintained until the nanoparticles coalesced each other when the MoC nanoparticles consumed CNCs and CNTs. Thus, MoC nanoparticles are found to be catalysts that decompose CNCs and CNTs at high temperatures. The electron diffraction patterns of the moving nanoparticles during the laser heating showed a symmetrical speckled pattern corresponding to the crystalline MoC. Thus, the nanoparticles during the catalytic reaction were solid.
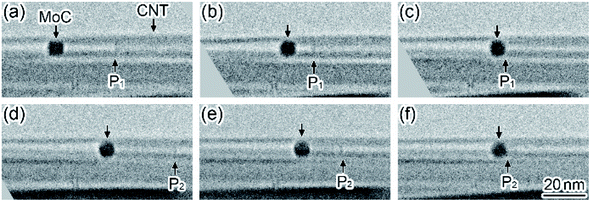
Fig. 3 shows a time series of TEM images observed in the motion of a MoC nanoparticle encapsulated in the hollow space of a CNT during in situ laser irradiation (see Movie S3, ESI†). When the irradiation density was increased to 2 × 10⁸ W m−2, the nanoparticle with a diameter of 8 nm encapsulated in the CNT moved to the right and was brought into contact with the left-side tip of the innermost atomic wall-layer (P1 in Fig. 3(a)–(c)). The motion speed of the nanoparticle in Fig. 3(a)–(c) was 1.5 nm s−1. Then, the nanoparticle stopped, and the right-side tip of the same innermost layer (P2 in Fig. 3(d)) moved to the left; the innermost atomic layer was consumed while the innermost layer was attracted. In this process, the shape change of this nanoparticle was not observed. This implies that the innermost atomic wall-layer was consumed by the catalytic reaction of the nanoparticle (Fig. 3(d) and (e)). The motion speed of the right-side tip of the innermost atomic layer (P2 in Fig. 3(d) and (e)), i.e., the consumption speed of the innermost wall-layer, was 1.3 nm s−1. Finally, the innermost atomic wall-layer disappeared (Fig. 3(f)). Thus, this catalytic reaction was similar to the process presented in Fig. 2.
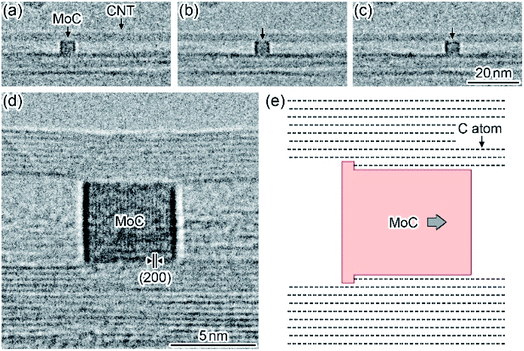
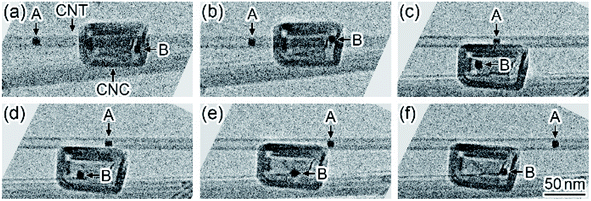
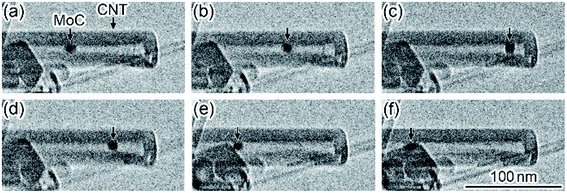
Fig. 4(a–c) shows a time series of TEM images observed in the motion of a MoC nanoparticle encapsulated in a CNT during in situ laser irradiation. In this case, the innermost atomic wall-layer was fixed (see Movie S4, ESI†). When the irradiation density was increased to 1 × 10⁷ W m−2, the MoC nanoparticle with a diameter of 5 nm, which encapsulated in the CNT, moved inside the hollow space along the longitudinal direction of the CNT. The motion speed of the nanoparticle was 0.35 nm s−1. Fig. 4(d) shows a lattice image of the nanoparticle after the laser irradiation was stopped. The (200) lattice fringes with an interplanar spacing of 0.21 nm were observed on the nanoparticle.22 The number of the CNT atomic wall-layers is eight on the left-side of the nanoparticle, whereas it is nine on the right-side. Thus, the innermost atomic wall-layer was consumed via the motion of the nanoparticle, similar to the process presented in Fig. 3. When a MoC nanoparticle encapsulated in a CNT was brought into contact with some inner atomic wall-layers, the number of the consumed wall-layers during a single nanoparticle motion was increased to six at most, as shown in Fig. 5 (see Movie S5, ESI†). The reciprocating motions of MoC nanoparticles encapsulated in CNTs were observed around the closed end caps of CNTs, as shown in Fig. 6 (see Movie S6, ESI†). During the reciprocating motion, the CNT atomic wall-layers were also consumed. When MoC nanoparticles were encapsulated in CNCs, the nanoparticles moved along the inner surfaces of the hollow spaces in the CNCs. Thus, such nanoparticles showed rotational motions around the center of the CNCs (Fig. 5). In this process, the innermost atomic wall-layers were also sequentially consumed so that the inner hollow spaces expanded after the rotational motions.
Discussion
The observation temperature during the laser irradiation
The MoC nanoparticles were formed on the CNTs and CNCs during the laser irradiation (Fig. 1). This implies that the Mo plate supporting the CNTs was evaporated. Thus, the Mo plate was heated at least at higher than the melting point of Mo (2900 K).23 The reactions of CNTs and MoC nanoparticles were observed at such high temperatures.Carbon-decomposition catalytic reactions and their application
The MoC nanoparticles moved during the laser irradiation, resulting in the contact with neighboring CNTs and CNCs, followed by their consumption while the state of each nanoparticle was maintained (Fig. 2). During subsequent laser irradiation, it was also observed that such CNTs decorated with the MoC nanoparticles exhibited necking and subsequent fracture (Fig. S1, ESI†). This also implied that the MoC nanoparticles consumed the CNTs. According to the scanning electron microscopy observation by Matthews et al., after Mo particles were heated on a graphite surface at 2800 K and subsequently cooled at an ambient temperature, the consumption traces were observed on the graphite surface and the trace width was the same as the particle width.24 They explained from this morphology observation that the Mo particles reacted with the graphite at the high temperature and transformed to Mo2C particles after cooling; carbon was consumed during the motion of the particles. Feng et al. observed that CNTs grew from Fe nanoparticles during heating in an acetylene atmosphere in a TEM.25 In this process, when the acetylene atmosphere was exhausted, the grown CNTs were consumed by the Fe nanoparticles. They interpreted this phenomenon from thermogravimetric analysis and mass spectroscopy that the consumption was attributed to the reaction between the carbon atoms in the CNTs and water molecules in the TEM sample chamber evacuated to 10−1 Pa; the formation of carbon monoxide (CO) molecules. Furthermore, they reported that when CNTs encapsulated the Fe nanoparticles, such CNTs were not consumed because the Fe nanoparticles were not exposed to water molecules. Yoshida et al. observed that CNTs attached to noble metal nanoparticles were consumed during heating in two different atmospheres, i.e., an oxygen atmosphere of 2 Pa or hydrogen of 10−1 Pa in a TEM.26,27 They explained that the CNTs combusted or hydrogenated to form CO2 and CH4. Yamada et al. reported that when catalysts are encapsulated in carbon atom wall-layers, they become deactivated for the catalytic reaction of CNTs growth.28 In the observation of this gasification process, these catalytic nanoparticles revealed liquid-like behavior under their melting points. In the present study, the innermost atomic wall-layers of CNTs were consumed by the encapsulated solid-state MoC nanoparticles during the particle motion in the CNT hollow spaces under the laser irradiation (Fig. 4(a)–(c)). In the TEM sample chamber used in this study, water, oxygen, and hydrogen molecules are included in the vacuum.29 Therefore, it is inferred that a part of the CNTs and CNCs contacting the MoC catalytic nanoparticles reacted with theses residual molecules at the observation temperatures higher than 2900 K, resulting in their consumption via the formation of CO, CO2, and CH4. Since the reaction occurred the high temperatures in the high vacuum, it is also likely that a certain ratio of atomically decomposed carbon released in isolated atom forms.30 Therefore, it is inferred that the MoC nanoparticles are functionalized as catalysts that decompose CNCs and CNTs at the high temperatures. Murray et al. reported that carbon layers deposited on electrodes obstruct power generation of fuel cells.31 The carbon atomic decomposition catalytic reaction observed in the present study can be applicable to the decomposition of such carbon layers.The layer position and number control of carbon atomic layered material structures by the present catalytic reactions
The motion of MoC nanoparticles resulted in the consumption of the innermost atomic wall-layer of CNTs while the other wall-layers were unchanged (Fig. 3(d)–(f)). Similar consumption of the innermost atomic wall-layer was observed in a TEM during Joule heating of a CNT connected to a Mo electrode.32 The MoC nanoparticle catalysts in the present study are applicable to the control of the position and number of the atomic wall-layers of CNTs.The application of catalytic nanoparticles to nanomotors
The MoC nanoparticles encapsulated in CNTs and CNCs moved with a speed of 0.35–38 nm s−1 while the size of each nanoparticle was constant (Fig. 3(a)–(c), 4(a)–(c), 5 and 6). Zhao et al. observed a motion of a Fe nanoparticle encapsulated in a CNT via electric voltage application in a TEM.12 They explained that the nanoparticle moved by a temperature gradient-induced force. In the present study, the nanoparticle encapsulated in the CNC showed rotational motion along the inner surface of the hollow space (Fig. 5). There was no effective temperature gradient in the small region in the CNC having an outer diameter of 70 nm. In addition, the MoC nanoparticle encapsulated in the CNT showed reciprocating motion around the closed end cap of the CNT (Fig. 6). It is considered that there is no effective change in the temperature gradient near the closed end cap with the size of 20 nm. Thus, the driving force of the particle motion observed in the present study is not inferred to be temperature gradient-induced forces. The driving force of the present particle motion is considered as follows. The MoC nanoparticles are always in contact with the CNTs and CNCs and moved with their contact interfaces. The contact interfaces move via the consumption of the carbon atoms during the high-temperature catalytic reactions. In addition, the direction of the interface motion corresponds to that of the catalytic reactions. Thus, the nanoparticles moved by the interface bonding strength. This interface bonding forces act as the driving force of the nanoparticle motions. Certain amounts of gaseous molecules produced via reactions with decomposed carbon atoms, e.g., CO, CO2, and CH4, and isolated carbon atoms are inferred to be also released. Hence, the emission of such released gaseous molecules and carbon atoms may also act as the driving force of the nanoparticle motions.The observed MoC nanoparticles encapsulated in CNTs and CNCs are nanometer-sized motors driven at high temperatures, which exhibit linear motions, reciprocating motions, and rotational motions. These nanomotors are applicable to nanometer-sized archival memories, which control the position of a MoC nanoparticle at high temperatures.3,6 If CNTs contain insoluble materials in their hollow spaces, the nanomotors can be used for the transportation of the materials.33,34
Conclusions
We directly observed the motion of solid-state MoC nanoparticles in the aggregates of CNTs and in the hollow spaces in CNTs, while carbon-decomposition catalytic reactions. The in situ observation exhibited that the MoC nanoparticles encapsulated in CNTs moved along with one dimensional guide rails of inner hollow spaces. Thus, the nanoparticles were functionalized as nanomotors driven via carbon-decomposition catalytic reactions. It is also noted that the carbon atomic layered material structures can be controlled every layer via the nanomotor motions. The MoC nanomotors, carbon-decomposition catalytic reaction, and the layer-number control of carbon atomic layered material structures observed in the present study open new ways of carbon material technologies.Methods
Multiwall CNTs and CNCs (ULVAC) were dispersed in ethanol. This dispersion liquid was dropped on micrometer-sized perforated carbon-coated cellulose films supported by Mo holey plates. The samples were observed using a 200 kV acceleration type high-resolution transmission electron microscope (JEOL, JEM-2011) equipped with a laser irradiation system.35 The laser wavelength was 1064 nm, and the convergent diameter of the laser beam on the samples was 52 μm. The irradiation density was estimated nominally by dividing of the laser power output by the convergent irradiation area. The structural variation in the samples during laser irradiation heating was in situ observed. The observed TEM images were recorded in the form of videos using a charge-coupled device camera. The pressure in the sample chamber was 10−5 Pa during the in situ observation.Conflicts of interest
The authors declare no competing financial interests.Acknowledgements
The present authors acknowledge the members of their laboratory for cooperation with a part of the experiment. This study was partially supported by JSPS KAKENHI Grant Number 21K18683.References
- K. Svensson, H. Olin and E. Olsson, Phys. Rev. Lett., 2004, 93, 145901 CrossRef CAS PubMed.
- L. Dong, X. Tao, L. Zhang, X. Zhang and B. J. Nelson, Nano Lett., 2007, 7, 58–63 CrossRef CAS PubMed.
- B. Sharma, A. Sengupta and C. K. Sarkar, Comput. Mater. Sci., 2018, 146, 112–118 CrossRef CAS.
- S. Sharma, M. S. Rosmi, Y. Yaakob, M. Z. M. Yusop, G. Kalita, M. Kitazawa and M. Tanemura, Carbon, 2018, 132, 165–171 CrossRef CAS.
- M. Liu, T. Zentgraf, Y. Liu, G. Bartal and X. Zhang, Nat. Nanotechnol., 2010, 5, 570–573 CrossRef CAS PubMed.
- G. E. Begtrup, W. Gannett, T. D. Yuzvinsky, V. H. Crespi and A. Zettl, Nano Lett., 2009, 9, 1835–1838 CrossRef CAS PubMed.
- B. C. Regan, S. Aloni, R. O. Ritchie, U. Dahmen and A. Zettl, Nature, 2004, 428, 924–927 CrossRef CAS PubMed.
- R. Eelkema, M. M. Pollard, J. Vicario, N. Katsonis, B. S. Ramon, C. W. M. Bastiaansen, D. J. Broer and B. L. Feringa, Nature, 2006, 440, 163 CrossRef CAS PubMed.
- Y. Y. Tanaka, P. Albella, M. Rahmani, V. Giannini, S. A. Maier and T. Shimura, Sci. Adv., 2020, 6, eabc3726 CrossRef CAS PubMed.
- T. Kamino, T. Yaguchi, M. Konno and T. Hashimoto, J. Electron Microsc., 2005, 54, 461–465 CAS.
- P. A. E. Schoen, J. H. Walther, S. Arcidiacono, D. Poulikakos and P. Koumoutsakos, Nano Lett., 2006, 6, 1910–1917 CrossRef CAS PubMed.
- J. Zhao, J. Huang, F. Wei and J. Zhu, Nano Lett., 2010, 10, 4309–4315 CrossRef CAS PubMed.
- W. Wang, L. A. Castro, M. Hoyos and T. E. Mallouk, ACS Nano, 2012, 6, 6122–6132 CrossRef CAS PubMed.
- D. Wang, C. Gao, W. Wang, M. Sun, B. Guo, H. Xie and Q. He, ACS Nano, 2018, 12, 10212–10220 CrossRef CAS PubMed.
- J. W. Kang, K. O. Song, O. K. Kwon and H. J. Hwang, Nanotechnology, 2005, 16, 2670–2676 CrossRef CAS.
- L. Sun, F. Banhart, A. V. Krasheninnikov, J. A. Rodríguez-Manzo, M. Terrones and P. M. Ajayan, Science, 2006, 312, 1199–1202 CrossRef CAS PubMed.
- A. Barreiro, R. Rurali, E. R. Hernández, J. Moser, T. Pichler, L. Forró and A. Bachtold, Science, 2008, 320, 775–778 CrossRef CAS PubMed.
- K. E. Peyer, L. Zhang and B. J. Nelson, Nanoscale, 2013, 5, 1259–1272 RSC.
- F. Wong and A. Sen, ACS Nano, 2016, 10, 7172–7179 CrossRef CAS PubMed.
- Q. Wang, R. Dong, Q. Yang, J. Wang, S. Xu and Y. Cai, Nanoscale Horiz., 2020, 5, 325–330 RSC.
- W. Liu, X. Chen, X. Ding, Q. Long, X. Lu, Q. Wang and Z. Gu, Nanoscale Horiz., 2021, 6, 238–244 RSC.
- E. V. Clougherty, K. H. Lothrop and J. A. Kafalas, Nature, 1961, 191, 1194 CrossRef CAS.
- A. G. Worthing, Phys. Rev., 1925, 25, 846–857 CrossRef CAS.
- R. B. Matthews and G. M. Jenkins, J. Mater. Sci., 1975, 10, 1976–1990 CrossRef CAS.
- X. Feng, S. W. Chee, R. Sharma, K. Liu, X. Xie, Q. Li, S. Fan and K. Jiang, Nano Res., 2011, 4, 767 CrossRef CAS.
- K. Yoshida, S. Arai, Y. Sasaki and N. Tanaka, Micron, 2015, 76, 19–22 CrossRef CAS PubMed.
- K. Yoshida, S. Arai, Y. Sasaki and N. Tanaka, Microscopy, 2016, 65, 309–315 CrossRef CAS PubMed.
- T. Yamada, A. Maigne, M. Yudasaka, K. Mizuno, D. N. Futaba, M. Yumura, S. Iijima and K. Hata, Nano Lett., 2008, 8, 4288–4292 CrossRef CAS PubMed.
- P. Z. Sun, Q. Yang, W. J. Kuang, Y. V. Stebunov, W. Q. Xiong, J. Yu, R. R. Nair, M. I. Katsnelson, S. J. Yuan, I. V. Grigorieva, M. Lozada-Hidalgo, F. C. Wang and A. K. Geim, Nature, 2020, 579, 229–232 CrossRef CAS PubMed.
- T. A. Friedmann, K. F. McCarty, J. C. Barbour, M. P. Siegal and D. C. Dibble, Appl. Phys. Lett., 1996, 66, 1643 CrossRef.
- E. P. Murray, T. Tsai and S. A. Barnett, Nature, 1999, 400, 649–651 CrossRef CAS.
- Y. Shinomiya, K. Asaka, H. Nakahara and Y. Saito, Surf. Interface Anal., 2016, 48, 1206–1209 CrossRef CAS.
- H. Somada, K. Hirahara, S. Akita and Y. Nakayama, Nano Lett., 2009, 9, 62–65 CrossRef CAS PubMed.
- N. W. S. Kam, M. O'Connell, J. A. Wisdom and H. Dai, Proc. Natl. Acad. Sci. U. S. A., 2005, 102, 11600–11605 CrossRef CAS PubMed.
- N. Uemura, T. Egoshi, K. Murakami and T. Kizuka, Micron, 2022, 157, 103244 CrossRef PubMed.
Footnote |
| † Electronic supplementary information (ESI) available. See https://doi.org/10.1039/d2ra01846b |
| This journal is © The Royal Society of Chemistry 2022 |

