 Open Access Article
Effect of the organic sulfur source on the photocatalytic activity of CdS†
Qiong Zhua,
Jinhua Wanga,
Si Chena,
Hongquan Fua,
Juan Zhanga,
Hejun Gao *ab and
Yunwen Liao*a
aCollege of Chemistry and Chemical Engineering, Chemical Synthesis and Pollution Control Key Laboratory of Sichuan Province, China West Normal University, Nanchong, Sichuan 637000, China. E-mail: hejun_gao@126.com; liao-yw@163.com
bInstitute of Applied Chemistry, China West Normal University, Nanchong 637000, China
First published on 11th April 2022
Abstract
By controlling the species of the organic sulfur source, CdS samples were produced with different photocatalytic performances by a low-temperature solvothermal method. Different species of the organic sulfur source were chosen as the coordination agent to control the interactions in the crystal growth process. Among them, thioacetamide was the best coordination agent. The hydrophobic chain could be good for reducing the resistance of charge transfer, and increasing the rate of surface charge transfer and the lifetime of the photoexcited electrons. Benefiting from the hydrophobic chain, CdS shows an excellent photocatalytic hydrogen evolution rate of 943.54 μmol h−1 g−1 and a rhodamine B photocatalytic degradation rate of 99.1% in 60 min, which is superior to the photocatalysis of pure CdS prepared by many other methods.
1 Introduction
With the development of society and industrial progress, serious problems, such as energy shortage and environmental pollution, have become the major problems besetting mankind.1 The green technology of photocatalysis provides an essential pathway for solving the problems of energy shortage and environmental pollution.2 Semiconductor photocatalysts have a good photocatalytic activity for reducing the water to hydrogen (H2).3,4 Photocatalytic semiconductors could effectively convert organic pollutants to inorganic compounds, such as carbon dioxide and water, too.5,6 The existing amount of photocatalytic semiconductors is numerous and the performance of a photocatalyst varies greatly with the preparation method.7,8 Therefore, it is important to explore the influence regularity of the preparation of photocatalysts with excellent photocatalytic activity.In recent years, CdS, as a non-precious metal photocatalyst, has received extensive attention due to its suitable bandgap (∼2.4 eV), absorption of visible light, band-edge position for photocatalytic hydrogen degradation and hydrogen evolution.9,10 However, the rapid recombination rate of hotpogenerated electrons and holes and low electric conductivity and many defects are present in the current preparation of CdS.11–13 It leads to an unstable photocatalytic performance in practical application. In order to overcome these shortcomings, many strategies have been proposed, such as element doping (Ni, Co, and P),14–16 construction of heterogeneous structures (CuO, CeO2, and ZnO),17–21 etc. Shangguan et al.22 reported that the Bi-metal-doped CdS photocatalyst has a higher photocatalytic efficiency, which could be ascribed to the enhanced light absorption ability and charge separation after Ni and Mo were introduced. Lu et al.23 reported a novel 0D/1D direct Z-scheme heterojunction photocatalyst synthesized by in situ anchoring W18O49 QDs onto the surface of CdS NRs. Both bulk photogenerated carriers and surface photogenerated carriers are separated efficiently, achieving a dramatically improved photocatalytic H2 evolution performance. Xu et al.24 reported that superoxide radicals and holes worked together for the ciprofloxacin degradation by the direct Z-scheme Bi3TaO7–CdS semiconductor materials. Although element doping and constructing heterojunction could enhance the photocatalytic activity of CdS, the preparation of these complex photocatalysts is complex and the photocatalytic efficiency of the photocatalyst is also difficult to maintain. Therefore, the study of pure CdS in photocatalytic systems cannot be ignored. However, pure CdS often has very low photocatalytic performance, so it will be of great use to optimize its performance. F. Vaquero et al.25 prepared pure CdS with different morphologies by changing the thermal solvent, and the highest hydrogen production performance reached 502 μmol g−1 h−1. At the same time, they also adjusted the crystallinity of pure CdS by changing the reaction temperature. The hydrogen production performance of CdS with high crystallinity was significantly improved, up to 500 μmol g−1 h−1.26 Bie et al.8 improved the photocatalytic activity of CdS by adjusting the thickness, up to 2155 μmol g−1 h−1. Therefore, it is significant to improve the photocatalytic activity of pure CdS and optimize its preparation process.
Types of sulfur source of CdS are numerous. It includes organic and inorganic compounds. For inorganic sulfur sources, Sun et al.27 reported that CdS hollow microspheres could be prepared by a photochemical preparation technology using Na2S2O3 as a sulphur source. Maimaiti et al.28 prepared CdS by the precipitation reaction using a sulphur source of Na2S. Organic sulfur sources are more applied in CdS preparation than inorganic sulfur sources. Navarro et al.25 reported that CdS crystals with different morphologies could be obtained using thiourea a sulphur source. Li et al.29 reported that the umbrella-like CdS with exposed high-activity (002) facets was successfully synthesized by using NH4SCN as the sulfur source. The unprecedented (110)-bound CdS rhombic dodecahedra were produced by using thioacetamide as the sulfur source.30 However, the effect of organic sulfur on the CdS for the photocatalytic performance has scarcely been reported.
In this work, thioacetamide (CH3CSNH2), thiourea (NH2CSNH2), and thiosemicarbazide (NH2CSNHNH2) have been used to investigate the effect of the structure of organic sulfur on the CdS. This work focuses on the structure, photoelectric properties, and catalytic properties of CdS, which are changed with the increase of the hydrophobicity of organic sulfur sources. This work will promote the development of CdS material, especially in the regulation of sulfur source, band structure, and morphology design.
2 Experimental section
2.1 Materials
Cadmium acetate (Cd(CH3COO)2·2H2O, AR), sodium sulfide (Na2S, AR), and thioacetamide (CH3CSNH2, AR) were obtained from Aladdin Co. Ltd (Shanghai, China). Thiourea (NH2CSNH2, AR) and thiosemicarbazide (NH2CSNHNH2, AR) were purchased from Adamas Reagent, Ltd (Shanghai, China). Triethylenetetramine (C6H18N4, AR) was provided by Xiya Reagent Co. Ltd (Shangdong, China). Anhydrous ethanol (C2H5OH, AR), rhodamine B (C28H31ClN2O3, AR) and lactic acid (C3H6O3, AR) were purchased from Kelong Chemical Reagent Co. Ltd (Chengdu, China). All chemicals were used directly without further purification. Ultra-pure water was used for all experiments. All the data were measured in triplicate.2.2 Synthesis of CdS
CdS photocatalyst was prepared by a one-step solvothermal method. In general, 2 mmol cadmium acetate and 10 mmol sodium sulfide were dissolved in 60 mL triethylenetetramine and ethanol mixed solvent (2![[thin space (1/6-em)]](https://www.rsc.org/images/entities/char_2009.gif) :
:![[thin space (1/6-em)]](https://www.rsc.org/images/entities/char_2009.gif) 1 by volume). After stirring for 1 hour, the solution was transferred to a 100 mL Teflon stainless steel autoclave and kept at 80 °C for 48 h. The precipitate was collected by centrifugation and washed several times with ultra-pure water and ethanol. The samples were then freeze-dried for 72 h, which were denoted as S-NS. Sodium sulfide was replaced by CH3CSNH2, NH2CSNH2 and NH2CSNHNH2 (Fig. 1), which were denoted as S-TAA, S-TA, and S-TSC, respectively.
1 by volume). After stirring for 1 hour, the solution was transferred to a 100 mL Teflon stainless steel autoclave and kept at 80 °C for 48 h. The precipitate was collected by centrifugation and washed several times with ultra-pure water and ethanol. The samples were then freeze-dried for 72 h, which were denoted as S-NS. Sodium sulfide was replaced by CH3CSNH2, NH2CSNH2 and NH2CSNHNH2 (Fig. 1), which were denoted as S-TAA, S-TA, and S-TSC, respectively.
2.3 Characterization
The crystal structure of the sample was studied using an X-ray diffractometer (XRD, Ultima IV, Rigaku Ltd., Japan) with Cu-Kα radiation (λ = 0.15418 nm). Ultraviolet-visible diffuse reflectance spectroscopy (DRS) was performed using an ultraviolet-visible spectrophotometer (Shimadzu UV-2600, Japan), with BaSO4 as the substrate, and the wavelength was between 200 and 800 nm. A field emission scanning electron microscope (FE-SEM, ZEISS Gemini-SEM 500, Germany) was used to explore the morphology of the sample. High-resolution transmission electron microscope (HR-TEM) images were obtained (FEI Quanta 250 FEG electron microscope, USA) with an acceleration voltage of 200 kV. A fluorescence spectrometer (G9800A, Japan) was used to obtain photoluminescence (PL) emission spectra of the samples, which were excited at 310 nm.2.4 Photocatalytic H2 production
Photocatalytic hydrogen testing was carried out in a Labsolar-6a all-glass automatic on-line trace gas analysis system (Beijing PerfectLight Co., Ltd., China). A 300 W xenon lamp (PLS-SCE300D, Beijing PerfectLight Co., Ltd.) with a UV cut-off filter (λ ≥ 420 nm) was used as the visible light source in the photoreaction system. 50 mg sample was added to 100 mL solution (8% lactic acid) for 4 h at 6 °C. Gas chromatography (GC7900, Tianmei Scientific Instrument Co., Ltd., China) was used to detect the content of H2 in the system by automatic interval sampling.The apparent quantum efficiency (AQE) was measured using a PLS-SXE300D with a 420 nm (±5 nm) band pass filter (irradiation conditions 52 W m−2). AQE was obtained by eqn (1):31
 | (1) |
2.5 Photocatalytic degradation
Rhodamine B was degraded under visible light to evaluate the photocatalytic activity of CdS. The general process was as follows: 20 mg sample was dispersed in 50 mL of 10 mg L−1 rhodamine B solution. After reaching the adsorption–desorption equilibrium, 4 mL of uniform suspension was collected. Subsequently, the remaining suspension system was illuminated with PLS-SXE300D (λ ≥ 420 nm), and samples were taken at intervals of 10 minutes, and the photocatalytic reaction was ended after 60 min. The collected sample was centrifuged at 8000 rpm for 5 min, and the supernatant was retained. The concentration of residual rhodamine B in the supernatant was measured with an ultraviolet-visible spectrophotometer at a wavelength of 554 nm.2.6 Photoelectrochemical measurements
The transient photocurrent response was recorded using an electrochemical workstation (CHI660E, CH Instruments Co., China). Ag/AgCl was used as the counter electrode and Pt was the reference electrode. The working electrode was prepared by coating the sample on a piece of FTO glass of 1 cm2. PLS-SXE300D was used as the light source and 0.5 M Na2SO4 solution was used as the electrolyte. The samples were characterized by open-circuit photovoltage (OCPV) and electrochemical impedance spectroscopy (EIS) in the same environment.3 Results and discussion
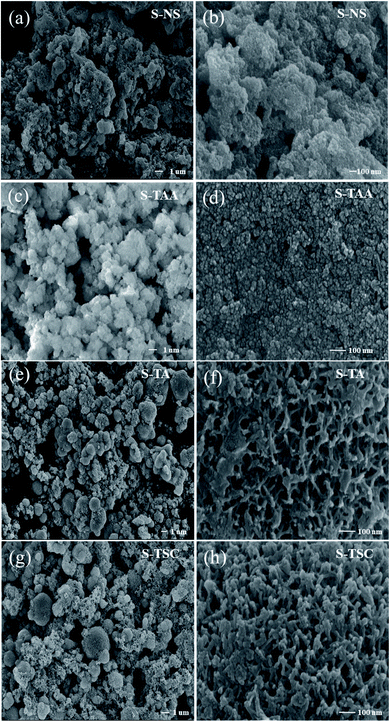
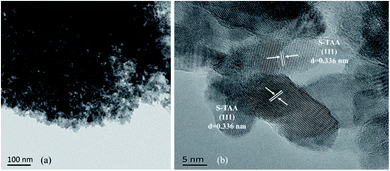
The morphologies of the S-NS, S-TAA, S-TA, and S-TSC were investigated using FE-SEM and HR-TEM. Fig. 2 shows the FE-SEM images of the samples with very different morphologies. As shown in Fig. 2a and b, the S-NS sample exhibits non-uniform micron-sized bulk solid, which was formed by agglomeration of small nanoparticles. When the inorganic sulfide source NaS was substituted with an organic sulfide source CH3CSNH2, the morphologies changed a lot (Fig. 2c and d). It revealed highly uniform and homogeneous micron particles with diameters of about 1 μm. It was composed of several nanoparticles. When –CH3 in CH3CSNH2 was replaced by –NH2 (NH2CSNH2), the morphology of CdS was changed again, as shown in Fig. 2e and f. Some microspheres were gradually formed and a surface with netlike and porous structures was produced on the surface of S-TA. When one –NH2 group in NH2CSNH2 was replaced by –NH2NH2 (NH2NH2CSNH2), a three-dimensional porous structure and network was obtained (Fig. 2g and h). It showed that the S-TSC formed hollow and fluffy microspheres. With the increase of the hydrophilicity of the organic sulfur source, the morphology of the CdS changed from a solid aggregation state to a 3D fluffy network structure. The hydrophobicity or hydrophilicity of the organic sulfur source has a great influence on the morphology of the CdS, which will affect the photocatalytic performance of CdS.The results of HR-TEM were consistent with the SEM results. S-TAA was composed of several nanoparticles (Fig. 3a). The (111) facet preference of S-TAA can be demonstrated by HR-TEM images. Fig. 3b showed that the only visible crystal plane space in S-TAA was 0.336 nm, which was attributed to the (111) facet in cubic CdS.32 The clear lattice fringes could not be observed in some areas (dash part in Fig. 3b). It could be due to the low solvothermal temperature (80 °C), which was unable to produce sufficient energy to form high crystallinity. The (200) and (311) facets may be only in the initial state.
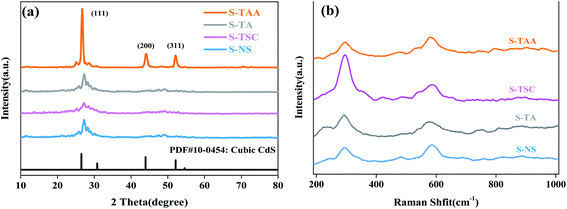
XRD analysis was performed to investigate the crystalline structure of the CdS samples (Fig. 4a). The absence of any impurities was evident from the powder X-ray diffractograms, indicating that the pure CdS photocatalyst can be prepared from various sulfur sources. The diffraction peaks at 26.56°, 43.92° and 52.11° were attributed to the lattice planes of (111), (220) and (311) of cubic CdS, respectively (JSPDS card no. 42-1411, a = 5.818 Å).33 It is not difficult to find that the diffraction peaks corresponding to those (111) crystal facets of S-NS, S-TSC and S-TA are flat and low wide peaks. The diffraction peaks of (200) and (311) crystal facets can hardly be observed. This could be due to the low crystallinity degree of the samples. However, S-TAA shows sharp peaks with high diffraction intensity, which is due to the high crystallization of S-TAA in the preparation process. It shows that the low crystalline CdS photocatalyst was obtained using Na2S, NH2CSNH2 and NH2CSNHNH2 as a sulfur source at low temperature. The sulfur source of CH3CSNH2 is favorable for the prepared highly crystalline cubic CdS. The reason could be that the hydrophobic groups (–CH3) were more conducive to adsorption on the surface of the crystal nucleus than the hydrophilic groups (–NH2). According to the layer growth theory, the crystal nucleus may gradually grow and accumulate into compact cubic CdS.
The crystallite size of the four samples was obtained by Debye–Scherrer's formula,34
 | (2) |
Raman spectra measurements were carried out to characterize the chemical structure of CdS. Fig. 4b displays the Raman spectra of pure CdS using various sulfur sources. Two peaks at 296 and 585 cm−1 correspond to first-order 1 LO and second-order 2 LO phonon scattering of cubic CdS, respectively.35,36 1 LO is reported to appear around 300 cm−1 in micron and nanometer-sized particles, and is the prominent peak in all the reported results on CdS samples, while the value obtained in the present study is around 293 cm−1. This frequency shift of the 1 LO Raman peak in CdS is mainly ascribed to the grain size effect. Due to the grain size effect, the value of 1 LO had red-shifted by 4 cm−1 (297 cm−1).
The specific surface area and pore size distributions of cubic CdS were obtained by nitrogen adsorption–desorption isotherms (Fig. 5). It showed that all CdS samples exhibit a type IV isotherm and H3 hysteresis loop,37 which implies the formation of porous structures in the cubic CdS.38,39 The BET specific surface areas of cubic CdS, which were obtained using Na2S, CH3CSNH2, NH2CSNH2 and NH2CSNHNH2 as a sulfur source, were calculated to be 164.2, 99.3, 151.3, and 301.1 m2 g−1, respectively. The more the availability of hydrophilic groups in organic sulfur sources, the larger the specific surface area. The average pore size distribution of the S-TA and S-TSC mainly centered at 3–4 nm. This indicated that the hydrophilic groups were good for the construction of a narrow pore size distribution. S-TAA exhibited wide pore size distribution (>5 nm), implying that S-TAA was a mesoporous material.
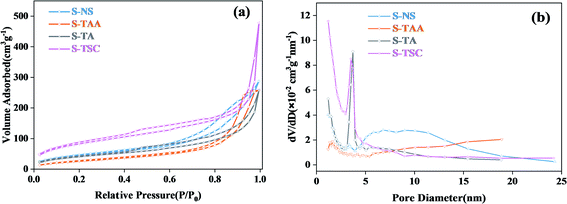 | ||
| Fig. 5 The N2 adsorption–desorption isotherm of the prepared samples (a) and corresponding pore size distributions (b). | ||
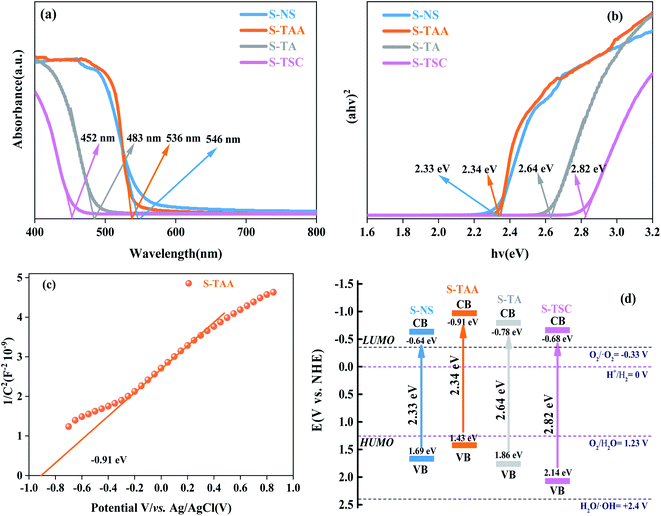
The UV-vis DRS spectrum was recorded for cubic CdS in the range between 400 nm and 800 nm,40 which were obtained using NaS, CH3CSNH2, NH2CSNH2 and NH2CSNHNH2 as a sulfur source (Fig. 6). The corresponding absorption band edges of S-NS, S-TAA, S-TA and S-TSC are 546 nm, 536 nm, 483 nm and 452 nm respectively. With the increase in the hydrophobicity of the sulfur source, the photoabsorption edge of CdS moved to the visible region gradually (Fig. 6a).
The band gap energy of CdS could be calculated by41
| αhv = A(hv − Eg)n/2 | (3) |
PL spectra can show the photoelectron–hole pair recombination in semiconductors. The lower PL intensity corresponds to the lower photoelectron–hole pair recombination efficiency.31,44 As shown in Fig. 7a, the PL strength of S-TAA is lower than that of S-NS, S-TA and S-TSC, indicating that the recombination rate of lower photoelectron–hole pairs could be inhibited effectively by increasing the hydrophobicity of the sulfur source.
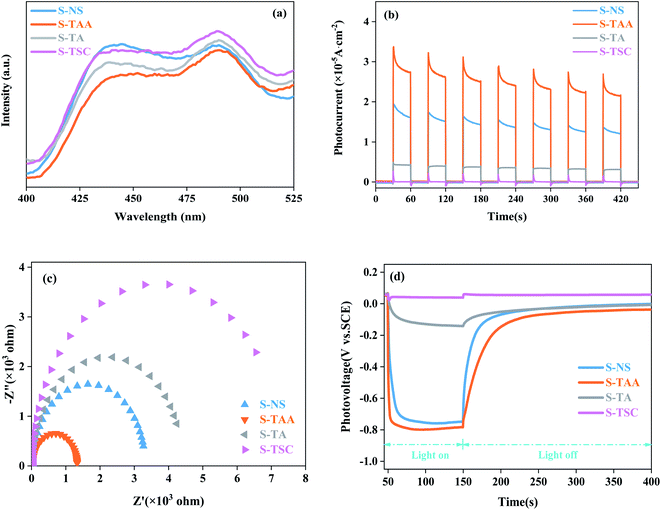 | ||
| Fig. 7 PL spectra of different materials (a), transient photocurrent response of different materials (b), EIS Nyquist plot (c) and OPCV spectrum (d). | ||
The separation and migration rates of photocarriers were further studied by I–t and EIS measurements. As shown in Fig. 7b, S-TAA exhibited the highest photocurrent response in all samples, indicating that the increase of the hydrophobicity of the sulfur source was beneficial to enhance the separation rate of the photocarriers. The Nyquist plot is shown in Fig. 7c. The S-TAA exhibited a minimum radius of curvature, indicating that the increase of the hydrophobicity of the sulfur source favors reducing the resistance of charge transfer and increasing the rate of surface charge transfer.45
OPCV can be used to evaluate the lifetime and separation efficiency of photocarriers.46,47 Fig. 7d shows the OPCV of samples. S-TAA had the largest open-circuit photovoltage response, indicating that the photoexcited electrons had a long lifetime in the S-TAA sample.48 It showed that the increased photocatalysis activity of CdS was caused by increasing the lifetime of the photoexcited electrons through the elevated hydrophobicity of the sulfur source.
The hydrogen-evolving activity of samples was evaluated under visible light (λ ≥ 420 nm) using 10% lactic acid as the sacrificial agent. After four hours, the order of hydrogen evolution was as follows: S-TAA > S-TA > S-TSC > S-NS (Fig. S2†). The hydrogen evolution of S-NS was the lowest in all samples (only 49.2 μmol) after four hours of illumination. It indicated that the improvement of CdS photocatalytic efficiency by the organic sulfur source is better than that by the inorganic sulfur source. Obviously, S-TAA has a larger hydrogen evolution rate than other samples and the quantum efficiency was about 10.58%. The rate of hydrogen evolution of S-TAA was 1.7, 2.0 and 3.8 times that of S-TA, S-TSC and S-NS, respectively (Fig. 8a). The hydrogen production rate of S-TAA reached 943.54 μmol g−1 h−1, which is higher than that of CdS prepared by many other methods (Table 1). It implied that the increase of hydrophobicity of the sulfur source could greatly enhance the photocatalytic activity of H2 evolution of CdS. After four cycles, the hydrogen evolution rate of S-TAA remained at about 900 μmol h−1 g−1, and the hydrogen evolution rate decreased less than 6% (Fig. 8b). This indicates that S-TAA has a good photocatalytic stability.
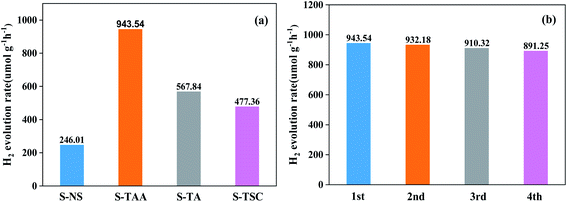 | ||
| Fig. 8 The photocatalytic hydrogen evolution performance for all samples (a) and repeated photocatalytic hydrogen evolution experiments of S-TAA (b). | ||
| Entry | Cat. | Sacrificial reagent | H2 yield (μmol g−1 h−1) | AQE (%) |
|---|---|---|---|---|
| a For better comparison, data were converted to μmol g−1 h−1. | ||||
| This work | S-TAA | Lactic acid | 943.54 | 10.58 |
| 1 (ref. 25) | CdS-EDA | Na2S–Na2SO3 | 502 | NA1 |
| 2 (ref. 26) | CdS-120 | Na2S–Na2SO3 | 500 | NA1 |
| 3 (ref. 8) | 5-CdS | Na2S–Na2SO3 | 2155 | 7.8 |
| 4 (ref. 49) | NiS/CdS-T200 | Lactic acid | 542 | NA1 |
| 5 (ref. 50) | MoOxSy/CdS | Methanol | 460.43 | NA1 |
| 6 (ref. 51) | CdS/rGO | Na2S–Na2SO3 | 500 | NA1 |
| 7 (ref. 52) | CuO/WO3/CdS | MB | 44.5 | NA1 |
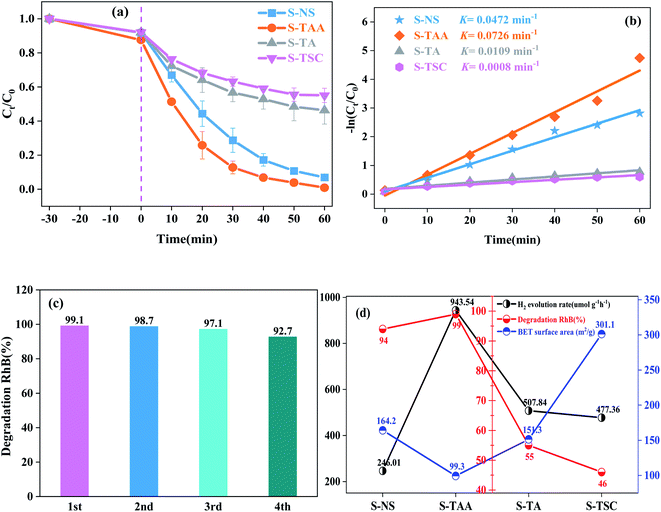
The photocatalytic degradation properties of samples were evaluated under visible light irradiation (λ ≥ 420 nm) with RhB as the target pollutant. The degradation curves of RhB by S-TAA, S-TA, S-TSC and S-NS accord with the first-order-kinetic equation:34
| ln(C0/Ct) = kt | (4) |
| Entry | Cat. | Conc. (mg L−1) | Dosage (mg) | t (min) | De. (%) |
|---|---|---|---|---|---|
| This work | S-TAA | 10 | 20 | 60 | 99 |
| 1 (ref. 53) | MgCdS | 10 | 50 | 70 | 96 |
| 2 (ref. 54) | Cd/CdS/BiOCl | 10 | 10 | 150 | 90 |
| 3 (ref. 55) | CdS/BiOCl | 10 | 50 | 100 | 90 |
| 4 (ref. 56) | CdS/AgBr-rGO | 24 | 60 | 60 | 96 |
| 5 (ref. 57) | BiOI/CdS | 20 | 20 | 60 | 94 |
| 6 (ref. 58) | CdS/BiVO4 | 15 | 10 | 60 | 95 |
| 7 (ref. 59) | Tetrapod CdS | 60 | 30 | 140 | 99 |
The stronger hydrophobicity of organic sulfur source are available, the smaller the specific surface area it is (Fig. 9d). However, the photocatalytic activity of S-TAA was better than that of the other samples. Therefore, the influence of specific surface area on photocatalytic activity was not dominant in this work, and the hydrophobicity of the organic sulfur source played an important role in CdS photocatalytic activity.
Due to the increase in the hydrophobicity of the sulfur source, the structure of CdS had been changed. The CB of S-TAA was more negative than that of S-NS, S-TA, and S-TSC. The VB of S-TAA was more positive than that of S-NS, S-TA, and S-TSC. In the photocatalytic hydrogen evolution, H2O was reduced by electrons to produce hydrogen, hydroxyl radicals were oxidized to oxygen, and lactic acid was oxidized to oxide (Fig. 10a). In the photocatalytic degradation, oxygen acquires electrons and produces superoxide radicals, which oxidizes RhB to CO2 and water. RhB was oxidized by the holes into CO2 and water at the same time (Fig. 10b and S3†). The photocatalysis performance of CdS was improved with the increase of hydrophobicity of the sulfur source.
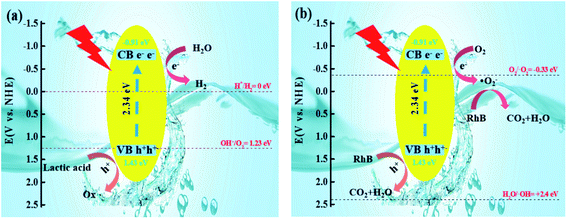 | ||
| Fig. 10 Graphical illustration of the mechanism for the photocatalytic degradation-hydrogen evolution of RhB over the S-TAA photocatalyst (a and b). | ||
4 Conclusion
A series of CdS samples were successfully prepared through a low-temperature solvothermal method using thioacetamide, thiourea and thiosemicarbazide as the organic sulfur source. All the samples were mesoporous photocatalysts and the specific surface areas of S-NS, S-TAA, S-TA, and S-TSC were calculated to be 164.2, 99.3, 151.3, and 301.1 m2 g−1, respectively. The rate of hydrogen evolution of S-TAA was 1.7, 2.0 and 3.8 times that of S-TA, S-TSC and S-NS, respectively. The order of the activity of photocatalytic degradation is S-TAA > S-NS > S-TA > S-TSC. Within 60 min, the degradation efficiency of S-TAA on RhB was close to 99.1%. Increasing the hydrophobic chain of the organic sulfur source not only extended the optical absorption edges to the visible light region, but also reduced the resistance of charge transfer, increasing the rate of surface charge transfer and the lifetime of the photoexcited electrons. This provides a controllable route to improve the photocatalytic performance of CdS.Author contributions
Qiong Zhu: data curation and writing – original draft preparation. Jinhua Wang: data curation and writing – original draft preparation. Si Cheng: supervision and project administration. Hongquan Fu: formal analysis. Juan Zhang: writing – review & editing. Hejun Gao: funding acquisition, methodology, conceptualization, and supervision. Yunwen Liao: investigation.Conflicts of interest
There are no conflicts to declare.Acknowledgements
The authors are grateful to The Application Technology Research and Development Special Project of Nanchong, China (18YFZJ0035, 21YFZJ0109), Applied Basic Research Programs of Science and Technology Department of Sichuan Province, China (2018JY0115), Innovation and Entrepreneurship Project of China West Normal University, China (cxcy2020185) and the Project of Dazhou Science and Technology Bureau, Sichuan Province (20YYJC0001).References
- T. Huo, G. Ba, Q. Deng, F. Yu, G. Wang, H. Li and W. Hou, Appl. Catal., B, 2021, 287, 119995 CrossRef CAS.
- G. Zhang, Q. Ji, Z. Wu, G. Wang, H. Liu, J. Qu and J. Li, Adv. Funct. Mater., 2018, 28, 1706462 CrossRef.
- Y. Guo, Y. Yang, X. Yin, J. Liu and W. Que, Sustainable Energy Fuels, 2020, 4, 2559–2568 RSC.
- D. Ma, Z. Wang, J.-W. Shi, M. Zhu, H. Yu, Y. Zou, Y. Lv, G. Sun, S. Mao and Y. Cheng, Chem. Eng. J., 2020, 399, 125785 CrossRef CAS.
- N. Zhong, M. Chen, Y. Luo, Z. Wang, X. Xin and B. E. Rittmann, Chem. Eng. J., 2019, 355, 731–739 CrossRef CAS.
- J. Han, Z. Zhu, N. Li, D. Chen, Q. Xu, H. Li, J. He and J. Lu, Appl. Catal., B, 2021, 291, 120108 CrossRef CAS.
- Y. Liu, Y. Ma, W. Liu, Y. Shang, A. Zhu, P. Tan, X. Xiong and J. Pan, J. Colloid Interface Sci., 2018, 513, 222–230 CrossRef CAS PubMed.
- C. Bie, J. Fu, B. Cheng and L. Zhang, Appl. Surf. Sci., 2018, 462, 606–614 CrossRef CAS.
- Q. Zhu, Y. Sun, F. Na, J. Wei, S. Xu, Y. Li and F. Guo, Appl. Catal., B, 2019, 254, 541–550 CrossRef CAS.
- B. Sun, P. Qiu, Z. Liang, Y. Xue, X. Zhang, L. Yang, H. Cui and J. Tian, Chem. Eng. J., 2021, 406, 127177 CrossRef CAS.
- Y. Luo, X. Liu, L. Tan, Z. Li, K. W. K. Yeung, Y. Zheng, Z. Cui, Y. Liang, S. Zhu, C. Li, X. Wang and S. Wu, Chem. Eng. J., 2021, 405, 126730 CrossRef CAS.
- S. S. Hossain, M. Tarek, T. D. Munusamy, K. M. Rezaul Karim, S. M. Roopan, S. M. Sarkar, C. K. Cheng and M. M. Rahman Khan, Environ. Res., 2020, 188, 109803 CrossRef CAS PubMed.
- B. Archana, N. Kottam, S. Nayak, K. B. Chandrasekhar and M. B. Sreedhara, J. Phys. Chem. C, 2020, 124, 14485–14495 CrossRef CAS.
- C. Li, S. Du, H. Wang, S. B. Naghadeh, A. L. Allen, X. Lin, G. Li, Y. Liu, H. Xu, C. He, J. Z. Zhang and P. Fang, Chem. Eng. J., 2019, 378, 122089 CrossRef CAS.
- Y. Zhao, Y. Lu, L. Chen, X. Wei, J. Zhu and Y. Zheng, ACS Appl. Mater. Interfaces, 2020, 12, 46073–46083 CrossRef CAS PubMed.
- M. Junaid, M. Imran, M. Ikram, M. Naz, M. Aqeel, H. Afzal, H. Majeed and S. Ali, Appl. Nanosci., 2019, 9, 1593–1602 CrossRef CAS.
- J. Wang, Q. Zhu, Y. Liao, H. Fu, J. Chang, Y. Zhang, T. Kan, H. Gao and W. Huang, J. Alloys Compd., 2021, 883, 160832 CrossRef CAS.
- Y. Ma, Y. Bian, Y. Liu, A. Zhu, H. Wu, H. Cui, D. Chu and J. Pan, ACS Sustainable Chem. Eng., 2018, 6, 2552–2562 CrossRef CAS.
- S. Wang, B. Zhu, M. Liu, L. Zhang, J. Yu and M. Zhou, Appl. Catal., B, 2019, 243, 19–26 CrossRef CAS.
- Q. Wu, A. B. Abdeta, D.-H. Kuo, H. Zhang, Q. Lu, J. Zhang, O. A. Zelekew, M. T. Mosisa, J. Lin and X. Chen, J. Mater. Chem. A, 2022, 10, 5328–5349 RSC.
- O. A. Zelekew, D.-H. Kuo, J. M. Yassin, K. E. Ahmed and H. Abdullah, Appl. Surf. Sci., 2017, 410, 454–463 CrossRef CAS.
- J. Yan, Z. Wei, M. Xu, Z. Jiang and W. Shangguan, Catalysts, 2020, 10, 1478 CrossRef CAS.
- B. Wang, C. Chen, Y. Jiang, P. Ni, C. Zhang, Y. Yang, Y. Lu and P. Liu, Chem. Eng. J., 2021, 412, 128690 CrossRef CAS.
- J. Xu, X. Li, J. Niu, M. Chen and J. Yue, J. Alloys Compd., 2020, 834, 155061 CrossRef CAS.
- F. Vaquero, R. M. Navarro and J. L. G. Fierro, Appl. Catal., B, 2017, 203, 753–767 CrossRef CAS.
- F. Vaquero, R. M. Navarro and J. L. G. Fierro, Int. J. Hydrogen Energy, 2016, 41, 11558–11567 CrossRef CAS.
- Y. Huang, F. Sun, T. Wu, Q. Wu, Z. Huang, H. Su and Z. Zhang, J. Solid State Chem., 2011, 184, 644–648 CrossRef CAS.
- H.-z. Zhang, H. Maimaiti, P.-s. Zhai, S.-X. Wang and B. Xu, Appl. Surf. Sci., 2021, 542, 148639 CrossRef CAS.
- J. Zhang, Y. Song, X. Dong, H. Jiang, J. Tang and H. Li, J. Mater. Sci., 2020, 55, 11167–11176 CrossRef CAS.
- C.-H. Hsiao, C.-W. Chen, H.-S. Chen, P.-L. Hsieh, Y.-A. Chen and M. H. Huang, J. Mater. Chem. C, 2021, 9, 5992–5997 RSC.
- Y. Zhu, J. Chen, L. Shao, X. Xia, Y. Liu and L. Wang, Appl. Catal., B, 2020, 268, 118744 CrossRef CAS.
- Y. Zhao, C. Shao, Z. Lin, S. Jiang and S. Song, Small, 2020, 16, 2000944 CrossRef CAS PubMed.
- M. Li, J. Li and Z. Jin, Dalton Trans., 2020, 49, 5143–5156 RSC.
- H. Lv and H. Sun, ACS Omega, 2020, 5, 11324–11332 CrossRef CAS PubMed.
- R. K. Chava, J. Y. Do and M. Kang, J. Mater. Chem. A, 2019, 7, 13614–13628 RSC.
- Y. Lin, Q. Zhang, Y. Li, Y. Liu, K. Xu, J. Huang, X. Zhou and F. Peng, ACS Sustainable Chem. Eng., 2020, 8, 4537–4546 CrossRef CAS.
- X. Chen, H. Sun, D.-H. Kuo, A. B. Abdeta, O. A. Zelekew, Y. Guo, J. Zhang, Z. Yuan and J. Lin, Appl. Catal., B, 2021, 287, 119992 CrossRef CAS.
- Q. Li, X.-Q. Qiao, Y. Jia, D. Hou and D.-S. Li, Appl. Surf. Sci., 2019, 498, 143863 CrossRef CAS.
- J. Guo, Y. Liang, L. Liu, J. Hu, H. Wang, W. An and W. Cui, Appl. Surf. Sci., 2020, 522, 146356 CrossRef CAS.
- M. Imran, M. Ikram, A. Shahzadi, S. Dilpazir, H. Khan, I. Shahzadi, S. A. Yousaf, S. Ali, J. Geng and Y. Huang, RSC Adv., 2018, 8, 18051–18058 RSC.
- J. Wang, S. Yang, J. Chang, S. Pang, H. Fu, F. Jiang, Y. Liao and H. Gao, J. Electron. Mater., 2021, 50, 2444–2453 CrossRef CAS.
- Y. Hu, X. Hao, Z. Cui, J. Zhou, S. Chu, Y. Wang and Z. Zou, Appl. Catal., B, 2020, 260, 118131 CrossRef CAS.
- J. Xu, X. Yan, Y. Qi, Y. Fu, C. Wang and L. Wang, Chem. Eng. J., 2019, 375, 122053 CrossRef CAS.
- Z.-W. Zhang, Q.-H. Li, X.-Q. Qiao, D. Hou and D.-S. Li, Chin. J. Catal., 2019, 40, 371–379 CrossRef CAS.
- H. Guo, C.-G. Niu, C.-Y. Feng, C. Liang, L. Zhang, X.-J. Wen, Y. Yang, H.-Y. Liu, L. Li and L.-S. Lin, Chem. Eng. J., 2020, 385, 123919 CrossRef CAS.
- T.-S. Kang, A. P. Smith, B. E. Taylor and M. F. Durstock, Nano Lett., 2009, 9, 601–606 CrossRef CAS PubMed.
- X. Ning, J. Li, B. Yang, W. Zhen, Z. Li, B. Tian and G. Lu, Appl. Catal., B, 2017, 212, 129–139 CrossRef CAS.
- X. Chen, T. Huang, D.-H. Kuo, H. Sun, P. Li, O. A. Zelekew, A. B. Abdeta, Q. Wu, J. Zhang, Z. Yuan and J. Lin, Appl. Catal., B, 2021, 298, 120542 CrossRef CAS.
- Y. Yang, Q. Meng, X. Jiang, S. Meng, X. Zheng, S. Zhang, X. Fu and S. Chen, ACS Appl. Energy Mater., 2020, 3, 7736–7745 CrossRef CAS.
- X. Lu, C. Y. Toe, F. Ji, W. Chen, X. Wen, R. J. Wong, J. Seidel, J. Scott, J. N. Hart and Y. H. Ng, ACS Appl. Mater. Interfaces, 2020, 12, 8324–8332 CrossRef CAS PubMed.
- K. Hareesh, S. D. Dhole, D. M. Phase and J. F. Williams, Mater. Res. Bull., 2019, 110, 82–89 CrossRef CAS.
- D. Wang, J. Liu, M. Zhang, Y. Song, Z. Zhang and J. Wang, Appl. Surf. Sci., 2019, 498, 143843 CrossRef CAS.
- C. Feng, Z. Chen, J. Jing, M. Sun, H. Tong and J. Hou, Phys. B, 2020, 594, 412363 CrossRef CAS.
- J. Li, T. Lu, Z. Zhao, R. Xu, Y. Li, Y. Huang, C. Yang, S. Zhang and Y. Tang, Inorg. Chem. Commun., 2020, 121, 108236 CrossRef CAS.
- X. Tang, H. Liu, C. Yang, X. Jin, J. Zhong and J. Li, Colloids Surf., A, 2020, 599, 124880 CrossRef CAS.
- J. Zhang, Z. Zhang, W. Zhu and X. Meng, Appl. Surf. Sci., 2020, 502, 144275 CrossRef CAS.
- T. Zhang, X. Wang, Z. Sun, Q. Liang, M. Zhou, S. Xu, Z. Li and D. Sun, Solid State Sci., 2020, 107, 106350 CrossRef CAS.
- Y. Lin, D. Pan and H. Luo, Mater. Sci. Semicond. Process., 2021, 121, 105453 CrossRef CAS.
- W. Yue, Z. Wang, J. Gong, Z. Wang and Y. Dong, Mater. Sci. Semicond. Process., 2021, 126, 105671 CrossRef CAS.
Footnote |
| † Electronic supplementary information (ESI) available. See https://doi.org/10.1039/d2ra01309f |
| This journal is © The Royal Society of Chemistry 2022 |


