
 Open Access Article
 This Open Access Article is licensed under a Creative Commons Attribution-Non Commercial 3.0 Unported Licence
The Cu(II) – dietary fibre interactions at molecular level unveiled via EPR spectroscopy†
Victoria N. Syryamina ab,
Maxim Yulikov*c and
Laura Nyström*a
ab,
Maxim Yulikov*c and
Laura Nyström*a
aETH Zürich, Institute of Food, Nutrition and Health, Laboratory of Food Biochemistry, Schmelzbergstrasse 9, 8092, Zürich, Switzerland. E-mail: laura.nystroem@hest.ethz.ch
bVoevodsky Institute of Chemical Kinetics and Combustion of the Siberian Branch of the Russian Academy of Sciences, 630090, Novosibirsk, Russia
cETH Zürich, Department of Chemistry and Applied Biosciences, Laboratory of Physical Chemistry, Vladimir-Prelog-Weg 2, 8093, Zürich, Switzerland. E-mail: maxim.yulikov@phys.chem.ethz.ch
First published on 7th July 2022
Abstract
While dietary fibres have a reputation of a healthy food component, the interaction between nutrients and neutral fibers is non-covalent, and its characterization is challenging for most analytical techniques. Here, on the example of barley β-glucan (BBG) and paramagnetic Cu(II) ions we demonstrate the performance of different Electron Paramagnetic Resonance (EPR) methods in the fibre studies. EPR techniques were tested on two spin probe systems with different affinity in the interaction with dietary fibres – Cu(OAc)2 salt, which weakly dissociates under physiological conditions and CuSO4 salt, which easily dissociates, so that in the latter case Cu(II) can be considered as a ‘free’ ion, only chelated by water molecules. The Cu(II)-BBG interaction was determined by pulse EPR relaxation measurements, but this interaction appears not strong enough for continuous wave EPR detection. The capability of the fibres for Cu(II) absorption was successfully analyzed by comparison of the results from the pulse dipolar spectroscopy with numerical simulations. The local distribution of sugar hydrogen atoms around the Cu(II) ion has been determined by electron spin echo envelope modulation (ESEEM) and electron-nuclei double resonance (ENDOR) techniques.
Introduction
Plant foods – cereals, nuts, fruits, and vegetables are rich in carbohydrate polymers, classified as dietary fibre (DF). The diversity of saccharides, the degree of fibre ramification, and variety in the molecular weight (size) create tremendous structural variability between various DFs. Due to a lack of carbohydrate-degrading enzymes in the human digestive system, fibres are only partially digested by the intestinal microbiota without providing energy or being absorbed.1 On the other hand, DFs slow down stomach emptying and increase satiety, and they improve digestive functions by promoting the growth of intestinal microbiota and supporting the production of beneficial metabolites with various health promoting effects. These effects combined make DFs an essential part of a healthy diet and assist in tackling various chronic diseases and conditions such as cardiovascular disease, type II diabetes, high blood pressure, colon cancer, and being overweight.1–4 Being polymer chains with certain flexibility, on the molecular level fibres can organize into networks, which might work as molecular carriers, absorbing small nutritionally relevant molecules, such as minerals (metal ions), vitamins, toxins, and medical drugs. This reduces the bioavailability of small molecules and has a two-way effect on the diet – adverse when micronutrients are absorbed, and positive when toxins are absorbed.Characterization of the ability of DFs to bind small molecules, as well as the identification of binding sites, is of interest for understanding and designing the balance between the beneficial and adverse properties of fibres. Mineral absorption by fibre is of prime interest due to its two-fold effect: metal ions are essential micronutrients that need to be available for a number of important biochemical reactions and molecules (e.g. metalloproteins, vitamins), while an excess of non-coordinated ions may result in toxic effects – such as in metal-poisoning diseases and due to the metal ion activity in generating reactive oxygen species. Depending on the nutrient composition, minerals could be considered as ions complexed by small buffer molecules, dissociated complexes and the precipitant,5 each on which contributes to food taste, metal ion toxicity, and bioavailability.6 Neutral fibres contain only hydroxy groups, which possess weak chelation affinity for most essential ions (Mg(II), Ca(II), Fe(III), Cu(II), Zn(II)), but could be compensated by the large number of hydroxy groups per fibre and the local network.7 However, identification of binding sites, quantification of absorbed ions, and even reliable detection of this interaction can be a problem for spectroscopic methods.
Electron Paramagnetic Resonance (EPR) spectroscopy is a tool that probes the electron state, local chemical, and electron environment of the paramagnetic center.8–11 The paramagnetic metal ions (VO(II), Mn(II), Fe(III), Cu(II), Gd(III), etc) are intrinsically EPR-active, which is making them perfect reporters, which could not only prove or disprove the interaction with DFs, but also characterize the structure and distribution of the binding site(s) over the fibre chain. However, up to date no such studies are known for dietary fibres.
By introducing the EPR methodology to the fibre studies, we further aim to eventually examine the interactions between different EPR-active metal ions or spin-labeled small molecules and DFs with different structure. As a test compound for soluble neutral dietary fibre we used here barley β-glucan (BBG), which is a linear polysaccharide. We choose the Cu(II) ion as a test spin probe due to its convenient spectroscopic parameters: the total spin S = ½ and moderate anisotropy of the g-tensor provide sufficiently long transverse and longitudinal relaxation times for application of pulse EPR techniques. From the nutritional point of view, Cu(II) is an essential mineral for living organisms, whereas disruption of Cu(II)-metabolism results in copper-poisoning or copper-deficiency diseases.12 In an aqueous solvent at ambient conditions, the toxic copper species are the Cu(II) ions and the monohydroxy complexes (Cu(OH)+), which are dominant below pH 5.5.13 In the human gastrointestinal tract (GIT), the pH varies non-uniformly: starting from 6.5 in the saliva and falling to 1.5–3 in the stomach, it rises to 5–8.5 in the intestine and colon.14 Screening for metal ions binding by soluble cereal fibres and alditols showed that binding of Cu(II) species by saccharides starts at pH 4.0, attaining a maximum at 5.0–6.0.15,16 Thus, in order to test for a potential effect of DF in scavenging toxic copper species and observe Cu(II)-fibre interaction, we work in the pH range encountered in the GIT, specifically at pH 5.1. As the stability of the initial metal ion complex can compete with affinity of chelation by fibres, two different Cu(II) complexes were tested: (i) a copper acetate in the acetic buffer, which is partially dissociated and can be considered as a more stable complex;16 and (ii) the copper sulphate in aqueous solution, which is easily dissociated and can be considered as a source of the weak hexaaquocopper(II) complex. From the nutritional point of view, both kinds of copper can be considered relevant, as diluted acetic acid may have positive impact on the taste and contribute to the preservation of foods. CuSO4 on the other hand has been used as a food additive for acidity regulation (E519) and as an emetic but has later been prohibited due to its toxic effects. Finally, we distribute the reported EPR techniques into three groups, according to the primary question addressed: (i) the primary detection of the Cu(II)-BBG interaction is attempted by the continuous wave (CW) EPR, and by the relaxation enhancement technique; (ii) the evaluation of the fraction of bound Cu(II) ions is performed using pulse dipolar spectroscopy (PDS) and numeric simulations; (iii) the local distribution of sugar moieties around Cu(II) ions is analysed using the hyperfine spectroscopy (HFS) techniques.11,17–24
Experimental
The theoretical background of the EPR spectroscopy
The 63/65Cu(II) ions have the electronic structure 3d9 with total spin S = ½, and nuclear spin I = 3/2. The often found six-coordinated Cu(II) complexes typically have an extended or compressed geometry, corresponding to Jahn–Teller distortion of the regular octahedron.6The spin Hamiltonian of Cu(II) complexes includes the electron Zeeman (EZ) and nuclear Zeeman (NZ) interaction, electron-nuclear hyperfine interaction (HFI), nuclear quadrupole interaction (NQI) and the electron-electron dipole-dipole (eD) interaction:
 | (1) |
Ligands perturb the electronic structure of the bare Cu(II) ion by imposing a so-called crystal field, which depends on ligand type. If a dietary fibre chelates metal ions, the ligand structure changes can perturb the energy levels of the copper ions. For the case of strong interaction, the primary information about the ligand field of the transition metal ion can be probed by the routine continuous wave (CW) EPR technique. In the case of weak interaction, pulse EPR techniques can test the hyperfine structure, which is otherwise masked by an inhomogeneous linewidth. Finally, for the case of preferential absorption of the metal ions by a fibre, the analysis of the metal ions distribution over the volume of the DF particle can be performed utilizing the eD interactions.
Materials
The CuSO4, Cu2(OAc)4, deuterated acetic acid (C2H3CO22H, 99.5% purity) and deuterated dimethyl sulfoxide-d6 (DMSO, 99.9% purity) were purchased from Sigma Aldrich. The deuterium oxide (2H2O, 99.9% purity) was purchased from Merck Isotop. The barley β-glucan (in the following denoted as BBG or β-glucan) was purchased from Megazyme (Lot 100![[thin space (1/6-em)]](https://www.rsc.org/images/entities/char_2009.gif) 401, 95% purity) and was used without further purification.
401, 95% purity) and was used without further purification.
Sample preparation
The pH (pD) of all solutions was adjusted to 5.1. The BBG stock solution was prepared in 2H2O by gently stirring at 100 °C for 1 h and then at room temperature over 23 h. The Cu2(OAc)4 was dissolved in 0.25 M acetic buffer. The protonated or deuterated acetate was used for preparing the acetic buffer. The CuSO4 was dissolved in 2H2O. The fibre and Cu(II) solvents were mixed and stored for 24 h at room temperature. The sample solutions were transferred to the quartz tube with o.d. of 3 mm, quickly mixed with the cryoprotector (DMSO, the solvent:DMSO = 65:35 v/v was used) and frozen in the liquid nitrogen to form a glass. Between EPR measurements, samples were stored at - 80 °C. The β-glucan concentration was 16.25 μM, the Cu(II) concentration was 312 μM, unless differently stated. The samples were about 40 μL in volume and ∼7 mm in height.
Reference and control samples for 2H ESEEM (electron spin echo envelop modulation), 1H ENDOR (electron-nuclear double resonance) and RIDME (relaxation induced dipolar modulation enhancement) experiments were prepared as follows: (i) Cu(II) concentration of 312 μM, with 1H concentration in the solvent varied from 0.7 M to 14 M by mixing 1H2O and 2H2O solvents in the appropriate volumes; (ii) Cu(II) concentration of 1 mM with and without fibre in 2H2O.
A sample with Cu(II) at 312 μM concentration with excess of phytic acid was prepared to check for the competition of Cu(II) binding by DFs and by traces of phytic acid in the commercial fibre.25
EPR measurements
CW X-band EPR spectra were detected using a Bruker Elexsys E500 spectrometer equipped with a Bruker Super High Q probehead. CW EPR measurements were performed at room temperature (RT) and at 50 K. The microwave (mw) power was attenuated to −13 and −25 dB in measurements at RT and at 50 K, respectively. The calibrated, non-attenuated output mw power of the Gunn diode is 200 mW. The modulation frequency and the modulation amplitude were set to 100 kHz and 0.5 mT, respectively. The sweep width was 100 mT at RT and 150 mT at 50 K. The time constant and conversion time of, respectively, 20.48 ms and 40.96 ms were used.All experiments below room temperature were carried out with a helium flow cryostat (ER 4118 CF, Oxford Instruments) for adjusting and stabilizing the measurement temperature.
At X-band, pulse EPR experiments were performed on a Bruker Elexsys E680 X-/W-band spectrometer equipped with a Bruker ER 4118 X-MS-3 resonator whose antenna had been silver-coated to suppress the copper background signal. The Q-band pulse EPR experiments were performed on a commercial Bruker Elexsys E580 spectrometer or on a home-built spectrometer equipped with a home-built rectangular TE102 mode cavity or a home-built TE102 cavity with ENDOR coils.26
The longitudinal relaxation time was measured at Q-band by inversion-recovery sequence 2tpulse − T − tpulse − τ1 − 2tpulse − τ1 − echo, the length of mw pulses was set to tpulse = 16 ns, the delay T was incremented starting from 500 ns, and τ1 was 280 ns. The transverse relaxation time was measured at Q-band by Hahn sequence tpulse − τ − 2tpulse − τ − echo, the length of mw pulses was set to tpulse = 100 ns, τ was incremented starting from 600 ns. The relaxation decays were measured at the maximum of the echo-detected EPR spectrum (g⊥).
The 2H ESEEM decays were measured at X-band by sequence tpulse − τ − tpulse − T − tpulse − τ − echo, the length of mw pulses was set tpulse = 16 ns. The T was incremented starting from 248 ns with time steps of 8 ns, τ was adjusted to provide the maximum of deuteron modulation. The 1H ESEEM decays were measured by 5-pulse sequence tpulse(y) − τ1 − 2tpulse(y) − τ1 − tpulse(x) − T − tpulse(x) − τ2 − 2tpulse(x) − τ2 − echo, the length of mw pulses was set to tpulse(y) = tpulse(x) = 16 ns. The τ1 was 36 ns (1st maximum of 1H modulation), τ2 was 448 ns (1st blind spot of 2H modulation), T was incremented starting from 40 ns with time steps of 4 ns. ESEEM decays were measured at the maximum of echo-detected EPR spectrum (g⊥).
The stochastic ENDOR experiments were acquired at 10 K, Q-band, by pulse sequence tprep − T1 − tRF − tpulse − t1 − 2tpulse − t1 − echo, the length of tprep was tested and set to 256 ns which provide the maximal 1H signal, the mw power was adjusted for inversion of the spin magnetization. The pulse length for detection was tpulse = 16 ns. The length of radiofrequency (rf) pulse was tRF = 12 μs, T1 was set to 2000 ns, and t1 was set to 400 ns. The rf interval was 20 MHz and was sampled with 401 points. The amplitude of the RF pulse was adjusted to obtain the maximal 1H signal. For 31P ENDOR the rf pulse power was increased 2.5 times. The ENDOR measurements were performed at g⊥ and gǁ spectral positions.
RIDME measurements were performed at Q-band by refocused sequence tpulse − τ1 − 2tpulse − (τ1 + T) − tpulse − Tmix − tpulse − (τ2 − T) − 2tpulse − τ2 − echo, the length of mw pulses was set to tpulse = 12 ns. The time delay τ1 was set to 400 ns and τ2 was selected according to the required trace length. The mixing block time Tmix was varied depending on the longitudinal relaxation time and adjusted to have a constant Tmix/T1 = 1.3 ratio.27 The ESEEM contribution, echo crossings and phase offsets were removed as described previously.28,29 RIDME decays were measured at the maximum of echo-detected EPR spectrum (g⊥).
The four-pulse DEER measurements were performed at X-band by the pulse sequence tpulse − τ1 − 2tpulse − (τ1 + T) − tpump − (τ2 − T) − 2tpulse − τ2 − echo, the length of mw pulses was set 2tpulse = tpump = 32 ns. The frequency positions were chosen symmetrically with respect to the resonator dip, with νA – νB = 65 MHz, the detection (νA) and pumping (νB) frequencies were chosen symmetrically around the g⊥ component of Cu(II) EPR spectrum. The mw power of the pumping pulse was adjusted by nutation measurements at μA = νB. The time delay τ1 was set to 800 ns and τ2 was selected according to the required dipolar evolution length. Signal offset from zero was removed by cycling the first pulse+(+x)−(−x) and 2H ESEEM contributions were eliminated by 8-step nuclear averaging cycle with Δτ1 = 56 ns.
Data processing
The g- and A-tensors were evaluated from simulations of CW EPR spectra using the EasySpin software.30 All pulse EPR data were treated and simulated with home-written MATLAB scripts which are available from the authors upon request. The inversion-recovery (IR) curves or Hahn echo decays were offset-corrected, inverted (for IR) and fitted by stretched exponential decay, exp(−(T/T1)β), and exp[(−2τ/Tm)β]. The stretching parameter β and longitudinal or transverse relaxation time were extracted as fit parameters. The ESEEM data were processed as follows: in the semilogarithmic scale the relaxation decay was fitted by polynomial of sixth order and subtracted, the modulated part (normalized ESEEM decay) was subjected to modulus-Fourier transformation.31 DEER and RIDME traces were fitted by stretched exponential function exp(−(kT)d/3). The 1H ENDOR spectra were simulated with assumptions listed in the corresponding section of the article.Results and discussion
The strategy to characterize the DF interactions
The following aims could be addressed at the characterization of the metal ion-DFs interaction: (i) are there interactions between the metal ions and the dietary fibre and, if so, which EPR techniques are able to unequivocally prove it? Here, CW EPR and relaxation enhancement technique were examined. If interaction can be proved, further specific aims should be examined: (ii) the DF absorption capacity (examined by PDS techniques and modelling), and (iii) the structure of the fibre binding site(s) (examined by HFS).The characterization of the spatial distribution of metal ions in composition with fibres, probed by PDS spectroscopy, provides the specific information about metal ion-DFs interaction. The elaboration of the fibre absorption capacity from PDS EPR must be accompanied by numerical simulations and is related to the density of sugar monomers within the fibre particle, and thus to its average size. Generally, the polymer physical dimensions are determined by the interaction between chain elementary units and the solvent, and scales with the average polymer chain length.32,33 Barley β-glucans are linear polymer with elementary unit of the β-D-glucose with alternating 1→3/1→4 glycosidic bond, Fig. 1. The analysis of commercial barley β-glucans by size exclusion chromatography in the aqueous solution evaluate the hydrodynamical radius as Rh [nm] = 0.84・Mw0.62±0.02 [kDa], ESI, S1.† The dimension parameter in the scaling law is close to ⅗, reporting on the ‘good’ solvent approximation for the polymer.
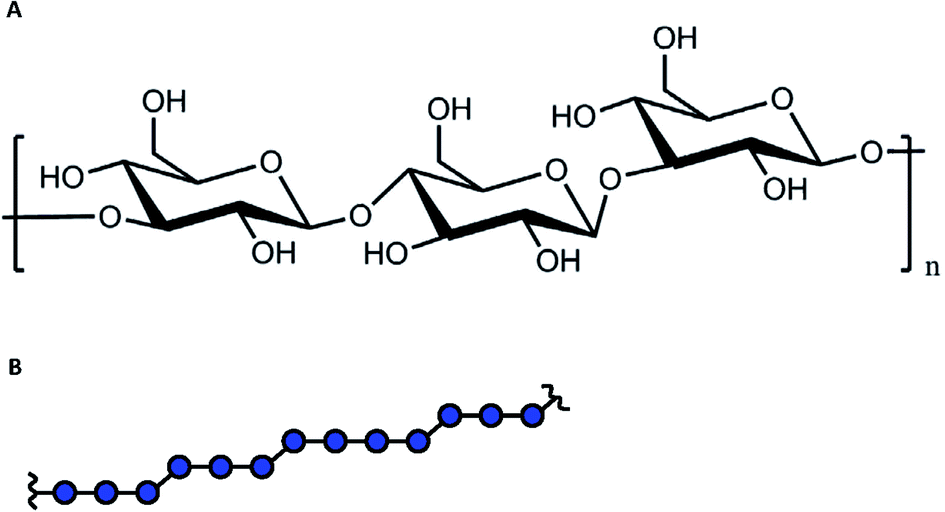 | ||
| Fig. 1 (A). The chemical structure of β-D-glucose with the 1 → 3 and 1 → 4 polymerization bonds. (B). The alternating pattern for β-glucans. | ||
Since the polymer is referred to the soft matter without a well-defined structure, in some estimations we will simplify the polymer structure assuming the fibre as spherical ‘particle’, uniformly filled by glucan monomers. Under this assumption, the physical and hydrodynamical radii are related as R [nm] = (5/2)1/2Rh ≈ 31.5 nm. The total volume occupied by DF ‘spheres’ can be the sum of volumes of isolated spheres, or can include DF chains aggregates, which include multiple fibres. At used concentration of 16.25 μM and the assumption of impermeable spheres with radius 31.5 nm, the volume filling factor ν would be 1.24, which readily indicates that at this concentration some aggregation and intercalation of DFs chains takes place.
Specific aim I: identification of the Cu(II)-DFs interaction
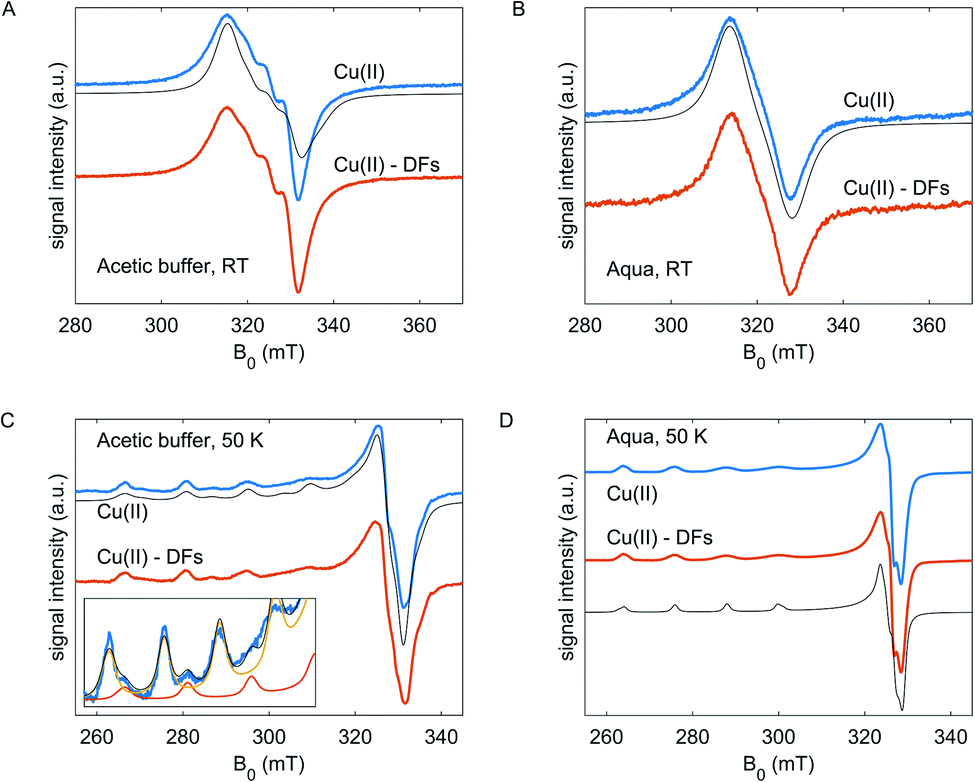 | ||
| Fig. 2 (A and C) The CW EPR spectra for Cu(II) without and with DFs in the acetic buffer at room temperature and at 50 K, respectively. Black lines show simulated spectra with g- and A-parameters, noted in the text. The inset in panel C shows zoomed-in region of the CW spectrum of Cu(OAc)2 species in the acetic buffer without fibre. Thin orange and yellow lines are simulations for two spectra of Cu(II) with different g- and A-tensors, the black line is a sum spectrum. (B, D) The CW EPR spectra for Cu(II) without and with fibre in the aqueous solvent at room temperature and at 50 K, respectively. Black lines – spectral simulations, see text. | ||
At 50 K (Fig. 2C and D), the EPR spectra of Cu(II) species in frozen glassy solvent reveal the anisotropic features – the resolved hyperfine structure at g||, and partially resolved pattern at g⊥. For Cu(OAc)2 in the acetic buffer, the spectrum is composed of two components with different g- and A-tensors – the difference is pronounced at the g|| component, and weakly resolved at g⊥– Fig. 2C, inset. This points to the variability of coordination geometries of Cu(II) species in the acetic buffer, which have different coordination in the axial direction – by acetate or aqua molecules, and almost the same coordination in the equatorial plane, likely, by two acetate molecules due to more preferable bidentate coordination.34 Nearly axially symmetric collinear g- and A- tensors were determined from simulations: in the aqueous solution, the g = [2.076 2.089 2.408], ACu∥ = 400 MHz, in the acetic buffer g1 = [2.054 2.072 2.300], ACu∥1 = 520 MHz and g2 = [2.070 2.074 2.357], ACu∥2 = 465 MHz with the fraction of species of type 1 of 20% (solid lines; the ACu⊥ were not resolved from simulations in the frozen state). The tiny rhombicity of g-tensors means the inequivalent coordination of Cu(II) in the equatorial plane. Half-field transitions were not detected at any composition, which indicates the absence of dimeric Cu(II) complexes with strong dipole-dipole interaction.34–36 Note, however, that somewhat asymmetric CW EPR lineshape at RT and the presence of the hyperfine peaks between the main hyperfine peaks of Cu(II) in acetic buffer can be interpreted as partial dimerization.
In both solvents, for fibre-free and fibre-containing compositions, the copper(II) ions must be coordinated by oxygen atoms that can stem from water molecules, fibre hydroxy groups or carboxylic groups of the acetic acid. The clearly different Cu(II) EPR spectra in acetic buffer mean that the bidentate coordination of Cu(II) ions by acetates is more energetically favorable than coordination by water, which in turn is expected to have an impact on the interaction between the metal ions and DFs. Moreover, as acetate ligands have a negative charge, the Cu(OAc)2-(aqua)2 complex is neutral, Cu(OAc)2-OAc-aqua is negatively charged, and the ‘single’ Cu(II) ions in the aqueous solvent have the nominal charge +2 (for both solvents all g|| and A|| satisfy the charge-related limits in the Peisach–Blumberg plot.37 As a trend, coordination by fibre polyol groups, which are negatively charged, should be more preferred for the weaker, positively charged hexaaquo complex than for the stronger, neutral Cu(OAc)2 complex in acetic buffer.
In experiments we observed no difference in CW EPR line shape of Cu(II) for both CuSO4 and Cu(OAc)2 with and without fibres neither at room temperature, nor at 50 K. However, the absence of difference in EPR spectra could be caused by different reasons: either the geometry of coordination shells the solvent, and the interaction constants with the fibre polyol groups are close to those in the solvent, or the coordination by solvent molecules is indeed more preferable than coordination by the fibre hydroxy groups. These situations are indistinguishable by the routine CW EPR but could be revealed by pulse experiments.
The inversion-recovery traces of the electron spin echo signal in the fibre-free and fibre-containing compositions in the aqueous solution at 35 K are shown in Fig. 3A. The longitudinal relaxation time can be roughly estimated as the characteristic time at which signal recovery reaches the level 1−1/e (shown by horizontal dash-dotted line). An example of the best fits for two compositions by single stretched-exponential functions for Cu(II) species in the aqueous solution is also shown in Fig. 3A. In both solvents, the stretching parameter β was at about 0.79 ± 0.1 within studied temperature range. In both solvents, aqueous solution and acetate buffer, the relaxation rate increases when DF particles are added, but kinetics are non-uniform - in the aqueous solvent the enhancement becomes stronger above 30 K – Fig. 3B and C.
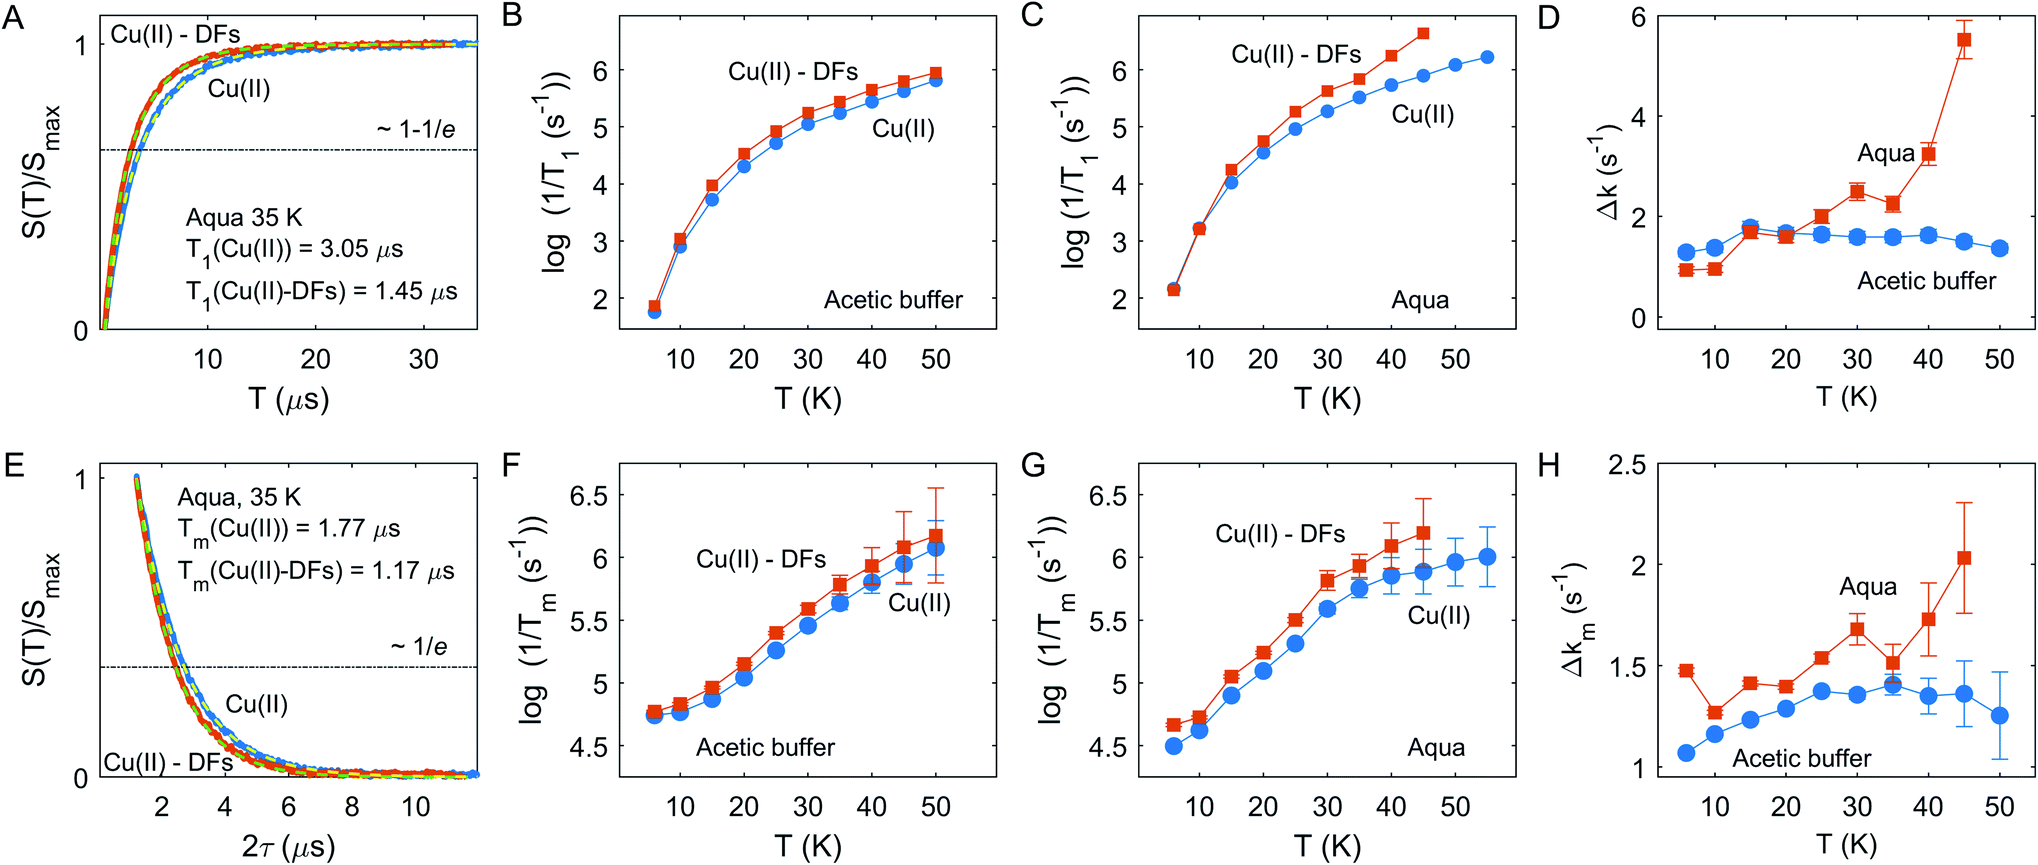 | ||
| Fig. 3 (A and E) Longitudinal (A) and transverse (E) relaxation traces for Cu(II) in aqueous solution with and without DFs at 35 K, Q-band. Dashed lines shows the best fit from single stretched exponential decay. The dash-dotted line shows the 1/e level, crossing of the experimental data with this line indicates the characteristic relaxation time. (B and C) Temperature dependence of the longitudinal relaxation rate for Cu(II) in the acetic buffer and aqua solution with and without DFs. (F and G) Temperature dependence of the transverse relaxation rate for Cu(II) in the acetic buffer and aqua solution with and without DFs. (D and H) The relaxation enhancement effect Δk = 1/T+−1/T−, for the longitudinal (D) and transverse (H) relaxation rates. | ||
A similar trend is observed for the transverse relaxation data, shown in Fig. 3E and G. Since Tm measurements suffer from the Electron Spin Echo Envelope Modulation (ESEEM) effect due to anisotropic hyperfine interaction with nearby nuclei,11 soft detection pulses were used, which limited the measurement sensitivity and resulted in lower accuracy for the Tm measurements above 40 K. As seen from the data, the relaxation enhancement (RE) effect becomes pronounced above 35 K. Note that the Tm relaxation traces were well-fitted by a nearly exponential function with the stretching parameter β at about 1.01 ± 0.1 within the tested temperature range in both solvent compositions with and without DF particles. Typically, for high proton concentrations close to the paramagnetic center, as they are encountered in fully or partially protonated solvents, the Tm traces are described with stretched exponential function with stretching factor β > 1, which results in a characteristic curvature of the Tm decay that we do not observe here. Consequently, the absence of this behavior for fibre-containing samples indicates a rather small local proton concentration in the fibre or a relatively weak absorption capacity of DFs towards Cu(II) ions.
In a case of the relaxation enhancement by the eD mechanism a quantitative analysis would be only feasible if metal-fibre interaction is strong enough to ensure almost complete absorption of paramagnetic metal ions by DFs, so that the eD mechanism dominates over other electron spin relaxation mechanisms. Similarly, the HFI mechanism depends on the proton concentration within 1–2 nm range around the paramagnetic center,40,41 the corresponding relaxation enhancement effect could be rather weak due to the relatively low local proton concentration in the fibre (section “The strategy to characterize the DF interactions”).
We thus semi-quantitatively evaluated the RE effect due to Cu(II) incorporation into DFs by computing a difference of the characteristic relaxation rates: Δk = 1/T+ −1/T−, where T+ and T− are relaxation times in the presence and absence DF particles, for both solvents and T1 and Tm relaxation times, as shown in Fig. 3D and H. Both for T1 and Tm chart it is seen that the change of Cu(II) relaxation in the aqueous solution upon addition of DFs starts to rapidly increase above 35 K, whereas no such clear onset is visible for the acetate buffer case. Most likely, the local concentration of Cu(II) ions in DFs is sufficiently high for self-accelerating dipolar-driven relaxation enhancement42,43 as soon as the intrinsic Cu(II) relaxation starts to increase above a certain threshold, which is around 35 K here. The presented longitudinal and transverse RE data would be consistent with an assumption that in case of aqueous solution the local concentration of Cu(II) ions is enhanced compared to the corresponding uniform concentration in the absence of DFs. In contrast, in the acetic buffer the DFs admixture does not alter significantly the local concentration of Cu(II) species.
We also checked whether different Cu(II) species in our samples can be separated by a relaxation filter.44 Due to the only moderate differences in relaxation between Cu(II) in DFs and in the solution, such separation was impossible, as shown in the Fig. S2,† on the example of Q-band data at 20 K.
Specific aim II: evaluation the DFs absorption capacity
Since the steepness of the dipolar decay is a product of the spin-flip probability of the coupling partner and the characteristic strength of dipolar interaction, small differences in local concentration can be better detected at long dipolar evolution times. The short (dipolar evolution time τ2 ∼ 2 μs), intermediate (τ2 ∼ 4 μs) and long (τ2 ∼ 8 μs) RIDME traces were measured for both types of solutions without and with DFs, as shown in Fig. 4A and B and in ESI Fig. S3.† Oscillations at the initial part of dipolar evolution traces up to the time of 0.5 μs for the short RIDME traces are caused by incompletely suppressed ESEEM, the spike at T = 0 is an echo-crossing artifact which is not fully eliminated by phase-cycling.57 As seen in Fig. 4A and B, in presence of DFs the RIDME decay in the aquatic solvent is substantially accelerated, while in the acetic buffer the impact of DFs is less pronounced.
 | ||
| Fig. 4 RIDME decays for Cu(II) at 0.312 mM concentration with (orange) and without (blue) DFs in the acetic buffer (A) and aqueous solvent (B). C) RIDME decays for Cu(II) at 0.312 mM concentration in the deuterated aqueous solution at 6.8 mM (blue) and 1.38 M (orange) bulk proton concentration, at Cu(II) 1 mM concentration with (purple) and without (yellow) DFs. | ||
For quantitative characterization of the DFs impact on the RIDME decay acceleration, the RIDME shape was fitted by the mono-stretched exponential decay function exp(−(kT)d/3) and the best-fit parameters of the dimension parameter d and the decay constant rate k are summarized in the Table S1 (details are given in ESI†). The contrast in the RIDME decay can be quantified as  , where k+ and k− is a RIDME constant decay with and without fibre, respectively. The RIDME decay contrast for DF particles in the acetic buffer is κ = 0.058 and only slightly varies with the τ2 value, whereas in the aquatic solvent the κ value decreases with increasing the trace length: κ = 0.21, 0.14, and 0.11 for τ2 = 2, 4, and 8 μs, respectively.
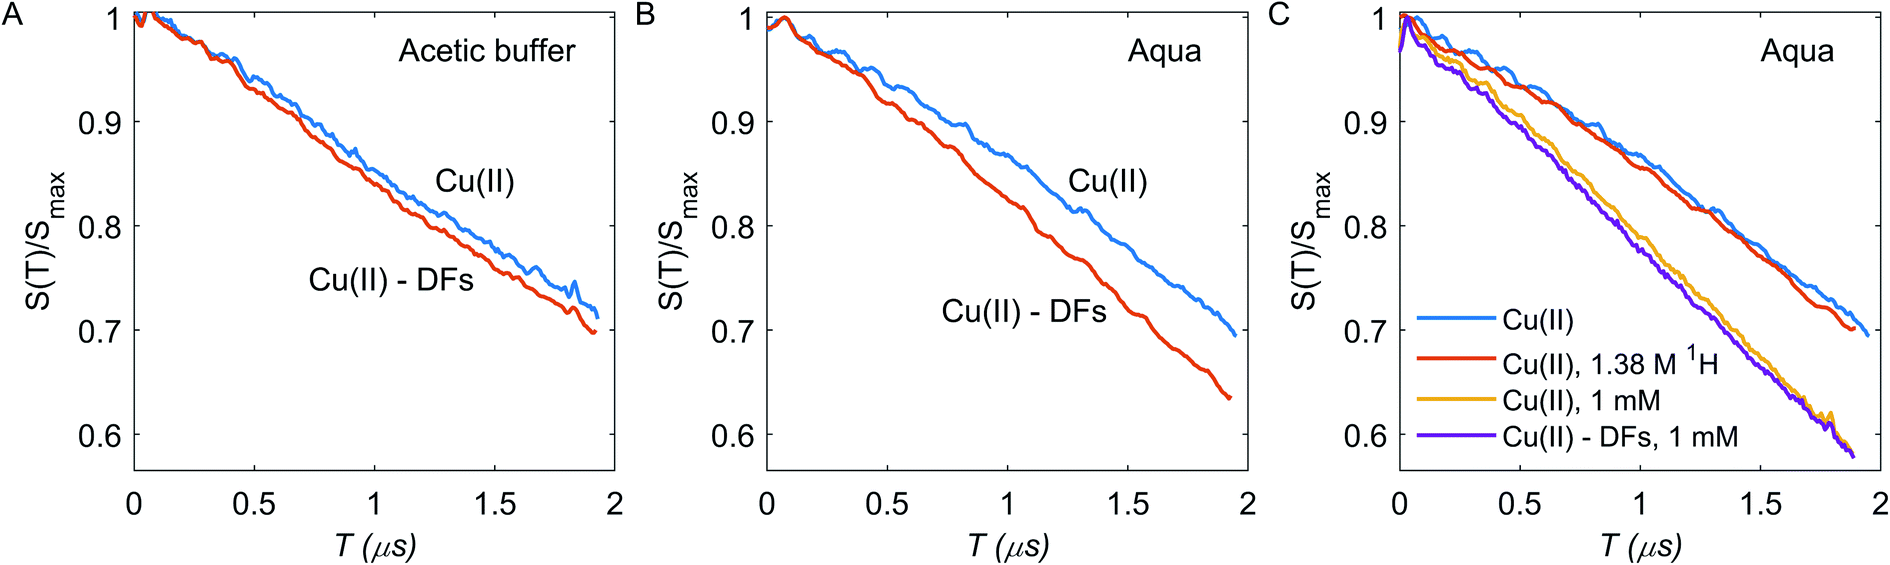
RIDME measurements were performed at constant ratio Tmix/T1 = 1.3 to keep spin-flip probability during mixing time constant across the different samples. For aqueous solution, the increase in the decay time constant after adding fibre is significant, indicating that Cu(II) ions bind to the DF with enhanced local concentration in the DF. Note that if there are two fractions of Cu(II) ions, a first one with higher local concentration and thus also higher transverse relaxation rate and a second one with lower local concentration and lower transverse relaxation rate, the contribution of the first fraction will decrease with increasing duration of the pulse sequence. This is what we indeed observe for aqueous solution. In contrast, with acetic buffer we do not observe this effect and RIDME decay rate enhancement is generally weak. In fact, the RIDME decay enhancement by addition of DFs has two possible contributions: (i) an increase in local Cu(II) concentration; (ii) enhanced nuclear-driven (ND) spectral diffusion due to the increasing of the local proton concentration in sample with DFs.27,51 These contributions are distinguishable at least in principle. For contribution (i) the fraction of absorbed Cu(II) species is a product of the fibres binding capacity and the DFs concentration; if Cu(II) concentration strongly exceeds the capacity of the DFs to absorb Cu(II) ions, there should be a large fraction of free Cu(II) ions and the difference between fibre-free and fibre-containing samples should be minor. Thus, samples with higher Cu(II) concentration of 1 mM were tested. The case (ii) assumes the increasing of bulk and local 1H concentration for samples with DFs to 141 mM in the DF, which is a sum of proton contamination of 2H2O (∼6 mM), water traces in DFs (∼14 mM), exchangeable protons from DFs (∼54 mM), and non-exchangeable protons from DFs (∼67 mM), assuming them to be spheres of a radius 31.5 nm, and to contain one BBG chain per particle with a homogeneous proton concentration inside DF particle. To test this mechanism, the fibre-free sample with artificially increased bulk proton concentration up to 1.38 M was tested, which corresponds to aggregation of ten DF chains in one particle.
Enhancement of RIDME decay due to the proton-driven spectral diffusion does not appear to be significant at any τ2 time (Fig. 4C): the RIDME contrast κ ≈ 0.028 is much smaller than the one observed upon addition of DFs. Therefore, nuclear spectral diffusion cannot explain our results, leaving ion absorption by the DFs as the only explanation. Clearly, in the acetic buffer, the same outcome is anticipated.
In the deuterated aqueous solvent, while the RIDME decay change upon addition of DFs is pronounced at 0.312 mM bulk Cu(II) concentration, at 1 mM Cu(II) bulk concentration contrast is much weaker at κ ≈ 0.032 (Fig. 4C). For the samples without DFs, increasing the bulk concentration about 3 times increases the fitted RIDME decay constant only 1.48 times (Table S1†). This points to the filtration of the fast relaxing part of Cu(II) species in the RIDME experiment at 1 mM spin concentration. For systems with inhomogeneous distribution of paramagnetic centers in the space, the T1 and T2 times might be significantly different for different paramagnetic centers of the same type. Thus, the relaxation-induced filtration of observer spins can potentially affect the dipolar decay shape.44,45,58,59 For all studied Cu(II) samples the decay rate k decreases upon increasing the t2 duration, which is clearly due to the mentioned RIDME signal filtration: elongation of t2 enhances the contribution from the long-lived Cu(II) centers to the RIDME signal.27
To summarize, the pronounced RIDME decay rate escalation in the aqueous solvent and the less pronounced RIDME decay acceleration in the acetic buffer indicate different extent of Cu(II) ions absorption by DFs in these two cases. The RIDME decay contrast is a measure of Cu(II) absorption capacity of the DFs. However, this value is biased by filtration effects, due to the distribution of transverse decay times.
For the disordered system under consideration, we can assume the absence of any orientation selectivity in the Cu(II)–Cu(II) pairs. The DEER experimental setup is shown in Fig. 5A, while DEER traces are shown in Fig. 5B. The DEER decay enhancement for Cu(II)-fibre composition in the aqueous solvent is seen – the decay rate is 13.8 ms−1 in the fibre-free and 18.1 ms−1 in the fibre-containing sample; in the acetic buffer the enhancement effect is minor – the decay rate is 10.3 ms−1 and 11.2 ms−1 without and with fibre respectively.
 | ||
| Fig. 5 (A) Echo-detected EPR spectrum in frequency domain for Cu(II) in the aqueous solvent without DFs. The inset shows a zoom-in of the g⊥ component for fibre-free (blue) and fibre-containing (orange) samples in the aqueous solvent, where the colored area shows the excitation profile by detection and pumping pulses. (B) DEER traces for fibre-free and fibre-containing samples in the acetic buffer and the aqueous solvent. Traces for the aqueous solvent are shifted downward by 0.1 for clarity. (C) The dipolar contrast κ in DEER (orange) or RIDME (shades of cyan from dark to light encode dipolar evolution times of 2, 4, and 8 μs). | ||
The equation for DEER background decay rate for a homogeneous distribution in the three-dimensional space is:23
| V(T) = exp(−αpBCT) | (2) |
An important parameter in the eqn (2) is the fraction of spins inverted by the pump pulse pB, which is determined by length and strength of the mw pulse and by the shape of the EPR spectrum.48 Since we used the commercial Bruker MS3 resonator with almost uniform B1-profile along the sample,61 the estimated pB values are 0.049 ± 0.003 for Cu(II) in the aqueous solvent and 0.039 ± 0.002 for Cu(II) in the acetic buffer at our experimental conditions. The DEER decays at different dipolar evolution times were measured to test the τ2 filter effect of the decay rate (ESI, Fig. S4†). Due to this effect, the decay rate varies within 10% as τ2 is varied between 5.2 and 22.2 μs, but as seen in the Fig. S4B,† the DEER decay contrast κ is almost the same at different τ2 values. In order to obtain a lower bound for local Cu(II) concentration, we used the maximal decay rate value. Neglecting a change in sample volume upon vitrification (which is small, but which we don't accurately know), eqn (2) gives a concentration of 276 ± 18 μM for Cu(II) in fibre-free sample in the aqueous solvent and 258 ± 20 μM in the acetic buffer. Both values are close to the anticipated Cu(II) concentration of 312 μM. The decay rate contrast upon adding DFs was calculated as described above and is κ = 0.21 in the aqueous solvent and κ = 0.09 in the acetic buffer. Note, the k, d and κ values also have a τ2-dependence as shown in Fig. S4,† which is less pronounced in the DEER experiment as compared to RIDME. A comparison of κ values for DEER and RIDME in the aqueous solvent and acetic buffer is given in Fig. 5C. One can notice that the κ values from the shortest RIDME traces approach the κ value from the corresponding DEER data. Thus, the data from both these techniques can be used in the same way in modelling, however with a note of still some stronger bias in the RIDME data.
Estimating the Cu(II) absorption capacity of DFs by modelling PDS data
The presented analysis is based on the DEER results, which are less sensitive to spin echo filtration effects, as compared to RIDME. Note the above mentioned possibility to use the RIDME data in the same way, if e.g. DEER traces cannot be measured with good signal-to-noise ratio. Since the transverse relaxation times do not significantly differ at 10 K temperature, used for DEER measurements, we neglect the differences in the Tm relaxation rate for metal ions localized in the DF particles and metal ions in the solution. We also did not include the excluded volume effect for metal ions.24,62 For the modelling we make the simplifying assumption that the sample volume consists of the ‘fibre spheres’ of about the radius of gyration of DFs and of the ‘solvent bulk’ that contains no DFs.The distribution of Cu(II) species was constructed in the following way: the x fraction of all ions was localized within randomly placed spheres, and the (1 − x) fraction corresponded to uniformly distributed ions over the entire space, inside and outside of the DF particles. No excluded volume was considered while randomly placing the DF spheres, i.e. their overlap was allowed. Inferring the fraction of bound metal ions from the contrast value κ requires an assumption on the filling factor v. Thus, the v value was calculated by the Monte Carlo approach for a given radius of the individual DF particle and the fibre concentration in the assumption of permeable spheres. The physical radius of such spheres was considered from the Rh value and had the Gaussian distribution with a width of 1.75 nm, corresponding to the polymer polydispersity value (PD = 1.36), according to the SEC data (Fig. S1†).
Such a distribution at v = 0.1, C0 = 75 μM and x = 0.5 is shown in Fig. 6A, parameters were chosen for convenient visualization. Then, for a given distribution of DF particles, one can calculate the pair Cu(II)–Cu(II) distance distribution function P(r). Depending on the x value, the P(r) function transforms from the normal to the bimodal distribution, which is better seen for the function G(r) = P(r)/r, Fig. 6B. This transformation affects the shape of the dipolar trace, causing transformation from an exponential decay to a compressed exponential decay with dimensionality d < 3 at increasing x value – Fig. 6C. Since the unknown value of the fibre filling factor obstacles the evaluation of the capacity of the individual DF particle to the metal ion absorption, the v value was varied from 0.01 to 0.7 (i.e., at fixed radius of the DF particle, the concentration of particles was varied). The evaluated decay constant rate k and dimension parameter d at sweeping both x and v parameters are shown in Fig. 6D and E. As seen in this figure, for a given pair (x, v) the parameters of the dipolar trace are unique: both decreasing the fibre filling factor ν and increasing the fraction x of absorbed ions results in a drastic increase of decay rate k and monotonous decreasing of the dimension parameter d.
 | ||
| Fig. 6 Results of simulations of heterogeneous spins distribution in composition with DF particles. (A) The demonstration of the heterogeneous spins distribution. (B) The G(r) = f(r)/r function at different x values, v = 0.1. (C) Dipolar traces for G(r) functions, shown in panel (B) with the same color code. The numbers near the curves are fitted dimensional parameters d. (D and E) The decay constant rate k (D) and dimension parameter d (E) for dipolar traces at different v and x values. The grey line in panel (E) shows the boundary for dimension parameter d > 2.65 or d < 2.65 (below and above the line, respectively). (F) Dependence of the dipolar contrast on v and x values. Highlighted areas correspond to κ = 0.09 and 0.21. | ||
In our DEER results, we observe reduction of d below 3 in the aqueous solvent, while such reduction is almost absent in the acetic buffer. A pronounced transformation from the mono-exponential to the stretched exponential decay is detectable at about d = 2.6–2.7, therefore, the highlighted area in Fig. 6D demonstrates the cutoff at d = 2.65. The contrast κ as a function of x and ν is shown in Fig. 6F. For the case of high binding affinity (x → 1), the abrupt increase of the contrast is a result of decreasing the dimension parameter. This situation is hard to access in experimental measurements due to expected appearance of relaxation-induced filtration effects, which would cause a decrease in the apparent decay constant rate. Note, however, that in such a situation other experiments (T1, Tm measurements) would reveal a much more pronounced difference between DF-free and DF-containing samples than we observe. Thus, the ν values below 0.2 do not match our relaxation data, and ν values above 0.6 do not match the low viscosity of the samples used (the viscosity of DF solution starts to increase at about double the concentrations that we used in this study). Now, assuming the certain contrast value, one can estimate the fraction x of the bound metal ions at a given filling factor ν (see – highlighted areas in Fig. 6F, which correspond to κ = 0.21 (in the aqueous solvent) and κ = 0.09 (in the acetic buffer). For the aqueous solution ν = 0.2 corresponds to x = 0.23 and ν = 0.6 corresponds to x = 0.46. For the acetic buffer, these values are, accordingly, x = 0.14 and 0.21. These values correspond to Cu(II) absorption capacity of BBG DFs between 24.7 μM g−1 and 49.4 μM g−1 for the aqueous solution (up to one Cu(II) ion per 125 sugar monomers) and between 15 μM g−1 and 22.6 μM g−1 for the acetic buffer case (up to one Cu(II) ion per 273 sugar monomers). Thus, taking the upper estimate for the Cu(II) capacity, the amount of bound Cu(II) per one DF chain is about 9–10 metal ions in the aqueous solvent, and about 5–6 metal ions in the acetic buffer, or, in other words, about 60% excess of the local Cu(II) concentration in the case of the aqueous solvent. Regarding the above estimate that for the spheres with radius 31.5 nm and concentration 16.25 μM, i.e. assuming each DF particle consisting of a single BBG chain, the volume filling factor ν would be 1.24, the value ν = 0.6 corresponds roughly to two BBG chains per DF particle and ν = 0.2 corresponds roughly to six BBG chains per DF particle.
Note, that the change in the DEER decay constant has two contributions: the increase of Cu(II) concentration inside DF particles and the depletion of the Cu(II) concentration in the bulk of the solvent. This qualitatively explains the relatively large average decay constant change for the moderate change of the Cu(II) capacity. This feature also leads to a rather weak correlation between the fraction of bound Cu(II) ions and the filling factor in these simulations. This allowed us to reasonably estimate x without accurately knowing the filling factor ν in these partially aggregated samples.
Note also that in these simulations, we did not consider excluded volume of DF particles, i.e. individual spheres were allowed to overlap. Furthermore, in clusters of overlapping spheres constant shape and radius of the DF particles was assumed. Another simplification in such a simulation is the solid sphere-like architecture of the DF particle, with a concentration jump at the surface of the sphere. For polymers, the random chain conformation due to the chain random walk forms locally ravelled structures – the so-called blobs.32 The number of blobs and their tightness depend on the chain chemical composition and the flexibility in the monomers connections. But on the microscopic level, since these blobs have more tight structure, they potentially can work as attractive centres for metal ion coordination due to increased local concentration of OH groups. However, the relevance of local sugar monomer density fluctuations inside DF particles for the DEER data analysis would need to be further elaborated by molecular level simulations of the polymer chain conformational distribution characteristics.
Characterization of the local distribution of sugar moieties around Cu(II) ions
The hyperfine spectroscopy provides information about the type of nuclei and type of bonding within a 0.6–2 nm range from the paramagnetic center. Thus, details of the coordination sphere structure or local concentration of magnetic nuclei could be tested.8,10,11,63–71 Since neutral carbohydrates mostly consist of 1H, 12C and 16O nuclei, the proton signal is the principal information source in hyperfine spectroscopy of DFs. For the case of the metal ion chelation by DFs, 2H ESEEM-based detection of the local concentration change for deuterated solvent molecules most easily proves Cu(II)-DFs interaction.The three-pulse ESEEM signal is a product of the echo decay due to relaxation processes and modulation decay Vn(T), caused by interaction with a nearby nucleus:8,11
 | (3) |
The echo decay trace V(T) for Cu(II) ions in aqueous solution without DFs is shown in Fig. 7A. The 2H ESEEM signal is conveniently analyzed in the frequency domain – Fig. 7B. The corresponding 2H lineshape consists of a broad line (AB, its intensity was measured here at 1.7 and 2.7 MHz, Fig. 7B), and a narrow line (AN) with a splitting due to NQI with remote 2H nuclei, eqn (1).31 The broad line stems from strongly coupled nuclei, in our case, from 2H nuclei bound to atoms that directly coordinate to the Cu(II) ions. The narrow line AN value, which we used for analysis, reflects the local water concentration around Cu(II) ions in the distance range between about 5 to 20 Å, and the NQI splits it into the doublet.41,31
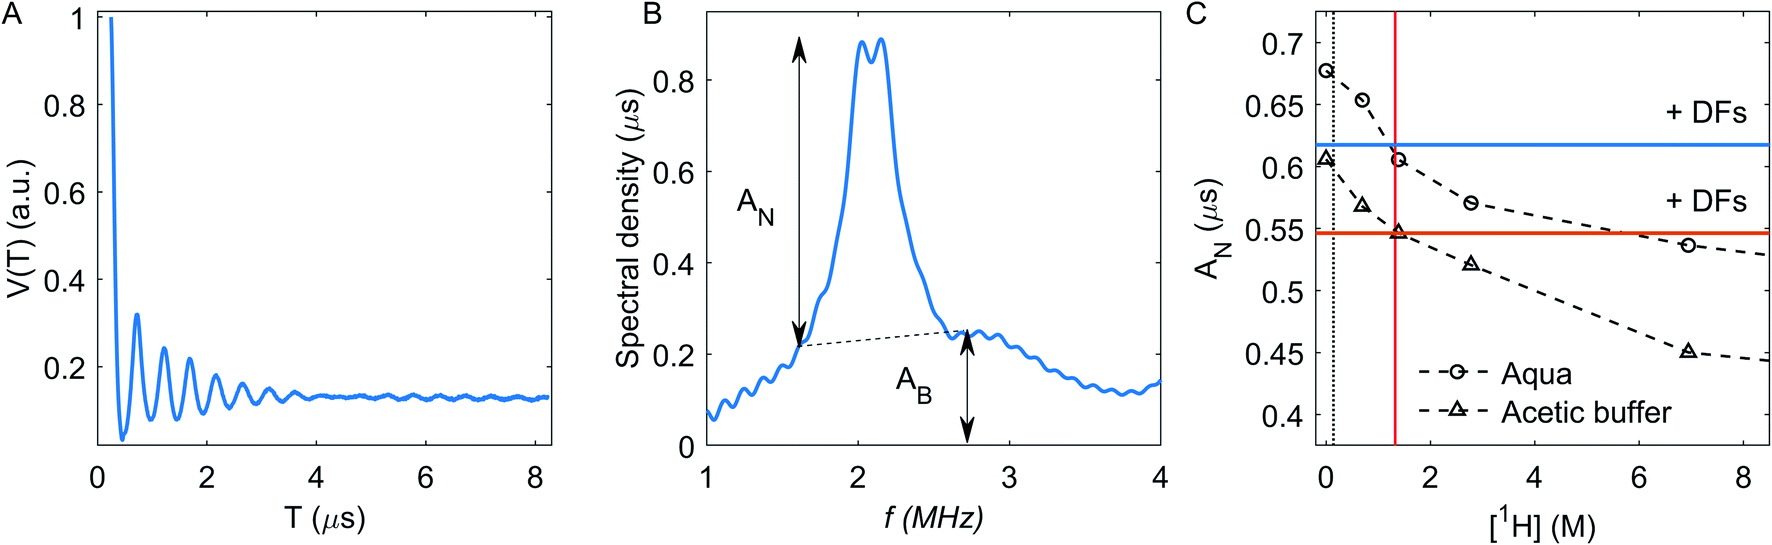 | ||
| Fig. 7 (A) 2H ESEEM time trace for Cu(II) without DFs in aqueous solution. (B) The modulus-Fourier transformation of normalized 2H ESEEM decay. Dashed line shows boundary for intensity of the narrow line (AN) determining. (C) The 2H ESEEM calibration curve for Cu(II) in acetic buffer (triangles) and in aqueous (circles) solutions. The dotted line shows the estimated overall possible local proton concentration in DFs. Horizontal solid lines show the AN value in mixture with DFs in the aqueous solution (blue) and the acetic buffer (red). The vertical solid red line corresponds to 1.325 M bulk 1H concentration. | ||
The AN-dependence on the bulk concentration of protons has the same trend in the aqueous and the acetic buffer solutions – Fig. 7C. The vertical shift between aqueous and acetic buffer values is caused by protonated methyl groups in the acetate, which shield the coordination of the Cu(II) ion by solvent molecules and thus decreases intensity of 2H signal. The vertical black dotted line in Fig. 7C corresponds to the proton concentration of 141 mM. estimated as an in-fibre proton concentration (see Section RIDME). The crossing point of this vertical line with the calibration curves correspond to the estimated 2H ESEEM signal for compositions with DFs. A decrease of the 2H signal after fibre addition is indeed observed for both solvents and it corresponds to a much larger bulk 1H concentration of ∼1.325 M on the calibration curve.
The decrease of the 2H ESEEM signal intensity evidences a change in the local chemical surroundings of Cu(II) species, which is mainly due to the Cu(II) coordination by DF hydroxy groups that substitute for water molecules and exclude uncoordinated water in the proximity of Cu(II). The initially present 4% of protonated water in the DFs72 does not play a significant role in this ESEEM signal change, as this results in a negligibly small change of the bulk deuteron concentration in the solvent.
A somewhat more accurate estimate of the fraction of 1H atoms around the bound metal ions can be obtained from the decrease of the 2H ESEEM signal as:
| AexpN = (x + v(1 − x))A+N + (1 − x) (1 − v)A−N | (4) |
Specific aim 3: characterization of DFs binding site(s)
A further question addressed by hyperfine spectroscopy is the characterization of the coordination sphere for metal ions bound by DF particles. In the point dipole approximation, the electron-nuclear hyperfine interaction tensor is described as a combination of an isotropic term and an anisotropic dipolar term:|
A = aiso + Tdip(3cos2θ − 1)
| (5) |
The Cu(II) ion coordinated by six water molecules is a classic example of distorted symmetry of the coordination shell due to the Jahn–Teller effect:6 there are two water molecules with Cu(II)–O distances of 2.30 Å along the axial coordination, and 4 water molecules with a square planar geometry with Cu(II)–O distances are of 1.97 Å in the equatorial plane.73–75 Since the 1H ENDOR spectrum in the frozen aqueous solvent has pronounced turning points – Fig. 8A, simulation of 1H spectra assuming the axial and dipolar tensor for all protons was feasible and gave values close to the reported previously:75 the Teq = [−5.12 10.24] MHz at g丄 and the isotropic constant aeq = 2.1 MHz for equatorial protons, for axial protons the Tax = [−3.35 6.7] MHz at g丄 and aax = 1.55 MHz was fitted. For protons in the second and third coordination shells, isotropic couplings are negligible and their HF parameters report on Cu(II)–H distances of about 4.6 and 6.5 Å, as shown by simulations in Fig. 8A by black solid lines. Note, that in our simulations of remote and equatorial protons had no restrictions on the orientation between the HF tensor and the quantization axis, while for axial protons canonical orientations were suppressed to provide the good fit (θ = 10–20° at g丄, θ > 50° at g॥).
 | ||
| Fig. 8 (A and B) Davies ENDOR spectra at g丄 and g║ detection positions for CuSO4 in the protonated aqueous solvent without DFs (A), and in the deuterated aqueous solvent with DFs (B). The simulated spectrum for protons from the coordination shell is shown by dash-dotted lines, for protons in the following coordination shells – by black solid lines. The arrows in panel (B) shows two types of proton nuclei in the vicinity of Cu(II) species – the type I corresponds to weakly coupled protons, the type II – to strongly coupled nuclei. (C) Davies ENDOR spectra at the g丄 detection positions for Cu(OAc)2 without and with DFs in the deuterated acetic buffer (protonated acetate). (D) Davies ENDOR spectrum for compositions with DFs – CuSO4 in the deuterated acetic buffer with deuterated acetate at the g丄 detection position. | ||
The 1H ENDOR spectrum for the Cu(II)-fibre composition in the aqueous solvent is also explained by two distinct groups of protons – Fig. 8B. The first group (label I in the figure) has the narrower pattern with singularities at 0.92–1.4 MHz (partially resolved at g丄), which could be simulated by overlapping proton signals with Cu(II)–H distances in the range 3.6–3.1 Å, assuming that the isotropic contribution is negligible. The weak hyperfine couplings and corresponding distances larger than 3 Å for these protons point to their placement around the second coordination shell of Cu(II) ions. It is natural to assign this part of the ENDOR signal to the glucan protons that are remote from the directly coordinated hydroxy groups. The second group of protons manifests a pair of broad ENDOR lines split by approximately 11–12 MHz without pronounced turning points (label II in the figure). The presence of such strong broadening indicates a broad distribution of HFI parameters. Combined with the low signal-to-noise ratio at the g║ orientation the broadening allows only for rough estimate of the Cu(II)–H hyperfine coupling. If one assumes the non-distributed value of the isotropic HF part, and that the signal from protons of type II is not suppressed by orientation selectivity, the width of about 4 MHz allows estimating the upper limit of Cu(II)–H distances to be about 3.4 Å, while for a case of orientation selectivity, the Cu(II)–H distances would be even shorter. If we assume the distributed isotropic coupling, the width of the a-distribution should be the same at both g丄 and g║ components and is about 2 MHz, and the upper limit of Cu(II)–H distances could be estimated as 4.2 Å, assuming the line at g丄 has no orientations suppressed.
Some feasible speculation about the groups, responsible for Cu(II) coordination, could be done from the decomposition of the 1H ENDOR signal into such fractions of protons of types I and II, which gave integral weights of about 70% and 30%, respectively. As we used a sufficiently long inversion pulse and a probe head with approximately linear decrease of RF field with frequency, which cancels hyperfine enhancement, we can use the integral ratio as a rough estimate for the ratio of the number of protons of types I and II. Such integrals have though a relatively large uncertainty due to hyperfine contrast selectivity. There are seven non-exchangeable 1H nuclei in the carbohydrate ring (structure in Fig. 1A). Assuming that only the hydroxymethyl side chain can act as a chelator moiety for Cu(II) ions, we obtain a very similar ratio of the near proximity protons with respect to the remote protons, which is 2/7 ≈ 29%. Thus, based on the 1H ENDOR data we can speculate that Cu(II) coordination occurs preferentially by the glucan hydroxymethyl side chains. In this case, only one out of three possible hydroxy groups from the glucan monomer is responsible for the Cu(II) coordination, which explains the reduction in the number of accessible OH groups and which would help explaining the low amount of Cu(II) ions bound by DF particle. The proposed structure differs from the one described for sugar monosaccharides, where for β-glucan the coordination by hydroxy group at 1st carbon position and oxygen from the sugar ring was proposed.76 Since for DFs the polymerization link is between 1-3 or 1–4 positions, the participation in coordination of oxygens from polymerization links is unlikely. However, the close type of coordination – the hydroxymethyl and hydroxy groups were proposed for fructose in the same work. Further comparison of DF particles with and without hydroxymethyl group, or with different (ax–eq–ax) orientation of neighbor hydroxymethyl and hydroxy groups in the carbohydrate structure (for example, xyloglucan, arabinoxylan, and galactomannan) could test this suggestion.
1H ENDOR spectra in protonated acetate are almost the same in the absence and presence of DFs – Fig. 8C. The 1H pattern with pronounced turning points at g丄 and g║ orientations points to the absence of the wide Cu(II)–H distance distribution (i.e. equivalent nuclei), while the suppression of the spectrum at g丄 at 2–4 MHz points to the orientation selectivity. In principle, the planar bidentate coordination of Cu(II) ions by two OAc groups, with isotropic and anisotropic terms in the HF tensor is consistent with the observed 1H pattern. However, in the presence of DFs an additional weak signal is seen at 1.5–2 MHz. To eliminate the signal from OAc methyl groups, a sample with DFs in deuterated OAc was tested (only the g丄 signal is shown in Fig. 8D). The 1H pattern of type-I protons at around 0.92–1.4 MHz is then observed, while the signal at 5.5–6 MHz, which is attributed to coordination by hydroxymethyl groups, is nearly absent in the acetic buffer.
Overall discussion of the Cu(II)-fibre interactions
For DFs in aqueous solvent, the EPR data presented here are well-consistent and prove the presence of the interaction between Cu(II) ions and DF particles: (i) transverse and longitudinal relaxation rates are significantly enhanced in the presence of DFs; (ii) PDS data demonstrate heterogeneous local Cu(II) concentrations, indicating preferable absorption of the metal ion by fibre, with a capacity of barley β-glucan DFs for binding up to 1 Cu(II) ion per 125 glucan monomers; (iii) decrease of the 2H ESEEM signal points to a change of the local surrounding of Cu(II) ions; (iv) the appearance of new 1H ENDOR signals in the presence of DFs allows to propose that the glucan hydroxy groups are responsible for Cu(II) coordination. Both PDs and ESEEM results imply certain degree of BBG aggregation, possibly substantially overestimated in the case of ESEEM due to the local character of these data.The situation is less clear cut in acetate buffer. Interaction of Cu(II) with DFs was evidenced by 2H ESEEM and 1H ENDOR, and PDS data indicate binding of up to 1 Cu(II) ion per 273 glucan monomers, which is similar but somewhat lower than the binding capacity in aqueous solution. However, relaxation was not significantly enhanced by adding DFs to Cu(II)-containing acetate buffer. The quantitative difference in Cu(II) binding to DFs is obviously caused by more stable coordination by the OAc groups.
At a concentration of Cu(II) of 312 μM and of studied DFs – barley β-glucan, of 16.25 μM (∼1100 monomers per Df chain), there are approximately 58 glucan monomers to 1 copper ion. Thus, even at a large excess of sugar monomers and accordingly an even larger excess of potentially coordinating hydroxy groups, a significant fraction of the Cu(II) ions remains unbound. This is not entirely unexpected, as water molecules are good competitors for hydroxy groups as Cu(II) ligands. Preferential binding by DFs arises from the chelate effect, which may not be very strong for β-glucan as it does not feature vicinal hydroxy groups. Another feature of the lowered binding capacity is caused by polymer stiffness. Indeed, dimeric Cu(II) species were detected at pH 5.0 in composition with different mono and disaccharides,35 which points to the high potential of the complexes formation by simple saccharides, while the polymer stiffness reduces the probability for two monomers to form a stacked structure.
Сonclusions
In this work, we demonstrated the applicability of EPR spectroscopy to characterize the interactions of transition metal ions with dietary fibres, on the example of Cu(II) interactions with barley β-glucan. A combination of CW EPR, relaxation measurements and 2H ESEEM as well as RIDME spectroscopy can serve for a fast screening of different DFs to find parameters which impact the metal ion-fibre interactions. More detailed information can be gathered with DEER and 1H ENDOR combined with numeric simulations. In particular, partitioning of metal ions between solvent and DF particles and binding site structure can be assessed, which helps to understand the mechanisms of the interaction.The spectroscopic data from all mentioned EPR techniques indicate that Cu(OAc)2 species in the acetic buffer do not dissociate and are taken up by DFs as a whole complex, and possibly even in some amounts as dimers. In contrast, Cu(II) hexaaquo complexes in the aqueous solution incorporate into the DFs by losing some of the coordinated water molecules and substituting them by directly coordinated –OH moieties from sugar chain. Complexation by acetate interferes with Cu(II) absorption by dietary fiber, which decreases the absorption capacity of Cu(II) ions from about 49 μmol g−1 for hexaaquo complexes, to about 23 μmol g−1 for Cu(OAc)2 species (upper estimates are taken).
The proposed methodology now opens the possibility for systematic research of interactions of different paramagnetic metal ions or spin labeled small molecules with dietary fibres composed of different monosaccharide types and with different overall chain architectures. Finally, one can anticipate that better knowledge of the metal ion affinity to DFs will allow using the native fibres for diet correction at different types of metal deficiency or poisoning, while the chemical modification of the DFs may tune their capacity for metal ion absorption. Importantly, many aspects of the proposed methodology would be applicable to many other unstructured polymers, well beyond the dietary fibre studies.
Author contributions
L. N., M. Y. and V. S. designed research, V. S. conducted experiments and simulations, V. S. and M. Y. analysed EPR data and simulations, all authors discussed results and wrote manuscript.Conflicts of interest
There are no conflicts to declare.Acknowledgements
Authors are thankful to Dr Katharina Keller for help in first RIDME experiments, Rene Tschaggelar for help with the hardware, and to Prof. Gunnar Jeschke, Dr Samy Boulos, and Dr Cristina Lupo for discussions and advice. Authors are thankful to Boris Syarov for assistance with CW EPR measurements. The work was supported by the European Research Council (ERC), under the European Union's Horizon 2020 research and innovation program (Grant agreement No. 679037).References
- M. Elleuch, D. Bedigian, O. Roiseux, S. Besbes, C. Blecker and H. Attia, Dietary fibre and fibre-rich by-products of food processing: Characterisation, technological functionality and commercial applications: A review, Food Chem., 2011, 124(2), 411–421 CrossRef CAS
.
- P. Gunness and M. Gidley, Mechanisms underlying the cholesterol-lowering properties of soluble dietary fibre polysaccharides, J. Funct. Foods, 2010, 1(2), 149–155 RSC
- J. Salas-Salvadó, M. Bulló, A. Pérez-Heras and E. Ros, Dietary fibre, nuts and cardiovascular diseases, Br. J. Nutr., 2006, 96(S2), S45–S51 CrossRef PubMed
- D. Aune, D. S. Chan, R. Lau, R. Vieira, D. C. Greenwood, E. Kampman and T. Norat, Dietary fibre, whole grains, and risk of colorectal cancer: systematic review and dose-response meta-analysis of prospective studies, BMJ [Br. Med. J.], 2011, 343, d6617 CrossRef PubMed
- G. De Rijck and E. Schrevens, Anionic speciation in nutrient solutions as a function of pH, J. Plant Nutr., 1999, 22(2), 269–279 CrossRef CAS
- B. N. Figgis and M. A. Hitchman, Ligand field theory and its applications, New York, Wiley-Vch, 2000, p. 158 Search PubMed
- S. J. Debon and R. F. Tester, In vitro binding of calcium, iron and zinc by non-starch polysaccharides, Food Chem., 2001, 73(4), 401–410 CrossRef CAS
- W. B. Mims, J. Peisach and J. L. Davis, Nuclear modulation of the electron spin echo envelope in glassy materials, J. Chem. Phys., 1977, 66(12), 5536–5550 CrossRef CAS
- L. Kevan and R. N. Schwartz, Time domain electron spin resonance, Ch. 8, John Wiley & Sons, 1979 Search PubMed
- T. Ichikawa, L. Kevan and P. A. Narayana, Electron spin echo modulation studies of silver atom solvation in methanol. Geometrical model for the methanol solvation shell, J. Phys. Chem., 1979, 83(26), 3378–3381 CrossRef CAS
- S. A. Dikanov and Y. D. Tsvetkov, Electron spin echo envelope modulation (ESEEM) spectroscopy, CRC press, 1992 Search PubMed
- World Health Organization, Guidelines for Drinking Water Quality, V 2. Health Criteria and Other Supporting Information, 1998, 2nd edn, Geneva, Switzerland, World Health Organization Search PubMed
- J. D. Cuppett, S. E. Duncan and A. M. Dietrich, Evaluation of copper speciation and water quality factors that affect aqueous copper tasting response, Chem. Senses, 2006, 31(7), 689–697 CrossRef CAS PubMed
- M. Koziolek, M. Grimm, D. Becker, V. Iordanov, H. Zou, J. Shimizu, C. Wanke, G. Garbacz and W. Weitschies, Investigation of pH and temperature profiles in the GI tract of fasted human subjects using the Intellicap® system, J. Pharm. Sci., 2015, 104(9), 2855–2863 CrossRef CAS PubMed
- H. Persson, M. Nyman, H. Liljeberg, G. Önning and W. Frølich, Binding of mineral elements by dietary fibre components in cereals—in vitro (III), Food Chem., 1991, 40(2), 169–183 CrossRef CAS
- S. J. Angyal, Complexing of carbohydrates with copper ions: A reappraisal, Carbohydr. Res., 1990, 200, 181–188 CrossRef CAS
- G. Jeschke, The contribution of modern EPR to structural biology, ETLS, 2018, 2(1), 9–18 CAS
- M. K. Bowman, A. G. Maryasov and Y. D. Tsvetkov, EPR Measurement of the Spatial Distribution of Radiation Damage, in Applications of EPR in Radiation Research, Springer, Cham., 2014 Search PubMed
- S. Schlick, Advanced ESR methods in polymer research, John Wiley & Sons, 2006 Search PubMed
- G. Jeschke and S. Schlick, Spatial distribution of stabilizer-derived nitroxide radicals during thermal degradation of poly (acrylonitrile–butadiene–styrene) copolymers: a unified picture from pulsed ELDOR and ESR imaging, Phys. Chem. Chem. Phys., 2006, 8(35), 4095–4103 RSC
- D. Hinderberger, EPR Spectroscopy in Polymer Science. [book auth.] M, Drescher. EPR spectroscopy: applications in chemistry and biology, New York, Springer, 2012 Search PubMed
- M. Drescher and M. Drescher, EPR in Protein Science, EPR Spectroscopy: Applications in Chemistry and Biology, New York, Springer, 2012 Search PubMed
- A. D. Milov, A. G. Maryasov and Y. D. Tsvetkov, Pulsed electron double resonance (PELDOR) and its applications in free-radicals research, Appl. Magn. Reson., 1998, 15(1), 107–143 CrossRef CAS
- A. D. Milov and Y. D. Tsvetkov, Charge effect on relative distance distribution of Fremy's radical ions in frozen glassy solution studied by PELDOR, Appl. Magn. Reson., 2000, 18(2), 217–226 CrossRef CAS
- S. Boulos, Mass Spectrometric and Kinetic Investigation of Cereal β-Glucan Oxidation, Doctoral dissertation, ETH Zurich, 2016 Search PubMed
- R. Tschaggelar, B. Kasumaj, M. G. Santangelo, J. Forrer, P. Leger, H. Dube, F. Diederich, J. Harmera, R. Schuhmann, I. García-Rubio and G. Jeschke, Cryogenic 35 GHz pulse ENDOR probehead accommodating large sample sizes: Performance and applications, J. Magn. Reson., 2009, 200(1), 81–87 CrossRef CAS PubMed
- K. Keller, M. Qi, C. Gmeiner, I. Ritsch, A. Godt, G. Jeschke, A. Savitsky and M. Yulikov, Intermolecular background decay in RIDME experiments, Phys. Chem. Chem. Phys., 2019, 21(16), 8228–8245 RSC
- S. Milikisyants, F. Scarpelli, M. G. Finiguerra, M. Ubbink and M. Huber, A pulsed EPR method to determine distances between paramagnetic centers with strong spectral anisotropy and radicals: The dead-time free RIDME sequence, J. Magn. Reson., 2009, 201(1), 48–56 CrossRef CAS PubMed
- K. Keller, A. Doll, M. Qi, A. Godt, G. Jeschke and M. Yulikov, Averaging of nuclear modulation artefacts in RIDME experiments, J. Magn. Reson., 2016, 1(272), 108–113 CrossRef PubMed
- S. Stoll and A. Schweiger, EasySpin, a comprehensive software package for spectral simulation and analysis in EPR, J. Magn. Reson., 2006, 178(1), 42–55 CrossRef CAS PubMed
- A. D. Milov, R. I. Samoilova, A. A. Shubin, Y. A. Grishin and S. A. Dzuba, ESEEM Measurements of Local Water Concentration in D 2 O-Containing Spin-Labeled Systems, Appl. Magn. Reson., 2008, 35(1), 73–94 CrossRef CAS
- M. Rubinstein and R. H. Colby, Polymer physics, New York, Oxford University Press, 2003, p. 23 Search PubMed
- P. G. De Gennes, Scaling concepts in polymer physics, Cornell University Press, 1979 Search PubMed
- P. Sharrock and M. Melník, Copper (II) acetates: from dimer to monomer, Can. J. Chem., 1985, 63(1), 52–56 CrossRef CAS
- A. D. Toy, T. D. Smith and J. R. Pilbrow, An electron spin resonance study of dimer formation by the copper (II) chelates of polyhydroxycarboxylic acids, J. Chem. Soc. A, 1971, 2925–2929 RSC
- P. K. Ross, M. D. Allendorf and E. I. Solomon, Detailed spectral studies of copper acetate: Excited-state interactions in copper dimers, J. Appl. Chem. Sci., 1989, 111(11), 4009–4021 CAS
- J. Peisach and W. E. Blumberg, Structural implications derived from the analysis of electron paramagnetic resonance spectra of natural and artificial copper proteins, Arch. Biochem. Biophys., 1974, 165(2), 691–708 CrossRef CAS PubMed
- S. A. Aĺtshuler and B. M. Kozyrev, Electron paramagnetic resonance, Academic Press, 2013, p.1972 Search PubMed
- R. Orbach, On the theory of spin-lattice relaxation in paramagnetic salt, Proc. Phys. Soc., 1961, 77(4), 821 CrossRef CAS
- L. Garbuio, K. Zimmermann, D. Häussinger and M. Yulikov, Gd (III) complexes for electron–electron dipolar spectroscopy: effects of deuteration, pH and zero field splitting, J. Magn. Reson., 2015, 259, 163–173 CrossRef CAS PubMed
- A. Volkov, C. Dockter, T. Bund, H. Paulsen and G. Jeschke, Pulsed EPR determination of water accessibility to spin-labeled amino acid residues, Biophys. J., 2009, 96(3), 1124–1141 CrossRef CAS PubMed
- D. Gajan, M. Schwarzwälder, M. P. Conley, W. R. Grüning, A. J. Rossini, A. Zagdoun and C. Copéret, Solid-phase polarization matrixes for dynamic nuclear polarization from homogeneously distributed radicals in mesostructured hybrid silica materials, J. Am. Chem. Soc., 2013, 135(41), 15459–15466 CrossRef CAS PubMed
- K. Keller, M. Qi, C. Gmeiner, I. Ritsch, A. Godt, G. Jeschke and M. Yulikov, Intermolecular background decay in RIDME experiments, Phys. Chem. Chem. Phys., 2019, 21(16), 8228–8245 RSC
- J. H. van Wonderen, D. N. Kostrz, C. Dennison and F. MacMillan, Refined Distances Between Paramagnetic Centers of a Multi-Copper Nitrite Reductase Determined by Pulsed EPR (iDEER) Spectroscopy, Angew. Chem., Int. Ed., 2013, 52(7), 199 CrossRef PubMed
- B. E. Bode, D. Margraf, J. Plackmeyer, G. Dürner, T. F. Prisner and O. Schiemann, Counting the monomers in nanometer-sized oligomers by pulsed electron− electron double resonance, J. Am. Chem. Soc., 2007, 129(21), 6736–6745 CrossRef CAS PubMed
- A. Pivtsov, M. Wessig, V. Klovak, S. Polarz and M. Drescher, Localization of Guest Molecules in Nanopores by Pulsed EPR Spectroscopy, J. Phys. Chem. C, 2018, 122(10), 5376–5384 CrossRef CAS
- D. R. Kattnig and D. Hinderberger, Analytical distance distributions in systems of spherical symmetry with applications to double electron–electron resonance, J. Magn. Reson., 2013, 230, 50–63 CrossRef CAS PubMed
- A. D. Milov, K. M. Salikhov and M. D. Shirov, Application of ELDOR in electron-spin echo for paramagnetic center space distribution in solids, Fiz. Tverd. Tela, 1981, 23(4), 975–982 CAS
- M. Pannier, S. Veit, A. Godt, G. Jeschke and H. W. Spiess, Dead-time free measurement of dipole–dipole interactions between electron spins, J. Magn. Reson., 2000, 142(2), 331–340 CrossRef CAS PubMed
- L. V. Kulik, S. A. Dzuba, I. A. Grigoriev and Y. D. Tsvetkov, Electron dipole–dipole interaction in ESEEM of nitroxide biradicals, Chem. Phys. Lett., 2001, 343(3–4), 315–324 CrossRef CAS
- A. V. Astashkin, Mapping the Structure of Metalloproteins with RIDME, Methods Enzymol., 2015, 563, 251–284 CAS
- D. Abdullin and O. Schiemann, Pulsed Dipolar EPR Spectroscopy and Metal Ions: Methodology and Biological Applications, ChemPlusChem, 2020, 85, 353–372 CrossRef PubMed
- M. Ubbink, G. W. Canters and M. Huber, Measurement of a Cu Cu Distance of 26 Å by a Pulsed EPR Method. van Amsterdam, I. M., Angew. Chem. Int. Ed., 2003, 42(1), 62–64 CrossRef
- J. S. Becker and S. Saxena, Double quantum coherence electron spin resonance on coupled Cu (II)–Cu (II) electron spins, Chem. Phys. Lett., 2005, 414(1–3), 248–252 CrossRef CAS
- C. W. Kay, H. El Mkami, R. Cammack and R. W. Evans, Pulsed ELDOR determination of the intramolecular distance between the metal binding sites in dicupric human serum transferrin and lactoferrin, J. Am. Chem. Soc., 2007, 129(16) CrossRef PubMed
- K. Keller, M. Zalibera, M. Qi, V. Koch, J. Wegner, H. Hintz, A. Godt, G. Jeschke, A. Savitsky and M. Yulikov, EPR characterization of Mn(II) complexes for distance determination with pulsed dipolar spectroscopy, Phys. Chem. Chem. Phys., 2016, 18(36), 25120–25135 RSC
- I. Ritsch, H. Hintz, G. Jeschke, A. Godt and M. Yulikov, Improving the accuracy of Cu(II)–nitroxide RIDME in the presence of orientation correlation in water-soluble Cu(II)–nitroxide rulers, Phys. Chem. Chem. Phys., 2019, 21(19), 9810–9983 RSC
- S. A. Dzuba, A. M. Raitsimring and Y. D. Tsvetkov, The distance distribution of radical—paramagnetic ion pairs studied by the electron spin echo method. Spatial regularities of radical diffusion in glassy
alcohols, Chem. Phys., 1979, 44(3), 357–365 CrossRef CAS
- J. L. Baber, J. M. Louis and G. M. Clore, Dependence of Distance Distributions Derived from Double Electron–Electron Resonance Pulsed EPR Spectroscopy on Pulse-Sequence Time, Angew. Chem. Int. Ed., 2015, 54(18), 5336–5339 CrossRef CAS PubMed
- Y. D. Tsvetkov, M. K. Bowman and Yu. A. Grishin, PELDOR theoretical background. Pulsed Electron-Electron Double Resonance, Springer, 2019 Search PubMed
- V. N. Syryamina, A. G. Matveeva, Y. V. Vasiliev, A. Savitsky and Y. A. Grishin, Improving B1 field homogeneity in dielectric tube resonators for EPR spectroscopy via controlled shaping of the dielectric insert, J. Magn. Reson., 2020, 106685 CrossRef CAS PubMed
- D. R. Kattnig, J. Reichenwallner and D. Hinderberger, Modeling excluded volume effects for the faithful description of the background signal in double electron–electron resonance, J. Phys. Chem. B, 2013, 117(51), 16542–16557 CrossRef CAS PubMed
- P. Höfer, A. Grupp, H. Nebenführ and M. Mehring, Hyperfine sublevel correlation (hyscore) spectroscopy: a 2D ESR investigation of the squaric acid radical, Chem. Phys. Lett., 1986, 132(3), 279–282 CrossRef
- P. A. Narayana, A. S. W. Li and L. Kevan, A new method for detection of preferential adsorption of metal cations at anionic micellar surfaces in frozen aqueous solutions by electron spin echo spectrometry, J. Phys. Chem., 1982, 86(1), 3–4 CrossRef CAS
- A. V. Astashkin, S. A. Dikanov, A. M. Tyryshkin and Y. D. Tsvetkov, The structure of the nearest surroundings of silver atoms stabilized in γ-irradiated AgNO3/D2O ice, based on ESE data, Chem. Phys. Lett., 1989, 164(2–3), 299–306 CrossRef CAS
- D. A. Erilov, R. Bartucci, R. Guzzi, A. A. Shubin, A. G. Maryasov, D. Marsh, S. A. Dzuba and L. Sportelli, Water concentration profiles in membranes measured by ESEEM of spin-labeled lipids, J. Phys. Chem. B, 2005, 109(24), 12003–12013 CrossRef CAS PubMed
- S. A. Dzuba and D. Marsh, ESEEM of spin labels to study intermolecular interactions, molecular assembly and conformation, Electron Paramagn. Reson., 2014, 24, 102–121 Search PubMed
- G. Jeschke, G. Panek, S. Schleidt and U. Jonas, Addressing the interface in polymer-clay nanocomposites by electron paramagnetic resonance spectroscopy on surfactant probes, Polym. Eng. Sci., 2004, 44(6), 1112–1121 CrossRef CAS
- W. B. Mims, Pulsed ENDOR experiments, Proc. R. Soc. A, 1965, 283(1395), 452–457 CAS
- E. R. Davies, A new pulse ENDOR technique, Phys. Lett. A, 1974, 47(1), 1–2 CrossRef CAS
- P. Schosseler, T. Wacker and A. Schweiger, Pulsed Eldor Detected Nmr, Chem. Phys. Lett., 1994, 224(3–4), 319–324 CrossRef CAS
- https://www.megazyme.com/.
- N. Cox, W. Lubitz and A. Savitsky, W-band ELDOR-detected NMR (EDNMR) spectroscopy as a versatile technique for the characterisation of transition metal–ligand interactions, Mol. Phys., 2013, 111(18–19), 2788–2808 CrossRef CAS
- D. Getz and B. L. Silver, ESR of Cu2+ (H2O) 6. I. The oxygen-17 superhyperfine tensors in 63Cu2+ doped zinc Tutton's salt at 20° K., J. Chem. Phys., 1974, 61(2), 630–637 CrossRef CAS
- N. M. Atherton and A. Horsewill, Proton ENDOR of Cu (H2O) 6 2+ in Mg (NH4) 2 (SO2) 4.6 H2O, J. Mol. Phys., 1979, 37(5), 1349–1361 CrossRef CAS
- G. Cerchiaro, A. C. Sant'Ana, M. L. A. Temperini and A. M. da Costa Ferreira, Investigations of different carbohydrate anomers in copper (II) complexes with D-glucose, D-fructose, and D-galactose by Raman and EPR spectroscopy, Carbohydr. Res., 2005, 340(15), 2352–2359 CrossRef CAS PubMed
Footnote |
| † Electronic supplementary information (ESI) available. See https://doi.org/10.1039/d2ra01164f |
| This journal is © The Royal Society of Chemistry 2022 |