 Open Access Article
Insights into coloration enhancement of mercerized cotton fabric on reactive dye digital inkjet printing†
Hongzhi Zhaoa,
Kun Zhanga,
Kuanjun Fangab,
Furui Shia,
Ying Pana,
Fuyun Sunc,
Dezhen Wangd,
Ruyi Xie*ab and
Weichao Chen *ab
*ab
aCollege of Textiles & Clothing, State Key Laboratory for Biofibres and Eco-textiles, Collaborative Innovation Center for Eco-textiles of Shandong Province, Qingdao University, Qingdao 266071, China. E-mail: xry1228@126.com; chenwc@qdu.edu.cn
bNational Innovation Center of Advanced Dyeing and Finishing Technology, Tai'an, Shandong 271000, P. R. China
cYuYue Home Textile Company, 1 Xiner Road, Bincheng District, Binzhou, 256600, China
dLufeng Company Limited, Zibo 255100, China
First published on 5th April 2022
Abstract
Mercerization can improve the utilization rate of dyes in the dyeing process, and reduce the discharge of washing wastewater. However, the effect and mechanism of mercerization is not clear on digital inkjet printing of cotton fabric. In this work, two kinds of cotton fabrics (original and mercerized) were used for reactive dye digital inkjet printing, and the color improvement mechanism of caustic soda mercerization was investigated. It was found that the crystallinity of cotton fibre was adjusted from 73.9% to 58.5% by caustic mercerization, and the breaking strength did not decrease compared with original cotton fibre. Thus, the accessible reactive hydroxyl groups and the wettability were enhanced for treated cotton fibres, which promoted the inks' wick into the fibres. Interestingly, the penetration of ink droplets between the yarns and fibres after caustic mercerization was decreased, thus the dyes mainly gathered on the surface of cotton fabric. The cotton fibres' cross section structure changed from flat oval to round, which increased the contact area between reactive dyes and fibres. At a certain amount of ink, the optimal K/S value of 23.47 was achieved for treated cotton fabrics, which was higher than that of untreated cotton fabrics (17.15). Meanwhile, the printed fabrics displayed good washing fastness, rubbing fastness and glossiness. This work has important theoretical guiding significance for producing high quality mercerized cotton fabric digital printing products and reducing printing wastewater discharge.
Introduction
Nowadays, many printing methods, such as 3D microprinting,1,2 screen printing,3 photolithography and inkjet printing,4,5 have been rapidly developed. Among them, inkjet printing technology is one of the most suitable printing methods in textile industry, due to its advantages of being clean, having low energy consumption and emission reduction.6,7 Cotton is well known as one of the most popular agricultural renewable resources because of its excellent hand feel, moisture absorption and air permeability.8–11 However, in the process of digital inkjet printing, the imaging quality and dye utilization were poor due to the unique structure of the fabric and the cotton fibre's higher crystallinity.12To eliminate the adverse effects caused by cotton properties, several researchers have tried various approaches to overcome this problem. Cationic nanospheres combined with anionic reactive dyes by electrostatic adsorption have been proved to be a good pretreatment agent for cotton fabric.13,14 However, the preparation process of cationic nanospheres is cumbersome and therefore it was difficult to produce on a large scale. Because both cationic modifiers and cationic nanospheres improve the inkjet-printed quality by electrostatic absorption of anionic dyes, cationic modifiers have also been widely favored.15–17 Nevertheless, after steam washing, the staining problem of the printed fabric in the unprinted part has always been puzzled by printing workers. Plasma was regarded as energy-saving and efficient treatment method. The contact area between fabric surface and dye is increased by plasma etching, so as to improve the inkjet-printed quality.18 However, due to the high cost of the equipment and the uncertainty of the process, it is difficult to be used in industrial applications.
Mercerization is the processing method of cotton fabric treated with concentrated caustic soda solution under the condition of tension, which gives it better dyeability, hygroscopicity, glossiness and mechanical properties.19 It has been reported that the positive effect of mercerization on the reactive dyeing fabric.20–22 However, dyeing and inkjet printing are two completely different processing methods.23,24 Since digital inkjet printing is a non-contact production method, nanoscale droplets are sprayed from a nozzle onto the fibres to form a colour image.25 Thus, the fabric structure and fibre properties are closely related to the imaging quality of inkjet printing. However, mercerization could permanently change the crystallinity and structure of the fibre,19 and therefore it is very crucial to understand the mechanism affecting the printed images quality of mercerized cotton fabric in detail. However, the related research in this area has not been reported yet.
In this work, caustic mercerization was applied in adjusting the fabric structures and fibre properties to investigate the mechanism of mercerization affecting the printed image quality. The crystallinity of cotton fibre could be controlled by adjusting the alkali treatment time. The crystal structure of cotton fibres was studied by 2D-GIXD scattering patterns. The changes of surface groups were characterized by FTIR spectra. The morphology changes of cotton fabric were observed by the scanning electron microscope (SEM). Meanwhile, contact angle and capillary effect were measured to characterize the wettability of cotton fabrics before and after treatment, and the wetting process of ink drops on the fabric surface was observed. The cross section of the printed fabric was used to understand the dyes distribution. The colour strength and colour fastness of printed cotton fabrics were evaluated to test the inkjet printing performance. Moreover, the breaking strength and glossiness of the cotton fabrics were also tested. This research has significant guidance to realize the clean production of mercerized cotton fabric, and has important application prospects in household cotton textiles and garment industry.
Materials and methods
Materials
C.I. reactive orange 13 (Fig. 1) was obtained from Everlight chemistry Co., Ltd, (Taiwan, China) and used without further purification. Commercial inks were provided by YuYue Home Textiles Co., Ltd (Binzhou, China). Ethylene glycol and sodium m-nitrobenzene sulfonate were purchased from Aladdin Biochemical Technology Co., Ltd, (Shanghai, China). Urea and sodium bicarbonate were obtained from Sinopharm Chemical Reagent Co., Ltd, (Shanghai, China). All the deionized water used in this research was prepared by ultra-pure water instrument, the resistivity of the deionized water was 18.2 MΩ cm. Cotton fabric (32 × 21/133 × 60) was supplied by YuYue Home Textiles Co., Ltd (Binzhou, China).Preparation of dye solutions
The reactive orange 13 solution was prepared in a 50 mL volumetric flask. The mixtures of water and ethylene glycol (EG) were prepared in advance. The EG concentration was 20% by weight. The certain amount of reactive dye was added to a EG–water solution at 25 °C.26–31 The concentration of reactive dye in all solutions was 50 mmol L−1. In the process of inkjet printing, viscosity (Fig. S1a†) and surface tension (Fig. S1b†) of reactive dye inks play very important roles in the formation of ink droplets and the fluency of inkjet printing.Mercerization treatment
The cotton fabric with tension was soaked in a 250 g L−1 NaOH aqueous solution at room temperature for 10 s, 20 s, 30 s, 60 s, 90 s, and then immersed in 80 °C water to remove extra alkali solution. Finally, the cotton fabric was neutralized by 2 g L−1 sulfuric acid.Sodium alginate pretreatment
Cotton fabrics before and after alkali treatment were padded with an aqueous solution containing 2% sodium alginate, 8% urea, 2% sodium bicarbonate and 1% sodium m-nitrobenzene sulfonate at 90% pickup, and dried at 100 °C.32Inkjet printing system
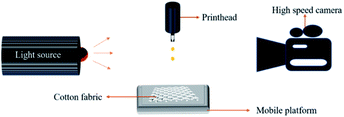
The inkjet printing system used in this research under laboratory conditions was supplied by Shanghai Ruidu Optoelectronics Technology Co., Ltd. As shown in Fig. 2, the inkjet printing system consists of a nozzle, a movable platform, a light source and a high-speed camera. When inkjet printing, the cotton fabric was adhered to a movable platform, and the nozzle can move up and down. By controlling the movement of the nozzle and the platform, patterns can be generated on the cotton fabric.33 The droplet shape of reactive dye ink was very important for the fineness and clarity of inkjet printing patterns. As shown in Fig. S1c,† there were no satellite ink drops in the process of ink drops from the nozzle, which met the printing conditions.34,35 In factory production, the effect of cotton fibre crystallinity on inkjet printing performance was investigated by using Vega 5000 digital inkjet printing machine (VEGA 5000, Atexco, China), a cartoon pattern was designed for inkjet printing.Printing quality measurement
The colour strength (K/S values) and colorimetric parameters (L*, a*, b*, C* and h°) of printed cotton fabric were measured by datacolor 850 spectrophotometer (Datacolor Co., USA). Each fabric was measured at five different locations, and obtained the reflectivity (R) value at the maximum absorption wavelength.36 The colour strength (K/S values) of fabric could be expressed by eqn (1):| K/S = (1 − R)2/2R | (1) |
C* and h° were counted by eqn (2) and (3), respectively.
 | (2) |
 | (3) |
The cross sections of the printed cotton fabric were obtained with a Y172 fibre slicer (Mien, Shanghai), and the penetration state of the dye was observed by ultra depth of field microscope (Leica, Germany).
Surface property and aggregate structure analysis
The Fourier transform infrared (FTIR) spectroscopy of cotton fabrics was carried out using a Nicolet iS 10 instrument (Thermo Fisher Scientific, US). The two-dimension grazing incidence X-ray diffraction (2D-GIXD) of cotton fabrics were measured by two-dimensional grazing incidence wide-angle scattering (Xenocs Company, France). A scanning electron microscope (SEM, Phenom Pure) was used to observe the morphological changes of cotton fibres treated with high concentration alkali solution under 5 kV accelerating voltage.Wettability
The wettability of cotton fabric before and after mercerization treatment was characterized by measuring contact angle and capillary effect. The static contact angle of cotton fabric was measured by using Dataphysics-OCA 25 (Germany). A drop (ethylene glycol) was injected into the cotton fabric. The volume of the drop was 3 μL and the injection speed was 0.5 μL s−1. At the same time, this method was used to simulate the wetting process of ink drops on cotton fabric. The fabric before and after treatment was cut into 3 cm × 25 cm strips, and then one side of the cotton fabric was immersed in deionized water to observe the climbing height of deionized water on the cotton fabric at different times.Glossiness
3 nh glossmeter was used to test the glossiness of cotton fabrics before and after treatment, and each fabric was measured at six different locations, and then obtained the average of the data.Breaking strength and colour fastness
The breaking strength was measured by electronic fabric strength tester (Shanghai Sansi Experimental Instrument Co., Ltd). A Sw-12A washing colour fastness tester (Wuxi Textile Instrument Co., China) was used to measure the washing fastness according to ISO 105-C10:2007. The rubbing fastness was tested by Q238BB rubbing colour fastness tester (Gellowen Co., Ltd, UK) based on GB/T 3920-2008.Results and discussion
Surface property and aggregate structure analysis of cotton fabric
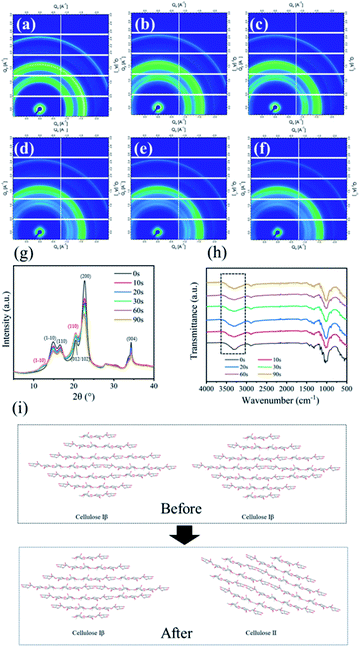
The two-dimension grazing incidence X-ray diffraction measurements were used to observe the crystallinity of cotton fibre. And the 2D-GIXD scattering patterns were depicted in Fig. 3a–f, the cotton fibres crystallinity was decreased as indicated by the weakening of scattering intensity.37 The weakening of lamellar peak also meant the increase of amorphous state of cotton fibre.38 To further study the change of the crystal structure of the treated cotton fabric, the above diffraction patterns were integrated and the corresponding curve shown in Fig. 3g was obtained. Cellulose I is a mixture of cellulose Iα and cellulose Iβ of two crystal forms, cellulose Iα mainly existed in bacterial cellulose and seaweed cellulose, while cellulose Iβ mainly existed in the fibres of higher plants.19,39 Cellulose I was a parallel chain structure. The original samples showed the characteristic diffraction of cellulose Iβ, and the diffraction peaks appeared at 2θ = 14.7°, 16.8°, 20.5°, 22.7° and 34.8°, corresponding to the diffractions of the (1−10), (110), (012/102), (200) and (004) crystal planes. Weak diffraction peaks appeared at 2θ = 12.1° and 20.1° corresponding to the (1−10) and (110) lattice planes respectively after treatment, which was typical characteristics for cellulose II.40 In the progress of mercerization treatment, sodium hydroxide entered the amorphous region of the cotton fibre and separated the crystallites in the cotton fibre, resulting in the structure of Na-cellulose I. After the alkali treatment, Na-cellulose I was rinsed with water to remove alkali, and then Na-cellulose I was converted to Na-cellulose IV (hydrate form of cellulose II).41,42 After drying and removing water, the crystal structure of cellulose II with antiparallel structure is formed.43 However, due to the existence of tension, the penetration of sodium hydroxide solution in the highly ordered crystal structure of cotton fibre was limited. Therefore, the cellulose I was not completely transformed into cellulose II during the treatment. As shown in Fig. 3i, the original samples exhibited the crystalline form of cellulose I. The crystal structure of treated cotton fibre is a mixed structure of cellulose I and cellulose II.To better investigate the changes of cotton fibre crystallinity after treatment, eqn (4) was used to calculate the crystallinity of cotton fibre,44 and the results were shown in Table 1.
 | (4) |
As the cellulose molecular chain was a highly ordered structure, this ordered structure was a network formed by a large number of intramolecular and intermolecular hydrogen bonds, resulting in high crystallinity of cotton fibre. From Table 1, the crystallinity of the treated cotton fibre was reduced from 73.9% to 58.5%. This result implied that caustic mercerization could reduce the crystallinity of cotton fibres through breaking the degree of order of cellulose macromolecular chains, which contributed to the covalent binding of dyes and fibres.
| Treated time (s) | Crystal zone content (%) | Amorphous region content (%) |
|---|---|---|
| 0 | 73.9 | 26.1 |
| 10 | 65.1 | 34.9 |
| 20 | 63.5 | 36.5 |
| 30 | 62.5 | 37.5 |
| 60 | 59.3 | 40.7 |
| 90 | 58.5 | 41.5 |
To further investigate the surface properties of cotton fibres, FTIR spectra of the cotton fabrics, before and after alkali treatment, were demonstrated in Fig. 3h. All samples treated by alkali showed the similar spectral curves, indicating that no new groups were produced after treatment. The stretching of the strong hydrogen bond –OH near 3455–3210 cm−1 is universally observed in all spectra.45 The bands at around 3455–3410 cm−1 and 3375–3340 cm−1, which were assigned to O3H⋯O5 and O2H⋯O6 intramolecular hydrogen bonds.46 The intermolecular hydrogen bonding of O6H⋯O3 in cellulose are generally shown 3310–3230 cm−1.47,48 The maximum absorption peak of the OH stretching vibration of the treated cotton fibre was transferred to a higher wavenumber. The crystal structure of cellulose was transformed from cellulose I to cellulose II by high concentration alkali treatment.49 Moreover, the alkali treatment reduced the OH stretching vibration mainly caused by intramolecular hydrogen bonds.
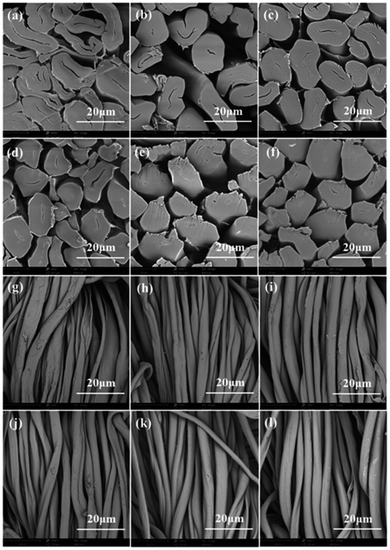
The morphology of cotton fibres treated by high concentration alkali at different times were observed by scanning electron microscopes (SEM). As illustrated in Fig. 4a and g, the cross section of original cotton fibre was flat waist shaped with a large cell cavity. The longitudinal direction of untreated cotton fibre had natural distortion and rough surface. As for the cotton fabrics treated by high concentration alkali solution, sodium hydroxide solution diffuses rapidly into the fibre. Due to deconvolution, the cotton fibre is untied from a twisted ribbon structure to a smooth rod-shaped surface.19 As shown in Fig. 4b–f, the cross section of cotton fibre gradually changed from flat oval to round with the increase of treatment time, and the cell cavity gradually became smaller, and finally reduced to a line. As illustrated in Fig. 4h–l, the surfaces of the cotton fibres became a little smooth after treatment, and the vertical natural torsion gradually disappeared. These distinct changes would increase the contact area between fibres and dyes.
The glossiness of the treated cotton fabrics treated was shown in Table 2. All the treated cotton fabrics exhibited excellent glossiness than original fabric. The results clearly indicated that the glossiness of cotton fabrics might be related to morphological structure. Combined with Fig. 4, the cross section of the cotton fibres treated with alkali solution changed from ear shape to round shape, the wrinkles on the surface of the fibre disappeared and the surface became smooth. As a result, the treated fibres exhibited an improvement in light reflection, bringing much better glossiness.
| Treated time (s) | 0 | 10 | 20 | 30 | 60 | 90 |
|---|---|---|---|---|---|---|
| Glossiness | 2.15 | 2.41 | 2.43 | 2.45 | 2.44 | 2.50 |
Study on wettability of mercerized cotton fabric
Fig. 5a and b showed the wettability of cotton fabric through capillary effect measurement and the contact angle. It could be seen from Fig. 5a that the treated cotton fabric obtained a better capillary effect. The wicking height of original cotton fabric was 65 mm in 30 minutes. In comparison, the wicking height of the treated cotton fabric increased with the increase of high concentration alkali solution treatment time. The wicking height changed little when the treatment time reached 60 s. The reason was that the crystallinity of treated cotton fibre decreased and the amorphous region increased. The increase of amorphous region led to the increase of accessible hydrophilic groups in the fibre, and water molecules could rapidly form hydrogen bonds with hydrophilic group, which led to the increase of wicking height. At the same time, cotton fibres could be regarded as a porous medium, and liquid could be transported in the porous medium.50,51 After mercerization treatment, the fibre swelled and the gap between fibres became smaller, which was helpful to improve the wicking height. The wettability enhancement of cotton fabric is conducive to the fibres to absorb dyes.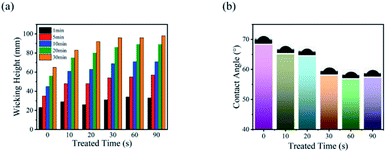 | ||
| Fig. 5 (a) Capillary effect of cotton fabric with different treatment time, (b) contact angle of cotton fabrics. | ||
The droplet spread rapidly on the fabric due to the capillary pressure and hydrogen bonding after contacting the cotton fabric. As depicted in Fig. 5b, the contact angle of cotton fabrics gradually decreased with the increase of treatment time. After the treatment, the accessible hydroxyl groups on the fibre surface increased and the hydrogen bond between the droplet and the fibre surface was enhanced.52 As the fibre swelled, the fibre gap became smaller and the capillary pressure increased, the droplet diffusion on the fabric accelerated. Therefore, under the action of hydrogen bond and capillary pressure, the contact angle of droplet on the treated cotton fabric gradually decreased and finally reached an equilibrium state.
Study on inkjet printing performance of cotton fabric
The color strength of the cotton fabric directly reflects the distribution of dye molecules in inkjet-printed fabrics. In inkjet printing, the amount of dye in each area is certain, so the darker the color of printed cotton fabric means the higher the ink utilization. The effect of crystallinity on color intensity of inkjet-printed cotton fabrics was investigated. As shown in Fig. 6a, the color strength of cotton fabrics increased with the increase of treatment time and the color intensity of the treated cotton fabric reached the maximum K/S value in 60 s. There was no obvious change when the treatment time was over 60 s. The reason may be that when the cotton fabric was treated with alkali for 60 s, the absorption capacity of cotton fabric to dyes reached the maximum. Based on the above research, it could be concluded that alkali treatment increased the wettability of cotton fibre, making the dye molecules more easily wick into the fibres. At the same time, the crystal area in the fibre decreased and the amorphous region increased, leading to the increase of the reaction sites in the fibres. Therefore, the colour strength of the treated printed cotton fabric was high after steam washing. The schematic mechanism was shown in Fig. 6b.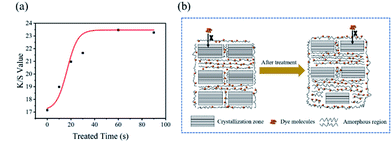 | ||
| Fig. 6 (a) Colour strength of cotton fabric treated with alkali for different time. (b) Schematic diagram of the reaction between dye molecules and fibres before and after treatment. | ||
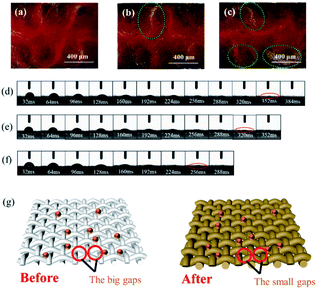
To further research the influence mechanism of mercerization on cotton inkjet printing. The cross-sectional images of printed cotton fabrics at different treatment times were obtained. The distribution of dyes on printed fabrics could be clearly expressed by cross-sectional images. As illustrated in Fig. 7a, the dye penetrated completely into the untreated cotton fabric. A white line (green circle marked) appeared on the printed fabric after alkali treatment for 10 s, which meant the ink penetration on the fabric was slightly weakened, as exhibited in Fig. 7b. However, Fig. 7c showed that more white thread was observed on the printed fabric, which indicated that a large proportion of the dyes did not penetrate the fabric, but gathered on the surface of the fabric.
As shown in Fig. S2,† the diffusion of ink drops on cotton fabric was mainly divided into two parts: the first was that the ink drops fall on the fabric, and the second was that the ink drops wet the cotton fabric.53,54 This process mainly involved the spreading and penetration of ink droplets between fibres and yarns, the absorption of ink droplets by fibres also occurred at this stage.33 The wetting state of droplets on the fabric was observed, and the deposition state of droplets on the fabric before and after treatment was further investigated, as shown in Fig. 7d–f. After the droplets hit the fabric, they permeate and spread instantly.55 The wetting speed of the droplets on the treated cotton fabric was obviously accelerated. However, from Fig. 7a–c, the dyes did not completely penetrate the treated cotton fabric, which indicated that the ink droplets were mainly wicked into the treated cotton fibres. Meanwhile, the alkali treatment caused the fibres to swell, thus the gaps between the fibres became narrower. As described in Fig. 7g, when the ink droplets were sprayed onto the fabric, due to the existence of space obstruction, the penetration of ink droplets between fibres and yarns was weakened. As a result, dyes were deposited on the surface of the fabric, which avoided the reduction of colour strength due to the penetration of the dyes into the back of the fabric. Combined with the results in Fig. 3, it was believed that with the decrease of crystal area, the absorption of dyes in the amorphous region of cellulose was increased after the droplets impacted on the fibres. Concurrently, the swelling of the fibre increased the contact area between the dye and the fibre. Hence, these synergistic effects improved the image quality of inkjet-printed cotton fabrics.56
The colour data of inkjet-printed cotton fabrics with reactive dye inks were shown in Table 3. L* and C* represent lightness and chroma, respectively.57 It can be seen that the printed cotton fabrics treated for 60 s obtained the lowest L* values and the largest C* for all the cotton fabric samples, indicating that the cotton fabrics got the deepest colours. a* represents the degree of greenness (−) and redness (+), b* corresponds to the degree of blueness (−) and yellowness (+) and h° represents the hue angle.58 At the same time, both a* and b* are positive, which means that orange is a mixture of red and yellow. These colour data have a certain relationship with the dyes used. All in all, mercerizing treatment can improve the printing quality of cotton fabric through controlling the crystallinity of cotton fibres. Furthermore, the best colour strength can be obtained by treating the cotton fabric for 60 s, and the colour strength of printed cotton fabric has no obvious change by prolonging the treatment time.
| Treated time (s) | L* | a* | b* | C* | h° |
|---|---|---|---|---|---|
| 0 | 62.37 | 56.22 | 64.23 | 85.36 | 48.80 |
| 10 | 62.06 | 56.52 | 67.18 | 87.79 | 49.93 |
| 20 | 61.86 | 57.07 | 68.72 | 89.33 | 50.29 |
| 30 | 60.45 | 57.99 | 66.20 | 88.01 | 48.78 |
| 60 | 60.31 | 58.38 | 69.02 | 90.40 | 49.78 |
| 90 | 60.38 | 58.46 | 68.55 | 90.09 | 49.54 |
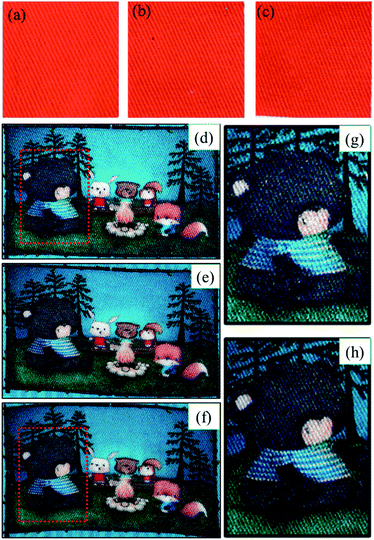
As mentioned above, the colour strength of cotton inkjet printing can be improved by controlling the crystallinity of cotton fibre and preventing the penetration of ink droplets on the fabric. Fig. 8a–c showed the scanning images of inkjet-printed cotton fabrics treated with alkali for different times under laboratory conditions. Compared with untreated cotton fabrics, the colour strength of alkali-treated cotton fabrics improved in different extents. And the highest colour strength was achieved after 60 s of treatment, and the trend of colour change was consistent with Fig. 6a. To verify the feasibility of implementation in the factory, cotton fabrics with alkali treatment time of 0 s, 10 s and 60 s were printed with Vega 5000 digital inkjet printing machine, as shown in Fig. 8d–f. The patterns of the original fabric obtained poor colour strength, and there were a large number of white spots on the surface of the fabric. Interestingly, the outline sharpness of the mercerized printed cotton fabric was not reduced, as displayed in Fig. S3.† After the caustic mercerization, the image quality was extremely enhanced, that was related to the synergistic effect of fabric structure, fibre crystallinity and morphological structure.
Table 4 showed the colour fastness and breaking strength of different cotton samples. The range of colour fastness was from 1 to 5, the larger the value of colour fastness, the better the colour fastness.59 All printed products showed excellent colour fastness to washing and rubbing, as all colour fastness levels were higher than 4. Table 4 also indicated that cotton fabrics treated with alkali exhibit better mechanical properties than untreated fabrics. In the process of alkali treatment, the cellulose macromolecules were arranged neatly and the orientation of the fibre was increased due to the presence of tension. As a result, cellulose molecular chains could more synergistically resist the destruction of external forces, thus reducing the fracture phenomenon caused by stress concentration.60 Hence, the treated cotton fabric got a better breaking strength than original fabric.
| Treated time (s) | Washing fastness | Rubbing fastness | Breaking strength (N) | ||
|---|---|---|---|---|---|
| SC | CC | Dry | Wet | ||
| a SC = staining to cotton fabric, CC = colour change. | |||||
| 0 | 4–5 | 4–5 | 4–5 | 4–5 | 486.0 |
| 10 | 4–5 | 4–5 | 4–5 | 4–5 | 493.0 |
| 20 | 4–5 | 4 | 5 | 4–5 | 494.0 |
| 30 | 4–5 | 4–5 | 5 | 5 | 495.6 |
| 60 | 4–5 | 4–5 | 5 | 5 | 495.2 |
| 90 | 4–5 | 4 | 5 | 4–5 | 495.0 |
Conclusions
In this work, the effect of mercerization treatment on enhancing the image quality of cotton fabric was deeply investigated. The crystallinity of cotton fibres could be modified by controlling the alkali treatment time. The treated cotton fibres crystallinity was reduced from 73.9% to 58.5%, and therefore the treated cotton fibres had more reaction sites with dyes. Compared with the original cotton fibre, the alkali treated cotton fibre swelled, which increased the contact area between dyes and fibres. Meanwhile, its wettability was also enhanced, which benefitted for the ink wicking into the fibre. The cross section of the printed fabric indicated the ink did not completely penetrate into the back of the fabric, which promoted the colouring ability of mercerized cotton fabric. Therefore, a higher K/S value of 23.47 was achieved for the treated cotton fabrics compared with the original sample with a K/S value of 17.15. At a certain amount of ink, mercerized cotton fabrics exhibit the best image quality, due to the synergistic effect of fabric structure, fibre crystallinity and morphological structure. Based on the above researches, the colour enhancement mechanism of mercerized cotton fabric was studied in detail, which provides theoretical guidance for producing high quality mercerized cotton fabric inkjet printing products.Author contributions
Hongzhi Zhao: performed the experiment, formal analysis, investigated the principles, writing – original draft. Kun Zhang: performed the experiment and processed the experimental data. Kuanjun Fang: visualization, investigation, data curation. Furui Shi: data curation. Ying Pan: helped write the manuscript. Fuyun Sun: did the industrial experiment at YuYue Home Textile Company. Dezhen Wang: performed the experiment. Ruyi Xie: conceptualization, methodology, writing – reviewing and editing. Weichao Chen: provided the idea of this research.Conflicts of interest
The authors declare no competing financial interest.Acknowledgements
This work was supported by National Key R&D Program of China (2017YFB0309800), State Key Laboratory of Bio-Fibres and Eco-Textiles (Qingdao University), No. ZKT01, Department of Science and Technology of Shandong Province of China (Grant No.: ZR2020QE099) and National Innovation Center of Advanced Dyeing and Finishing Technology (No.: ZJ2021A07).References
- Y. P. Lin, Y. Zhang and M. F. Yu, Adv. Mater. Technol., 2018, 4, 1800393 CrossRef.
- Y. Zhang, Y.-P. Lin, X. Zhang, Y. Zhang and J. Guo, Appl. Mater. Today, 2021, 24, 101085 CrossRef.
- J. Liang, K. Tong and Q. Pei, Adv. Mater., 2016, 28, 5986–5996 CrossRef CAS PubMed.
- H. Al Hashimi and O. Chaalal, Therm. Sci. Eng. Prog., 2021, 22, 100857 CrossRef CAS.
- X. Qiao, K. Fang, X. Liu, J. Gong, S. Zhang, J. Wang and M. Zhang, Prog. Org. Coat., 2022, 165, 106746 CrossRef CAS.
- H. Peng, R. Xie, K. Fang, C. Cao, Y. Qi, Y. Ren and W. Chen, Langmuir, 2021, 37, 1493–1500 CrossRef CAS PubMed.
- C. Zhang, F. Guo, H. Li, Y. Wang and Z. Zhang, Appl. Surf. Sci., 2019, 490, 157–164 CrossRef CAS.
- X. Zhang, K. Fang, H. Zhou, K. Zhang and M. N. Bukhari, J. Mol. Liq., 2020, 312, 113481 CrossRef CAS.
- Z. Zhang, H. Wang, J. Sun and K. Guo, Cellulose, 2020, 28, 565–579 CrossRef.
- C. Wang, S. Zhang, S. Wu, Z. Cao, Y. Zhang, H. Li, F. Jiang and J. Lyu, Bioresour. Technol., 2018, 254, 231–238 CrossRef CAS PubMed.
- Z. Wu, K. Fang, W. Chen, Y. Zhao, Y. Xu and C. Zhang, Ind. Crops Prod., 2021, 171, 113896 CrossRef CAS.
- Y. Song, K. Fang, Y. Ren, Z. Tang, R. Wang, W. Chen, R. Xie, Z. Shi and L. Hao, Polymers, 2018, 10, 1402 CrossRef PubMed.
- Y. Song, K. Fang, M. N. Bukhari, Y. Ren, K. Zhang and Z. Tang, ACS Appl. Mater. Interfaces, 2020, 12, 45281–45295 CrossRef CAS PubMed.
- H. Yang, K. Fang, X. Liu and F. An, ACS Appl. Mater. Interfaces, 2019, 11, 29218–29230 CrossRef CAS PubMed.
- Q. Shen, S. Chen, C. Wang, C. Liu and A. Tian, J. Text. Inst., 2014, 105, 799–805 CrossRef CAS.
- Z. Liu, K. Fang, H. Gao, X. Liu, J. Zhang, Y. Cai and F. Li, J. Imaging Sci. Technol., 2017, 61, 050505 CrossRef.
- L. Wang, C. Hu and K. Yan, Carbohydr. Polym., 2018, 197, 490–496 CrossRef CAS PubMed.
- P. Pransilp, M. Pruettiphap, W. Bhanthumnavin, B. Paosawatyanyong and S. Kiatkamjornwong, Appl. Surf. Sci., 2016, 364, 208–220 CrossRef CAS.
- Y. Liang, W. Zhu, C. Zhang, R. Navik, X. Ding, M. S. Mia, M. N. Pervez, M. I. H. Mondal, L. Lin and Y. Cai, Cellulose, 2021, 28, 7435–7453 CrossRef CAS.
- L. Gao, S. Shi, W. Hou, S. Wang, Z. Yan and C. Ge, J. Renewable Mater., 2020, 8, 703–713 Search PubMed.
- G. R. Poongodi, N. Sukumar, V. Subramnaiam and Y. C. Radhalakshmi, J. Nat. Fibers, 2019, 18, 122–135 CrossRef.
- T. Wakida, K. Kida, M. Lee, S. Bae, H. Yoshioka and Y. Yanai, Text. Res. J., 2000, 70, 328–332 CrossRef CAS.
- Z. Liu, K. Fang, H. Gao, X. Liu and J. Zhang, Color. Technol., 2016, 132, 407–413 CAS.
- L. Fang, F. Sun, Q. Liu, W. Chen, H. Zhou, C. Su and K. Fang, J. Cleaner Prod., 2021, 317, 128500 CrossRef CAS.
- Y. Song, K. Fang, M. N. Bukhari, K. Zhang, Z. Tang and R. Wang, J. Cleaner Prod., 2020, 263, 121538 CrossRef CAS.
- C. Cao, Z. Zhao, Y. Qi, H. Peng, K. Fang, R. Xie and W. Chen, RSC Adv., 2021, 11, 10929–10934 RSC.
- Y. Qi, R. Xie, A. Yu, M. N. Bukhari, L. Zhang, C. Cao, H. Peng, K. Fang and W. Chen, RSC Adv., 2020, 10, 34373–34380 RSC.
- H. Wang, H. Kong, J. Zheng, H. Peng, C. Cao, Y. Qi, K. Fang and W. Chen, Molecules, 2020, 25, 1588 CrossRef CAS PubMed.
- K. Zhang, R. Xie, K. Fang, W. Chen, Z. Shi and Y. Ren, J. Mol. Liq., 2019, 287, 110932 CrossRef CAS.
- S. Uzun, M. Schelling, K. Hantanasirisakul, T. S. Mathis, R. Askeland, G. Dion and Y. Gogotsi, Small, 2020, 17, 2006376 CrossRef.
- R. Xie, J. Fan, K. Fang, W. Chen, Y. Song, Y. Pan, Y. Li and J. Liu, Chemosphere, 2022, 286, 131541 CrossRef CAS PubMed.
- Z. Tang, K. Fang, M. N. Bukhari, Y. Song and K. Zhang, Langmuir, 2020, 36, 9481–9488 CrossRef CAS PubMed.
- K. Zhang, K. Fang, M. N. Bukhari, R. Xie, Y. Song, Z. Tang and X. Zhang, Cellulose, 2020, 27, 9725–9736 CrossRef CAS.
- H. Qin, K. Fang, Y. Ren, K. Zhang, L. Zhang and X. Zhang, ACS Sustainable Chem. Eng., 2020, 8, 17291–17298 CrossRef CAS.
- H. Wijshoff, Curr. Opin. Colloid Interface Sci., 2018, 36, 20–27 CrossRef CAS.
- F. Shi, Q. Liu, H. Zhao, k. Fang, R. Xie, L. Song, M. Wang and W. Chen, ACS Sustainable Chem. Eng., 2021, 9, 10361–10369 CrossRef CAS.
- S. Li, W. Liu, M. Shi, J. Mai, T.-K. Lau, J. Wan, X. Lu, C.-Z. Li and H. Chen, Energy Environ. Sci., 2016, 9, 604–610 RSC.
- J. Mai, T.-K. Lau, J. Li, S.-H. Peng, C.-S. Hsu, U. S. Jeng, J. Zeng, N. Zhao, X. Xiao and X. Lu, Chem. Mater., 2016, 28, 6186–6195 CrossRef CAS.
- A. D. French, Cellulose, 2014, 21, 885–896 CrossRef CAS.
- G. Sebe, F. Ham-Pichavant, E. Ibarboure, A. L. Koffi and P. Tingaut, Biomacromolecules, 2012, 13, 570–578 CrossRef CAS PubMed.
- A. Sarko, Advances in solid state structural studies of celluloses – a brief review, 2021, https://www.researchgate.net/publication/266448909 Search PubMed.
- Y. Nishiyama, S. Kuga and T. Okano, J. Wood Sci., 2000, 46, 452–457 CrossRef CAS.
- P. Langan, Y. Nishiyama and H. Chanzy, Biomacromolecules, 2001, 2, 410–416 CrossRef CAS PubMed.
- L. Zhang, C. Huang, C. Zhang and H. Pan, Cellulose, 2021, 28, 4643–4653 CrossRef CAS.
- A. Tarbuk, A. M. Grancaric and M. Leskovac, Cellulose, 2014, 21, 2167–2179 CrossRef CAS.
- M. Schwanninger, J. C. Rodrigues, H. Pereira and B. Hinterstoisser, Vib. Spectrosc., 2004, 36, 23–40 CrossRef CAS.
- B. J. C. Duchemin, Green Chem., 2015, 17, 3941–3947 RSC.
- R. Remadevi, R. Rajkhowa, G. Crowle, X. Wang, H. Zhu and S. Gordon, Carbohydr. Polym., 2018, 202, 365–371 CrossRef CAS PubMed.
- S. Y. Oh, D. I. Yoo, Y. Shin and G. Seo, Carbohydr. Res., 2005, 340, 417–428 CrossRef CAS PubMed.
- C. Zhu, H. Tada, J. Shi, J. Yan and H. Morikawa, Text. Res. J., 2019, 89, 5198–5208 CrossRef CAS.
- Y. Zhao, K. Fang, W. Chen, Z. Wu, Y. Xu and C. Zhang, Ind. Crops Prod., 2021, 172, 113995 CrossRef CAS.
- Y. Song, K. Fang, M. N. Bukhari, K. Zhang and Z. Tang, J. Mol. Liq., 2021, 324, 114702 CrossRef CAS.
- C. Josserand and S. T. Thoroddsen, Annu. Rev. Fluid Mech., 2016, 48, 365–391 CrossRef.
- R. Rioboo, M. Marengo and C. Tropea, Exp. Fluids, 2002, 33, 112–124 CrossRef.
- S. Mhetre, W. Carr and P. Radhakrishnaiah, J. Text. Inst., 2010, 101, 423–430 CrossRef CAS.
- R. Xie, K. Fang, Y. Liu, W. Chen, J. Fan, X. Wang, Y. Ren and Y. Song, J. Mater. Sci., 2020, 55, 11919–11937 CrossRef CAS.
- F. An, K. Fang, X. Liu, C. Li, Y. Liang and H. Liu, Int. J. Biol. Macromol., 2020, 164, 4173–4182 CrossRef CAS PubMed.
- C. Li, L. Fang, K. Fang, X. Liu, F. An, Y. Liang, H. Liu, S. Zhang and X. Qiao, Langmuir, 2021, 37, 683–692 CrossRef CAS PubMed.
- F. An, K. Fang, X. Liu, H. Yang and G. Qu, Int. J. Biol. Macromol., 2020, 146, 959–964 CrossRef CAS PubMed.
- R. Ahmed, S. Mia, N. Nabijon, M. Neaz Morshed and Q. Heng, Tekstilec, 2017, 60, 324–330 CrossRef CAS.
Footnote |
| † Electronic supplementary information (ESI) available: Some data and pictures help to explain the experimental phenomenon. See DOI: 10.1039/d2ra01053d |
| This journal is © The Royal Society of Chemistry 2022 |


