
 Open Access Article
 This Open Access Article is licensed under a Creative Commons Attribution-Non Commercial 3.0 Unported Licence
Thiosemicarbazide functionalized carbon quantum dots as a fluorescent probe for the determination of some oxicams: application to dosage forms and biological fluids†
Mona E. El Sharkasy *,
Manar M. Tolba,
Fathalla Belal,
Mohamed I. Walash and
Rasha Aboshabana
*,
Manar M. Tolba,
Fathalla Belal,
Mohamed I. Walash and
Rasha Aboshabana
Department of Pharmaceutical Analytical Chemistry, Faculty of Pharmacy, Mansoura University, 35516, Mansoura, Egypt. E-mail: Monaelsharkasy524@gmail.com
First published on 9th May 2022
Abstract
In this study, highly fluorescent water-soluble nitrogen and sulfur doped carbon quantum dots (N, S-CQDs) were synthesized via a one-step hydrothermal process utilizing citric acid as a carbon source and thiosemicarbazide as a sulfur and nitrogen source. The obtained N, S-CQDs exhibited an intense emission band at 415 nm (λex = 345 nm). In the presence of either piroxicam, tenoxicam or lornoxicam, the emission band at 415 nm was significantly quenched which might be triggered due to destruction of the surface passivation layer of the N, S-CQDs. A linear correlation was found between the reduction in the fluorescence intensity of N, S-CQDs and the concentration of each drug in the ranges of 2.0–25.0 μM, 10.0–100.0 μM and 20.0–200.0 μM with correlation coefficients of more than 0.999 for all drugs. The detection limits were 0.49 μM, 1.58 μM and 4.63 μM for piroxicam, tenoxicam and lornoxicam, respectively. The effect of experimental parameters affecting the performance of the method was investigated and optimized. The developed sensor has the advantages of simplicity, time-saving, convenience and satisfactory selectivity for determination of the studied drugs in dosage forms with high % recoveries (98.86–101.69%). The method was extended for determination of piroxicam in spiked plasma with % recoveries ranging from 97.95–101.36%. The method was validated in accordance with International Council of Harmonization (ICH) standards, and the results obtained were compared statistically to those given by reported methods, indicating no significant differences in the level of accuracy and precision. The mechanism of the quenching process was studied and elucidated. The structure–activity relationship between the three drugs and the quenching efficiency was also studied and discussed.
1. Introduction
Carbon quantum dots (CQDs) have acquired a lot of interest and emerged to be impressive fluorescent nanomaterials with sizes ranging from 2 to 10 nanometers. There are various attributes to this class including inherent fluorescence properties, simplicity and cost-effective synthesis pathways, inexpensive and readily available starting materials, a broad variety of precursor choices, water solubility, excellent biocompatibility, chemical inertness, and ease of functionalization.1 The solubility of CQDs in aqueous solution may result from the presence of oxygen-containing moieties, such as hydroxyl and carboxyl, on their surfaces. These surface groups may impact the fluorescence characteristics of CQDs.1 Moreover, the structure of CQDs consists of sp2/sp3 carbon and oxygen/nitrogen-based groups or polymeric aggregations.2 There are numerous forms of fluorescent CQDs such as polymer dots (PDs),3 carbon nanotube (CNT) dots,4 graphene quantum dots (GQDs),5 and nano diamonds (NDs);6 all have been synthesized so far.The quantum confinement of the sp2-carbon-constructed core is assumed to be the cause of CQD fluorescence. Heteroatoms may have an effect on CQDs' overall electrical distribution as well as related electronic energy levels. It has been demonstrated that, doping exogenous atoms into CQDs is a successful means of tuning their fluorescence and other properties. Different heteroatoms have been doped into CQDs to enhance their characteristics for promising studies, including sulfur, halogen, nitrogen, silicon, tellurium, boron, selenium and phosphorus.7,8 Surface functionalization and chemical heteroatoms doping are two valuable ways for increasing photoluminescence efficiency.9–11 As a result, many scientists have focused their efforts on these species, especially those containing sulfur and nitrogen atoms.12 Furthermore, doping non-metallic elements into CQDs allows for structural and compositional changes, as well as a variety of benefits over heavy metal-based semiconductor-based QDs.12
CQDs can be synthesized using two alternative ways, top-down and bottom-up methods. The method of slicing large carbon containing compounds into small fragments and modifying oxygen-based groups is referred to top-down method. This method generally produces CQD with homogenous particle sizes and controllable surface chemistry.7 While, bottom-up methods are better in performance and can be used to produce CQDs in wide scale. Most approaches may result in dehydration and subsequent carbonization of molecules and polymers, resulting in CQDs or PDs formation. CQDs produced via “bottom-up” approach often include a significant number of functional groups that can be subsequently functionalized,13 but they also have a wide size range, necessitating extensive purification and extraction methods. The literature has shown several methods for producing N, S-CQDs probe, including hydrothermal approaches utilizing citric acid and cysteine12,14 or cystamine dihydrochloride,15 microwave-assisted methods,16 carbonizing organics methods17 and chemical oxidation methods.18 Most of these techniques, however, were impractical due to the need for lengthy procedures or expensive equipment. As a result, developing a cost-effective procedure using readily available starting material was needed.
Oxicams including piroxicam (PRX), tenoxicam (TNX) and lornoxicam (LRX), are enolic acids, that inhibit cyclooxygenase enzymes (COX-1 and COX-2), having analgesic, antipyretic and anti-inflammatory activities.19 They differ from non-steroidal anti-inflammatory drugs (NSAIDs) derived from carboxylic acids, which have a short half-life, and hence require frequent daily administration.20
Piroxicam (PRX, Fig. 1a), chemically is 4-hydroxy-2-methyl-N-2-pyridinyl-2H-1,2-benzothiazine-3-carboxamide 1,1-dioxide. Since PRX is acidic and lipophilic compound, it can be quickly absorbed and widely distributed across the body, reaching significant blood levels within one to two hours.20,21 PRX, like other NSAIDs, inhibits COX enzyme, which is involved in the pathogenesis of primary dysmenorrhea. PRX is also used to treat acute musculoskeletal pain, acute gout, rheumatoid arthritis, osteoarthritis, postsurgical and posttraumatic pain. The recommended dose in these acute painful conditions is 40 mg while for chronic conditions is 20 mg once a day.20 For PRX determination, a variety of approaches have been reported including spectrophotometry,22–25 spectrofluorimetry,26,27 HPLC,22,28 electrochemical methods29,30 and capillary electrophoresis.31,32
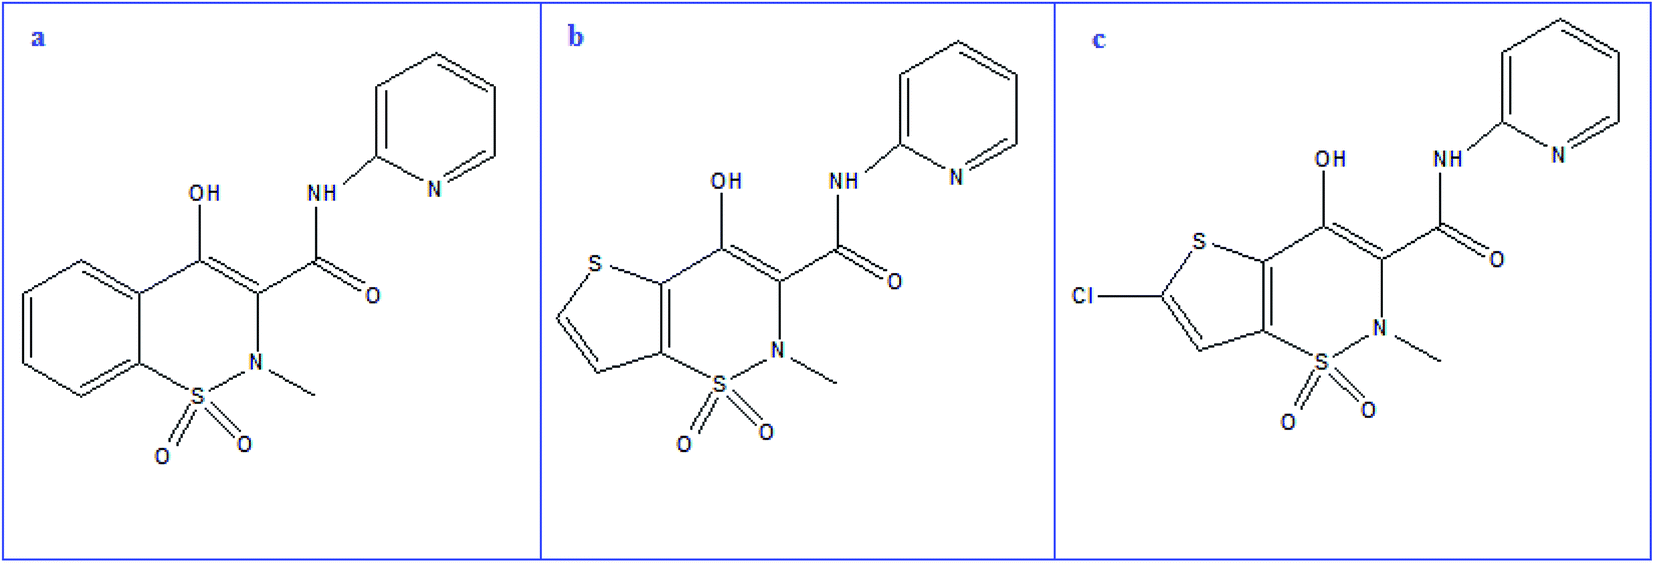 | ||
| Fig. 1 Structural formula of PRX (a), TNX (b) and LRX (c). | ||
Tenoxicam (TNX, Fig. 1b), is a thiophene derivative, chemically named 4-hydroxy-2-methyl-N-(2-pyridyl)-2H-thieno[2,3-e][1,2]thiazine-3-carboxamide1,1-dioxide. Various methods for analysis of TNX have been reported, including spectrophotometry,24,25,33,34 spectrofluorimetry,35 HPLC34,36,37 and electrochemical methods.38,39 The structure of lornoxicam (LRX, Fig. 1c) is (6-chloro-4-hydroxy-2-methyl-N-2-pyridyl-2H-thieno-[2,3-e]-1, 2-thiazine-3-carboxamide-1,1-dioxide). LRX can be administered orally or intravenously. It differs from other oxicams in that, it has a short elimination half-life (3 to 5 hours), which can be beneficial in terms of tolerability.40 Variable methods were reported for determination of LRX including spectrophotometry,33,41 spectrofluorimetry,35 HPLC,42–44 and electrochemical methods.45,46 The previously reported methods require expensive instrumentation, tedious and time-consuming procedures.
In this study, an eco-friendly N, S-CQDs were synthesized from citric acid and thiosemicarbazide. The main objective of the current study was applying N, S-CQDs as fluorescent probe to determine each of PRX, TNX, and LRX in various dosage forms and/or biological samples. Despite the fact that the selected pharmaceuticals have particular groups that alter their fluorimetric determination, the majority of the literature is based on using of strong acid such as nitric acid or reactions with chromogenic reagent of time-consuming procedure. Therefore, the proposed method introduced a simple, fast, green and direct spectrofluorimetric method for their determination in dosage forms and/or biological samples for the first time without a need for pre-derivatization steps.
2. Experimental section
2.1. Reagents and materials
All chemicals used were of Analytical Reagent grade, and the solvents were of HPLC grade.- Piroxicam pure sample (PRX) was kindly supplied by Pharco Pharmaceuticals Co., Amriya, Alexandria, Egypt.
- Tenoxicam pure sample (TNX) was supplied by the Egyptian International Pharmaceutical Industries Co. EIPICO, 10th of Ramadan City, Industrial Zone B1, Egypt.
- Lornoxicam pure sample (LRX) was supplied by El Obour Modern Pharmaceutical Industries Co., 1st Industrial Zone Obour City, Kaliobeya, Egypt.
• Pharmaceutical formulations:
❖ Feldene® 20 mg tablets; batch #20401, Feldene® 20 mg capsules; batch #20303 and Feldene® 20 mg ampoules; batch #200220020 manufactured by Pfizer Egypt S.A.E, Cairo A.R.E. Under license of Pfizer Inc., USA.
❖ Tenoxicam® 20 mg capsules; batch #145070, Epicotil® 20 mg ampoules; batch #2006576, product of El Obour Modern Pharmaceutical Industries co.,1st Industrial Zone Obour City, Kaliobeya, Egypt.
❖ Lornicam® Rapid 8 mg tablets; batch #201583, product of El Mira International for Pharmaceuticals and Chemicals, Nasr City, Cairo, Egypt.
❖ Lornoxicam® 8 mg ampoules; batch #20026048, product of Global Pharmaceutical Industries, 5th Industrial Zone, 6th of October City, Egypt.
- Phosphoric acid, boric acid, sodium hydroxide, citric acid (CA), thiosemicarbazide (TSC), and methanol were purchased from Sigma-Aldrich (USA).
- Membrane filters with pore sizes of 0.45 μm (Phenomenex – USA).
- Mansoura University Hospitals (Mansoura, Egypt) gratefully supplied human plasma samples, which were maintained frozen till use following gentle thawing.
- Throughout the experiments, double distilled water was utilized.
2.2. Standard stock solutions and buffer solution
- A stock solution (1.0 mM) of PRX was prepared in a 100 mL volumetric flask by dissolving 0.033 g of PRX in 5 mL dimethyl sulphoxide (DMSO) and completing to 100 mL with ethanol.- TNX and LRX stock solutions of concentration of 1.0 mM were prepared separately in 100 mL volumetric flasks by dissolving 0.0337 g and 0.0371 g, respectively in double distilled water. Working solutions were prepared by diluting standard stock solutions as appropriate.
- Britton–Robinson buffer solutions were prepared by mixing 0.04 M of each of acetic acid, boric acid and phosphoric acid. The required pH of buffer solution was adjusted using 0.2 M sodium hydroxide to obtain different buffer solutions with pH range 2.0–12.0.
2.3. Synthesis of fluorescent probe
Synthesis of nano-sensor was performed applying a simple hydrothermal method recently reported in the literature.47,48 The fluorescent N, S-CQDs probe of concentration of 1.0 g L−1, was prepared from CA and TSC as starting materials in a one-step hydrothermal method. The probes were made by sonicating a mixture of TSC (0.68 g, 7.50 mM) and CA (0.52 g, 2.50 mM) in 20.0 mL of double distilled water. The reaction mixture was stirred then refluxed at 160 °C for 8 hours until fluorescent nano-sensor was produced. The mixture was then allowed to cool before incubation at room temperature for subsequent use.2.4. Instrumentation
2.5. Procedures
2.5.2.1. For determination of PRX.
2.5.2.1.a. In Feldene® tablets and capsules. Ten tablets were separately grinded, well-mixed and weighed. Ten capsules were evacuated and weighed. An accurately weighed amount of the powder of each preparation equivalent to 0.033 g of PRX was transferred into a small conical flask, 5 mL aliquot of DMSO was added and mixed, and then 50 mL of ethanol was added and sonicated for 30 minutes. The resulting solution was filtered into a 100 mL volumetric flask and completed to the mark with ethanol to produce solution of final concentration of 1.0 mM, then serially diluted to reach the working concentration range. The procedure under “Section 2.5.1” was then applied. The nominal contents of the tablets or capsules were obtained using the corresponding regression equation.
2.5.2.1.b. In Feldene® ampoules. The contents of five ampoules were mixed. Accurately measured volume of the mixed solution equivalent to 0.033 g of PRX was transferred into a 100 mL volumetric flask. Then, the volume was completed to the mark with ethanol to obtain a final concentration of 1.0 mM. The solution was then serially diluted to the working concentration range. The procedure under “Section 2.5.1” was then applied and the nominal content of the ampoules was calculated using the corresponding regression equation.
2.5.2.2. For analysis of TNX and LRX preparations. Ten tablets of Lornicam Rapid® tablets were separately weighed, pulverized and mixed. Ten capsules of Tenoxicam® capsules were evacuated and weighed. An accurately weighed amount of the powder equivalent to 0.0371 g of LRX or 0.0337 g of TNX was transferred separately into 100 mL conical flasks. About 50 mL of double distilled water was added and mixed well, sonicated for 30 minutes, filtered into 100 mL volumetric flasks and completed to the mark with the same solvent to produce solutions of final concentration of 1.0 mM. Proceed as described under “Section 2.5.1”.
For Epicotil® or Lornoxicam® vials, the contents of five vials were homogenously mixed. An accurately weighed amount of the powder equivalent to 0.0337 of TNX and 0.0371 g of LRX were transferred separately into 100 mL conical flasks, and then about 50 mL of double distilled water was added. Each solution was mixed, sonicated for 30 minutes, filtered into 100 mL volumetric flask and completed to the mark with the same solvent to produce solution of final concentration of 1.0 mM. Serial dilutions were performed and the procedure was completed as described under “Section 2.5.1”. The nominal content of each preparation was calculated using the corresponding regression equation.
3. Results and discussion
3.1. Synthesis and characterization of fluorescent probe
In this method, a green and cost-effective fluorescent probe was produced adopting a hydrothermal technique using CA as a source of carbon to produce carboxyl coated CQDs.47 The carboxylic groups of the prepared CQDs were then reacted with amine and sulfur groups of TSC to produce TSC functionalized CQDs (Scheme 1). In their native condition, the synthesized N, S-CQDs are extremely water soluble, with no visible precipitation after 14 days at 4 °C.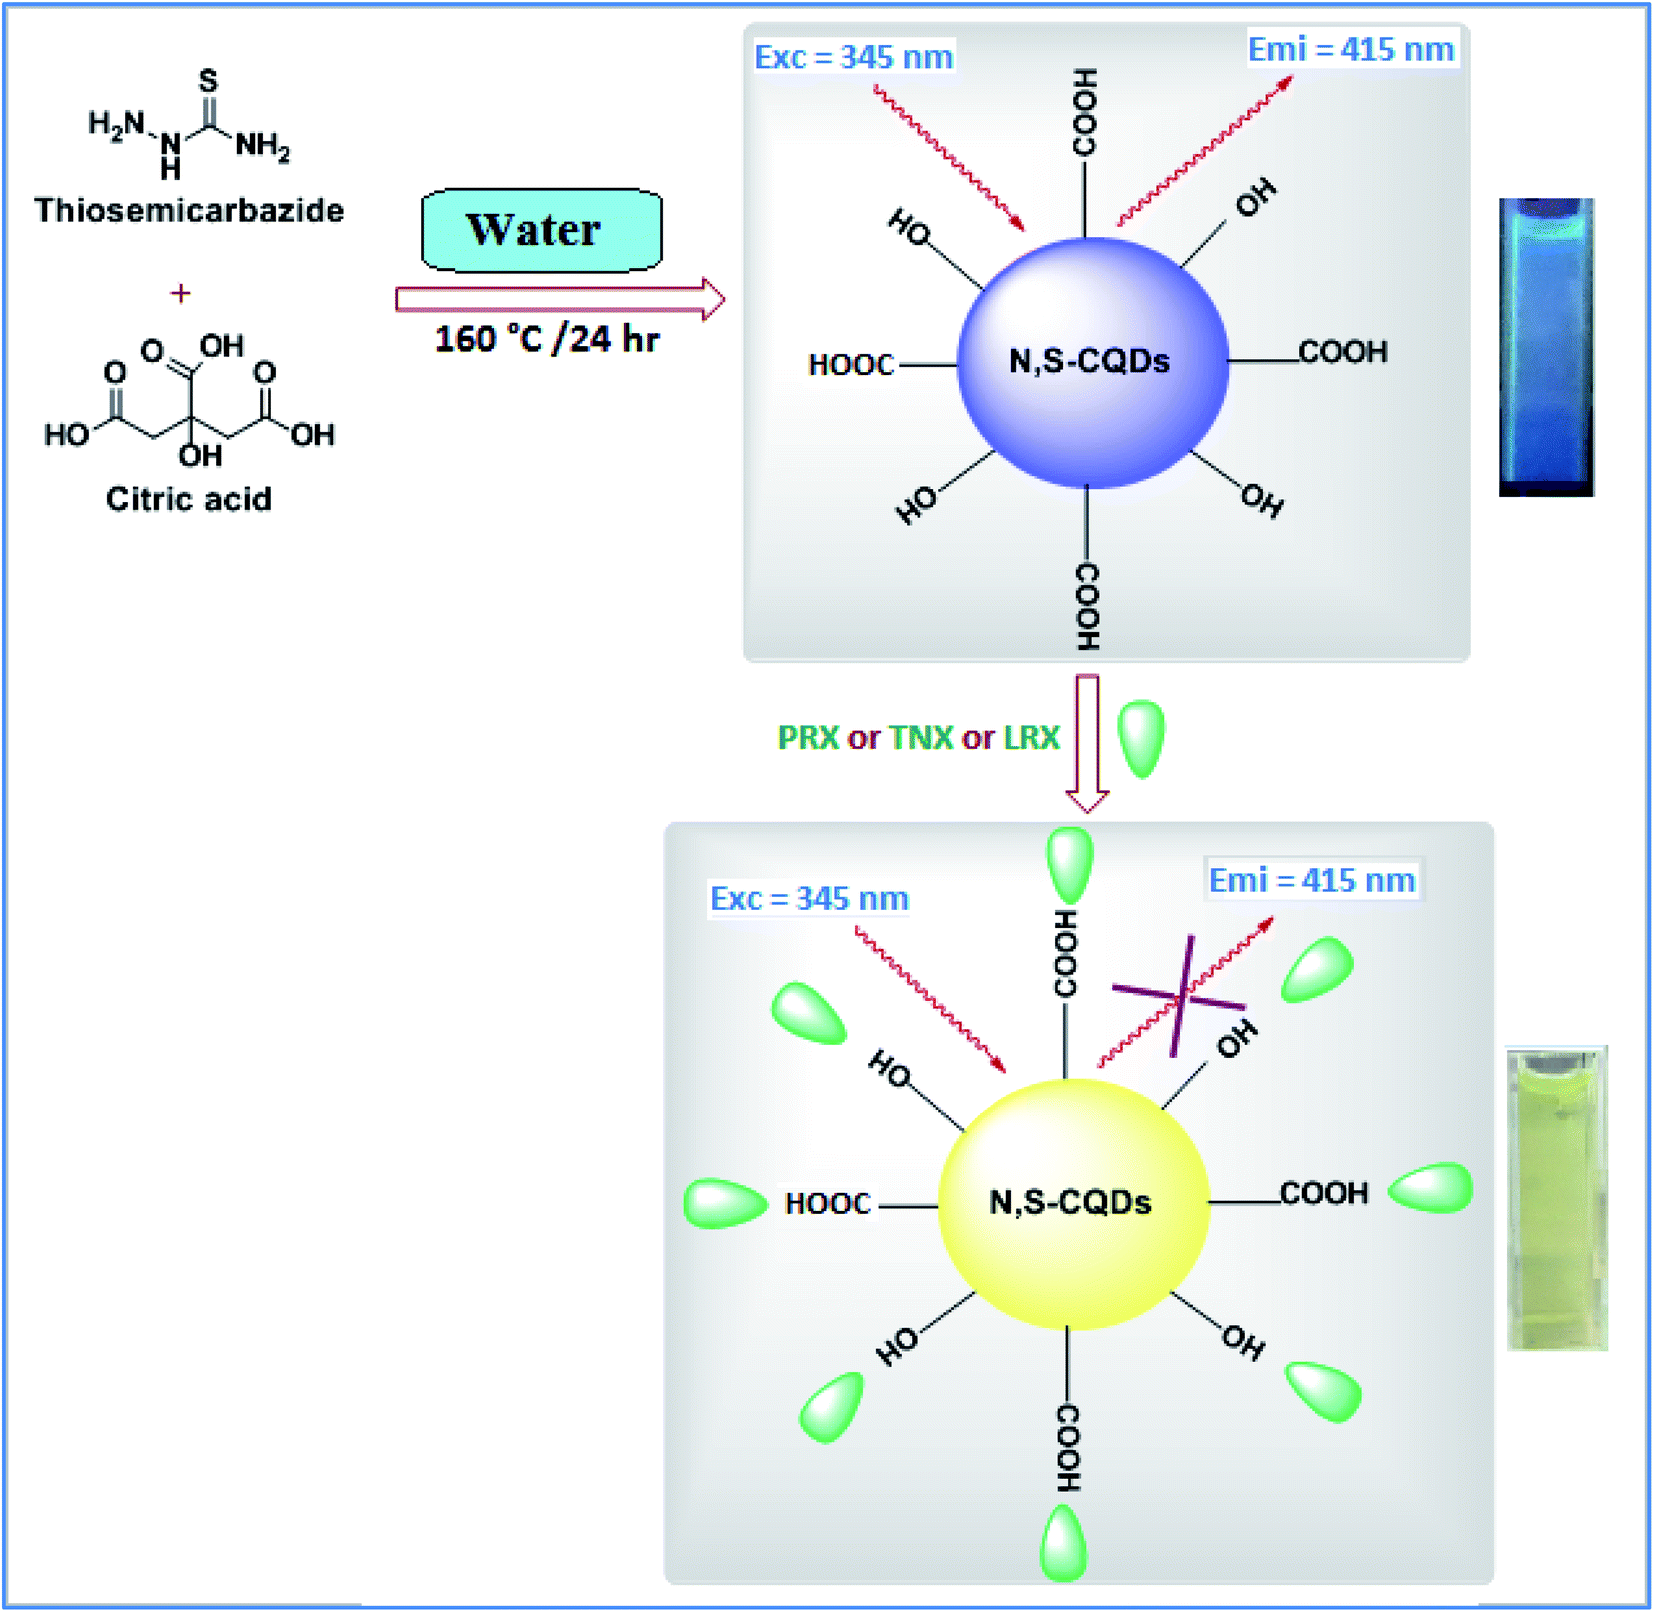 | ||
| Scheme 1 General procedure for hydrothermal synthesis and application of N, S-CQDs. | ||
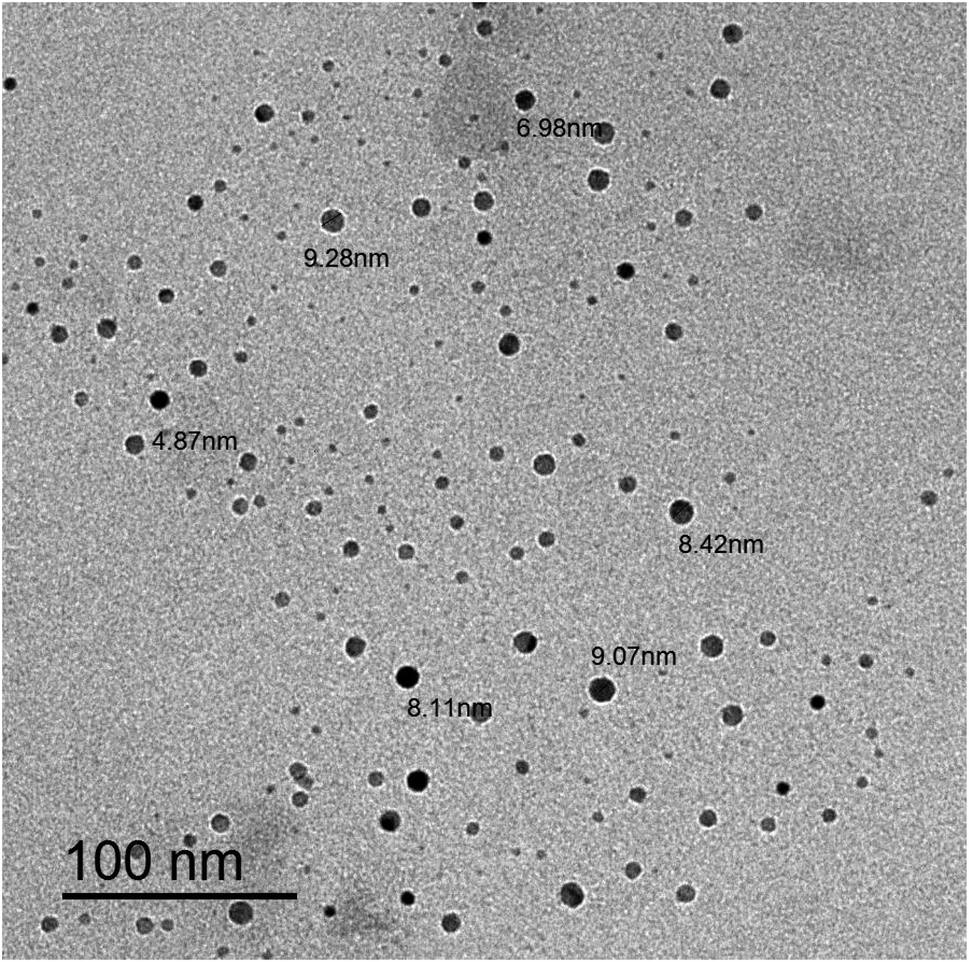 | ||
| Fig. 2 Typical HRTEM images of the N, S-CQDs. | ||
3.1.2.1. Spectroscopic investigation. Fig. S1† illustrates the UV-vis absorption spectra of CA, TSC, and N, S-CQDs. It was observed that N, S-CQDs showed an apparent UV-vis absorption peak in the range of 290–360 nm with a maximum at about 310 nm, which is attributable to the trapping of excited-state energy by the surface states, resulting in strong emission.49,50
3.1.2.2. Fluorimetric investigation. Fluorescence properties of N, S-CQDs were carefully studied. The fluorescence emission is excitation-dependent in the wavelength range of 310 to 380 nm as illustrated in Fig. 3. This may be resulting from multiple C-, N-, O-, and S-containing functional groups on the surface of N, S-CQDs leading to numerous surface states with varied energy levels and emissive traps.51 At higher excitation wavelength, it was observed that emission peak spectra were red shifted and the fluorescence intensity decreased. As demonstrated in Fig. S2,† when N, S-CQDs were excited at 345 nm, they emitted fluorescence strongly at around 415 nm.
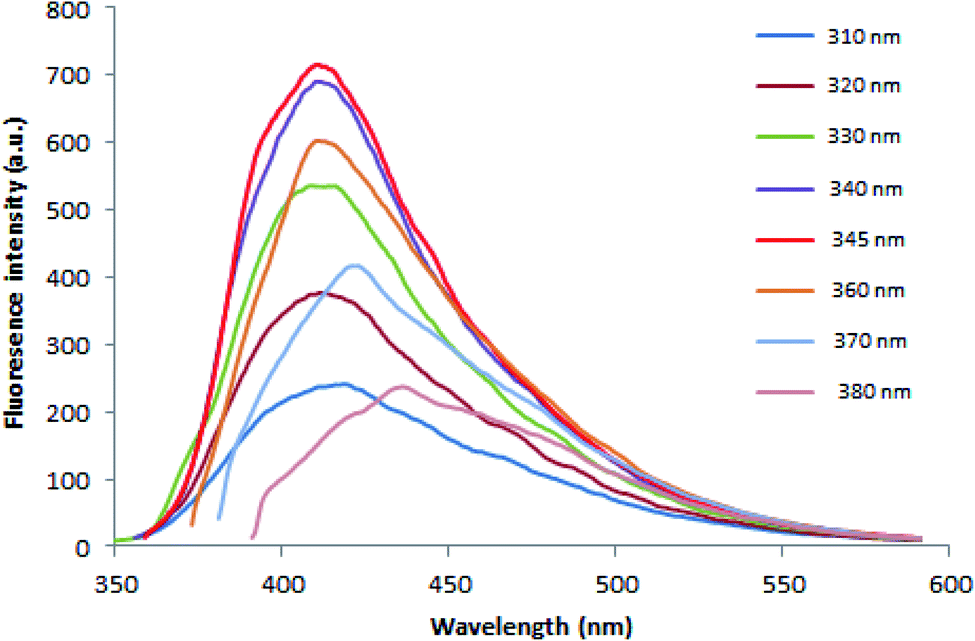 | ||
| Fig. 3 Fluorescence spectra of the N, S-CQDs at different excitation wavelengths. | ||
3.1.2.3. FT-IR spectroscopic studies. The hydrophilic functional groups capped on the surface of N, S-CQDs are responsible for their water solubility.52,53 FT-IR analysis of N, S-CQDs surface show different functional groups54–57 as illustrated in Fig. 4. All functional heights presented in FT-IR analysis was mentioned in Table 1.
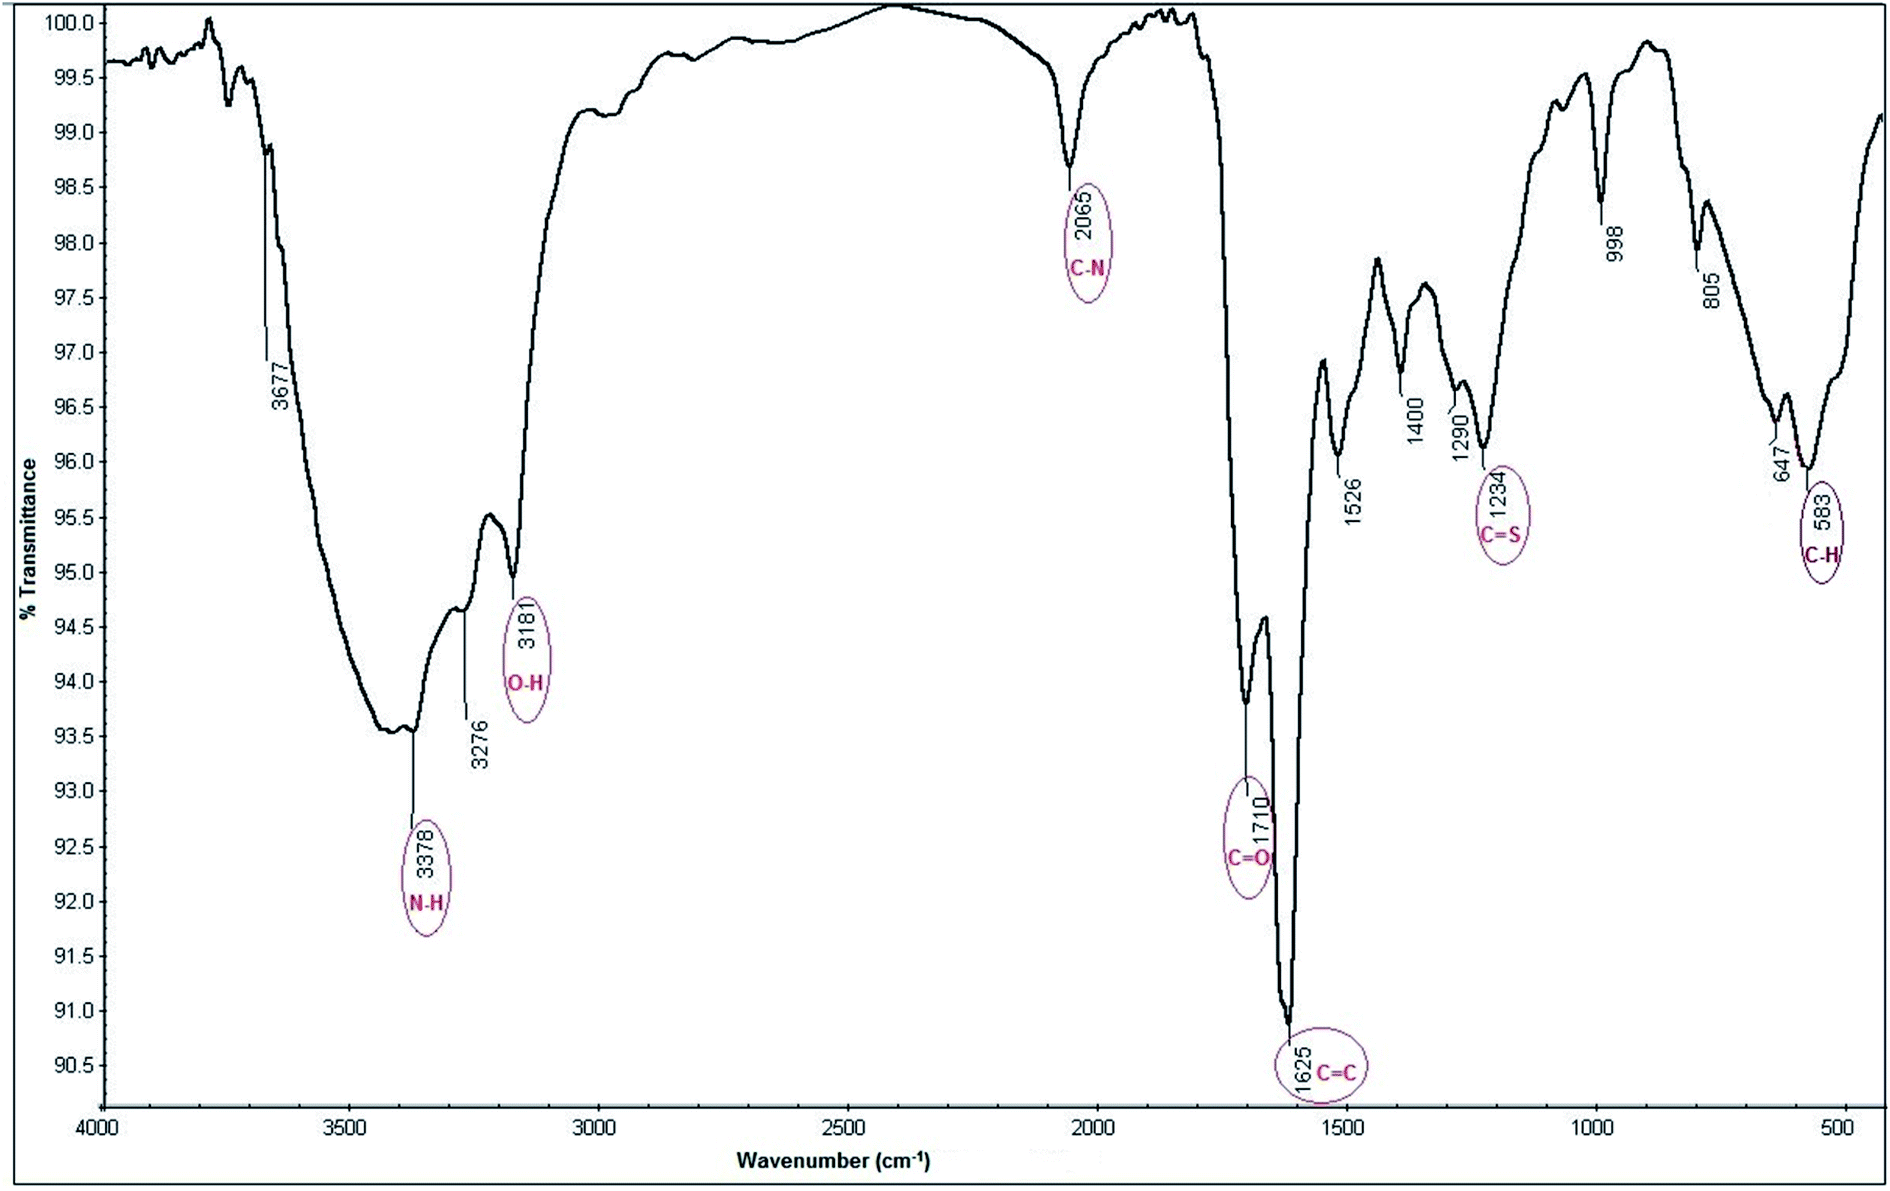 | ||
| Fig. 4 FT-IR spectra of N, S-CQDs. | ||
| Functional groups | Wavenumber (cm−1) |
|---|---|
| N–H/O–H | 3500–3100 |
C![[double bond, length as m-dash]](https://www.rsc.org/images/entities/char_e001.gif) O O |
1710 |
| C–N | 2065 |
| CC |
1625 |
| CS |
1234 |
| C–H | 583 |
3.2. Fluorescence quenching mechanism
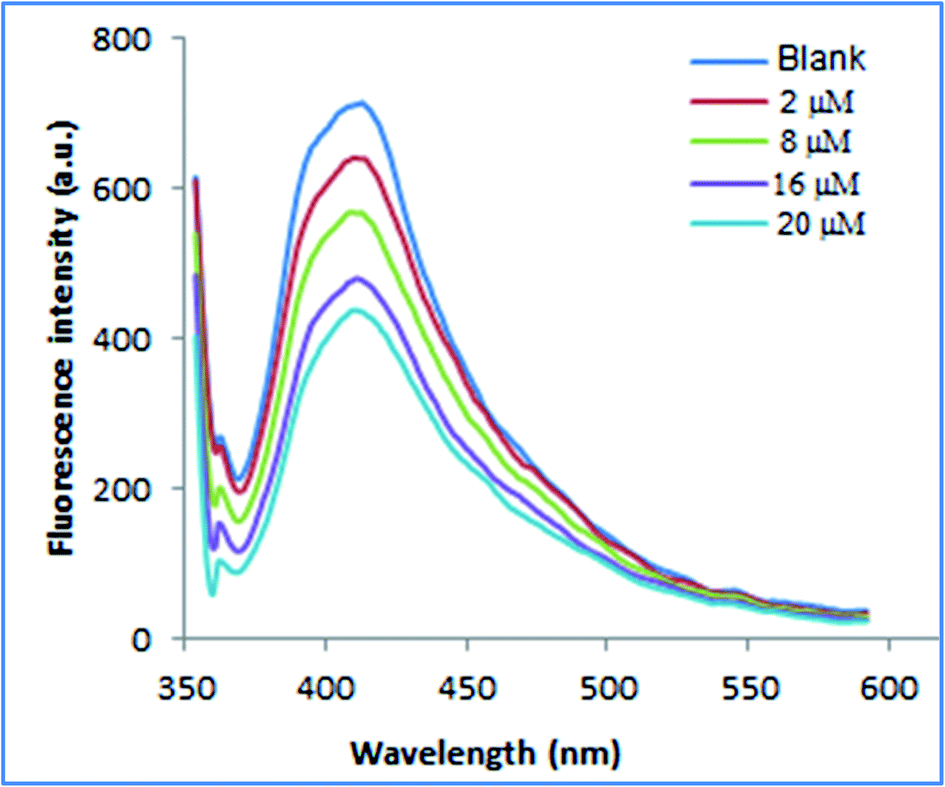
As demonstrated in Scheme 1, adding the investigated drugs to the N, S-CQDs solution significantly decreased the emitted blue fluorescence. This might be due to destruction of the surface passivation layer of N, S-CQDs.14,47,58 In aqueous solutions, the emission spectra of fluorescent probe were recorded in the absence and presence of various concentrations of PRX, TNX, and LRX. The fluorescence band observed was primarily focused at 415 nm (excitation 345 nm). As shown in Fig. S3,† the fluorescence emission spectra obtained when PRX, TNX, or LRX were added to the probe were significantly decreased. Generally, fluorescence quenching pathways can be classified into two categories: static or dynamic quenching. The temperature dependence of both categories of quenching mechanisms could be used for differentiation.59,60 Raising the temperature causes the diffusion coefficient, particle mobility, and energy transfer to rise in case of dynamic quenching. As a result, as the temperature increases, the quenching rate constant goes up as well. In a static one, on the other hand, when the temperature rises, the quenching rate constant decreases because the stability of non-fluorescent complex is lowered.59 The potential quenching mechanism can be illustrated by the Stern–Volmer equation, eqn (1).61| F0/F = 1 + KSV[Q] | (1) |
The Stern–Volmer plot for fluorescence quenching was conducted at 293, 318 and 353 K between F0/F and [Q]. The plot was linear and the slope (KSV) was increased with increasing temperature (Fig. 5), indicating that the quenching process proceeded through dynamic one.62
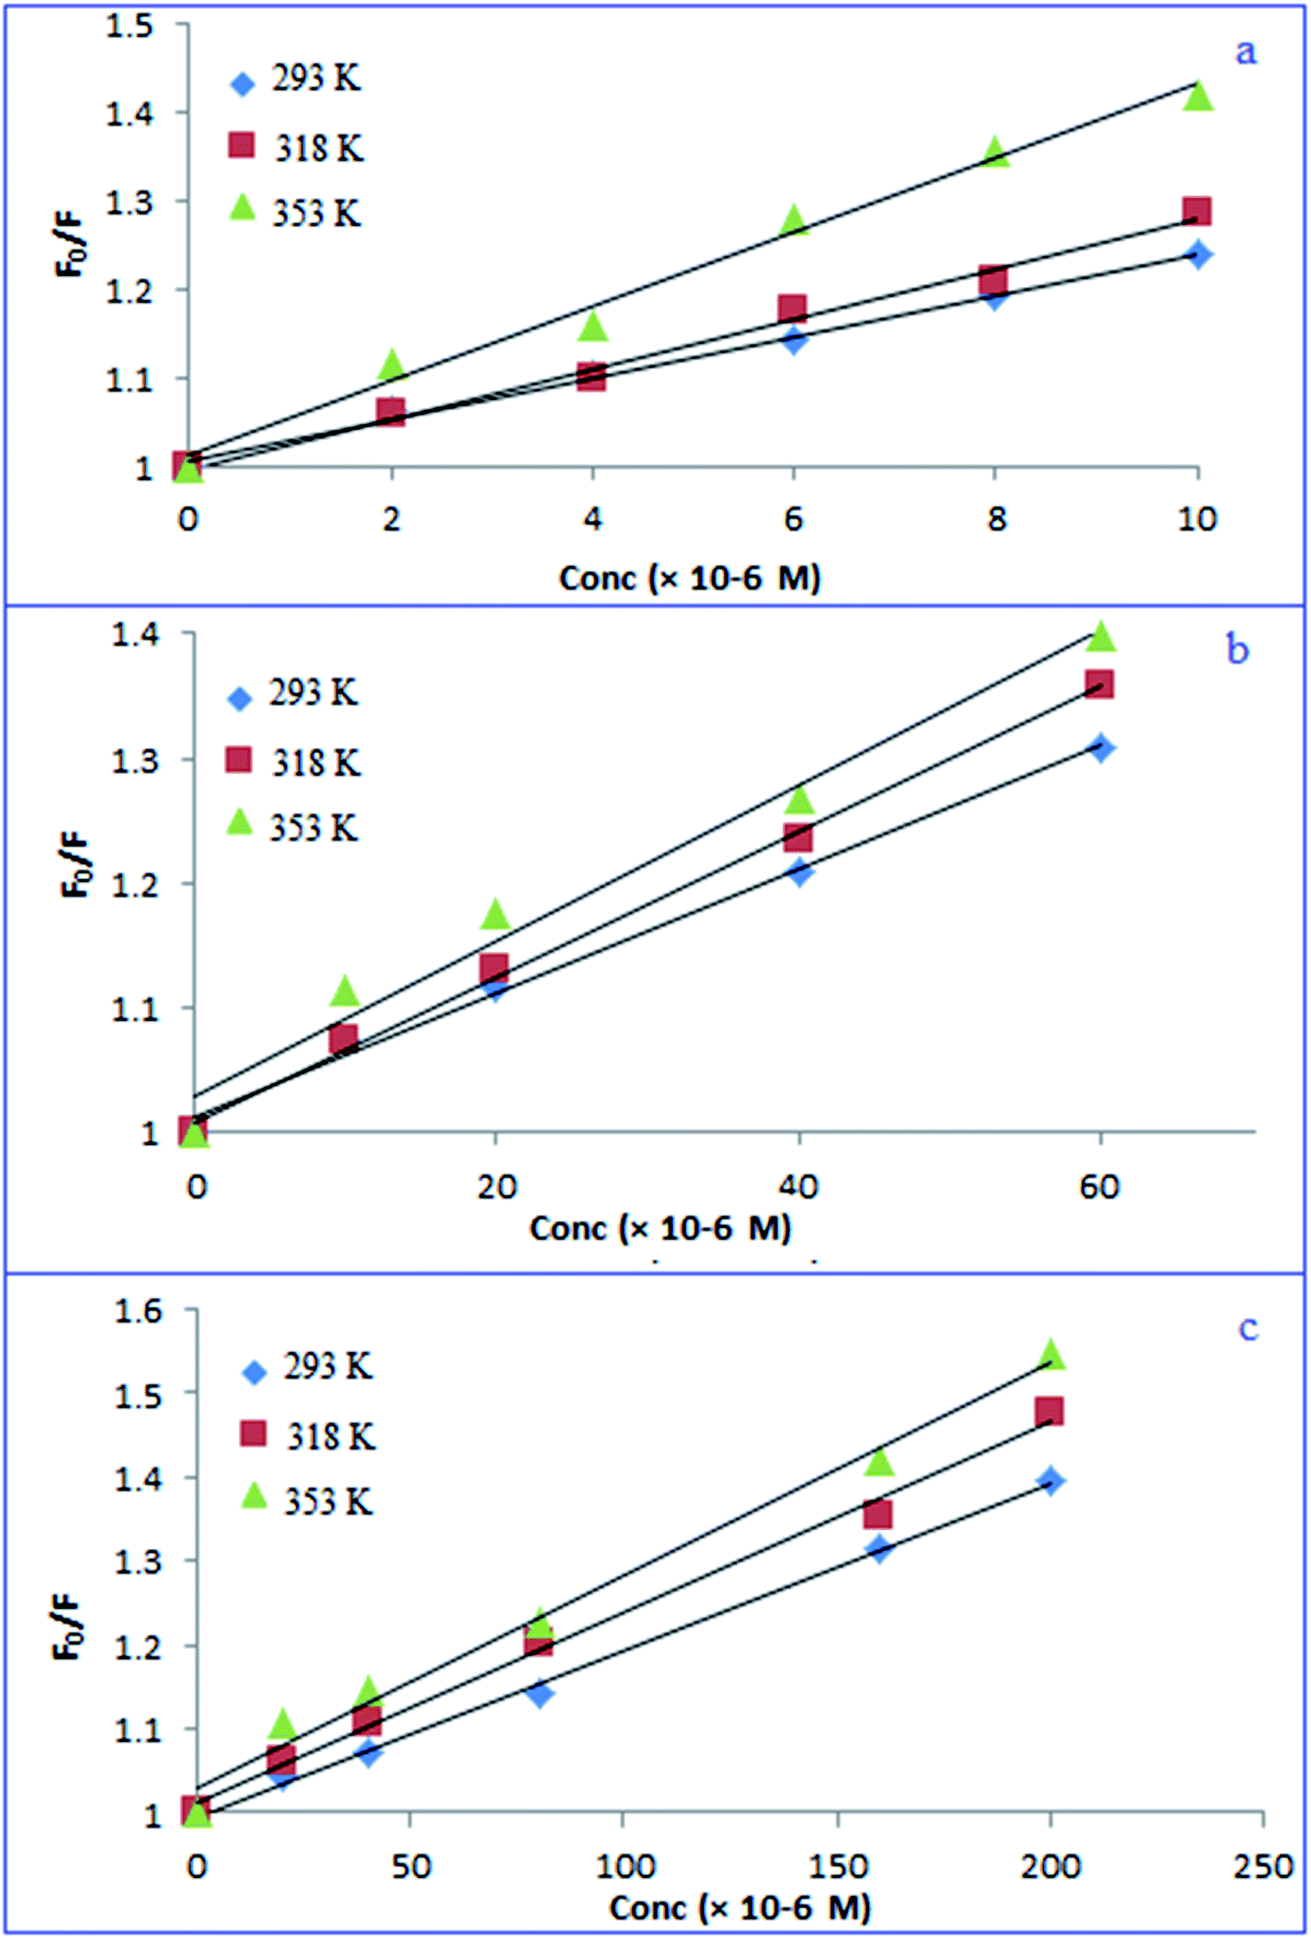 | ||
| Fig. 5 Stern–Volmer plots of the PRX/TNX/LRX (a–c) – N, S-CQDs at different temperatures. | ||
3.3. Optimization of variables affecting fluorescence sensing
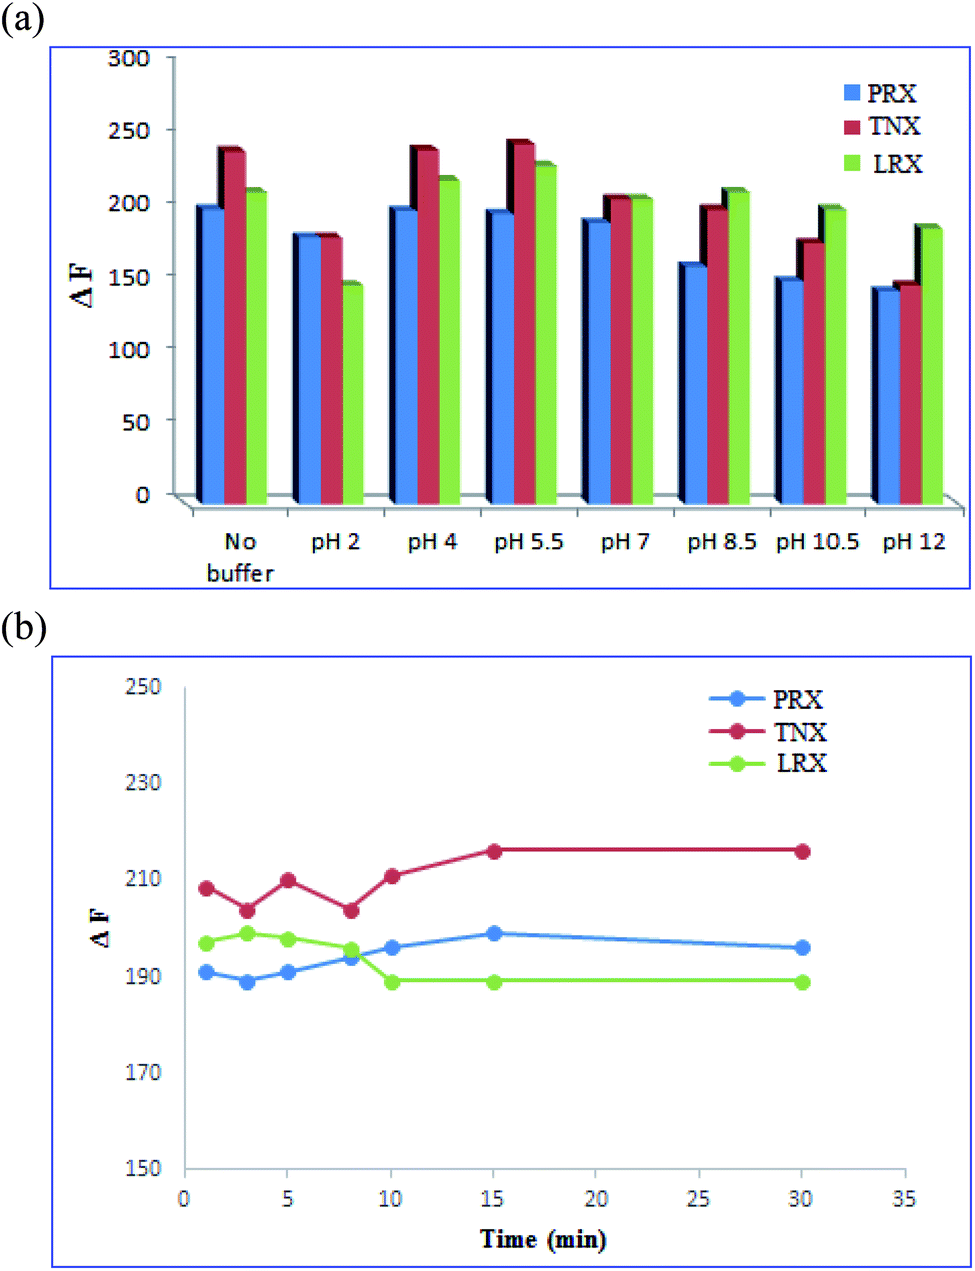 | ||
| Fig. 6 (a) The effect of pH of the buffer on fluorescence quenching of N, S-CQDs. (b) The effect of incubation time on fluorescence intensity of N, S-CQDs. | ||
3.4. Validation of the method
To prove if the proposed approach was valid, the International Conference on Harmonization (ICH) Q2 (R1) guidelines64 were adopted.For PRX, TNX, and LRX, the relationship was rectilinear over the ranges of 2.0–25.0 μM, 10.0–100.0 μM and 20.0–200.0 μM, respectively as shown in Fig. S4.† Data abridged in Table 2 show the output results as well as statistical parameters of the data. The results revealed high correlation coefficients with low values of standard deviation of intercept (Sa), standard deviation of slope (Sb), and residual standard deviation (Sy/x), implying that the calibration curves are extremely linear and precise.
| Validation parameter | PRX | TNX | LRX |
|---|---|---|---|
| Linearity range (μM) | 2.0–25.0 | 10.0–100.0 | 20.0–200.0 |
| Intercept (a) | 26.082 | 40.841 | 7.310 |
| Slope (b) | 15.504 | 3.106 | 1.305 |
| Correlation coefficient (r) | 0.9996 | 0.9999 | 0.9997 |
| S.D. of residuals (Sy/x) | 3.64 | 1.91 | 2.36 |
| S.D. of intercept (Sa) | 2.30 | 1.49 | 1.83 |
| S.D. of slope (Sb) | 0.17 | 0.02 | 0.02 |
| Limit of detection, LOD (μM) | 0.49 | 1.58 | 4.63 |
| Limit of quantitation, LOQ (μM) | 1.49 | 4.78 | 14.05 |
| Parameters | PRX | TNX | LRX | ||||||
|---|---|---|---|---|---|---|---|---|---|
| Amount taken (μM) | Amount found (μM) | % founda | Amount taken (μM) | Amount found (μM) | % founda | Amount taken (μM) | Amount found (μM) | % founda | |
| a Average of 3 replicate determinations.b The values between parentheses are the tabulated values of t and F at P = 0.05.65 | |||||||||
| 2.0 | 1.962 | 98.10 | 10.0 | 9.874 | 98.74 | 20.0 | 19.754 | 98.77 | |
| 4.0 | 3.905 | 97.63 | 20.0 | 20.201 | 101.01 | 40.0 | 40.327 | 100.82 | |
| 6.0 | 6.045 | 100.75 | 40.0 | 40.462 | 101.16 | 80.0 | 79.486 | 99.36 | |
| 8.0 | 7.941 | 99.26 | 60.0 | 59.414 | 99.02 | 120.0 | 119.325 | 99.44 | |
| 10.0 | 10.104 | 101.04 | 80.0 | 79.628 | 99.54 | 160.0 | 162.868 | 101.79 | |
| 15.0 | 15.079 | 100.53 | 100.0 | 100.435 | 100.44 | 200.0 | 198.264 | 99.13 | |
| 20.0 | 20.348 | 101.74 | |||||||
| 25.0 | 24.657 | 98.63 | |||||||
| Mean ± S.D. | 99.71 ± 1.51 | 99.99 ± 1.03 | 99.89 ± 1.17 | ||||||
| Comparison method (n = 3)22,34,41 | |||||||||
| Mean ± S.D. | 99.87 ± 1.27 | 99.42 ± 0.74 | 101.26 ± 0.72 | ||||||
| tb | 0.16 (2.26) | 0.82 (2.37) | 1.78 (2.37) | ||||||
| Fb | 1.41 (19.35) | 1.94 (19.30) | 2.64 (19.30) | ||||||
The method's precision was evaluated by determination of intermediate precisions and repeatability. Three distinct concentrations were tested from each compound, each with three replicates. Table 4 shows that the method developed has a reasonable SD and % RSD values of less than 2.0.
| Concentration (μM) | Intra-day precision | Inter-day precision | |||||
|---|---|---|---|---|---|---|---|
| Mean ± SD | % RSD | % error | Mean ± SD | % RSD | % error | ||
| PRX | 4.0 | 100.64 ± 1.42 | 1.41 | 0.81 | 101.11 ± 1.19 | 1.18 | 0.68 |
| 10.0 | 101.34 ± 1.24 | 1.22 | 0.70 | 100.65 ± 1.05 | 1.04 | 0.60 | |
| 15.0 | 99.70 ± 0.31 | 0.31 | 0.18 | 98.12 ± 1.67 | 1.70 | 0.98 | |
| TNX | 40.0 | 100.14 ± 0.89 | 0.89 | 0.51 | 100.46 ± 1.68 | 1.67 | 0.96 |
| 60.0 | 99.33 ± 0.95 | 0.96 | 0.55 | 98.85 ± 0.28 | 0.28 | 0.16 | |
| 80.0 | 96.88 ± 0.14 | 0.14 | 0.08 | 97.78 ± 1.46 | 1.49 | 0.86 | |
| LRX | 40.0 | 98.57 ± 1.30 | 1.32 | 0.76 | 99.91 ± 0.96 | 0.96 | 0.55 |
| 80.0 | 100.62 ± 1.42 | 1.41 | 0.81 | 101.58 ± 1.13 | 1.11 | 0.64 | |
| 160.0 | 101.50 ± 1.34 | 1.32 | 0.76 | 99.83 ± 1.69 | 1.69 | 0.98 | |
| Pharmaceutical formulations | Parameters | ||||
|---|---|---|---|---|---|
| Mean ± % RSD | N | Comparison methods22,34,41 | t-Test (2.78)a | F-Value (19.00)a | |
| a The values between parentheses are the tabulated values of t and F at P = 0.05.65 | |||||
| Feldene® ampoule (20 mg PRX per amp.) | 100.16 ± 1.81 | 3.00 | 99.87 ± 1.54 | 0.23 | 1.38 |
| Feldene® capsule (20 mg PRX per cap.) | 98.86 ± 0.78 | 99.92 ± 0.68 | 1.62 | 1.32 | |
| Feldene® tablet (20 mg PRX per tab.) | 101.45 ± 1.39 | 100.17 ± 1.91 | 0.99 | 1.89 | |
| Epicotil® vial (20 mg TNX per vial) | 99.13 ± 0.33 | 100.35 ± 0.74 | 2.26 | 5.03 | |
| Tenoxicam® capsule (20 mg TNX per cap.) | 101.69 ± 0.43 | 100.31 ± 1.30 | 1.64 | 9.14 | |
| Lornoxicam® vial (8 mg LRX per vial) | 99.46 ± 1.31 | 101.20 ± 0.64 | 1.96 | 4.19 | |
| Lornicam Rapid® tablet (8 mg LRX per tab.) | 99.58 ± 1.76 | 99.94 ± 1.37 | 0.30 | 1.65 | |
3.5. Structure versus activity correlation
Referring to the molecular structure of the three studied compounds, it was noticed that PRX contain benzyl group (non-polar) in its side chain, TNX on the other hand contains thiophene group (polar group because of the presence of sulphur atom) while LRX has chloro-thiophene (more polar group as it contains additional chlorine atom). From the obtained results, it was found that there is a direct correlation between the sensitivity of the proposed method (as measured by LOD values) and the gradual increase of the polarity of the studied drugs. The sensitivity was found to be reduced from PRX to TNX and then LRX with the increase of their polarity which in turn decreases binding interaction with N, S-CQDs.3.6. Method applications
 | ||
| Fig. 7 Application of proposed method for determination of PRX in spiked human plasma. | ||
The % recoveries ranged from 97.95 to 101.36 as represented in Table 6.
| Parameters | Amount taken (μM) | Amount found (μM) | % recovery |
|---|---|---|---|
| 2.0 | 1.956 | 97.95 | |
| 8.0 | 8.114 | 101.36 | |
| 16.0 | 16.101 | 100.47 | |
| 20.0 | 19.869 | 99.46 | |
| Mean ± S.D. | 99.81 ± 1.46 | ||
| Regression equation | y = 11.3587x + 54.3497 | ||
| r | 0.9998 | ||
| S.D. of residuals (Sy/x) | 2.23 | ||
| S.D. of intercept (Sa) | 2.15 | ||
| S.D. of slope (Sb) | 0.16 | ||
| Limit of detection, LOD (μM) | 0.62 | ||
| Limit of quantitation, LOQ (μM) | 1.89 | ||
4. Conclusion
Based on the quenching of the fluorescence of N, S-CQDs, a novel methodology for analysis of PRX, TNX and LRX in different dosage forms was developed. The synthesis of the used N, S-CQDs dots was achieved using a simple and cost-effective process, as it used widely attainable starting materials (CA and TSC) in a one-step hydrothermal process to produce a highly water soluble, excellent biocompatible sensor with a size less than 10 nm. The characterization of the produced N, S-CQDs was performed using different techniques including HRTEM, UV-vis absorption spectroscopy, fluorescence spectroscopy, in addition to FT-IR. The studied drugs quantitatively quenched the fluorescence of the fabricated sensor based on the dynamic quenching mechanism resulting in rapid and long-lasting fluorescence response. The developed method was sensitive, accurate, and precise with wide linearity range of 2.0–25.0 μM, 10.0–100.0 μM and 20.0–200.0 μM for PRX, TNX and LRX, respectively. The suggested approach was adapted for the estimation of PRX in spiked human plasma with accepted value of SD and good percent recoveries ranging from 97.95–101.36%. This is the first direct spectrofluorimetric approach for determining PRX, TNX or LRX that does not require previous derivatization or use of chromogenic reagent. The proposed approach was carefully validated in accordance with ICH guidelines.Ethical approval
This article does not include any studies on human participants or animals carried out by any of the authors.Conflicts of interest
The authors declare that they have no conflict of interest.References
- M. J. Molaei, Anal. Methods, 2020, 12, 1266–1287 RSC.
- S. Zhu, Y. Song, X. Zhao, J. Shao, J. Zhang and B. Yang, Nano Res., 2015, 8, 355–381 CrossRef CAS.
- S. Liu, J. Tian, L. Wang, Y. Zhang, X. Qin, Y. Luo, A. M. Asiri, A. O. Al-Youbi and X. Sun, Adv. Mater., 2012, 24, 2037–2041 CrossRef CAS PubMed.
- M. Kim, L. Adamska, N. F. Hartmann, H. Kwon, J. Liu, K. A. Velizhanin, Y. Piao, L. R. Powell, B. Meany and S. K. Doorn, J. Phys. Chem. C, 2016, 120, 11268–11276 CrossRef CAS.
- D. Iannazzo, A. Pistone, M. Salamò, S. Galvagno, R. Romeo, S. V. Giofré, C. Branca, G. Visalli and A. Di Pietro, Int. J. Pharm., 2017, 518, 185–192 CrossRef CAS PubMed.
- L. P. McGuinness, Y. Yan, A. Stacey, D. A. Simpson, L. T. Hall, D. Maclaurin, S. Prawer, P. Mulvaney, J. Wrachtrup and F. Caruso, Nat. Nanotechnol., 2011, 6, 358–363 CrossRef CAS PubMed.
- F. Li, D. Yang and H. Xu, Chem.–Eur. J., 2019, 25, 1165–1176 CrossRef CAS PubMed.
- L. Li and T. Dong, J. Mater. Chem., 2018, 6, 7944–7970 CAS.
- T. S. Atabaev, Nanomaterials, 2018, 8, 342 CrossRef PubMed.
- L. Lin, Y. Luo, P. Tsai, J. Wang and X. Chen, TrAC, Trends Anal. Chem., 2018, 103, 87–101 CrossRef CAS.
- M. El-Maghrabey, R. El-Shaheny, F. Belal, N. Kishikawa and N. Kuroda, in Nanosensor Technologies for Environmental Monitoring, ed. Inamuddin and A. M. Asiri, Springer International Publishing, Cham, 2020, pp. 491–516, DOI:10.1007/978-3-030-45116-5_17.
- H. Wu, J. Jiang, X. Gu and C. Tong, Microchim. Acta, 2017, 184, 2291–2298 CrossRef CAS.
- J. Zhou, P. Lin, J. Ma, X. Shan, H. Feng, C. Chen, J. Chen and Z. Qian, RSC Adv., 2013, 3, 9625–9628 RSC.
- M. Xue, L. Zhang, M. Zou, C. Lan, Z. Zhan and S. Zhao, Sens. Actuators, B, 2015, 219, 50–56 CrossRef CAS.
- J. Chen, J. Liu, J. Li, L. Xu and Y. Qiao, J. Colloid Interface Sci., 2017, 485, 167–174 CrossRef CAS PubMed.
- Y. Wang, Q. Zhuang and Y. Ni, Chem.–Eur. J., 2015, 21, 13004–13011 CrossRef CAS PubMed.
- D. Sun, R. Ban, P.-H. Zhang, G.-H. Wu, J.-R. Zhang and J.-J. Zhu, Carbon, 2013, 64, 424–434 CrossRef CAS.
- M. Amjadi, J. L. Manzoori, T. Hallaj and N. Azizi, J. Lumin., 2017, 182, 246–251 CrossRef CAS.
- L. S. Goodman, Goodman and Gilman's the Pharmacological Basis of Therapeutics, McGraw-Hill, New York, 1996 Search PubMed.
- M. Guttadauria, Acta Obstet. Gynecol. Scand., 1986, 65, 11–13 CrossRef PubMed.
- R. D. Howland, M. J. Mycek, R. A. Harvey and P. C. Champe, Lippincott's Illustrated Reviews: Pharmacology, Lippincott Williams & Wilkins, Philadelphia, 2006 Search PubMed.
- E. R. M. Hackmann, E. A. dos Santos Gianotto and M. I. R. M. Santoro, Anal. Lett., 1993, 26, 259–269 CrossRef CAS.
- S. N. H. Azmi, B. Iqbal, M. A. M. Jaboob, W. A. S. Al Shahari and N. Rahman, J. Chin. Chem. Soc., 2009, 56, 1083–1091 CrossRef CAS.
- A. S. Amin, J. Pharm. Biomed. Anal., 2002, 29, 729–736 CrossRef CAS PubMed.
- M. El-Ries, Anal. Lett., 1998, 31, 793–807 CrossRef CAS.
- J. L. Manzoori and M. Amjadi, Microchim. Acta, 2003, 143, 39–44 CrossRef CAS.
- A. B. Tabrizi, J. Food Drug Anal., 2007, 15, 242–248 CAS.
- M. Gamal, H. M. Ali, S. M. Fraihat and T. S. Elnasr, Luminescence, 2019, 34, 644–650 CrossRef CAS PubMed.
- A. Feizollahi, A. A. Rafati, P. Assari and R. A. Joghani, J. Electrochem. Soc., 2020, 167, 067521 CrossRef CAS.
- G. Ghobadpour, F. Farjami and F. Fasihi, Curr. Pharm. Anal., 2019, 15, 45–50 CrossRef CAS.
- A. G. Dal, Z. Oktayer and D. Doğrukol-Ak, J. Anal. Methods Chem., 2014, 2014, 1–7 CrossRef PubMed.
- J. Otarola, A. G. Lista, B. F. Band and M. Garrido, J. Pharm. Anal., 2015, 5, 70–73 CrossRef CAS PubMed.
- A. Chaplenko, O. Monogarova and K. Oskolok, Int. J. Pharm. Biol. Arch., 2018, 9, 31–35 Search PubMed.
- A. K. Singh, P. López García, F. P. Gomes, E. R. M. Kedor-Hackmann and M. I. R. M. Santoro, Rev. Bras. Cienc. Farm., 2007, 43, 615–622 CrossRef CAS.
- E. A. Taha, N. N. Salama and L. E.-S. A. Fattah, Chem. Pharm. Bull., 2006, 54, 653–658 CrossRef CAS PubMed.
- P. Antonoaea, A. G. Cârje, A. Ciurba, N. Todoran, A. R. Vlad and D. L. Muntean, Acta Med. Marisiensis, 2017, 63, 178–182 CrossRef CAS.
- M. A. Madni, A. Raza, S. Abbas, N. Tahir, M. Rehman, P. M. Kashif and M. I. Khan, Acta Pol. Pharm., 2016, 73, 1129–1134 CAS.
- M. Sadikoglu and A. Cabuk, Int. J. Electrochem. Sci., 2019, 14, 4508–4519 CrossRef CAS.
- A. Fatma and A. Sena, Turk. J. Pharm. Sci., 2019, 16, 184 CrossRef PubMed.
- J. A. Balfour, A. Fitton and L. B. Barradell, Drugs, 1996, 51, 639–657 CrossRef CAS PubMed.
- S. K. Sahoo, R. K. Giri, S. V. Patil, A. R. Behera and R. Mohapatra, Trop. J. Pharm. Res., 2012, 11, 269–273 Search PubMed.
- S. N. H. Shah, K. Sohail, Z. Javaid, M. Zaman and E. Basheer, Pak. J. Pharm. Sci., 2019, 32, 333–338 CAS.
- F. Belal, M. A. Omar, S. M. Derayea, S. Zayed, M. A. Hammad, S. F. Saleh, H. A. Alhazmi and M. Al Bratty, Curr. Pharm. Anal., 2020, 16, 1148–1156 CrossRef CAS.
- N. Salunkhe, N. Jadhav and S. Bhinge, Sep. Sci. Plus, 2019, 2, 405–415 CrossRef CAS.
- M. Ghoneim, A. Beltagi and A. Radi, Anal. Sci., 2002, 18, 183–186 CrossRef CAS PubMed.
- B. Bozal and B. Uslu, Comb. Chem. High Throughput Screening, 2010, 13, 599–609 CrossRef CAS PubMed.
- G. Magdy, A. F. A. Hakiem, F. Belal and A. M. Abdel-Megied, Food Chem., 2021, 343, 128539 CrossRef CAS PubMed.
- F. Belal, M. Mabrouk, S. Hammad, A. Barseem and H. Ahmed, J. Fluoresc., 2021, 31, 85–90 CrossRef CAS PubMed.
- X. Wang, L. Cao, S. T. Yang, F. Lu, M. J. Meziani, L. Tian, K. W. Sun, M. A. Bloodgood and Y. P. Sun, Angew. Chem., Int. Ed., 2010, 49, 5310–5314 CrossRef CAS PubMed.
- P. Anilkumar, X. Wang, L. Cao, S. Sahu, J.-H. Liu, P. Wang, K. Korch, K. N. Tackett II, A. Parenzan and Y.-P. Sun, Nanoscale, 2011, 3, 2023–2027 RSC.
- Z. Fu and F. Cui, RSC Adv., 2016, 6, 63681–63688 RSC.
- M. Xue, L. Zhang, Z. Zhan, M. Zou, Y. Huang and S. Zhao, Talanta, 2016, 150, 324–330 CrossRef CAS PubMed.
- L. Hu, Y. Sun, Y. Zhou, L. Bai, Y. Zhang, M. Han, H. Huang, Y. Liu and Z. Kang, Inorg. Chem. Front., 2017, 4, 946–953 RSC.
- S. O. A. Ahmad, M. Ikram, M. Imran, S. Naz, A. Ul-Hamid, A. Haider, A. Shahzadi and J. Haider, RSC Adv., 2021, 11, 23330–23344 RSC.
- S. Mureed, S. Naz, A. Haider, A. Raza, A. Ul-Hamid, J. Haider, M. Ikram, R. Ghaffar, M. Irshad and A. Ghaffar, Nanoscale Res. Lett., 2021, 16, 1–12 CrossRef PubMed.
- M. Ikram, I. Hussain, J. Hassan, A. Haider, M. Imran, M. Aqeel, A. Ul-Hamid and S. Ali, Ceram. Int., 2020, 46, 21073–21083 CrossRef CAS.
- A. Haider, M. Ijaz, S. Ali, J. Haider, M. Imran, H. Majeed, I. Shahzadi, M. M. Ali, J. A. Khan and M. Ikram, Nanoscale Res. Lett., 2020, 15, 1–11 CrossRef CAS PubMed.
- J. Tashkhourian, G. Absalan, M. Jafari and S. Zare, Spectrochim. Acta, Part A, 2016, 152, 119–125 CrossRef CAS PubMed.
- J. R. Lakowicz, Principles of Fluorescence Spectroscopy, Springer Science & Business Media, 2013 Search PubMed.
- V. D. Suryawanshi, L. S. Walekar, A. H. Gore, P. V. Anbhule and G. B. Kolekar, J. Pharm. Anal., 2016, 6, 56–63 CrossRef PubMed.
- G. Xiang, C. Tong and H. Lin, J. Fluoresc., 2007, 17, 512–521 CrossRef CAS PubMed.
- K. Grigoryan and A. Ghazaryan, Chem. Biol., 2013, 2, 6–10 Search PubMed.
- Y.-h. Zhang, H.-s. Zhang, X.-f. Guo and H. Wang, Microchem. J., 2008, 89, 142–147 CrossRef CAS.
- ICH Harmonised Tripartite Guidelines, Validation of analytical procedures: text and methodology Q2 (R1), https://www.ich.org/products/guidelines/quality/article/quality-guidelines.html, accessed, April, 2022 Search PubMed.
- J. Miller and J. Miller, Statistics and Chemometrics for Analytical Chemistry, Prentic Hall, Hariow, England, 2005 Search PubMed.
- D. C. Hobbs and T. M. Twomey, J. Clin. Pharmacol., 1979, 19, 270–281 CrossRef CAS PubMed.
- A. C. Moffat, M. D. Osselton, B. Widdop and J. Watts, Clarke's Analysis of Drugs and Poisons, Pharmaceutical Press, London, 2011 Search PubMed.
Footnote |
| † Electronic supplementary information (ESI) available. See https://doi.org/10.1039/d2ra01040b |
| This journal is © The Royal Society of Chemistry 2022 |