 Open Access Article
Creative Commons Attribution 3.0 Unported Licence
Crystal growth, layered structure and luminescence properties of K2Eu(PO4)(WO4)†
Kateryna V. Terebilenko *a,
Vitalii P. Chorniiab,
Valeriіa O. Zozuliaa,
Il'ya A. Gural'skiya,
Sergiu G. Shovac,
Serhii G. Nedilkoa and
Mykola S. Slobodyanika
aTaras Shevchenko National University of Kyiv, Volodymyrska St. 64, Kyiv 01601, Ukraine. E-mail: kterebilenko@gmail.com
bNational University of Life and Environmental Sciences of Ukraine, Heroiv Oborony St, 15, Kyiv, 03041, Ukraine
c“Petru Poni” Institute of Macromolecular Chemistry, 41A Aleea Gr. Ghica Voda, 700487 Iasi, Romania
First published on 22nd March 2022
Abstract
K2Eu(PO4)(WO4) has been prepared via the high-temperature solution growth (HTSG) method using K2WO4–KPO3 molten salts as a self-flux and characterized by single-crystal X-ray diffraction analysis, IR and luminescence spectroscopy. The structure of this new compound features a 2D framework containing [EuPO6]4− layers, which are composed of zigzag chains of [EuO8]n interlinked by slightly distorted PO4 tetrahedra. Isolated WO4 tetrahedra are attached above and below these layers, leaving space for the K+ counter-cations. The photoluminescence (PL) characteristics (spectra, line intensity distribution and decay kinetics) confirm structural data concerning one distinct position for europium ions. The luminescence color coordinates suggest K2Eu(PO4)(WO4) as an efficient red phosphor for lighting applications.
Introduction
Lanthanide-containing complex oxides based on phosphate, vanadate, molybdate and tungstate have been actively studied as phosphors for solid lighting technologies, particularly for white light emitting diodes (LEDs).1–3 Among them, much attention has been paid to Eu3+-containing compounds due to their prominent photoluminescence (PL) in the red spectral region. This photoluminescence can be excited by (1) a direct excitation of Eu3+ ions through intraconfigurational 4f6–4f6 absorption transitions, (2) charge transfer transitions from ligand to europium(III) ion or (3) an energy transfer of absorbed energy from a host to rare-earth (RE) ions. Among these ways the 4f6–4f6 transitions lead to low values of absorption cross-sections because they are forbidden from the viewpoint of quantum mechanics. The wide band of O2− → Eu3+ charge–transfer transition has high intensity and is located at ∼225–300 nm for many oxide compounds.4–7 However, absence of cheap semiconductor chips with intensive radiation at this short wavelength makes excitation through O2− → Eu3+ mechanism inconvenient for LED applications. The third takes place through absorption of light by structural moieties of the host with further transfer of absorbed energy to Eu3+-based emission centres. In case of molybdate and tungstate compounds this type of absorption is realized through O2− → Mo6+ or O2− → W6+ charge transfer providing a wide band in 250–350 nm range in the PL excitation spectra.7–10 From LED application viewpoint suitable PL excitation can be achieved simultaneously through a direct f–f transition in rare earth ions and by light absorption of the host. It is worth noting that the most intensive absorption usually takes place in the energy region near to the host band gap. In case of complex oxides with molecular anions listed above, the typical band gap values fall within 3–5 eV energy region that is considered as the most convenient for phosphor elaboration.1One of the advantages of molybdate and tungstate hosts for rare earth ions is related with weak concentration quenching of luminescence caused by these ions, particularly Eu3+ ones. This phenomenon is explained by quite inefficient energy transfer between Eu3+ ions those ones located at the distances at about 4–5 Å each from another.8,11 Some of the structures discussed are layered and characterized by preferable directions for energy transfer. Layered crystal structure is inherent also to mixed-anion compounds with general formula A2R(PO4)(MO4), where A = Na or K; R = Y, Bi or RE; M = Mo or W.12–18 Although the first structure of this family, Na2Y(PO4)(MoO4), was reported more than three decades ago,12 there are some gaps in the studies of layered phosphomolybdates concerning both crystal structure and their physicochemical properties. To the best of our knowledge there are no reports in the literature on synthesis, crystal structure and optical properties of K2Eu(PO4)(WO4). Importantly, an isostructural compound K2Eu(PO4)(MoO4) has been reported as an efficient phosphor possessing intensive red luminescence.15 The luminescence properties of the mentioned above phosphomolybdate15 has been studied in a light of bismuth by europium substitution in the K2Bi(PO4)(MoO4) structure.19 The further studies of K2Eu(PO4)(MoO4) luminescence have shown that its quantum yield is close to 96% and 86% when the PL excitation is performed at 394 and 465 nm, respectively.20 It is worth noting, the substitution of molybdenum by tungsten in K2Bi(PO4)(MoO4)![[thin space (1/6-em)]](https://www.rsc.org/images/entities/char_2009.gif) :
:![[thin space (1/6-em)]](https://www.rsc.org/images/entities/char_2009.gif) Eu phosphor improves intensity of luminescence with best results achieved for K2Bi(PO4)(WO4)
Eu phosphor improves intensity of luminescence with best results achieved for K2Bi(PO4)(WO4)![[thin space (1/6-em)]](https://www.rsc.org/images/entities/char_2009.gif) :
:![[thin space (1/6-em)]](https://www.rsc.org/images/entities/char_2009.gif) 0.8Eu.19
0.8Eu.19
The effect of anion substitution in similar layered compounds has been shown to be a driving force in separating emission centers and therefore enhancing the thermal stability and increasing the critical concentration of activator ions.21,22 Thus, anionic ratio MoO42−/PO43− for Na2−nY(MoO4)1+n(PO4)1−n![[thin space (1/6-em)]](https://www.rsc.org/images/entities/char_2009.gif) :
:![[thin space (1/6-em)]](https://www.rsc.org/images/entities/char_2009.gif) Tb3+,Eu3+ has been used for improving the thermal stability of phosphors obtained.22 In this light one should admit significant difference in excitation and luminescence spectra for isostructural hosts containing molybdate15,21,23 and tungstate groups.24,25 To clarify this phenomenon more spectral data for phosphotungstates should be collected and analysed.
Tb3+,Eu3+ has been used for improving the thermal stability of phosphors obtained.22 In this light one should admit significant difference in excitation and luminescence spectra for isostructural hosts containing molybdate15,21,23 and tungstate groups.24,25 To clarify this phenomenon more spectral data for phosphotungstates should be collected and analysed.
In the present paper we report single crystal growth, crystal structure and luminescence properties of the layered phosphor K2Eu(PO4)(WO4).
Experimental
Synthetic procedures
Single crystals of K2Eu(PO4)(WO4) have been grown by the high-temperature solution growth method from K2WO4![[thin space (1/6-em)]](https://www.rsc.org/images/entities/char_2009.gif) :
:![[thin space (1/6-em)]](https://www.rsc.org/images/entities/char_2009.gif) KH2PO4
KH2PO4![[thin space (1/6-em)]](https://www.rsc.org/images/entities/char_2009.gif) :
:![[thin space (1/6-em)]](https://www.rsc.org/images/entities/char_2009.gif) Eu2O3 molten mixture in the ratio 4.99
Eu2O3 molten mixture in the ratio 4.99![[thin space (1/6-em)]](https://www.rsc.org/images/entities/char_2009.gif) :
:![[thin space (1/6-em)]](https://www.rsc.org/images/entities/char_2009.gif) 4.99
4.99![[thin space (1/6-em)]](https://www.rsc.org/images/entities/char_2009.gif) :
:![[thin space (1/6-em)]](https://www.rsc.org/images/entities/char_2009.gif) 0.02. The precursors without further purification have been mixed and grinded together in an agate mortar and melted in a platinum crucible at 1100 °C. On the next stage the high-temperature solution prepared has been kept at this temperature for 2 hours under stirring in order to reach the homogeneity. The molten mixture has been cooled down to 750 °C at the rate of 80 °C h−1. At this stage the melt has been poured down on a copper sheet and a crystalline product has been left in the furnace for slow cooling to room temperature. The colourless plates have been leached out with hot deionized water and characterized by IR and single crystal X-ray diffraction.
0.02. The precursors without further purification have been mixed and grinded together in an agate mortar and melted in a platinum crucible at 1100 °C. On the next stage the high-temperature solution prepared has been kept at this temperature for 2 hours under stirring in order to reach the homogeneity. The molten mixture has been cooled down to 750 °C at the rate of 80 °C h−1. At this stage the melt has been poured down on a copper sheet and a crystalline product has been left in the furnace for slow cooling to room temperature. The colourless plates have been leached out with hot deionized water and characterized by IR and single crystal X-ray diffraction.
Crystallography
A suitable single crystal of K2Eu(PO4)(WO4) was selected and mounted on an Xcalibur, Eos diffractometer (Mo-Kα radiation, λ = 0.71073). The crystal was kept at 293 K during data collection. Using Olex2,26 the structure was solved with the SHELXT27 structure solution program (Intrinsic Phasing method) and refined with the SHELXL28 refinement package (Least Squares minimisation). Crystallographic data and structure refinement parameters for K2Eu(PO4)(WO4) are summarized in Table 1.| Empirical formula | EuK2O8PW |
|---|---|
| Formula weight | 572.98 |
| Temperature/K | 293(2) |
| Crystal system | Orthorhombic |
| Space group | Ibca |
| a/Å | 6.9856(4) |
| b Å | 12.2954(5) |
| c/Å | 19.7434(9) |
| Volume/Å3 | 1695.79(15) |
| Z | 8 |
| ρcalc, g cm−3 | 4.489 |
| μ mm−1 | 22.064 |
| Crystal size/mm3 | 0.25 × 0.25 × 0.02 |
| 2Θ range for data collection/° | 4.126 to 58.916 |
| Reflections collected | 5948 |
| Independent reflections | 1049 [Rint = 0.0528, Rsigma = 0.0374] |
| Data/restraints/parameters | 1049/0/61 |
| Goodness-of-fit on F2 | 1.084 |
| Final R indexes [I>=2σ (I)] | R1 = 0.0326, wR2 = 0.0799 |
Further details on the structure refinements of K2Eu(PO4)(WO4) may be obtained from the Fachinformationszentrum Karlsruhe, D-76344 Eggenstein-Leopoldshafen (Germany), by quoting the Registry no. CSD – 2151141.
Sample characterization
Investigations of the thermal behavior of the K2Eu(PO4)(WO4) have been performed using a Shimadzu DTG-60H simultaneous thermogravimetry/differential thermal analyzer. The sample and the reference (α-Al2O3) were heated up to 900 °C in Pt crucibles under an air atmosphere at 10 °C min−1.IR spectrum has been measured on a PerkinElmer Spectrum BX FTIR spectrometer in the frequency range 400–4400 cm−1 in KBr pellets.
The PL emission and excitation spectra of the samples have been recorded at room temperature using a DFS-12 spectrometer equipped with a FEU-79 photomultiplier. A powerful Xenon arc lamp (DXeL-1000) combined with a DMR-4 prism monochromator was used as source of the excitation light. All the spectra have been corrected on system response.
The PL kinetics have been measured with use of a MSA-300 multiscaler photon counter and a blue LED (λrad = 465 nm) operating at pulse regimes as a source of the PL excitation.
Results and discussion
Crystal structure
The dipotassium europium(III) phosphate(V) tungstate(VI) K2Eu(PO4)(WO4) crystallizes in the Ibca space group (orthorhombic crystal system) with eight K2Eu(PO4)(WO4) formula units per unit cell (Table 1). There is one crystallographically unique europium cite in the Wyckoff special position 8d, showing a coordination sphere of eight oxygen atoms in the shape of a triangular dodecahedron (Fig. 1a).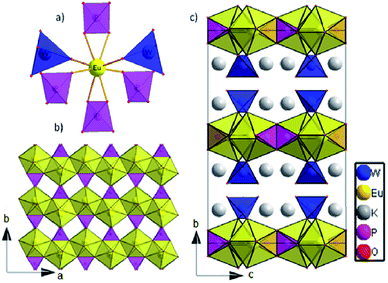 | ||
| Fig. 1 (a) The nearest surrounding of europium cation in K2Eu(PO4)(WO4) structure; (b) 2D layer at ab plane; c) The crystal structure view along a axis. | ||
The distortions of the coordination environment of europium, phosphorus and tungsten have been calculated with Shape 2.0 program29 via the Continuous Shape Measure method. The value of S = 2.908 was obtained for the Eu environment, which means a quite essential deviation from the ideal triangular dodecahedron.30 Each Eu cation is surrounded by two tungstate and four phosphate groups; two of them are coordinated in a bidentate manner (Fig. 1a). Among Eu–O bond distances, those that correspond to bidentately – coordinated phosphate groups are the largest (2.433(6) Å and 2.475(5) Å, respectively, see Table 2). Thus, K2Eu(PO4)(WO4) comprises non-condensed phosphate and tungstate tetrahedra.
| Moieties (MOx) | EuO8 | KO8 | PO4 | WO4 |
|---|---|---|---|---|
| Bond lengths (Å) | 2.327(6) ×2 | 2.659(6) | 1.515(5)×2 | 1.763(6)×2 |
| 2.392(6) ×2 | 2.705(6) | 1.543(6)×2 | 1.788(6)×2 | |
| 2.433(6) ×2 | 2.782(6) | |||
| 2.475(5) ×2 | 2.970(7) | |||
| 2.980(7) | ||||
| 3.069(6) | ||||
| 3.186(7) | ||||
| 3.198(7) | ||||
| M Site symmetry | C2 | C1 | C2 | |
| Polyhedron type | Triangular | Biaugmented trigonal prism | Tetrahedron | |
| Dodecahedron | ||||
| Symmetry of ideal polyhedron | D2d | C2v | Td | |
| S | 2.908 | 4.036 | 0.212 | 0.047 |
Each tetrahedrally coordinated phosphorus(V) and tungsten(VI) atoms are crystallographically unique and are located at the Wyckoff positions 8d and 8e, respectively. They are surrounded by four oxygen atoms forming bisphenoidally distorted tetrahedra. The small values of the S parameter (Table 2) indicate a slight deviation from ideal tetrahedra for both PO4 and WO4. Despite the fact that both tetrahedral moieties exhibit C2 site symmetry, phosphate tetrahedra are found to be more disported than tungstate ones.
Europium triangular dodecahedra are connected by common edges forming a zigzag chain along a axis (Fig. 1b). These [EuO8]n zig-zag chains are linked by phosphate tetrahedra building a layer in ab-plane (Fig. 1b). Finally, the WO4 tetrahedra are attached to the plane from both sides along b axis (Fig. 1c). Layers [EuPO6]4- represent the nearest Eu⋯Eu contacts 3.9644(4) Å, while the other ones are much longer and belong to different layers (Fig. 2a). In comparison to K2Eu(PO4)(MoO4) structure15 the shortest distance between neighbor Eu⋯Eu contacts are much shorter being 3.5 Å. Potassium cations are found on crystallographically unique 16f Wyckoff positions, showing a coordination sphere of eight oxygen atoms in the shape of biaugmented trigonal prism (Table 2), which reside among the voids between the neighboring sheets.
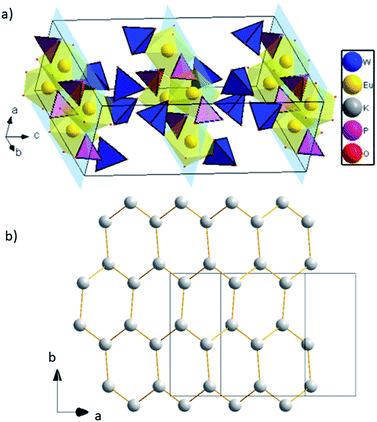 | ||
| Fig. 2 (a) 2D layers [EuPO6]4-, K atoms are omitted for clarity; (b) graphene-like layer of K cations. | ||
Interestingly, potassium cations within the layer form a graphene-like sheets along direction (1 0 1) with the shortest K to K distance equal to 3.9869(1) Å, and the longest are 4.2492(1) Å (Fig. 2b).
Thermal analysis
K2Eu(PO4)(WO4) is characterized by high thermal stability in the temperature range of 20–900 °C with slight weight loss less than 0.65% most probably explained by adsorbed water. Taking into consideration that melting point of K2Eu(PO4)(MoO4)15 is above 1050 °C, the thermal stability of the tungstate-containing analogue may be expected to be higher.IR spectroscopy
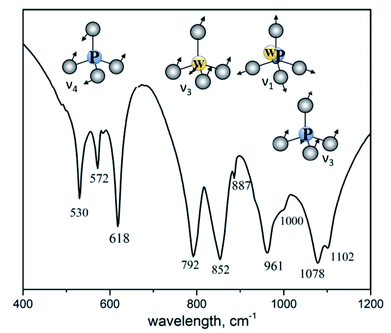
Fig. 3 shows IR spectrum of K2Eu(PO4)(WO4) in the region of 400–1200 cm−1 where the most intensive absorption bands are located. From structural point of view, the titled compound is isostructural to the parent one K2Bi(PO4)(MoO4).14 Spectroscopic data illustrates the difference in the local symmetry of tetrahedral units. Thus, the wide band located at 1078 cm−1 with a shoulder at 1102 cm−1 is ascribed to the asymmetric stretching vibration ν3(F2) in PO4 tetrahedra.31 On the contrary, this band in IR spectrum of K2Bi(PO4)(MoO4) is redshifted toward 1055 cm−1. The same situation is found for a band at 961 cm−1 with a shoulder at 1000 cm−1 which is ascribed to the symmetric stretching vibration ν1(F2) in PO4 tetrahedra. The corresponding band is found at 945 cm−1 in the case of K2Bi(PO4)(MoO4) (Table 3). The bands in a range of 887–792 cm−1 can be attributed to stretching vibrations in the WO4 tetrahedra. The 500–650 cm−1 region shows three bonds expected for ν4(F2) of PO4 tetrahedra bending vibrations: 618, 572 and 530 cm−1. The characteristic bands observed for the title compound agree well with other isostructural compounds (Table 3).| Host | ν3(PO4) | ν1(PO4)+ ν1(MO4) | ν3(MO4) | ν4(PO4) |
|---|---|---|---|---|
| K2Eu(PO4)(WO4) | 1102 | 1000 | 887 | 618 |
| 1078 | 961 | 852 | 572 | |
| 792 | 530 | |||
| Na2Y(PO4)(WO4)32 | 1095 | 985 | 860 | 620 |
| 945 | 823 | 575 | ||
| 797 | 535 | |||
| Rb2Eu(PO4)(MoO4)33 | 1075 | 950 | 901 | 608 |
| 825 | 562 | |||
| 780 | 524 | |||
| K2Gd(PO4)(WO4)34 | 1081 | 962 | 843 | — |
| 786 | ||||
| K2Bi(PO4)(MoO4)14 | 1055 | 945 | 895 | 590 |
| 860 | 555 | |||
| 815 | 520 | |||
| 790 | ||||
| 740 |
Luminescence spectroscopy
The phosphotungstate K2Eu(PO4)(WO4) reveals intensive red photoluminescence in case of excitation under UV and blue light excitation at room temperature. The corresponding spectra consist of relatively narrow emission bands which are related with 5D0 → 7FJ=1−4 electronic transitions in Eu3+ ions (Fig. 3). The most intensive bands located near 615 and 700 nm correspond to forced electric dipole transitions 5D0 → 7F2 and 5D0 → 7F4, respectively. It should be pointed out that intensity of the bands of 5D0 → 7F4 transitions is abnormally high in respect to 5D0 → 7F1 ones for all spectra obtained. This phenomenon is not typical for Eu3+ ions emission in solids but it has been observed earlier for some hosts, in particular phosphate and tungstate ones.35–38 High intensity of the 5D0 → 7F4 transitions was explained earlier assuming the highly polarizable chemical environment for Eu3+ emission centre.32 In our case, the europium cations are surrounded by 4 phosphate and 2 tungstate tetrahedra (Fig. 1a). Taking into consideration the second coordination sphere of EuO8 polyhedra one can admit more covalent character in case of P–O–Eu bonds in comparison to W–O–Eu ones. These structure-related peculiarities can be regarded as the source of higher polarizability of Eu3+ environment in the K2Eu(PO4)(WO4) and, consequently, the reason for high emission intensity of the 5D0 → 7F4 transitions.Moreover, the ratios between the PL intensities of 5D0 → 7F4 and 5D0 → 7FJ=1,2 transitions depend on excitation wavelength (calculated values are collected in the Table 4). This phenomenon can be explained by the influence of electron-phonon coupling in two types of luminescence centers: a regular EuO8 polyhedron and a defect-containing one. The high value of the asymmetry ratio, R = I(5D0 → 7F2)/I(5D0 → 7F1), in the Table 4 indicates that Eu3+ cations are located at low-symmetry sites without inversion centre in accordance with structural data. Ratio of intensities I(5D0 → 7F4)/I(5D0 → 7F2) changes slightly when λex is switched from 380 to 393 nm that is also related with the impact of defect-containing luminescence centers.
| λex, nm | R = I(7F2)/I(7F1) | I(7F4)/I(7F1) | I(7F4)/I(7F2) | x | y |
|---|---|---|---|---|---|
| a total intensity is calculated as area under spectra in the regions 580–600 (5D0 → 7F1), 600–630 (5D0 → 7F2) and 680–710 nm (5D0 → 7F4). | |||||
| 380 | 3.05 | 4.26 | 1.40 | 0.647 | 0.349 |
| 393 | 3.26 | 5.40 | 1.66 | 0.652 | 0.347 |
| 466 | 2.96 | 4.94 | 1.67 | 0.647 | 0.353 |
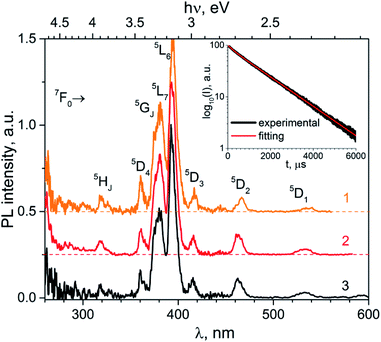
The normalized PL excitation spectra of the Eu3+-related luminescence in the K2Eu(PO4)(WO4) are shown in Fig. 4. The most intensive band peaking at 393 nm in the spectra is related with 7F0 → 5L6 transition. Less intensive bands are located near 319 (7F0 → 5HJ), 360 (7F0 → 5D4), 375 (7F0 → 5GJ), 380 (7F0 → 5L7,8), 415 (7F0 → 5D3), 465 (7F0 → 5D2), 534 and 543 nm (7F0-2→5D1). The wide band with maximum below 260 nm is ascribed to O2− → Eu3+ charge transfer that typically observed for Eu3+-containing oxide compounds, e.g. in case of the K2Eu(PO4)(MoO4) ones.19,20
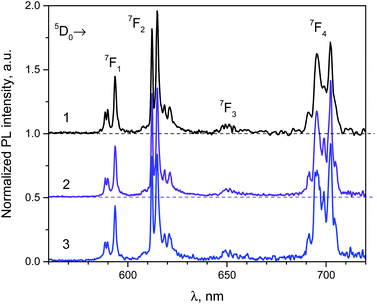 | ||
| Fig. 4 Luminescence spectra of the K2Eu(PO4)(WO4) obtained for excitation at λex = 380 (1), 393 (2) and 466 nm (2) at room temperature. | ||
Minor changes in the PL excitation spectra can be seen in the regions of 7F0 → 5L6 and 7F0 → 5D2 electronic transitions. In case of registration at λem = 594 nm the band maxima of these transitions are shifted toward longer wavelength in respect to corresponding bands in the PL excitation spectra registered at λem = 615 and 702.5 nm. These shifts are about 0.02 eV in energy scale that is comparable with kT value at room temperature (0.026 eV). It has been found that under excitation at 465 nm and registration at 615 nm the PL kinetics curve can be fitted by double exponential decay: I = 10.6 × exp(−t/τ1) + 88.4 × exp(−t/t2) with time constants τ1 = 277 ± 5 μs and τ2 = 1527 ± 2 μs. Average lifetime for K2Eu(PO4)(WO4) has a value of 1379 μs when calculated with formula τavg = (I1 × τ1 + I2 × τ2)/(I1 + I2). This value is higher than common ones for tungstate-containing compounds, namely, 498 μs found for KEu(WO4)2.34 The increased PL lifetimes might be related to the charge transfer band lying at higher energies as it has been found for isostructural compound, K2Eu(PO4)(MoO4) with PL emission component having τ ≈ 2050 μs at room temperature20 when λex = 465 nm and λem = 615 nm.Fig. 5 Significant difference in average lifetime for tungstate and molybdate-containing isostructural compounds may be also related with different energies of charge transfer bands.20
Luminescence data are found to be in agreement with structural peculiarities of the K2Eu(PO4)(WO4). The spectroscopic characteristics can be discussed in a light of one unique Eu position in a quite distorted eight-fold coordination and the arrangement of these polyhedra into 2D layers. At the same time, the presence of peak positions' shifts in the PL excitation spectra, complex dependence of the asymmetry ratio R on excitation wavelength, and two components observed in kinetics of the PL decay cannot be omitted and requires additional study. Similar situation has been observed for other Eu-containing compounds where defects in oxygen environment of europium35–40 caused by annealing during synthetic procedure leads to distinguish two types of luminescence centers. The first one is associated with Eu in regular EuO8 dodecahedra, while the second center may be related with oxygen vacancies.37,41 The latter assumption is supported with previously reported data for oxide phosphors containing phosphate and tungstate groups.42 Moreover, the complex nature of the PL decay, which is a superposition of fast and slow components is also more likely to be defect-related. Thus, the contribution of the fast component to the emission (I1·τ1 ≈ 2900 r.u.), which is related with vacancy-containing centers is ∼45 times smaller than the slow component one (I2·τ2 ≈ 135![[thin space (1/6-em)]](https://www.rsc.org/images/entities/char_2009.gif) 000 r.u.).
000 r.u.).
The further studies of the PL properties especially at low temperatures are very necessary for clarifying noted assumption.
Due to intensive red luminescence of phosphotungstate K2Eu(PO4)(WO4) can be considered as a suitable phosphor for luminescent lighting application. The calculated values of chromaticity coordinates (x![[thin space (1/6-em)]](https://www.rsc.org/images/entities/char_2009.gif) y) are collected in Table 4. The colour coordinates are close to those of the NTSC standard for red colour (0.67; 0.33) for all PL excitation studied. High intensity of 5D0 → 7F2 observed for K2Eu(PO4)(WO4) can be considered for applications as luminescent down-shifting for white light emitting diodes.
y) are collected in Table 4. The colour coordinates are close to those of the NTSC standard for red colour (0.67; 0.33) for all PL excitation studied. High intensity of 5D0 → 7F2 observed for K2Eu(PO4)(WO4) can be considered for applications as luminescent down-shifting for white light emitting diodes.
Conclusions
In summary, K2Eu(PO4)(WO4) crystals have been successfully prepared by the high-temperature solution growth, and its structure, thermal stability, chromaticity coordinates, luminescence spectra and decay kinetics have been investigated in detail. The crystal structure contains non-condensed phosphate and tungstate tetrahedra interlinked with condensed in a zigzag chain EuO8 polyhedra, while potassium cations reside in interlayer space. The phosphor can be efficiently excited by light at the 360–480 nm spectral region and give rise to bright luminescence with the most intensive bands located near 615 and 700 nm correspond to 5D0 → 7F2 and 5D0 → 7F4 forced electric dipole transitions in europium cation, respectively. The abnormally high intensity of 5D0 → 7F4 transitions is ascribed to polarizability of Eu3+ environment in the K2Eu(PO4)(WO4). Luminescent properties are consistent with the structural characteristics of the studied crystals. In particular, the PL results confirm that all positions of europium ions in the crystal lattice are equivalent. The photoluminescence characteristics obtained indicate that titled compound has a potential application as a red-light emitting phosphor.Conflicts of interest
There are no conflicts to declare.Acknowledgements
This research was partially supported by the Ministry of Education and Science of Ukraine (grants no. 22BF037-01 and 21BF051-01). The authors are grateful Armed Forces of Ukraine for their service and sacrifice.References
- G. B. Nair, H. C. Swart and S. J. Dhoble, Prog. Mater. Sci., 2020, 109, 100622 CrossRef CAS
.
- F. Baur and T. Jüstel, Opt. Mater.: X, 2019, 1, 100015 CAS
.
- A. Tiwari and S. J. Dhoble, Luminescence, 2020, 35, 4 CrossRef CAS PubMed
.
- B. S. Naidu, B. Vishwanadh, V. Sudarsan and R. K. Vatsa, Dalton Trans., 2012, 41, 3194 RSC
.
- P. Ghosh and A. Patra, J. Nanosci. Nanotechnol., 2008, 8(7), 3458–3464 CrossRef CAS PubMed
.
- P. Dorenbos, J. Alloys Compd., 2009, 488(2), 568 CrossRef CAS
.
- X. Liu, L. Li, H. M. Noh, B. K. Moon, B. C. Choi and J. H. Jeong, Dalton Trans., 2014, 43, 8814 RSC
.
- J. P. M. Van Vliet, G. Blasse and L. H. Brixner, J. Solid State Chem., 1988, 76, 160 CrossRef CAS
.
- Y. Zhang, W. Gong, J. Yu, Y. Lin and G. Ning, RSC Adv., 2015, 5, 96272 RSC
.
- Y. Zhu, Y. Liu, G. Tan, W. Liu, H. Ren, D. Liu, S. Bai, R. Wang and S. Ye, Ceram. Int., 2020, 46, 18184 CrossRef CAS
.
- V. A. Morozov, A. V. Arakcheeva, P. Pattison, K. W. Meert, P. F. Smet, D. Poelman, N. Gauquelin, J. Verbeeck, A. Abakumov and J. Hadermann, Chem. Mater., 2015, 27, 5519 CrossRef CAS
.
- M. Ben Amara and M. Dabbabi, Acta Crystallogr., Sect. C: Cryst. Struct. Commun., 1987, 43, 616 CrossRef
.
- I. V. Zatovsky, K. V. Terebilenko, N. S. Slobodyanik, V. N. Baumer and O. V. Shishkin, Acta Crystallogr., Sect. E: Struct. Rep. Online, 2006, 62, i193 CrossRef CAS
.
- I. V. Zatovsky, K. V. Terebilenko, N. S. Slobodyanik, V. N. Baumer and O. V. Shishkin, J. Solid State Chem., 2006, 179, 3550 CrossRef CAS
.
- M. A. Ryumin, V. V. Pukhkaya and L. N. Komissarova, Russ. J. Inorg. Chem., 2010, 55, 1010 CrossRef CAS
.
- L. N. Komissarova, M. A. Ryumin, V. V. Pukhkaya, E. V. Samsonova and Y. V. Orlovskii, Russ. J. Inorg. Chem., 2011, 56, 1943 CrossRef CAS
.
- L. Han, L. Zhao, J. Zhang, Y. Wang, L. Guo and Y. Wang, RSC Adv., 2013, 3, 21824 RSC
.
- K. V. Terebilenko, N. S. Slobodyanik, I. V. Zatovsky and V. N. Baumer, Solid State Phenom., 2013, 200, 33 Search PubMed
.
- X. He, M. Guan, N. Lian, J. Sun and T. Shang, J. Alloys Compd., 2010, 492, 452 CrossRef CAS
.
- J. Grigorjevaite and A. Katelnikovas, ACS Appl. Mater. Interfaces, 2016, 8, 31772 CrossRef CAS PubMed
.
- S. A. Naidu, S. Boudin, U. V. Varadaraju and B. Raveau, J. Electrochem. Soc., 2012, 159(4), J122 CrossRef CAS
.
- Z. Guo, Z. C. Wu, B. Milićević, L. Zhou, W. U. Khan, J. Hong and M. Wu, Opt. Mater., 2019, 97, 109376 CrossRef CAS
.
- H. Cui, Y. Cao, L. Zhang, Y. Zhang, S. Ran, L. Cao and B. Chen, J. Mater. Chem. C, 2021, 9(36), 12159–12167 RSC
.
- X. Huang, B. Li and H. Guo, Ceram. Int., 2017, 43(13), 10566–10571 CrossRef CAS
.
- X. Zhang, M. Chen, J. Zhang, X. Qin and M. Gong, Mater. Res. Bull., 2016, 73, 219–225 CrossRef CAS
.
- O. V. Dolomanov, L. J. Bourhis, R. J. Gildea, J. A. K. Howard and H. Puschmann, J. Appl. Crystallogr., 2009, 42, 339 CrossRef CAS
.
- G. M. Sheldrick, Acta Crystallogr., Sect. A: Found. Adv., 2015, 71, 3–8 CrossRef PubMed
.
- G. M. Sheldrick, Acta Crystallogr., Sect. C: Struct. Chem., 2015, 71, 3–8 Search PubMed
.
- M. Llunell, D. Casanova, J. Cirera, P. Alemany and S. Alvarez, Shape: Program. for the Stereochemical Analysis of Molecular Fragments by Means of Continuous Shape Measures and Associated Tools, Departament de Química Física, Departament de Química Inorgànica, and Institut de Química Teòrica i Computacional—Universitat de Barcelona: Barcelona, Spain, 2013 Search PubMed
.
- D. Casanova, M. Llunell, P. Alemany and S. Alvarez, Chem. - Eur. J., 2005, 11, 1479 CrossRef CAS PubMed
.
- K. V. Terebilenko, S. G. Nedilko, V. P. Chornii, V. M. Prokopets, M. S. Slobodyanik and V. V. Boyko, RSC Adv., 2020, 25763 RSC
.
- M. Daub, A. J. Lehner and H. A. Höppe, Dalton Trans., 2012, 41(39), 12121 RSC
.
- J. Grigorjevaite, E. Ezerskyte, A. Minderyte, S. Stanionyte, R. Juskenas, S. Sakirzanovas and A. Katelnikovas, Materials, 2019, 12(19), 3275 CrossRef CAS PubMed
.
- P. Pues, S. Schwung, D. Rytz, L. Schubert, S. Klenner, F. Stegemann and T. Juestel, J. Lumin., 2019, 215, 116653 CrossRef CAS
.
- Y. Guo, B. K. Moon, B. C. Choi, J. H. Jeong and J. H. Kim, RSC Adv., 2017, 7(37), 23083 RSC
.
- S. Sebai, D. Zambon, A. Watras, P. J. Dereń, A. Megriche and R. Mahiou, Opt. Mater., 2019, 92, 217 CrossRef CAS
.
- C. Zhang and J. Lin, Chem. Soc. Rev., 2012, 41(23), 7938 RSC
.
- R. A. Sá Ferreira, S. S. Nobre, C. M. Granadeiro, H. I. S. Nogueira and L. D. Carlos, J. Lumin., 2006, 121, 561 CrossRef
.
- K. W. Meert, V. A. Morozov, A. M. Abakumov, J. Hadermann, D. Poelman and P. F. Smet, Opt. Express, 2014, 22, A961 CrossRef CAS PubMed
.
- Y. A. Hizhnyi, S. G. Nedilko, V. P. Chornii, M. S. Slobodyanik, I. V. Zatovsky and K. V. Terebilenko, J. Alloys Compd., 2014, 614, 420 CrossRef CAS
.
- O. V. Chukova, S. G. Nedilko, A. A. Slepets, S. A. Nedilko and T. A. Voitenko, Nanoscale Res. Lett., 2017, 12(1), 340 CrossRef CAS PubMed
.
- I. E. Kolesnikov, A. V. Povolotskiy, D. V. Mamonova, E. Y. Kolesnikov, A. V. Kurochkin, E. Lähderanta and M. D. Mikhailov, J. Rare Earths, 2018, 36(5), 474 CrossRef CAS
.
Footnote |
| † Electronic supplementary information (ESI) available. CCDC 2151141. For ESI and crystallographic data in CIF or other electronic format see DOI: 10.1039/d2ra00932c |
| This journal is © The Royal Society of Chemistry 2022 |

