 Open Access Article
Photocatalytic hydrogen evolution over cyanine-sensitized Ag/TiO2†
Layla Almazroai *a,
Rasha E. El-Mekawy
 ab,
Rihab Musac and
Lina Ali
 c
c
aDepartment of Chemistry, Faculty of Applied Science, Umm Al-Qura University, Makkah, Saudi Arabia. E-mail: lsmazroai@uqu.edu.sa
bDepartment of Petrochemicals, Egyptian Petroleum Research Institute, Nasr City, Cairo, Egypt
cUndergraduate students, Saudi Arabia
First published on 31st May 2022
Abstract
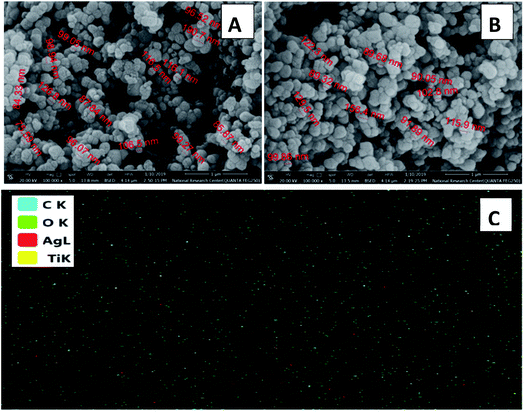
Sensitization of TiO2 by dyes such as cyanine and their derivatives is used as a technique to improve potency for the production of hydrogen gas as an alternative green fuel. These dyes shift the spectrum of TiO2 from the UV region to the visible region, enabling it to harvest as much sunlight as possible. Herein, four different derivatives of cyanine (labelled C1, C2, C3, and C4) were prepared and doped in Ag/TiO2 via the impregnation method. The properties of the prepared photocatalysts were studied by XRD, SEM-EDS, FTIR, and UV-visible spectroscopy. The sensitized photocatalysts exhibited a similar morphology, nanoscale particle size, and good absorbance in the visible region. The rate constant for the photocatalytic activity of Ag/TiO2 showed a great enhancement for hydrogen evolution after sensitization from 0.088 to 0.33 μmol min−1. Doping of the C2 derivative in Ag/TiO2 promoted the photocatalytic and sonophotocatalytic rates of H2 production by 7.5 and 9 times, respectively. Also, the amount of photocatalyst had a significant effect on the photocatalytic activity of the sensitized Ag/TiO2, where 0.14 g was the optimum dose, giving the maximum yield at both the initial rate and 300 min. One of the important factors causing the efficiency to reach high levels is the inhibition of photogenerated electron/hole recombination. This was achieved by adding a small quantity of methanol, which increased the rate by 9 times. The stability of the prepared photocatalysts was tested, which gave good results even after their 5th use. All the results confirmed that the sensitization of metal oxides is a promising solution in industry to produce clean energy (H2) in high quantities over highly stable photocatalysts.
1. Introduction
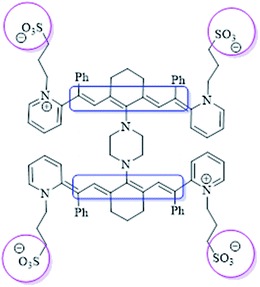
Currently, significant efforts are devoted to research in the field of chemistry, particularly on the chemistry of light-sensitive compounds with biological and industrial importance. Specifically, this is meaningful in the field of organic chemistry and solar energy for applications such as photodynamic therapy,1 nonlinear optics,2 optical data storage,3 laser materials4,5 and solar and photovoltaic cells.6,7 Therefore, the development of these compounds is important due to their photosensitivity, resulting from the excitation of electrons that are stimulated in the form of magnetic resonance. This is important for many vital applications. One of the most important types of compounds are cyanine dyes,8–11 which have positive effects on photocatalytic activity (Fig. 1). Herein, a series of novel cyanine dyes was prepared and applied in the field of renewable energy.Recently, H2 fuel has become a hot topic as an effective renewable energy to replace fossil fuel and address pollution.12,13 In this case, the large-scale use of photocatalysis for water splitting appears to be a rich source of hydrogen using various techniques.14–16 Accordingly, to achieve this, metal oxide semiconductors show great potential due to their properties such as nontoxicity, corrosion resistance, abundance, low cost and photostability. Amongst the metal oxides, such as ZnO, Fe2O3 and SnO,17–20 titanium dioxide (TiO2) is considered one of the best semiconductors for this purpose.21,22 However, despite the great advantages of TiO2, there are some major drawbacks that reduce its photocatalytic efficiency such as wide band gap, which is approximately 3.2 eV, only allowing it to absorb UV irradiation, which accounts for 5% of solar energy. Also, the recombination of photoexcited electrons and holes is a big challenge in this case. These restraints have largely been overcome by modulating the composition of TiO2 materials, such as through metal doping.23,24 Novel metals have gained considerable attention due to their significant results in water splitting, which consequently increase the rate of hydrogen production.25–28 Doping of TiO2 with silver has been demonstrated in numerous studies as a way for enhancing the photocatalytic process.29,30 The absorption spectrum of TiO2 is shifted to the visible region in the presence of silver. Additionally, silver can inhibit the recombination of e−/h+ pairs by trapping the photogenerated electrons from the VB of TiO2.31,32 However, the desired industrial yield of photocatalytic H2 production has not been reached to date, although different metal–metal oxides have been fabricated using several techniques. Therefore, TiO2 still needs further improvements to make it more energy efficient. Alternatively, it is known that dyes with unique optical properties are used widely in many fields.33,34 Accordingly, these dyes were introduced in the manufacture of solar cells (known as dye-sensitized solar cells, DSSCs) by Grätzel and O'Regan35 more than twenty years ago. Dye-sensitized semiconductors as photocatalysts for the production of H2 enhance the harvesting of solar light and may lead to a higher yield of H2 production. Thus, the role of dyes as a photosensitizer has been studied in many works. For instance, fluorescein as a photosensitizer was added to an Ag/g-C3N4 composite and the H2 evolution rate was 2014. 20 μmol g−1 h−1 h which was 4.8-times higher than that of 3 wt% Ag loaded on the same support.36 Also, Pt–TiO2 sensitized with a new thiophenothiazine-based dye produced approximately 1048 μmol of H2 with a quite high quantum yield (50%).37 In another study, an asymmetric zinc phthalocyanine derivative was used to sensitize TiO2, expanding its absorption edge to 700 nm under monochromatic light irradiation with a quantum efficiency of 0.2%.38 All these studies demonstrated that the dye-sensitization of semiconductors such as TiO2 can enhance their photocatalytic activity in the water splitting process. Moreover, the processes for the photoexcitation of electrons are similar to that in DSSCs. Among the family of dyes, cyanine has attracted attention owing to its photophysical and photochemical properties. Cyanine compounds are distinguished by their broad absorbance in the UV-vis region, molar extinction coefficient, and Stokes shift.39–42 Hence, cyanine dye is highly attractive for use in the field of H2 energy. The design of photocatalysts is not the only factor affecting the H2 evolution process, the structure of the photoreactor also has a significant impact on the production rate. In the last few years, an innovative technique has been utilized to improve the conversion efficiency. This technique is known as sonophotocatalysis, involving the coupling of ultrasound irradiation (sonolysis) with light irradiation (photolysis).43,44 Ultrasound waves are characterized by the induction of cavitation phenomena. When water is irradiated by ultrasound waves, a localized hot spot is generated with a temperature reaching up to 5000 °C and pressure of 1000 bars. As a result of the cavitation process, water decomposes to hydrogen peroxide (H2O2), which plays a role in the formation of more reactive oxygen species during the photocatalytic reaction. Furthermore, the sonolysis process promotes mass transfer from the solid/liquid interface, maintains the active surface area of the catalyst by preventing its aggregation, and enhances the fast removal of H2 from the bubbles. Consequently, ultrasound radiation combined with the photocatalysis process (sonophotocatalysis) promotes H2 production.45,46 In our previous work,47 it was proven that the effect of sonophotocatalysis of dye-sensitized Cu–TiO2 with a high absorption efficiency in the visible region for H2 evolution was greater than via only photocatalysis by 7 times.
In this work, Ag was considered due to the above-mentioned reasons. Also, as it is well-known from the previous research that Ag as a noble metal has a high photoconversion yield as a result of its localized surface plasmon resonance,48,49 and it also exhibits high antibacterial activity.50 Furthermore, supported silver heterogeneous catalysis has been effectively used at the industrial scale as an oxidative agent to convert ethylene to ethylene oxide and methanol to formaldehyde.51 Herein, the effect of sound waves and photoirradiation, catalyst dose, and presence of methanol was investigated to improve the hydrogen production efficiency of four new cyanine derivatives and sensitization of Ag/TiO2. These dyes were chosen because of their characteristic spectral data, which are photosensitive due to their highly conjugated system. As the conjugation increases, the resonating structures and photosensitivity increase.
2. Results and discussion
2.1 Characterization of the cyanine derivatives
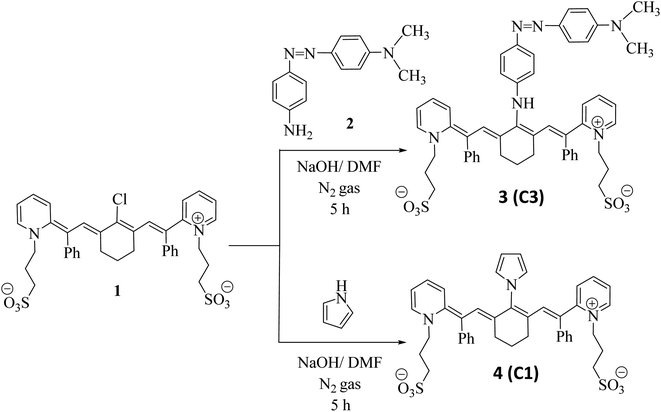
Based on previous studies and the introduction, our aim was to prepare a new series of photosensitive cyanine dyes that exhibit distinct and fruitful application effects in the field of renewable energy and can used as photocatalysts in energy applications (all 1H-NMR and IR spectra are displayed in S1(a–h)).† Firstly, 3-((Z)-2-((E)-2-(2-chloro-3-((E)-2-phenyl-2-(1-(3-sulfonatopropyl)pyridin-1-ium-2-yl)vinyl) cyclohex-2-en-1-ylidene)-1-phenylethylidene)pyridin-1(2H)-yl)propane-1-sulfonate (1)8 was reacted with (E)-4-((4-aminophenyl)diazinyl)-N,N-dimethylaniline (2) in basic medium in the presence of N,N-dimethylformamide as a solvent and sodium hydroxide pellets for 5 h under an inert atmosphere of nitrogen gas to remove air bubbles from the reaction media and protect the reaction from air, giving excellent yield of the target compound 3. The poly-conjugated system of polymethine cyanine dye 3 was confirmed by IR spectroscopy, which showed a strong absorption band at![[greek upsilon with two dots above]](https://www.rsc.org/images/entities/i_char_e1ab.gif) = 3450 cm−1 related to the NH group and absence of an absorption band at
= 3450 cm−1 related to the NH group and absence of an absorption band at ![[greek upsilon with two dots above]](https://www.rsc.org/images/entities/i_char_e1ab.gif) = 3443–3449 cm−1 owing to two halves of NH2 group. This indicates that the reaction successfully occurred. The 1H NMR spectrum exhibited a singlet signal at δ = 10.23 ppm, which is attributed to the NH proton. The mass spectrum of 3 exhibited the molecular ion peak at m/z = 922 (M+, 52%), corresponding to the molecular formula C52H53N6O6S2. When compound 1 was combined with the pyrrole structure, the replacement of the chlorine atom at the meso position occurred by the nitrogen of the pyrrole structure by removing HCl in the presence of N,N-dimethylformamide as the solvent and sodium hydroxide pellets for 5 h under an inert atmosphere of nitrogen gas, yielding structure 4. Compound 4 was tested by element and Bunsen tests, which gave negative results, confirming the disappearance of chlorine. The IR spectrum exhibited no absorption band at
= 3443–3449 cm−1 owing to two halves of NH2 group. This indicates that the reaction successfully occurred. The 1H NMR spectrum exhibited a singlet signal at δ = 10.23 ppm, which is attributed to the NH proton. The mass spectrum of 3 exhibited the molecular ion peak at m/z = 922 (M+, 52%), corresponding to the molecular formula C52H53N6O6S2. When compound 1 was combined with the pyrrole structure, the replacement of the chlorine atom at the meso position occurred by the nitrogen of the pyrrole structure by removing HCl in the presence of N,N-dimethylformamide as the solvent and sodium hydroxide pellets for 5 h under an inert atmosphere of nitrogen gas, yielding structure 4. Compound 4 was tested by element and Bunsen tests, which gave negative results, confirming the disappearance of chlorine. The IR spectrum exhibited no absorption band at ![[greek upsilon with two dots above]](https://www.rsc.org/images/entities/i_char_e1ab.gif) = 3452 cm−1. This is considered evidence of the formation of compound 4, as outlined in Scheme 1.
= 3452 cm−1. This is considered evidence of the formation of compound 4, as outlined in Scheme 1.
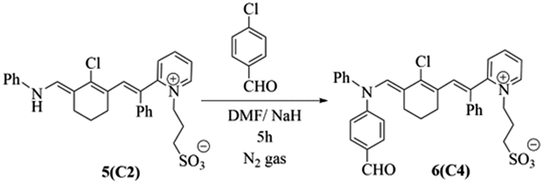
Alternatively, penta methine cyanine dye 5 (ref. 8) resulted in the excellent synthesis of pentamethine cyanine dye 6 through reaction with 4-chlorobenzaldehyde in basic medium in the presence of N,N-dimethylformamide as the solvent and sodium hydride as the base for 5 h under an inert atmosphere of nitrogen gas. The structure 6 of was elucidated based on its correct analytical and spectral data. Its IR spectrum revealed the characteristic strong absorption band of the carbonyl group at ![[greek upsilon with two dots above]](https://www.rsc.org/images/entities/i_char_e1ab.gif) = 1728 cm−1. Moreover, its 1H NMR spectrum exhibited a singlet signal at δ = 10.03 ppm due to the CHO proton and absence of a signal at δ = 10.51 ppm owing to the disappearance of the NH proton. The mass spectrum of 6 showed the molecular ion peak at m/z = 625 (M+, 31%) corresponding to the molecular formula of C36H33N2O4SCl, as shown in Scheme 2.
= 1728 cm−1. Moreover, its 1H NMR spectrum exhibited a singlet signal at δ = 10.03 ppm due to the CHO proton and absence of a signal at δ = 10.51 ppm owing to the disappearance of the NH proton. The mass spectrum of 6 showed the molecular ion peak at m/z = 625 (M+, 31%) corresponding to the molecular formula of C36H33N2O4SCl, as shown in Scheme 2.
2.2. Photosensitization properties of novel series of cyanine dyes 3, 4, 5 and 6
Cyanine dyes have a long-conjugated chain system. This system increases their magnetic resonance, and thus their stability in space, and increased generation of electron currents as a result of the electronic excitation process from the ground state to the first excited state and then to the triplet excited state as a result of the generation of singlet oxygen species. This process increases with an increase in the conjugated system, which is responsible for the activity of dyes. This occurs when it they are exposed to a quantity of photons from an external light source or sunlight. We found that the compounds possessed an absorption wavelength following the order of 3: λmax = 720 >; 4: λmax = 710; 6: λmax = 707 and 5: λmax = 700 (Fig. 2 and Table 1).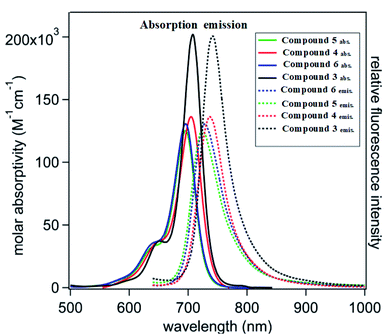 | ||
| Fig. 2 Visible-near infrared (vis-NIR) normalized molar absorptivity (solid lines) and emission spectra (dotted lines). | ||
| Compound no. | Absorption bands λmax (nm) | Emission bands λem (nm) | Molar absorptivity log![[thin space (1/6-em)]](https://www.rsc.org/images/entities/char_2009.gif) ε (L mol−1 cm−1) ε (L mol−1 cm−1) |
Stoke shift λmax − λem | (Quantum yield) Q |
|---|---|---|---|---|---|
| 3 | 720 | 760 | 5.31 | 40 | 1.055 |
| 4 | 710 | 740 | 5.11 | 30 | 1.042 |
| 5 | 700 | 720 | 5.07 | 20 | 1.028 |
| 6 | 707 | 739 | 5.09 | 32 | 1.045 |
X-ray diffraction (XRD) gave information regarding the crystallinity of the synthesized chromophoric structures, where among the, compound 5 exhibited the highest crystallinity, as displayed in Fig. S2.†
Successively, the stability of these dyes presented an opportunity to employ them effectively as photocatalysts. All the compounds exhibited excellent stability, as demonstrated by the thermal gravimetric analysis (TGA). Firstly, the loss of moisture occurred at the point of weight loss due to the removal of the substituent at the meso position at high temperature, which typically had no influence on the conjugated framework. This indicates the suitability of these compounds for application in the field of renewable energy, as outlined in Fig. S3.†
The framework of the synthesized dyes 3, 4, 5 and 6 was observed by scanning electron microscopy (SEM) (Fig. S4†). The presence of white sites in SEM images revealed that the surface morphology of these compounds has active sites and pores, which allow the delocalization of their π-system and generation of a current of electrons continuously.52,53 Alternatively, the subsequent photosensitization of the chromophores aid in their excitation to the triplet excited state, leading to the continuous generation of singlet oxygen species.
Noticeably, the conjugated methine cyanine dyes were screened as photo- and sono-catalysts for the production of hydrogen. Compound 5 exhibited the highest activity due to the presence of a free nitrogen atom, which increased its flexibility and delocalization of its π-system, followed by compound 4 in reactivity owing to the presence of the pyrrole ring, which increased its conjugated system, and then photosensitization increased the generation of reactive oxygen species. The reactivity of the other compounds followed the order of 6 > 3 >1, where the carbonyl group of formyl in compound 6 increased its resonance and allowed its free rotation in space, compound 3 was slightly rigid, which is attributed to its azo group, and then the presence of chlorine in compound 1 decreased the active sites in its structure because of its electron-withdrawing nature rather than donating electrons to the system.
The prepared cyanine compounds were labelled after they were added to Ag/TiO2 as follows: C1(4), C2(5), C3(3), and C4(6), respectively.
2.3. Characterization of sensitized Ag/TiO2
The particle sizes of the crystalline photocatalysts were calculated through the Scherrer equation. Table S1† displays a variety of large nanoscale particle sizes for the synthesized Ag/TiO2 and C(1–4)–Ag/TiO2 due to the bulky organic structure of the cyanine derivatives. Additionally, based on the geometry, chemical composition, and structure of the cyanine derivative dyes, the agglomeration of the particles may increase after dye sensitization. Also, there is a relation between the agglomeration process and the anchoring groups (e.g., –COOH and –SO3H). Nevertheless, introducing chlorine in the dye structure decreased the active sites in the structure because of its electron-withdrawing nature. Accordingly, in C4 with a particle size of 71.1 nm, despite the presence of Cl−, the introduction of carbonyl acid as an anchoring group in the dye structure led to the formation of an ester linkage. Also, the amino group in C2 (94.4 nm) increased its particle size (delocalization of π electrons). C3 had the largest particle size (104.6 nm), which can be explained by the introduction of the rigid aromatic unit (azo group) over the π-conjugated bridge.
3. Study of the activity of the prepared photocatalysts for hydrogen production
3.1 Photo- and sonophotocatalytic hydrogen production
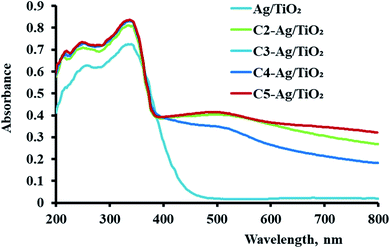
The effect of these dyes, which harvest more energy in the visible region, on the hydrogen evolution activity was as expected. As shown in Fig. 5(A), all the derivatives of cyanine loaded on Ag/TiO2 were more effective (3.5–6 times) than that without them. Furthermore, in the case of sonophotocatalysis, as shown in Fig. 5(B), the activity increased by 5–7.5 times. Moreover, the rate constant of the photocatalytic and sonophotocatalytic hydrogen evolution over Ag/TiO2 was 0.088 and 0.33 μmol min−1, respectively. The presence of cyanine derivatives promoted the photocatalytic rate to 0.39–0.55 μmol min−1 and 1.95–3.3 μmol min−1 in the case of the addition of acoustic radiation to the photocatalysis process. The extent of the formation electron/hole pairs, which are the main reactive species in this process, depends on the ability of the photocatalyst to absorb more energy from light and the lifetime of these species. Thus, the structure of dyes molecules causes them to play a main role in the formation of more reactive pairs, as displayed in Fig. 4, which proved this effect concerning the ability of absorption.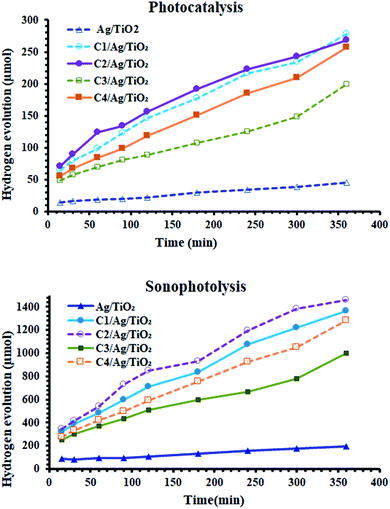 | ||
| Fig. 5 (A) Photocatalytic activity and (B) sonophotocatalytic activity of the prepared sample before and after the sensitization of Ag/TiO2. | ||
According to the comparison of sono- and photocatalysis, the activity of the derivatives of cyanine were somewhat different. Their activity in photocatalytic hydrogen production followed the order of C2 > C1 > C4 > C3, noting that the behavior of C1 and C2 in photocatalysis were nearly similar. This varying effect of their activities is due to the structure of these dyes and their properties in the sensitized Ag/TiO2 for the production of the alternative fuel. The characterization studies mentioned previously are consistent with the activity of the sensitized photocatalysis. The higher absorbance, uniform distribution and the particles size can be correlated with the positive effect of these samples in this process. C3 exhibited the lowest activity because it had the lowest absorbance intensity and largest particle size.
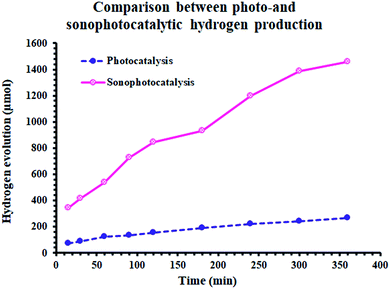
Alternatively, Fig. 6 demonstrates the synergistic effect on the amount of hydrogen evolved. By sonophotoirradiation of the photocatalyst, the amount of hydrogen produced was larger than that by only photoirradiation by 5.7 times after 5 h. During the heterogeneous reaction, the aggregation of small particles is very probable. The agglomeration of particles is one of the reasons for the reduction in the activity of catalysts in heterogeneous processes, lowering their surface area. Accordingly, sound waves are a physical force that inhibits the aggregation of nanoparticles. Additionally, the waves may contribute to the formation of more photogenerated reactive pairs (electron/hole), which yields higher activity.
3.2 Effect of catalyst dose
Because of the dependence of photocatalysis on the formation of photogenerated species on the surface of the catalyst, the number of illuminated particles should be considered. Fig. S7† clearly displays the effect of the catalyst dose. The optimum dose was 0.14 g, after which the hydrogen production decreased. This result is in agreement with many previous studies.61,62 Excess particles over the optimum dose shields other particles from the light source. In addition, a large dose may result in more agglomeration, which inhibits the activity of photocatalyst. The behavior of the different particle sizes initially and after 5 h was similar.3.3 The effect of methanol as a sacrificial agent
The production of hydrogen gas from pure water is an uphill reaction (ΔH = 286 kJ mol−1). Thus, the addition of small quantities of a sacrificial reagent such as methanol is considered one of the ways to promote the efficiency of hydrogen production significantly, as obtained herein and in most previous studies.63 Fig. S8† shows the obvious effect of methanol molecules in enhancing of the amount of hydrogen produced over C2/Ag/TiO2. A small amount of methanol (200 μL) was sufficient to increase the rate by 9 times, which indicates to the importance of the presence of small organic molecules. Methanol acts as an electron donor and is oxidized by the photogenerated hole (˙OH) formed at the HOMO of the dye molecule or VB of TiO2 (lower probability). The reaction between methanol and the photogenerated hole may produce reactive oxidative radicals, which achieve one-half reaction of water splitting. This indicated that the role of methanol is to produce an electron donor, injecting its electrons to the conduction band or LUMO of the dye.63–65 The following equations were suggested for the oxidation of methanol by Chen et al.:63| H2O (l) + h+ → ˙OH + H+ | (1) |
| CH3OH (l) + ˙OH → ˙CH2OH + H2O | (2) |
| ˙CH2OH → HCHO (l) + H+ + e− | (3) |
After a series of steps, the final products are CO2 and H2O.
3.4 The mechanism of the photocatalytic hydrogen production
The mechanism for the photoactivity of the sensitized TiO2 with some additives such as silver and methanol or the synergistic action using sound waves has been suggested in many studies,66–69 summarized Fig. 7. Considering that the results of this study are consistent with the previous studies, it is possible to predict the mechanism. The first step in any photocatalytic reaction is photoexcitation by light. The Xe lamp used mimic the sunlight, in which UV radiation represents about 4%. According to this, it is reasonable that the light absorption by the dye molecule would be the more probable as the first step than the photoexcitation of TiO2.70 After photoexcitation, the excited electrons transfer from the LUMO state of the dye to the CB of TiO2, which has a lower energy than the excited level of cyanine.71 The photocurrent analysis in similar studies confirmed that the resistance of electron transfer plays a role in the generation and accumulation of charge carriers. According to these results, it is expected that the resistance of the dye-sensitized TiO2 is the lowest and the charge transfer is the fastest, and therefore the probability of the recombination of charge carriers would be the lowest in C2/Ag/TiO2, as displayed by the photocatalytic hydrogen production.72,73 Additionally, the four prepared cyanine sensitized photocatalysts may differ in incident photo-to-electric conversion efficiency (IPECE), which may act as an indicator of the rate of the back reaction between injected electrons and the excited state of the dye.71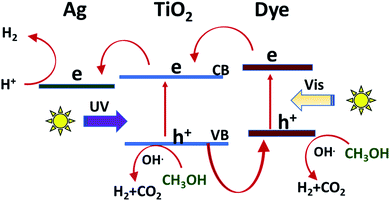 | ||
| Fig. 7 Suggested mechanism for the photocatalytic production of hydrogen over the sensitized Ag/TiO2. | ||
Silver as noble metal nanoparticles can act as photogenerated electron trapping sites, and then reduce the electron–hole recombination compared with the bare TiO2, the absorption of Ag/TiO2 shifted to a longer wavelength (towards the visible region) due to the localized surface plasmon resonance (LSPR) of the Ag NPs. Alternatively, SPR effect can promote the generation of charge carriers in the photocatalyst by increasing the local electric field near metal nanoparticles.74–76
3.5 The reusability of sensitized Ag/TiO2
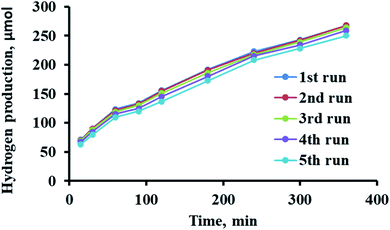
Among the factors that should be considered in industry for photocatalytic fuel production is the maintained activity for many uses. The catalyst reusability process was investigated for five cycles. Specifically, 0.1 g of C2/Ag/TiO2 in 100 mL of deionized water and 8 mM methanol were irradiated for 60 min. Subsequently, the photocatalyst was separated, dried, and reused. The prepared sensitized photocatalysts demonstrated ability to be active for 5 cycles, as shown in Fig. 8. The activity of C2/Ag/TiO2 decreased by only 6% after the fifth use, which is ascribed to the loss of some materials during treatment and/or aggregation during the reaction.77,78 However, the low loss (6%) makes these photocatalysts valuable due their stability and lack of tendency to adsorb the reaction products, allowing their further use.4. Experimental
4.1. Preparation of various cyanine dyes
![[thin space (1/6-em)]](https://www.rsc.org/images/entities/char_2009.gif) :
:![[thin space (1/6-em)]](https://www.rsc.org/images/entities/char_2009.gif) hexane (3
hexane (3![[thin space (1/6-em)]](https://www.rsc.org/images/entities/char_2009.gif) :
:![[thin space (1/6-em)]](https://www.rsc.org/images/entities/char_2009.gif) 1), resulting in the formation of compound 3.
1), resulting in the formation of compound 3.Yield 92%; red crystals; m.p. 219 °C; IR (KBr): ύ/cm−1 = 3450 (NH), 3093 (Ar-H), 2924 (CH2), 1667 (C![[double bond, length as m-dash]](https://www.rsc.org/images/entities/char_e001.gif) N), 1598 (C
N), 1598 (C![[double bond, length as m-dash]](https://www.rsc.org/images/entities/char_e001.gif) C); 1H NMR (DMSO-d6) δ/ppm = 1.38 (m, 2H, C5–H2 of cyclohexenyl ring), 2.93 (t, 4H, C4–H2 and C6–H2 of cyclohexenyl ring), 3.17–3.61 (m, 6H, 2 CH2–SO3, CH2–N), 4.05 (t, 2H, CH2–N+), 5.26 (s, 1H,
C); 1H NMR (DMSO-d6) δ/ppm = 1.38 (m, 2H, C5–H2 of cyclohexenyl ring), 2.93 (t, 4H, C4–H2 and C6–H2 of cyclohexenyl ring), 3.17–3.61 (m, 6H, 2 CH2–SO3, CH2–N), 4.05 (t, 2H, CH2–N+), 5.26 (s, 1H, ![[double bond, length as m-dash]](https://www.rsc.org/images/entities/char_e001.gif) CH), 6.12 (s, 1H,
CH), 6.12 (s, 1H, ![[double bond, length as m-dash]](https://www.rsc.org/images/entities/char_e001.gif) CH), 6.60–8.74 (m, 26H, Ar-H, pyridine-H and pyridinium-H, two benzene rings), 10.23 (s, 1H, NH); 13C NMR (DMSO-d6) δ/ppm = 21.0, 30.6, 41.3, 101.8, 111.7, 112.4, 114.6, 121.1, 122.4, 125.0, 127.2, 127.9, 128.6, 136.6, 137.3, 144.4, 145.8.; MS: (m/z, %) 921 (M+, 95%), 841 (34%), 761 (25%), 719 (54%), 677 (60%), 633 (39%), 556 (26%), 528 (100%), 451 (53%), 437 (45%), 360 (40%); anal. calcd for C52H53N6O6S2− (921): C, 67.75%; H, 5.75%; N, 9.12%. Found: C, 67.74%; H, 5.74%; N, 9.10%.
CH), 6.60–8.74 (m, 26H, Ar-H, pyridine-H and pyridinium-H, two benzene rings), 10.23 (s, 1H, NH); 13C NMR (DMSO-d6) δ/ppm = 21.0, 30.6, 41.3, 101.8, 111.7, 112.4, 114.6, 121.1, 122.4, 125.0, 127.2, 127.9, 128.6, 136.6, 137.3, 144.4, 145.8.; MS: (m/z, %) 921 (M+, 95%), 841 (34%), 761 (25%), 719 (54%), 677 (60%), 633 (39%), 556 (26%), 528 (100%), 451 (53%), 437 (45%), 360 (40%); anal. calcd for C52H53N6O6S2− (921): C, 67.75%; H, 5.75%; N, 9.12%. Found: C, 67.74%; H, 5.74%; N, 9.10%.
![[thin space (1/6-em)]](https://www.rsc.org/images/entities/char_2009.gif) :
:![[thin space (1/6-em)]](https://www.rsc.org/images/entities/char_2009.gif) hexane (3
hexane (3![[thin space (1/6-em)]](https://www.rsc.org/images/entities/char_2009.gif) :
:![[thin space (1/6-em)]](https://www.rsc.org/images/entities/char_2009.gif) 1), resulting in the formation of compound 4.
1), resulting in the formation of compound 4.Yield 85%; reddish brown crystals; m.p. 219 °C; IR (KBr): ύ/cm−1 = 3230 (Ar-H), 2924 (CH2), 1583 (C![[double bond, length as m-dash]](https://www.rsc.org/images/entities/char_e001.gif) N), 1536 (C
N), 1536 (C![[double bond, length as m-dash]](https://www.rsc.org/images/entities/char_e001.gif) C); 1H NMR (DMSO-d6) δ/ppm = 1.63 (m, 2H, C5–H2 of cyclohexenyl ring), 2.33 (t, 4H, C4–H2 and C6–H2 of cyclohexenyl ring), 2.34 (m, 6H, 2 CH2–SO3, CH2–N), 2.49 (t, 2H, CH2–N+), 4.04 (d, 2H, 2 = CH), 4.17 (d, 2H, 2
C); 1H NMR (DMSO-d6) δ/ppm = 1.63 (m, 2H, C5–H2 of cyclohexenyl ring), 2.33 (t, 4H, C4–H2 and C6–H2 of cyclohexenyl ring), 2.34 (m, 6H, 2 CH2–SO3, CH2–N), 2.49 (t, 2H, CH2–N+), 4.04 (d, 2H, 2 = CH), 4.17 (d, 2H, 2 ![[double bond, length as m-dash]](https://www.rsc.org/images/entities/char_e001.gif) CH), 6.30 (s, 1H,
CH), 6.30 (s, 1H, ![[double bond, length as m-dash]](https://www.rsc.org/images/entities/char_e001.gif) CH), 6.60 (s, 1H,
CH), 6.60 (s, 1H, ![[double bond, length as m-dash]](https://www.rsc.org/images/entities/char_e001.gif) CH), 6.94–7.74 (m, 18H, Ar-H, pyridine-H and pyridinium-H, two benzene rings); 13C NMR (DMSO-d6) δ/ppm = 11.0, 21.0, 30.6, 101.8, 112.4, 115.9, 116.1, 121.1, 122.3, 122.4, 127.2, 127.9, 128.6, 136.6, 137.3, 144.6, 147.1; MS: (m/z, %) 748 (M+, 71%), 686 (24%), 607 (31%), 527 (21%), 447 (57%), 411 (19%), 375 (82%), 298 (71%), 221 (63%), 150 (53%); anal. calcd for C42H42N3O6S2− (748): C, 67.37%; H, 5.61%; N, 5.61%. Found: C, 67.36%; H, 5.60%; N, 5.60%.
CH), 6.94–7.74 (m, 18H, Ar-H, pyridine-H and pyridinium-H, two benzene rings); 13C NMR (DMSO-d6) δ/ppm = 11.0, 21.0, 30.6, 101.8, 112.4, 115.9, 116.1, 121.1, 122.3, 122.4, 127.2, 127.9, 128.6, 136.6, 137.3, 144.6, 147.1; MS: (m/z, %) 748 (M+, 71%), 686 (24%), 607 (31%), 527 (21%), 447 (57%), 411 (19%), 375 (82%), 298 (71%), 221 (63%), 150 (53%); anal. calcd for C42H42N3O6S2− (748): C, 67.37%; H, 5.61%; N, 5.61%. Found: C, 67.36%; H, 5.60%; N, 5.60%.
![[thin space (1/6-em)]](https://www.rsc.org/images/entities/char_2009.gif) :
:![[thin space (1/6-em)]](https://www.rsc.org/images/entities/char_2009.gif) CH2Cl2
CH2Cl2![[thin space (1/6-em)]](https://www.rsc.org/images/entities/char_2009.gif) :
:![[thin space (1/6-em)]](https://www.rsc.org/images/entities/char_2009.gif) hexane (0.5
hexane (0.5![[thin space (1/6-em)]](https://www.rsc.org/images/entities/char_2009.gif) :
:![[thin space (1/6-em)]](https://www.rsc.org/images/entities/char_2009.gif) 3
3![[thin space (1/6-em)]](https://www.rsc.org/images/entities/char_2009.gif) :
:![[thin space (1/6-em)]](https://www.rsc.org/images/entities/char_2009.gif) 1), resulting in the formation of compound 4.
1), resulting in the formation of compound 4.Yield 67%; red crystals; m.p. 219 °C; IR (KBr): ύ/cm−1 = 3230 (Ar-H), 2924 (CH2), 1583 (C![[double bond, length as m-dash]](https://www.rsc.org/images/entities/char_e001.gif) N), 1536 (C
N), 1536 (C![[double bond, length as m-dash]](https://www.rsc.org/images/entities/char_e001.gif) C); 1H NMR (DMSO-d6) δ/ppm = 1.63 (m, 2H, C5–H2 of cyclohexenyl ring), 2.34 (t, 4H, C4–H2 and C6–H2 of cyclohexenyl ring), 2.49 (t, 2H, CH2–SO3), 4.19 (t, 2H, CH2–N+), 6.32 (s, 1H,
C); 1H NMR (DMSO-d6) δ/ppm = 1.63 (m, 2H, C5–H2 of cyclohexenyl ring), 2.34 (t, 4H, C4–H2 and C6–H2 of cyclohexenyl ring), 2.49 (t, 2H, CH2–SO3), 4.19 (t, 2H, CH2–N+), 6.32 (s, 1H, ![[double bond, length as m-dash]](https://www.rsc.org/images/entities/char_e001.gif) CH), 6.63 (s, 1H,
CH), 6.63 (s, 1H, ![[double bond, length as m-dash]](https://www.rsc.org/images/entities/char_e001.gif) CH), 6.94-7.74 (m, 19H, 3 Ar-H and pyridinium-H); 13C NMR (DMSO-d6) δ/ppm = 29.7, 119.6, 121.6, 121.9, 126.4, 127.0, 127.1, 127.2, 127.9, 128.6,129.6, 140.0, 145.8, 147.1; MS: (m/z, %) 624 (M+, 54%), 595 (62%), 519 (51%), 505 (21%), 428 (25%), 348 (29%), 312 (62%), 298 (71%), 239 (100%), 162 (83%); anal. calcd for C36H33ClN2O4S (624): C, 67.37%; H, 5.61%; N, 5.61%. Found: C, 67.36%; H, 5.60%; N, 5.60%.
CH), 6.94-7.74 (m, 19H, 3 Ar-H and pyridinium-H); 13C NMR (DMSO-d6) δ/ppm = 29.7, 119.6, 121.6, 121.9, 126.4, 127.0, 127.1, 127.2, 127.9, 128.6,129.6, 140.0, 145.8, 147.1; MS: (m/z, %) 624 (M+, 54%), 595 (62%), 519 (51%), 505 (21%), 428 (25%), 348 (29%), 312 (62%), 298 (71%), 239 (100%), 162 (83%); anal. calcd for C36H33ClN2O4S (624): C, 67.37%; H, 5.61%; N, 5.61%. Found: C, 67.36%; H, 5.60%; N, 5.60%.
4.2. Preparation of the sensitized Ag/TiO2
1% Ag/TiO2 was prepared as mentioned in our previous work via the wetness-impregnation method. A paste of Ag/TiO2 was made by adding an appropriate amount of AgNO3 solution gradually to TiO2 powder (Degussa P25). The paste was dried, and then calcined at 500 °C for 2 h. For the preparation of the cyanine-sensitized Ag/TiO2, 0.5 g of this sample was vigorously stirred in each cyanine derivative solution (1% w/v) for 24 h in the dark to ensure the complete adsorption of the dye on the surface of Ag/TiO2. The prepared sensitized photocatalysts were centrifuged, washed with ethanol, washed with deionized water three times, and dried for 24 h.4.3. Characterization
The melting point of the various cyanine dyes was measured using a Gallenkamp electric melting point instrument. Infrared (IR) spectra were measured (KBr disk) on a Mattson 5000 FTIR spectrometer, 1H-NMR and 13C NMR spectra were measured on a Bruker WPSY 200 MHz spectrometer with TMS as the internal standard and the chemical shifts are reported in δ ppm using DMSO-d6 and/or CDCl3 as the solvents at the Faculty of Science, Mansoura University, Egypt. Mass spectroscopy was performed at 70 eV with a Varian MAT 311 and elemental analyses (C, H and N) were performed at the Microanalytical Center, Faculty of Science, Cairo University. The results were consistent (±0.03) with the theoretical values. X-ray Diffraction (XRD) was employed to determine the crystallinity of the polymer. X-ray diffraction was performed using a Philips PW 3710 (Philips, USA) diffractometer with CuKα radiation (λ = 0.1542 nm) in a sealed tube at 40 kV and 30 mA. Energy dispersive X-ray spectroscopy (EDS) and scanning electron microscopy (SEM) were performed using a Philips XL 30CP, USA. The films were cut and mounted on a brass stub with double-sided adhesive tape and coated with 50 Å of gold with an SCD-040 Balzers sputter coater. The specimen was finally characterized by SEM at accelerating voltage of 30 kV and at 7500, 10![[thin space (1/6-em)]](https://www.rsc.org/images/entities/char_2009.gif) 000 and 15
000 and 15![[thin space (1/6-em)]](https://www.rsc.org/images/entities/char_2009.gif) 000× magnification of the original specimen size.
000× magnification of the original specimen size.
The prepared sensitized Ag/TiO2 was also characterized using the same instruments as mentioned in the characterization of the cyanine compounds.
4.4. Study of the photocatalytic and sonophotocatalytic activity of the prepared sensitized Ag/TiO2
The hydrogen evolution was measured by withdrawing aliquots every 30 min from the irradiated mixture of 0.1 g sample dispersed in 100 mL of water and 0.2 mL of methanol. A 500 W Xe lamp was used in this study. The samples were analyzed by gas chromatography (Agilent GC 78900A) with a thermal conductivity detector (TCD) using argon as the carrier gas, and then the hydrogen gas was precisely detected. For the sonophotocatalytic study, a sonicator (20 kHz, 1800 W) with a Ti probe (20 mm) was used and immersed in the mixture to transfer ultrasound waves from the generator to the suspension irradiated by a Xe lamp simultaneously.5. Conclusion
The photocatalytic hydrogen production was promoted significantly on the different derivatives of cyanine-sensitized Ag/TiO2. However, the C2-sensitized Ag/TiO2 had the highest photocatalytic activity in both photocatalysis (7.5 times) and sonophotocatalysis (9 times) compared with the unsensitized Ag/TiO2. The optimum dose of the photocatalyst was 0.14 g, as expected according to many similar studies, which means that this small quantity of photocatalyst may give reasonable results. Additionally, a small amount of methanol promoted the photocatalytic activity of the sensitized photocatalysts by 9 times. The role of these molecules in photocatalytic hydrogen production is the inhibition of electron/hole recombination by consuming the generated holes. Therefore, the oxidation of methanol molecules over the surface of the photocatalyst resulting in the formation of more hydrogen gas. Besides, the study of the stability of the prepared photocatalysts is important economically, and this study confirmed their stability even after 5 uses. Ag/TiO2 with the four different cyanine derivatives exhibited a similar effect, while all of them gave a higher yield of H2 than the unsensitized Ag/TiO2.Conflicts of interest
The authors announce that there is no conflict of interest.Acknowledgements
The authors are deeply grateful to the Deanship of Scientific Research at Umm Al-Qura University, which supported this work financially (Grant no 15SCI-3-3-0024).References
- J. Burschka, N. Pellet, S.-J. Moon, R. Humphry-Baker, P. Gao, M. K. Nazeeruddin and M. Grätzel, Nature, 2013, 499, 316–319 CrossRef CAS PubMed.
- A. Levitz, F. Marmarchi and M. Henary, Molecules, 2018, 23(2), 226 CrossRef PubMed.
- T. L. Dost, M. T. Gressel and M. Henary, Anal. Chem. Insights, 2017, 12, 1–6 CAS.
- X. Liu, Z. Xu and J. M. Cole, J. Phys. Chem. C, 2013, 117, 16584–16595 CrossRef CAS.
- C. P. Toseland, J. Chem. Biol., 2013, 6, 85–95 CrossRef PubMed.
- A. A. Kostyukov, A. E. Egorov, M. G. Mestergazi, A. M. Shmykova, T. A. Podrugina, I. E. Borissevitch, A. A. Shtil and V. A. Kuzmin, Mendeleev Commun., 2020, 30, 442–444 CrossRef CAS.
- V. K. Saarnio, K. Salorinne, V. P. Ruokolainen, J. R. Nilsson, T.-R. Tero, S. Oikarinen, L. M. Wilhelmsson, T. M. Lahtinen and V. S. Marjomäki, Dyes Pigm., 2020, 177, 108282 CrossRef CAS.
- L. S. Almazroai and R. E. El-Mekawy, RSC Adv., 2019, 9, 24670–24681 RSC.
- R. E. El-Mekawy and A. A. Fadda, Bioorg. Med. Chem. Lett., 2018, 28, 1747–1752 CrossRef CAS PubMed.
- R. E. El-Mekawy and A. A. Fadda, RSC Adv., 2017, 7, 54706–54716 RSC.
- A. A. Fadda and R. E. El-Mekawy, Dyes Pigm., 2013, 99, 512–519 CrossRef CAS.
- S. Ban, W. Lin and J. Luo, Int. J. Hydrogen Energy, 2019, 44, 1466–1473 CrossRef CAS.
- L. Hu, B. Zheng, Z. Lai and K. Huang, Int. J. Hydrogen Energy, 2014, 39, 20031–20037 CrossRef CAS.
- M. Y. Ghaly, T. S. Jamil, I. E. El-Seesy, E. R. Souaya and R. A. Nasr, Chem. Eng. J., 2011, 168, 446–454 CrossRef CAS.
- J. Yu, Z. Chen, L. Zeng, Y. Ma, Z. Feng, Y. Wu, H. Lin, L. Zhao and Y. He, Sol. Energy Mater. Sol. Cells, 2018, 179, 45–56 CrossRef CAS.
- P. Chen, P. Xing, Z. Chen, H. Lin and Y. He, Int. J. Hydrogen Energy, 2018, 43, 19984–19989 CrossRef CAS.
- T. Wei, Y. N. Zhu, X. An, L. M. Liu, X. Cao, H. Liu and J. Qu, ACS Catal., 2019, 9, 8346–8354 CrossRef CAS.
- V. Vaiano, C. A. Jaramillo-Paez, M. Matarangolo, J. A. Navío and M. del Carmen Hidalgo, Mater. Res. Bull., 2019, 112, 251–260 CrossRef CAS.
- M. Navarrete, S. Cipagauta-Díaz and R. Gómez, J. Chem. Technol. Biotechnol., 2019, 94, 3457–3465 CrossRef CAS.
- C. Castañeda, F. Tzompantzi, A. Rodríguez-Rodríguez, M. Sánchez-Dominguez and R. Gómez, J. Chem. Technol. Biotechnol., 2018, 93, 1113–1120 CrossRef.
- E. Wierzbicka, X. Zhou, N. Denisov, J. E. Yoo, D. Fehn, N. Liu, K. Meyer and P. Schmuki, ChemSusChem, 2019, 12, 1900–1905 CrossRef CAS PubMed.
- A. A. Nada, W. M. A. El Rouby, M. F. Bekheet, M. Antuch, M. Weber, P. Miele, R. Viter, S. Roualdes, P. Millet and M. Bechelany, Appl. Surf. Sci., 2020, 505, 144419 CrossRef CAS.
- N. D. Phu, L. H. Hoang, P. Van Hai, T. Q. Huy, X. B. Chen and W. C. Chou, J. Alloys Compd., 2020, 824, 153914 CrossRef.
- S. Wageh, L. S. Almazroai, A. Alshahrie and A. A. Al-Ghamdi, J. Nanosci. Nanotechnol., 2018, 18, 7682–7690 CrossRef CAS.
- G. Gong, Y. Liu, B. Mao, L. Tan, Y. Yang and W. Shi, Appl. Catal., B, 2017, 216, 11–19 CrossRef CAS.
- E. Hussain, I. Majeed, M. A. Nadaem, A. Badshah, Y. Chen, M. A. Nadeem and R. Jin, J. Phys. Chem. C, 2016, 120, 17205–17213 CrossRef CAS.
- O. Rosseler, M. V. Shankar, M. K. Le Du, L. Schmidlin, N. Keller and V. Keller, J. Catal., 2010, 269, 179–190 CrossRef CAS.
- E. Hussain, I. Majeed, M. A. Nadeem, A. Iqbal, Y. Chen, M. Choucair, R. Jin and M. A. Nadeem, J. Environ. Chem. Eng., 2019, 7, 102729 CrossRef CAS.
- C. Suwanchawalit, S. Wongnawa, P. Sriprang and P. Meanha, Ceram. Int., 2012, 38, 5201–5207 CrossRef CAS.
- X. F. Lei, X. X. Xue and H. Yang, Appl. Surf. Sci., 2014, 321, 396–403 CrossRef CAS.
- Y. K. Park, B. J. Kim, S. Jeong, K. J. Jeon, K. H. Chung and S. C. Jung, Environ. Res., 2020, 188, 109630 CrossRef CAS PubMed.
- S. Mohammed Harshulkhan, K. Janaki, G. Velraj, R. Sakthi Ganapthy and M. Nagarajan, J. Mater. Sci.: Mater. Electron., 2016, 27, 4744–4751 CrossRef CAS.
- A. Sułek, B. Pucelik, J. Kuncewicz, G. Dubin and J. M. Dąbrowski, Catal. Today, 2019, 335, 538–549 CrossRef.
- Y. Yang, F. An, Z. Liu, X. Zhang, M. Zhou, W. Li, X. Hao, C. S. Lee and X. Zhang, Biomaterials, 2012, 33, 7803–7809 CrossRef CAS PubMed.
- B. O'Regan and M. Grätzel, Nature, 1991, 353, 737–740 CrossRef.
- J. Qin, J. Huo, P. Zhang, J. Zeng, T. Wang and H. Zeng, Nanoscale, 2016, 8, 2249–2259 RSC.
- M. Stylidi, D. I. Kondarides and X. E. Verykios, Appl. Catal., B, 2004, 47, 189–201 CrossRef CAS.
- X. Zhang, L. Yu, C. Zhuang, T. Peng, R. Li and X. Li, RSC Adv., 2013, 3, 14363–14370 RSC.
- W. Wu, F. Guo, J. Li, J. He and J. Hua, Synth. Met., 2010, 160, 1008–1014 CrossRef CAS.
- B. Wang, G. Y. Cui, B. B. Zhang, Z. Li, H. X. Ma, W. Wang, F. Y. Zhang and X. X. Ma, Opt. Mater., 2020, 109, 110202 CrossRef CAS.
- R. E. El-Mekawy and A. A. Fadda, RSC Adv., 2017, 7, 54706–54716 RSC.
- R. E. El-Mekawy and A. A. Fadda, Bioorg. Med. Chem. Lett., 2018, 28, 1747–1752 CrossRef CAS PubMed.
- S. Naghibi and M. Gharagozlou, J. Chin. Chem. Soc., 2017, 64, 640–650 CrossRef CAS.
- M. Y. Rizal, R. Saleh, S. P. Prakoso, A. Taufik and S. Yin, Mater. Sci. Semicond. Process., 2021, 121, 105371 CrossRef CAS.
- D. A. Giannakoudakis, D. Łomot and J. C. Colmenares, Green Chem., 2020, 22, 4896–4905 RSC.
- A. Singh and A. S. K. Sinha, J. Energy Chem., 2018, 27, 1183–1188 CrossRef.
- L. S. Almazroai and R. E. El-Mekawy, RSC Adv., 2019, 9, 24670–24681 RSC.
- Z. Lian, W. Wang, S. Xiao, X. Li, Y. Cui, D. Zhang, G. Li and H. Li, Sci. Rep., 2015, 5, 1–11 Search PubMed.
- E. Albiter, M. A. Valenzuela, S. Alfaro, G. Valverde-Aguilar and F. M. Martínez-Pallares, J. Saudi Chem. Soc., 2015, 19, 563–573 CrossRef.
- P. Van Viet, B. T. Phan, D. Mott, S. Maenosono, T. T. Sang, C. M. Thi and L. Van Hieu, J. Photochem. Photobiol., A, 2018, 352, 106–112 CrossRef.
- A. Nagy and G. Mestl, Appl. Catal., A, 1999, 188, 337–353 CrossRef CAS.
- R. E. El-Mekawy and R. S. Jassas, Medchemcomm, 2017, 8, 897–906 RSC.
- R. E. El-Mekawy, H. A. Elhady and H. F. Al-Shareef, Polym. Polym. Compos., 2020, 29, 563–573 Search PubMed.
- D. Gogoi, A. Namdeo, A. K. Golder and N. R. Peela, Int. J. Hydrogen Energy, 2020, 45, 2729–2744 CrossRef CAS.
- L. M. Santos, W. A. Machado, M. D. França, K. A. Borges, R. M. Paniago, A. O. T. Patrocinio and A. E. H. Machado, RSC Adv., 2015, 5, 103752–103759 RSC.
- T. Ali, A. Ahmed, U. Alam, I. Uddin, P. Tripathi and M. Muneer, Mater. Chem. Phys., 2018, 212, 325–335 CrossRef CAS.
- T. Munir, M. Sharif, H. Ali, M. Kashif, A. Sohail and N. Sabir, Dig. J. Nanomater. Biostructures, 2019, 14, 279–284 Search PubMed.
- A. Litke, Y. Su, I. Tranca, T. Weber, E. J. M. Hensen and J. P. Hofmann, J. Phys. Chem. C, 2017, 121(13), 7514–7524 CrossRef CAS PubMed.
- L. Mino, C. Negri, R. Santalucia, G. Cerrato, G. Spoto and G. Martra, Molecules, 2020, 25(20), 4605 CrossRef CAS PubMed.
- B. Kumar, K. Smita, Y. Angulo and L. Cumbal, Green Process. Synth., 2016, 371–377 CAS.
- A. Mohagheghian, S. Karimi, J. Yang and M. Shirzad-siboni, J. Adv. Oxid. Technol., 2015, 18(1), 61–68 CAS.
- N. Manwar, A. Chilkalwar, K. K. Nanda, Y. S. Chaudhary, J. Subrt, S. S. Rayalu and N. K. Labhsetwar, ACS Sustainable Chem. Eng., 2016, 4, 2323–2332 CrossRef CAS.
- Z. Chen, X. Jiang, C. Zhu and C. Shi, Appl. Catal., B, 2016, 199, 241–251 CrossRef CAS.
- M. Wang, S. Shen, L. Li, Z. Tang and J. Yang, J. Mater. Sci., 2017, 52, 5155–5164 CrossRef CAS.
- F. Guzman, S. S. C. Chuang and C. Yang, Ind. Eng. Chem. Res., 2013, 52, 61–65 CrossRef CAS.
- K. Han, W. Li, C. Ren, H. Li, X. Liu, X. Li, X. Ma, H. Liu and A. Khan, J. Taiwan Inst. Chem. Eng., 2020, 112, 4–14 CrossRef CAS.
- D. P. Kumar, N. L. Reddy, M. Karthik, B. Neppolian, J. Madhavan and M. V. Shankar, Sol. Energy Mater. Sol. Cells, 2016, 154, 78–87 CrossRef CAS.
- A. Tiwari and U. Pal, Int. J. Hydrogen Energy, 2015, 40, 9069–9079 CrossRef CAS.
- D. Popugaeva, T. Tian and A. K. Ray, Int. J. Hydrogen Energy, 2020, 45, 11097–11107 CrossRef CAS.
- W. Ghann, H. Kang, E. Emerson, J. Oh, T. Chavez-Gil, F. Nesbitt, R. Williams and J. Uddin, Inorg. Chim. Acta, 2017, 467, 123–131 CrossRef CAS.
- M. Guo, P. Diao, Y.-J. Ren, F. Meng, H. Tian and S.-M. Cai, Sol. Energy Mater. Sol. Cells, 2005, 88, 23–35 CrossRef CAS.
- X. Zhang, X. Zhang, K. Feng, X. Hu, J. Fan and E. Liu, RSC Adv., 2021, 11, 11872–11881 RSC.
- B. Zhang, X. Hu, E. Liu and J. Fan, Chin. J. Catal., 2021, 42, 1519–1529 CrossRef CAS.
- K. Mohammadi, A. Moshaii, M. Azimzadehirani and Z. S. Pourbakhsh, J. Mater. Sci.: Mater. Electron., 2019, 30, 1878–1884 CrossRef CAS.
- M. Ni, D. Y. C. Leung, M. K. H. Leung and K. Sumathy, Fuel Process. Technol., 2006, 87, 461–472 CrossRef CAS.
- G. Y. Yao, Q. L. Liu and Z. Y. Zhao, Catalysts, 2018, 8(6), 236 CrossRef.
- J. Joo, Y. Ye, D. Kim, J. Lee and S. Jeon, Mater. Lett., 2013, 93, 141–144 CrossRef CAS.
- K.-Y. A. Lin and Z.-Y. Zhang, Chem. Eng. J., 2017, 313, 1320–1327 CrossRef CAS.
Footnote |
| † Electronic supplementary information (ESI) available. See https://doi.org/10.1039/d2ra00788f |
| This journal is © The Royal Society of Chemistry 2022 |

