 Open Access Article
Fabrication of a polyoxotungstate/metal–organic framework/phosphorus-doped reduced graphene oxide nanohybrid modified glassy carbon electrode by electrochemical reduction and its electrochemical properties
Hamid Ravanbakhsh,
Somayeh Dianat * and
Amin Hosseinian
Department of Chemistry, Faculty of Sciences, University of Hormozgan, Bandar Abbas, 79161-93145, Iran. E-mail: s.dianat@hormozgan.ac.ir; Tel: +98 76 33670121
First published on 23rd March 2022
Abstract
Hybrid nanocomposites based on polyoxometalates (POMs), metal–organic frameworks (MOFs), and graphene oxide (GO) have a unique set of properties. They have specific properties such as high acidity, oxygen-rich surface, and good redox capability from POMs. In contrast, they do not have weaknesses of POMs such as a low surface area, and high solubility in aqueous media. Herein, a novel organic–inorganic nanohybrid compound based on H3PW12O40 (PW12), a Co-based MOF, and GO was prepared. The prepared hybrid nanocomposite (PW12/MOF/GO) was characterized using different techniques. Then, a PW12/MOF/GO nanocomposite modified glassy carbon electrode (GCE) was fabricated by the drop-casting method and next was dried at room temperature. Then, the PW12/MOF/GO/GCE was subjected to electrochemical reduction at a constant potential of −1.5 V, in 0.1 M H3PO4 solution containing 0.10% w/v PW12/MOF/GO additive. The morphology, electrochemical activity, and stability of the modified electrode (PW12/MOF/P@ERGO/GCE) were studied with FE-SEM coupled with EDS, CV, and amperometry. The obtained results confirmed that the PW12/MOF/P@ERGO/GCE could be effective in hydrogen evolution reaction (HER). The electrochemical activity of the PW12/MOF/P@ERGO/GCE due to the desirable microstructure of the electrocatalyst (e.g. high active surface area and homogeneous distribution of the PW12/MOF/P@ERGO), and also the synergistic effect of the blocks, is more than those of PW12/GCE, MOF/GCE, PW12/MOF/GCE, and P@ERGO/GCE. Moreover, the PW12/MOF/P@ERGO/GCE showed an excellent long-term stability under the air atmosphere.
1. Introduction
Polyoxometalates (POMs) are a large class of metal oxide clusters, consisting of early transition metal oxoanions with shared oxygen atoms exhibiting well-defined connectivity.1,2 POMs, especially Keggin-type POMs, have wide applications in various fields such as catalysis,3 optics,4 magnetism,5 medicine,6,7 environmental science,8 and electrochemistry,9,10 due to their exclusive molecular structure, electronic features, and excellent redox properties. One of the attractive properties of POMs is that the anionic cluster can undergo a fast, stepwise, reversible, and multi-electron transfer reaction while keeping the structural integrity.11,12 These numerous redox properties make them potential candidates for surface modification, and electrocatalytic studies. However, their use as catalysts is one of the interesting fields for researchers, because of their high acidity, oxygen-rich surface, and redox capability. Despite these special characteristics, POMs still show some weaknesses for their use as a catalyst. First, POMs have a low specific surface area (<10 m2 g−1), which consequently reduces the availability of reactants, and secondly, their high solubility in aqueous solutions results in low recyclability.2To overcome these challenges and improve electrochemical properties and electrocatalytic performances, immobilization or dispersion of POMs onto porous materials has been proposed.
In the last few decades, many porous solids have been investigated as immobilizers for POMs, like silica, conducting polymers, ion-exchange resin, and carbon materials.13–16 Since discovering metal–organic frameworks (MOFs), these porous materials have been widely used as potential supports for POMs.3,17,18
MOFs are inorganic–organic hybrid crystalline materials are fabricated from metal-containing nodes and organic linkers through coordination bonds. These materials have attracted considerable attention in recent years due to their large surface areas, adjustable pore size, and designable functionalities.
MOFs have shown great potential in gas storage and separation,19 catalysis,20–22 sensing,23,24 drug delivery,25,26 proton conduction,27,28 solar cells,29,30 supercapacitors31,32 and biomedicine.33,34 In addition, MOFs are as a suitable platform for the introduction of guest molecules due to the high accessibility of their internal surface area and regular long-range channels. To date, several active sites have been successfully embedded in the cages of MOFs, such as noble metals,35 metal oxides,36,37 enzymes,38,39 and POMs.40,41
The first report of a POM/MOF hybrid was presented in 2005 by Férey et al.42 In this study, K7PW11O39·nH2O successfully was incorporated into big cages of the highly stable Cr-based MOF, MIL-101, using the impregnation method.
Up to now, several other thermal and stable chemical MOFs such as Materials of Institute Lavoisier Framework Series (MIL Series),43,44 Zeolite Imidazole Framework Series (ZIF Series),45 and Cu-BTC46,47 frameworks applied as supports for POMs hosting for using in catalysis.
The most examined POMs that have been incorporated into MOFs are the well-known Keggin [XM12O40]n− and Wells–Dawson [X2M18O62]n− (X = Si, P, etc.; M = Mo, W, V, etc.) POMs and their derivatives.40,48–51
There are many benefits to using MOFs as a host matrix to encapsulate POMs. First, their extremely high surface areas and confined cages/channels allow the homogeneous distribution of POM in the MOF host to be ensured. This phenomenon prevents the a aggregation of POMs, and improves their stability and recyclability. Secondly, the very regular cages and channels of MOFs provide a high substrate selectivity, or, in other words, only specific substrates/products can access the active POM sites. Thirdly, due to the excellent interaction and electron transfer between the MOF and the POM, an enhanced synergistic catalytic effect is typically observed. Finally, the POM@MOF hybrids not only combine the exciting properties of POM and MOF, but also allow the weaknesses as mentioned above of POMs to be resolved, and the catalytic performance significantly increased.2
On the other hand, immobilization or entrapment of POMs on various supporting carbon materials has concerned significant attention. Among the carbon materials, graphene extensively studied in nanotechnology fields due to its excellent chemical stability, high surface area, extraordinary conductivity, and good mechanical properties.10,12
Graphene was discovered at Manchester University by Andre Geim and Kostya Novoselov in 2004.52 It is an allotrope of carbon-containing a single layer of atoms arranged in a two-dimensional (2D) hexagonal lattice nanostructure.53
It is the thinnest and most robust known material in the universe.54 Graphene is a good choice for POMs support materials to overcome the limitations of POMs such as high solubility in polar solvents and low specific surface area (SSA).55 In addition, the unique features of POMs, especially in catalysis,56 electrocatalysis,57 and capacitance,58 enhance because of the large SSA and excellent electrical conductivity of graphene.
Recently, numerous reports have submitted on the nanocomposites of reduced graphene oxide (RGO) and polyoxometalates (POMs).58–61 However, the RGO is processed from GO through UV-photoreduction,62,63 and chemical reduction with hazardous materials.64 However, using these approaches, POM/RGO composites are obtained in powder form, which must be deposited on the surface of electrode by the drop-casting technique. The drop-casting technique has inherent defects like lack of control over the film thickness and low stability.65 The self-assembly method is the best way to create stable and uniform modified surfaces. Recently, the preparation of RGO from GO by the electrochemical reduction method has attracted a lot of attention due to its easy and green preparation method.65–68 Chen et al. directly deposited RGO onto a glassy carbon electrode (GCE) through cyclic voltammetric (CV) reduction of a GO colloidal solution. The graphene-modified electrode was applied to simultaneously determine of hydroquinone and catechol.66 Guo et al. investigated the preparation method and electrocatalytic property of H4SiMo12O40 and chitosan/ERGO multilayer composite films on indium tin oxide (ITO) electrode by electrochemical growth method.65 Tao Wei et al. firstly synthesized H5PMo10V2O40/BTC/RGO nanocomposites for lithium-ion batteries (LIBs) by a facile one-pot method.69 Wen Zhang and co-workers prepared a POM/MOF/RGO hybrid material via a facile hydrothermal process. The prepared hybrid material is used to detect dopamine (DA). The POM/MOF/RGO/GCE presented an excellent catalytic activity toward oxidation of DA owing to matching functionality and structure between the POM, MOF, and RGO.70
Recently, many reports have verified that heteroatom doping into graphene (e.g., B, N, P, and S) can increase the electrical conductivity and electrocatalytic activity of RGO in supercapacitor electrodes,71,72 lithium-ion batteries (LIBs),73,74 fuel cells,75,76 and dye-sensitized solar cells.77
The preparation of the P-doped graphene monolayer film modified electrode by the electrochemical reduction approach has many benefits. But, few studies have reported concerning the POM/P@ERGO modified electrode and its derivatives. Therefore fabrication of these modified electrodes still have challenges.
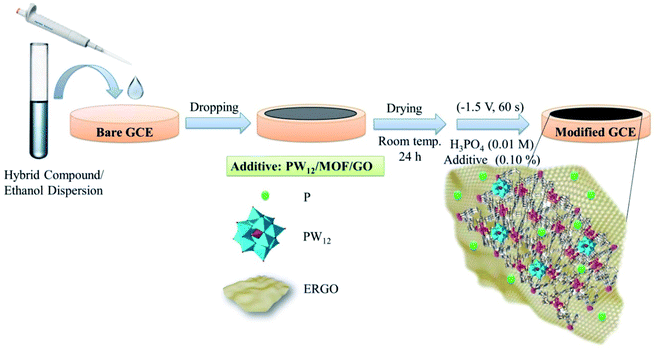
In this work, a new PW12O40·nH2O/[Co(TPA)(bimb)(H2O)2]n/GO nanocomposite has been deposited onto a GCE using drop-casting method followed by an electrochemical reduction process (PW12/MOF/P@ERGO). For this purpose, PW12/MOF/GO nanocomposite was dropped onto the GCE. Then the modification procedure completed through the electrochemical reduction of GO to RGO at a constant potential of −1.5 V, for 60 s in a H3PO4 aqueous solution (0.1 M) containing PW12/MOF/GO (0.10% w/v) as an additive. The PW12/MOF nanocomposite can interact with P@ERGO via Pδ+ and π-electrons of MOF without any impact on the electronic structure of PW12 Keggin type. The synergistic effects of these four-blocks, and specific microstructure of PW12/MOF/P@ERGO nanocomposite provide enhanced electrochemical activity of the modified electrode. Then, electrochemical behavior, stability, repeatability, reproducibility of the modified electrode were investigated, comprehensively.
2. Experimental section
2.1. Materials
The [Co(TPA)(bimb)(H2O)2]n as a Co-based MOF was synthesized according to the previous literature.78 The 1,4-bis(imidazole)butane (abbreviated as bimb) was prepared according to the previous literature.79 Tungstophosphoric acid (H3PW12O40, abbreviated as PW12), cobalt(II) nitrate hexahydrate (Co(NO3)2·6H2O), terephthalic acid (abbreviated as TPA), dimethylformamide (abbreviated as DMF), graphite powder (<20 μm), and other chemicals were of analytical grade and purchased from commercial sources (Merck or Sigma) and used without further purification. Phosphate buffer saline solutions (PBS, 0.11 M) were prepared by mixing the stock solutions of 0.10 M KCl and 0.01 M H3PO4 and then adjusting the pH with 0.5 M NaOH aqueous solution.2.2. Physical methods
The percent of immobilized PW12 on the GO was determined from inductively coupled plasma-optical emission spectrometry (Optima 7300 V ICP-OES spectrometer Brochure-PerkinElmer) by measuring of tungsten contents in the PW12/MOF/GO. FTIR spectra in ATR mode were recorded using a Spectrum Two FT-IR spectrometer (PerkinElmer) in the 4000–600 cm−1 range. The crystalline structure of the PW12, [Co(TPA)(bimb)(H2O)2]n, PW12/MOF, GO, and PW12/MOF/GO was confirmed using an X-ray diffraction (XRD, PANalytical X’PERT-PRO X-ray diffractometer equipped with Cu Kα radiation, λ = 0.1541 nm). The morphologies of the PW12/MOF/GO, and GO were studied by transmission electron microscope (TEM, EM10C-100 kV series, Zeiss Co., Germany). The surface morphology and elemental analysis of the bare GCE, P@ERGO/GCE, and PW12/MOF/P@RGO/GCE were determined using a Field Emission-Scanning Electron Microscopy (FE-SEM, SIGMA VP, Zeiss Co., Germany), Energy-Dispersive X-ray Spectrometry (EDS) and EDS-mapping. N2 adsorption–desorption isotherms were recorded at 77 K using a BElSORP Mini-Microtrac Bel Corp instrument. Specific surface areas of MOF and POM/MOF were measured using the Brunauer–Emmett–Teller (BET) method. The pore-size distribution curves were recorded from the isotherm using the Barrett–Joyner–Halenda (BJH) algorithm.2.3. Electrochemical experiments
The electrochemical experiments were performed with a Metrohm Autolab potentiostat P/GSTAT 302N supplied by Eco-Chemie (Utrecht, The Netherlands). The traditional three-electrode system was used with, an Ag/AgCl (3 M KCl) electrode as the reference electrode, a Pt wire electrode as the auxiliary electrode, and a bare or modified GCE (diameter 2 mm) as the working electrode. Before the electrochemical experiments, Ar gas with the purity of 99.999% was fed into the electrolytic cell for 15 minute. The electrochemical measurements were carried out under the Ar atmosphere at room temperature.2.4. Synthesis of PW12/MOF
A mixture of bimb (0.095 g, 0.5 mmol), Co(NO3)2·6H2O (0.320 g, 1.0 mmol), TPA (0.085 g, 0.5 mmol), and PW12 (0.288 g, 1.0 mmol) was dissolved in 25.0 mL DMF and 25.0 mL distilled water. After stirring for 30 minute at room temperature, the reaction suspension was transferred to the Teflon-lined stainless-steel autoclave (100 mL), kept at 160 °C under autogenous pressure for 72 h. Then the autoclave was cooled to room temperature with rate of 5 °C h−1. Reddish-pink crystals were collected by filtration. Then obtained crystals washed with distilled water, and dried in the open air (about 45% yield based on cobalt).2.5. Synthesis of PW12/MOF/GO
GO was prepared by oxidizing graphite flakes via modified Hummers' method.80 As-prepared GO (0.100 g) in distilled water (10 mL) was exposed to sonication for 30 minute to achieve a homogeneous suspension. Then 1.000 g of PW12/MOF was added. After the sonication for 20 minute, the mixture was transferred into a 100 mL Teflon-lined stainless-steel autoclave. The autoclave was heated in an oven at 180 °C for 24 h. The black precipitates were filtered, washed with distilled water, and dried at 60 °C for 12 h to obtain PW12/MOF/GO.2.6. Fabrication of PW12/MOF/P@ERGO/GCE
The surface of the GCE was polished with α-alumina slurries (α-Al2O3, the particle size of 0.30, 0.10, and 0.05 μm) to remove the contaminants. Then it was electrochemically cleaned in 0.5 M H2SO4 solution by repetitive cycling in the potential range from −1.0 to 1.0 V (vs. Ag/AgCl) until a stable CV scan is achieved. After rinsing with deionized water, and drying at room temperature, 5.0 μL of the PW12/MOF/GO suspension (0.010 g in 2.0 mL ethanol) was drop-casted onto the bare GCE. Finally, the electrode surface was dried under room temperature overnight at air atmosphere, and washed with deionized water. Then, electrochemical reduction of GO to RGO was performed in 0.01 M H3PO4 containing different concentrations of PW12/MOF/GO as additive (0.0, 0.01, 0.05, 0.10, 0.15, and 0.20% w/v) using chronoamperometry in the potential of −1.5 V at various times (30, 45, 60, and 120 s). A better analytical signal was found in the presence of 0.10% w/v PW12/MOF/GO and at time 60 s. Therefore, 0.10% w/v additive and time 60 s were selected as optimum conditions in the fabrication of the modified GCE. PW12/GCE, MOF/GCE, PW12/MOF/GCE, and P@ERGO/GCE, as the control electrodes were constructed by a similar technique in 0.01 M H3PO4 in the absence of the additive. The schematic design of the preparation procedure of the modified GCE is displayed in Scheme 1.2.7. Electrochemical experiment
The electrochemical experiments were done in an electrochemical cell with a volume of 90 mL, containing 5 mL of H2SO4 (0.5 M, pH 0.5) solution. The CV, and amperometry methods were used to investigate of electrochemical behavior, effective electroactive surface area, and stability of the modified electrode.3. Results and discussion
3.1. Characterization
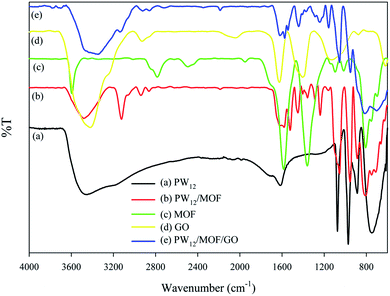
The loading percentage of PW12 on GO was estimated 0.83% by ICP spectroscopy. ATR-FTIR spectrum of PW12/MOF/GO is shown in Fig. 1. To prove of structure, ATR-FTIR measurements of PW12, PW12/MOF, MOF, and GO were also recorded as shown in Fig. 1, curves a, b, c, and d, respectively. The information is summarized in Table 1.![[small upsilon, Greek, macron]](https://www.rsc.org/images/entities/i_char_e0d5.gif) /cm−1) of PW12, PW12/MOF, MOF, GO, and PW12/MOF/GOa
/cm−1) of PW12, PW12/MOF, MOF, GO, and PW12/MOF/GOa
| Compound | ![[small upsilon, Greek, macron]](https://www.rsc.org/images/entities/i_char_e0d5.gif) (C (C![[double bond, length as m-dash]](https://www.rsc.org/images/entities/char_e001.gif) C) C) |
![[small upsilon, Greek, macron]](https://www.rsc.org/images/entities/i_char_e0d5.gif) (COO−) (COO−) |
![[small upsilon, Greek, macron]](https://www.rsc.org/images/entities/i_char_e0d5.gif) (C–O) (C–O) |
![[small upsilon, Greek, macron]](https://www.rsc.org/images/entities/i_char_e0d5.gif) (P–Oa) (P–Oa) |
![[small upsilon, Greek, macron]](https://www.rsc.org/images/entities/i_char_e0d5.gif) (W–Od) (W–Od) |
![[small upsilon, Greek, macron]](https://www.rsc.org/images/entities/i_char_e0d5.gif) (W–Ob–W) (W–Ob–W) |
![[small upsilon, Greek, macron]](https://www.rsc.org/images/entities/i_char_e0d5.gif) (W–Oc–W) (W–Oc–W) |
|---|---|---|---|---|---|---|---|
| a Oa central oxygen. Ob, Oc bridging oxygen. Od terminal oxygen. | |||||||
| PW12 | — | — | — | 1074 | 968 | 887 | 753 |
| PW12/MOF | 1627, 1485 | 1585 | — | 1056 | 953 | 886 | 802 |
| MOF | 1585, 1360 | — | — | — | — | — | — |
| GO | 1627, 1402 | 1574 | 1137 | — | — | — | — |
| PW12/MOF/GO | 1625, 1445 | 1164 | 1060 | 952 | 882 | 819 | |
The ATR-FTIR spectra of PW12, PW12/MOF, and PW12/MOF/GO show four characteristic peaks, that are related to the stretching vibration of P–Oa, W–Ob,c–W, and W–Od. The presence of these asymmetric stretching vibration peaks in PW12/MOF, and PW12/MOF/GO propose that the POM moiety of the hybrid compounds has maintained its Keggin structure. Moreover, the peaks around 1625, 1445, 1574, and 1164 cm−1 in PW12/MOF/GO that is assigned to the stretching vibrations of C![[double bond, length as m-dash]](https://www.rsc.org/images/entities/char_e001.gif) C aromatic, COO−, and C–O confirm the existence of MOF, and GO (compare curve e with c, and d).
C aromatic, COO−, and C–O confirm the existence of MOF, and GO (compare curve e with c, and d).
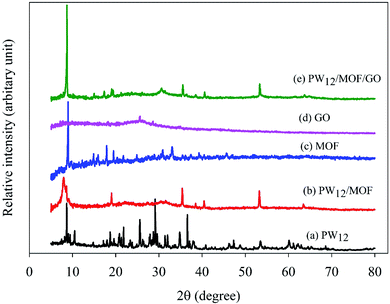
The XRD patterns of PW12, PW12/MOF, MOF, GO, and PW12/MOF/GO are presented in Fig. 2. As displayed in Fig. 2b, PW12/MOF shows peaks about 8.2°, and 19.1°, 30.8°, 35.4°, 40.4°, and 53.2°, respectively of the PW12 (Fig. 2a). However, a sharp peak about at 8.2°, and a broad peak at 30.8°, which are overlapped with the peaks of PW12, can be credited to the Co-based MOF (Fig. 2c). Fig. 2d shows a broad diffraction peak 26.4°, which is correspond to the (002) plane of GO nanosheets.81,82 In Fig. 2e, the characteristic XRD peaks of PW12/MOF/GO appeared at nearly similar locations without a significant shift in its peaks position compared to those of PW12, and MOF. However, the peak (002) of GO was not appeared because of peak overlap with the peak of PW12, and MOF which has a higher crystallinity.
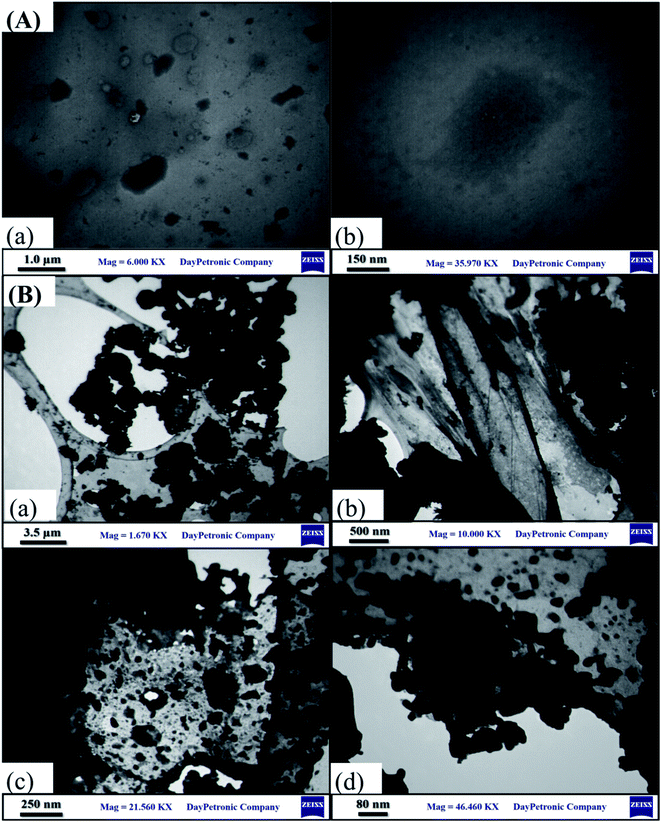
The TEM images of the GO and PW12/MOF/GO at the various magnifications are displayed in Fig. 3. TEM images of PW12/MOF/GO show that PW12/MOF nanospheres was immobilized homogeneously on the GO surface. Such homogeneous distribution of the PW12/MOF nanospheres on the surface of GO enhanced the electrochemical activity.
The specific surface areas and pore size distributions of the MOF, and PW12/MOF were measured by N2 adsorption–desorption isotherms. As shown in Fig. 4A and B, both samples exhibited a type-IV isotherm curve with an H4 hysteresis loop, often associated with narrow slit-like pores. The BET surface areas, total pore volumes, and mean pore diameters for MOF, and PW12/MOF are 277 m2 g−1, and 697 m2 g−1, 0.22 cm3 g−1, and 0.47 cm3 g−1, 32 nm, and 27 nm, respectively. The pore size distributions were calculated from the adsorption isotherms using the BJH model as shown in the inset of Fig. 4A and B. These confirm that the MOF, and PW12/MOF mainly contain micropores (1.6 nm), and mesopores (10.6 nm), respectively.
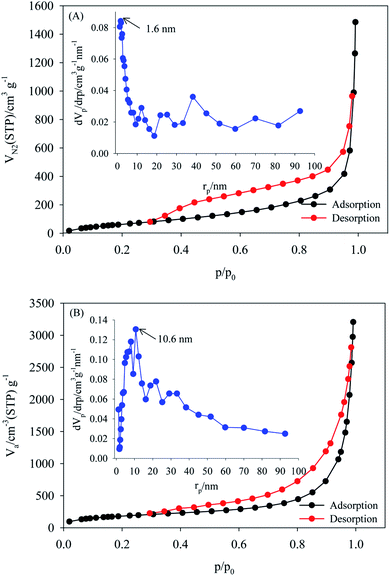 | ||
| Fig. 4 Nitrogen adsorption–desorption BET isotherms of (A) MOF, (B) PW12/MOF. The insets show the BJH-adsorption pore size distributions. | ||
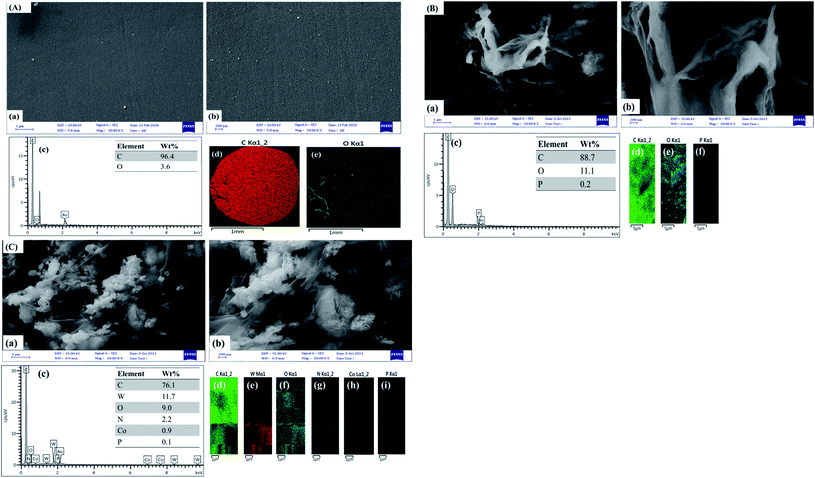
The morphology of the PW12/MOF/P@ERGO/GCE was characterized using FE-SEM, and compared with bare GCE, and P@ERGO/GCE. The FE-SEM images confirmed that the bare GCE (Fig. 5A, images a, b) have a mirror-like surface, which was changed to roughly and heterogeneously surface after the modification by P@ERGO, and PW12/MOF/P@ERGO (Fig. 5B and C, images a, b). Additionally, the EDS patterns of the bare and modified GCEs are presented in Fig. 5A–C image c. The EDS spectra and elemental mappings approve the presence of C, and O in the bare GCE (Fig. 5A, images c–e), C, O, and P in the P@ERGO/GCE (Fig. 5B, images c–f) and C, W, O, N, Co, and P elements on the PW12/MOF/P@ERGO/GCE (Fig. 5C, images c–i).
3.2. Electrochemical activity of PW12/MOF/P@ERGO/GCE
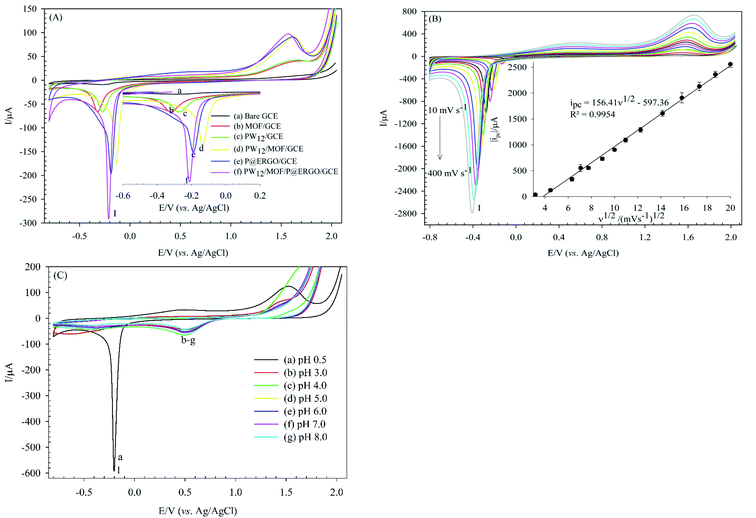
The electrochemical behaviors of the bare GCE, MOF/GCE, PW12/GCE, PW12/MOF/GCE, P@ERGO/GCE, and PW12/MOF/P@ERGO/GCE were investigated using the CV method in 0.5 M H2SO4 (Fig. 6). As shown in curve a, the bare GCE did not show any significant peak. In contrast, MOF/GCE, PW12/GCE, PW12/MOF/GCE, P@ERGO/GCE, and PW12/MOF/P@ERGO/GCE displayed a cathodic peak (peak I) about at −0.2 V (vs. Ag/AgCl), that can correspond to hydrogen evolution reaction (HER). However, the peak I current in PW12/MOF/P@ERGO/GCE (curve f) is more significant than MOF/GCE (curve b), PW12/GCE (curve c), PW12/MOF/GCE (curve d), and P@ERGO/GCE (curve e). This result confirms a synergistic effect of four blocks that can promote the electron transfer more effectively.3.3. Optimization of coating parameters
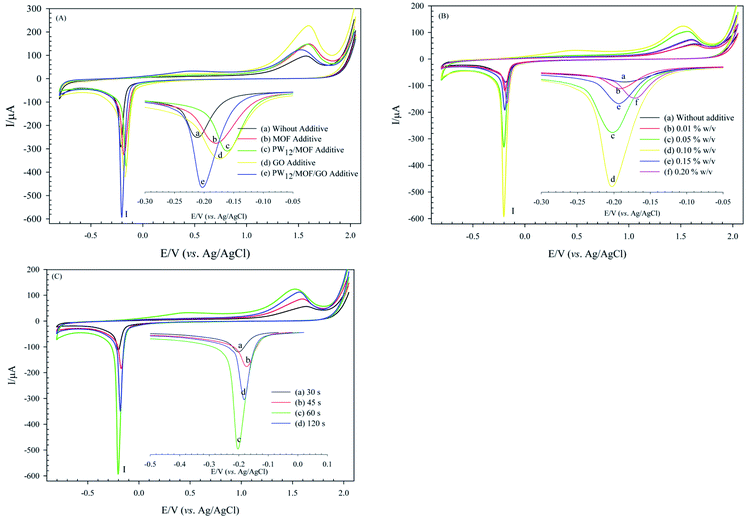
Optimizing of coating parameters is essential to achieve a modified electrode with enhanced electrochemical behavior. Some important parameters, including type, and concentration of electrolyte additive, and deposition time, were investigated. These parameters can affect the electrochemical property of the modified electrode. The following experiments were performed using CV in H3PO4 (0.01 M) at the constant potential of −1.5 V, as shown in Fig. 7. The prepared modified electrode was signified as PW12/MOF/P@ERGO/GCE through the text.Therefore, prepared PW12/MOF/GO/GCE in the presence of 0.10% w/v PW12/MOF/GO additive at 60 s was set as modified GCE, and it chosen to continue the subsequent electrochemical tests. Such excellent performance of the modified GCE at 60 s can be for the following reason. With increasing deposition time up to 60 s, the thickness of the P@ERGO structure is raising, which leads to better electrochemical performance. However, a longer electrodeposition time of 120 s gave a PW12/MOF/P@ERGO/GCE film with a thicker layer, which serves as a barrier layer and imparts resistance to the electron transfer.
3.4. Electrochemical studies of [Fe(CN)6]3−/4− on the PW12/MOF/P@ERGO/GCE
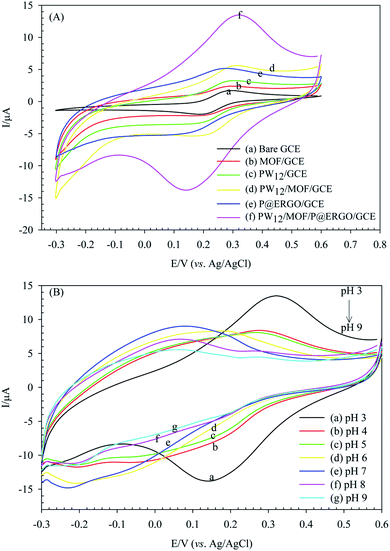
The electron transfer characteristics of the bare and the modified GCEs were appraised using voltammetric responses of [Fe(CN)6]3−/4− redox probe. The thickness and electronic structure of the modifier affects the electron transfer kinetic of [Fe(CN)6]3−/4− at the surface of the modified GCEs.85 The bare GCE displays a redox couple separated by 92.9 mV with ipc 1.68 μA in [Fe(CN)6]3−/4− (0.5 mM) in PBS (10 mM, pH 3) containing KCl (0.1 M) (Fig. 8A, curve a). The immobilization of MOF, PW12, and P@ERGO on the GCE leads to decrease in faradaic peak currents (ip) (Fig. 8A, curve b, c, and e). These modifiers serve a kinetic barrier to charge transfer between [Fe(CN)6]3−/4− and GCE surface, and decrease ip. Moreover, PW12/GCE, and P@ERGO/GCE also shows a significant increase in ΔEp (Fig. 8A, curve c, e). The PW12, and P@ERGO modifiers with negatively charges due to electrostatic repulsion with [Fe(CN)6]3−/4− increase the ΔEp. However, a lesser ΔEp accompanied by an increasing of ip was established for the PW12/MOF/GCE, and PW12/MOF/P@ERGO/GCE (Fig. 8A, curves d, f). It confirms that the synergistic effect of blocks can enhance the electron transfer kinetic at the GCE surface. The obtained quantitative information is given in Table 2.| Electrode | ΔE/mV ± SDa | ipc/μA ± SDa | ipa/μA± SDa |
|---|---|---|---|
| a SD: standard deviation (from 3 data point). | |||
| Bare GCE | 92.9 ± 1.2 | 1.68 ± 0.18 | 1.52 ± 0.13 |
| MOF/GCE | 80.0 ± 1.1 | 0.98 ± 0.06 | 0.99 ± 0.08 |
| PW12/GCE | 107.0 ± 2.1 | 1.43 ± 0.17 | 1.73 ± 0.14 |
| PW12/MOF/GCE | 80.0 ± 0.9 | 2.12 ± 0.15 | 2.47 ± 0.12 |
| P@ERGO/GCE | 115.8 ± 1.1 | 1.53 ± 0.19 | 1.55 ± 0.17 |
| PW12/MOF/P@ERGO/GCE | 79.0 ± 1.2 | 2.12 ± 0.11 | 2.27 ± 0.12 |
Electrochemical studies showed that variation of the electrolyte pH effects on the electrochemical properties of PW12/MOF/P@ERGO/GCE. Fig. 8B presents CVs of this modified electrode in [Fe(CN)6]3−/4− (0.5 mM) at various pHs (pH 3 to pH 9). As shown, the ΔEp increases and the ips decrease by increasing pH. However, almost no peak could be observed at pHs higher than 6. Indeed, with increasing pH, the concentration of OH− increases. Therefore, the positively charged surface of the modified electrode is gradually neutralized. Thus, the electrostatic attraction between the surface of PW12/MOF/P@ERGO/GCE and redox probe decreases and eventually disappears.
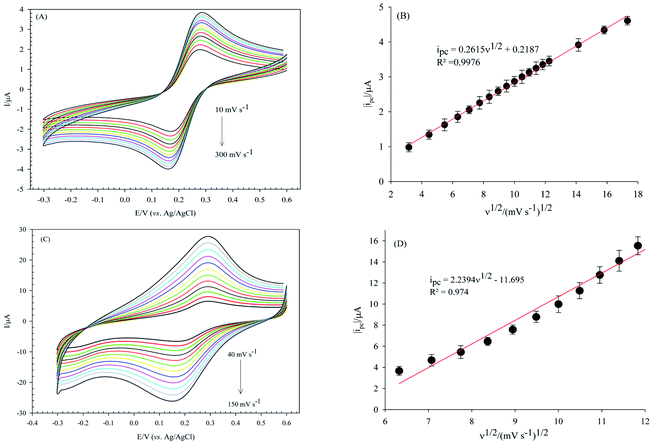
The electroactive surface area of the bare GCE, and PW12/MOF/P@ERGO/GCE was estimated by CV measurements in [Fe(CN)6]3−/4− (0.5 mM) containing KCl (0.1 M) at different scan rates (Fig. 9A and C, respectively). The electroactive surface area was calculated by using following Randles Sevcik equation (eqn (1)).86
| ip = 2.69 × 10⁵n3/2AD01/2ν1/2Cp1 | (1) |
3.5. Stability, repeatability, and reproducibility
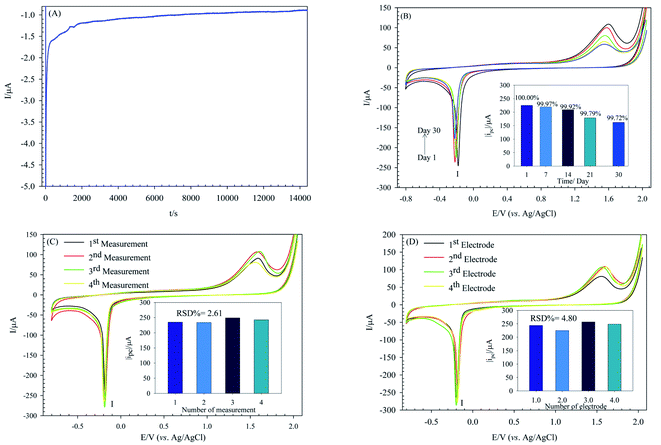
Attaining a highly stable sensor is one of the main aims of analytical electrochemistry. The POM-based modified electrodes are usually stable in acidic aqueous solutions. The stability of the PW12/MOF/P@ERGO/GCE was estimated by chronoamperometry (I-t) measurement at the fixed potential of −0.175 V in 0.5 M H2SO4 solution. As seen in Fig. 10A, the performance of PW12/MOF/P@ERGO/GCE is very stable up to 4 hours of measurement.The long-term stability of the modified electrode was also investigated. For this purpose, peak I current of the PW12/MOF/P@ERGO/GCE stored at ambient conditions over a month was recorded (Fig. 10B).
The results displayed that peak I current of the modified electrode remained at 99.97% of its primary current after 7 days, 99.92% after 14 days, 99.79% after 21 days, and 99.72% after a month.
The repeatability and reproducibility were also confirmed by repeatedly test. To certify the repeatability of PW12/MOF/P@ERGO/GCE, four different CV tests were repeated with one modified GCE surface (Fig. 10C). The reproducibility was estimated using four same modified electrodes by CV (Fig. 10D). The results confirmed that the modified electrode has excellent repeatability and reproducibility with relative standard deviation (RSD) of 2.61% and 4.80%, respectively.
4. Conclusions
In summary, the preparation method of a novel modified GCE based on POM, MOF, and RGO hybrid nanocomposite (PW12/MOF/P@ERGO/GCE) under the optimum conditions and its electrochemical properties has been investigated, comprehensively. The simplicity of preparation, high stability, good repeatability, and reproducibility are the features of the modified electrode. The modified GCE revealed a specific reduction peak that could be attributed to the HER processes. The PW12/MOF/P@ERGO/GCE show a high electroactive surface area of 6.032 cm2 resulting from the synergistic effect of PW12, MOF, and P@ERGO, and the porous structure of the hybrid modifier. Furthermore, electrochemical measurements proved that different factors such as type and concentration of the electrolyte additive, and electrodeposition time affect the electrochemical activity of the modified GCE.Conflicts of interest
There are no conflicts to declare.Acknowledgements
The authors gratefully acknowledge the financial support of this work by the Research Council of the University of Hormozgan.References
- L. Wang, T. Meng, J. Sun, S. Wu, M. Zhang, H. Wang and Y. Zhang, Anal. Chim. Acta, 2019, 1047, 28–35 CrossRef CAS PubMed.
- J. Sun, S. Abednatanzi, P. Van Der Voort, Y.-Y. Liu and K. Leus, Catalysts, 2020, 10, 578 CrossRef CAS.
- M. Samaniyan, M. Mirzaei, R. Khajavian, H. Eshtiagh-Hosseini and C. Streb, ACS Catal., 2019, 9, 10174–10191 CrossRef CAS.
- E. Rtibi, M. Abderrabba, S. Ayadi and B. Champagne, Inorg. Chem., 2019, 58, 11210–11219 CrossRef CAS PubMed.
- J. M. Clemente-Juan, E. Coronado and A. Gaita-Ariño, Chem. Soc. Rev., 2012, 41, 7464–7478 RSC.
- S. Dianat, A.-K. Bordbar, S. Tangestaninejad, B. Yadollahi, R. Amiri, S.-H. Zarkesh-Esfahani and P. Habibi, J. Inorg. Biochem., 2015, 152, 74–81 CrossRef CAS PubMed.
- S. Dianat, A. Bordbar, S. Tangestaninejad, S. Zarkesh-Esfahani, P. Habibi and A. A. Kajani, J. Iran. Chem. Soc., 2016, 13, 1895–1904 CrossRef CAS.
- A. X. Yan, S. Yao, Y. G. Li, Z. M. Zhang, Y. Lu, W. L. Chen and E. B. Wang, Chem.–Eur. J., 2014, 20, 6927–6933 CrossRef CAS PubMed.
- A. Karimi-Takallo, S. Dianat and A. Hatefi-Mehrjardi, J. Electroanal. Chem., 2021, 886, 115139 CrossRef CAS.
- M. Sharifi, S. Dianat and A. Hosseinian, RSC Adv., 2021, 11, 8993–9007 RSC.
- F. Boussema, R. Haddad, Y. Ghandour, M. S. Belkhiria, M. Holzinger, A. Maaref and S. Cosnier, Electrochim. Acta, 2016, 222, 402–408 CrossRef CAS.
- Q. Wang, J. Khungwa, L. Li, Y. Liu, X. Wang and S. Wang, J. Electroanal. Chem., 2018, 824, 91–98 CrossRef CAS.
- M. Green, J. Harries, G. Wakefield and R. Taylor, J. Am. Chem. Soc., 2005, 127, 12812–12813 CrossRef CAS PubMed.
- R. Liu, Y. Zhang, J. Ding, R. Wang and M. Yu, Sep. Purif. Technol., 2017, 174, 84–88 CrossRef CAS.
- S. Maity, B. Neethu, T. Kella, D. Shee, P. P. Das and S. S. Mal, J. Energy Storage, 2021, 40, 102727 CrossRef.
- J. Selvam, B. Samannan, P. Peter and J. Thavasikani, Polym. Polym. Compos., 2021, 29, 373–382 CAS.
- C. T. Buru and O. K. Farha, ACS Appl. Mater. Interfaces, 2020, 12, 5345–5360 CrossRef CAS PubMed.
- P. Mialane, C. Mellot-Draznieks, P. Gairola, M. Duguet, Y. Benseghir, O. Oms and A. Dolbecq, Chem. Soc. Rev., 2021, 50, 6152–6220 RSC.
- M. Bonneau, C. Lavenn, P. Ginet, K.-i. Otake and S. Kitagawa, Green Chem., 2020, 22, 718–724 RSC.
- K. Shen, X. Chen, J. Chen and Y. Li, ACS Catal., 2016, 6, 5887–5903 CrossRef CAS.
- H. T. Nguyen, D. N. Doan and T. Truong, J. Mol. Catal. A: Chem., 2017, 426, 141–149 CrossRef CAS.
- Q. Wang and D. Astruc, Chem. Rev., 2019, 120, 1438–1511 CrossRef PubMed.
- K. N. Chappanda, O. Shekhah, O. Yassine, S. P. Patole, M. Eddaoudi and K. N. Salama, Sens. Actuators, B, 2018, 257, 609–619 CrossRef CAS.
- L. Wang, Z. Hu, S. Wu, J. Pan, X. Xu and X. Niu, Anal. Chim. Acta, 2020, 1121, 26–34 CrossRef CAS PubMed.
- M. X. Wu and Y. W. Yang, Adv. Mater., 2017, 29, 1606134 CrossRef PubMed.
- J. Cao, X. Li and H. Tian, Curr. Med. Chem., 2020, 27, 5949–5969 CrossRef CAS PubMed.
- Y. Y. Cai, Q. Yang, Z. Y. Zhu, Q. H. Sun, A. M. Zhu, Q. G. Zhang and Q. L. Liu, J. Membr. Sci., 2019, 590, 117277 CrossRef CAS.
- Z.-Q. Shi, N.-N. Ji, M.-H. Wang and G. Li, Inorg. Chem., 2020, 59, 4781–4789 CrossRef CAS PubMed.
- E. D. Spoerke, L. J. Small, M. E. Foster, J. Wheeler, A. M. Ullman, V. Stavila, M. Rodriguez and M. D. Allendorf, J. Phys. Chem. C, 2017, 121, 4816–4824 CrossRef CAS.
- J. Dou, C. Zhu, H. Wang, Y. Han, S. Ma, X. Niu, N. Li, C. Shi, Z. Qiu and H. Zhou, Adv. Mater., 2021, 2102947 CrossRef CAS.
- S. Gao, Y. Sui, F. Wei, J. Qi, Q. Meng and Y. He, J. Mater. Sci., 2018, 53, 6807–6818 CrossRef CAS.
- Y. Wang, Y. Liu, H. Wang, W. Liu, Y. Li, J. Zhang, H. Hou and J. Yang, ACS Appl. Energy Mater., 2019, 2, 2063–2071 CrossRef CAS.
- D. Wang, D. Jana and Y. Zhao, Acc. Chem. Res., 2020, 53, 1389–1400 CrossRef CAS PubMed.
- A. Bieniek, A. P. Terzyk, M. Wiśniewski, K. Roszek, P. Kowalczyk, L. Sarkisov, S. Keskin and K. Kaneko, Prog. Mater. Sci., 2021, 117, 100743 CrossRef CAS.
- Y. Han, H. Xu, Y. Su, Z.-l. Xu, K. Wang and W. Wang, J. Catal., 2019, 370, 70–78 CrossRef CAS.
- Y. Li, Y. Xu, W. Yang, W. Shen, H. Xue and H. Pang, Small, 2018, 14, 1704435 CrossRef PubMed.
- S. Wu, J. Liu, H. Wang and H. Yan, Int. J. Energy Res., 2019, 43, 697–716 CrossRef CAS.
- X. Lian, Y. Huang, Y. Zhu, Y. Fang, R. Zhao, E. Joseph, J. Li, J. P. Pellois and H. C. Zhou, Angew. Chem., 2018, 130, 5827–5832 CrossRef.
- S. S. Nadar, L. Vaidya and V. K. Rathod, Int. J. Biol. Macromol., 2020, 149, 861–876 CrossRef CAS PubMed.
- C. Freire, D. M. Fernandes, M. Nunes and V. K. Abdelkader, ChemCatChem, 2018, 10, 1703–1730 CrossRef CAS.
- D. Shi, R. Zheng, C.-S. Liu, D.-M. Chen, J. Zhao and M. Du, Inorg. Chem., 2019, 58, 7229–7235 CrossRef CAS PubMed.
- G. Férey, C. Mellot-Draznieks, C. Serre, F. Millange, J. Dutour, S. Surblé and I. Margiolaki, Science, 2005, 309, 2040–2042 CrossRef PubMed.
- W. Salomon, F.-J. Yazigi, C. Roch-Marchal, P. Mialane, P. Horcajada, C. Serre, M. Haouas, F. Taulelle and A. Dolbecq, Dalton Trans., 2014, 43, 12698–12705 RSC.
- H. Wan, C. Chen, Z. Wu, Y. Que, Y. Feng, W. Wang, L. Wang, G. Guan and X. Liu, ChemCatChem, 2015, 7, 441–449 CrossRef CAS.
- Q. Y. Li, L. Zhang, Y. X. Xu, Q. Li, H. Xue and H. Pang, ACS Sustainable Chem. Eng., 2019, 7, 5027–5033 CrossRef CAS.
- L. E. Lange and S. K. Obendorf, ACS Appl. Mater. Interfaces, 2015, 7, 3974–3980 CrossRef CAS PubMed.
- Y. Dong, J. Zhang, Y. Yang, L. Qiu, D. Xia, K. Lin, J. Wang, X. Fan and R. Fan, Angew. Chem., Int. Ed., 2019, 58, 17610–17615 CrossRef CAS PubMed.
- M. Wei, X. Wang and X. Duan, Chem.–Eur. J., 2013, 19, 1607–1616 CrossRef CAS PubMed.
- H. Yang, J. Li, H. Zhang, Y. Lv and S. Gao, Microporous Mesoporous Mater., 2014, 195, 87–91 CrossRef CAS.
- S. Li, L. Zhang, K. P. O'Halloran, H. Ma and H. Pang, Dalton Trans., 2015, 44, 2062–2065 RSC.
- G. Paille, M. Gomez-Mingot, C. Roch-Marchal, M. Haouas, Y. Benseghir, T. Pino, M.-H. Ha-Thi, G. Landrot, P. Mialane and M. Fontecave, ACS Appl. Mater. Interfaces, 2019, 11, 47837–47845 CrossRef CAS PubMed.
- K. S. Novoselov, A. K. Geim, S. V. Morozov, D.-e. Jiang, Y. Zhang, S. V. Dubonos, I. V. Grigorieva and A. A. Firsov, Science, 2004, 306, 666–669 CrossRef CAS PubMed.
- V. Dhinakaran, M. Lavanya, K. Vigneswari, M. Ravichandran and M. Vijayakumar, Mater. Today: Proc., 2020, 27, 824–828 CAS.
- A. K. Geim, science, 2009, 324, 1530–1534 CrossRef CAS PubMed.
- Y. Kim and S. Shanmugam, ACS Appl. Mater. Interfaces, 2013, 5, 12197–12204 CrossRef CAS PubMed.
- N. Mizuno and M. Misono, Chem. Rev., 1998, 98, 199–218 CrossRef CAS PubMed.
- D. M. Fernandes, M. P. Araujo, A. Haider, A. S. Mougharbel, A. J. Fernandes, U. Kortz and C. Freire, ChemElectroChem, 2018, 5, 273–283 CrossRef CAS.
- J. Qin, F. Zhou, H. Xiao, R. Ren and Z.-S. Wu, Sci. China Mater., 2018, 61, 233–242 CrossRef CAS.
- H. Asadollahi-yazdi, M. Shariati, A. Imam and M. Ghatee, J. Compos. Mater., 2017, 51, 3053–3064 CrossRef CAS.
- B. Suma, P. S. Adarakatti, S. K. Kempahanumakkagari and P. Malingappa, Mater. Chem. Phys., 2019, 229, 269–278 CrossRef CAS.
- S.-K. Hwang, S. J. Patil, N. R. Chodankar, Y. S. Huh and Y.-K. Han, Chem. Eng. J., 2022, 427, 131854 CrossRef CAS.
- H. Li, S. Pang, S. Wu, X. Feng, K. Müllen and C. Bubeck, J. Am. Chem. Soc., 2011, 133, 9423–9429 CrossRef CAS PubMed.
- J. Chen, S. Liu, W. Feng, G. Zhang and F. Yang, Phys. Chem. Chem. Phys., 2013, 15, 5664–5669 RSC.
- D. Zhou and B. H. Han, Adv. Funct. Mater., 2010, 20, 2717–2722 CrossRef CAS.
- W. Guo, X. Tong and S. Liu, Electrochim. Acta, 2015, 173, 540–550 CrossRef CAS.
- L. Chen, Y. Tang, K. Wang, C. Liu and S. Luo, Electrochem. Commun., 2011, 13, 133–137 CrossRef CAS.
- Y. Mai, M. Zhou, H. Ling, F. Chen, W. Lian and X. Jie, Appl. Surf. Sci., 2018, 433, 232–239 CrossRef CAS.
- M. Mirzaee, C. Dehghanian and K. S. Bokati, J. Electroanal. Chem., 2018, 813, 152–162 CrossRef CAS.
- T. Wei, M. Zhang, P. Wu, Y.-J. Tang, S.-L. Li, F.-C. Shen, X.-L. Wang, X.-P. Zhou and Y.-Q. Lan, Nano Energy, 2017, 34, 205–214 CrossRef CAS.
- W. Zhang, G. Jia, Z. Li, C. Yuan, Y. Bai and D. Fu, Adv. Mater. Interfaces, 2017, 4, 1601241 CrossRef.
- K. Gopalakrishnan, S. Sultan, A. Govindaraj and C. Rao, Nano Energy, 2015, 12, 52–58 CrossRef CAS.
- D. Zhang, Y. Zhang, Y. Luo, Y. Zhang, X. Li, X. Yu, H. Ding, P. K. Chu and L. Sun, Nano Res., 2018, 11, 1651–1663 CrossRef CAS.
- R. Ding, J. Zhang, J. Qi, Z. Li, C. Wang and M. Chen, ACS Appl. Mater. Interfaces, 2018, 10, 13470–13478 CrossRef CAS PubMed.
- K. Bindumadhavan, P.-Y. Chang and R.-a. Doong, Electrochim. Acta, 2017, 243, 282–290 CrossRef CAS.
- S. Bag, B. Mondal, A. K. Das and C. R. Raj, Electrochim. Acta, 2015, 163, 16–23 CrossRef CAS.
- Z.-J. Lu, S.-J. Bao, Y.-T. Gou, C.-J. Cai, C.-C. Ji, M.-W. Xu, J. Song and R. Wang, RSC Adv., 2013, 3, 3990–3995 RSC.
- Z. Wang, P. Li, Y. Chen, J. He, J. Liu, W. Zhang and Y. Li, J. Power Sources, 2014, 263, 246–251 CrossRef CAS.
- L.-s. Cui, X.-m. Meng, Y.-g. Li, K.-r. Huang, Y.-c. Li, J.-q. Long and P.-f. Yao, CrystEngComm, 2019, 21, 3798–3809 RSC.
- M. Barsukova, D. Samsonenko, T. Goncharova, A. Potapov, S. Sapchenko, D. Dybtsev and V. Fedin, Russ. Chem. Bull., 2016, 65, 2914–2919 CrossRef CAS.
- D. C. Marcano, D. V. Kosynkin, J. M. Berlin, A. Sinitskii, Z. Sun, A. Slesarev, L. B. Alemany, W. Lu and J. M. Tour, ACS Nano, 2010, 4, 4806–4814 CrossRef CAS PubMed.
- S. Bykkam, K. Rao, C. Chakra and T. Thunugunta, Int. J. Adv. Biotechnol. Res., 2013, 4, 142–146 Search PubMed.
- N. Raghavan, S. Thangavel and G. Venugopal, Mater. Sci. Semicond. Process., 2015, 30, 321–329 CrossRef CAS.
- D. Jana, H. K. Kolli, S. Sabnam and S. K. Das, Chem. Commun., 2021, 57, 9910–9913 RSC.
- R. Hashemniaye-Torshizi, N. Ashraf, M. H. Arbab-Zavar and S. Dianat, Catal. Sci. Technol., 2021, 11, 1098–1109 RSC.
- S. Dianat, A. Hatefi-Mehrjardi and K. Mahmoodzadeh, New J. Chem., 2019, 43, 1388–1397 RSC.
- D. Zhu, H. Ma, Q. Zhen, J. Xin, L. Tan, C. Zhang, X. Wang and B. Xiao, Appl. Surf. Sci., 2020, 526, 146721 CrossRef CAS.
| This journal is © The Royal Society of Chemistry 2022 |

