
 Open Access Article
 This Open Access Article is licensed under a Creative Commons Attribution-Non Commercial 3.0 Unported Licence
Synthesis, optical and ionic conductivity studies of a lithium cobalt germanate compound
Sourour Ben Yahya *a,
Regis Barilléb and
Bassem Louatia
*a,
Regis Barilléb and
Bassem Louatia
aLaboratory of Spectroscopic Characterisation and Optics of Materials, Faculty of Sciences, University of Sfax, B. P. 1171, 3000 Sfax, Tunisia. E-mail: sourourbenyahia09@gmail.com
bUniv Angers, CNRS, MOLTECH-ANJOU, SFR MATRIX, F-49000 Angers, France
First published on 25th February 2022
Abstract
A lithium cobalt germanate compound (Li2CoGeO4) was synthesized and studied. The X-ray powder diffraction pattern demonstrated a monoclinic crystal system with the Pn space group. The morphology and composition were done by scanning transmission electron microscopy and energy dispersive X-ray spectroscopy (SEM-EDS). A vibrational study confirmed the existence of the anion (GeO4)4− and its vibrations. The estimated value of the direct band gap (Eg) was evaluated at 3.45 eV. The measurements of the electrical properties were performed in the frequency interval from 100 Hz to 1 MHz and the temperature range from 553 K to 663 K. The Nyquist plots revealed the existence of a single semicircle in all impedance spectra due to the grain interior effect. The AC electrical conduction in Li2CoGeO4 has been explained through several processes, which can be coupled with two different formalisms. The complex electric modulus studies M*(ω) confirmed that the relaxation process is thermally activated.
1. Introduction
Germanium-based ceramic materials with the A2MGeO4 (A = K, Li, Na, Cs, Rb, … and M = Zn, Co, Mg, Mn, …) chemical formula have obtained growing attention, principally due to their interesting physical applications such as magnetic, catalytic, solid electrolytic properties for batteries, optics and photocatalysts.1–5 A lot of research has been done on orthogermanate compounds with the formula A2MGeO4 (A = Li, Na and M = Zn, Co, Fe, Mn) and confirmed that this material is a potential cathode due to its high conductivity,4 taking into account that the ionic conductivity is highly related to the structural rearrangement. The conductivity of this type of compound has been studied since the 1960s with different lithium and sodium environments, revealing that these materials can offer an almost perfect conductivity.6 The LISICON compound, Li3.5Zn0.25GeO4, presented an ionic conductivity higher than 10−1 S cm−1 at 673 K.7 Moreover, the Ag2ZnGeO4 compound is an electronic semiconductor with σ (60°) = 1 × 10⁻² (Ω cm)−1.8 S. Ben Yahya and B. Louati have studied the electric properties of A2ZnGeO4 (A = Li and K) compounds.9,10 They have determined the electrical conductivity of these materials and estimated them: 10−3 (Ω m)−1 and 10−5 (Ω m)−1 for K2ZnGeO4 and Li2ZnGeO4 respectively. In this work Li2CoGeO4 (LCG) is studied. This material belongs to the same family of Li2CoSiO4 (LCS) with a structure derived from Li3PO4. Recently, the crystal structure, synthesis, and electrochemical properties of Li2CoSiO4 were widely examined for lithium ion battery applications.11–14 The goal of this work is to study the structure of Li2CoGeO4 synthetized by a traditional high temperature solid state method, in order to determine microstructure morphologies, crystal chemical characteristics and optical properties. In order to better understand the electric properties as electron and hole transport properties in this solid electrolyte compound, infrared analysis, X-ray diffraction and impedance spectroscopy were used for Li2CoGeO4 cathode materials in future lithium-ion batteries.2. Experimental
2.1. Synthesis
The Li2CoGeO4 (LCG) material was prepared by a traditional high temperature solid state method and consists of heating several solids which react to form the required product. The mixed lithium cobalt germanate (Li2CoGeO4) was synthesized in a powder state from starting materials (Li2CO3, Co3O4 and GeO2) with a high purity (Sigma-Aldrich, 99%) by heating stoichiometric quantities of the starting materials according to the following reaction:
 | (1) |
The homogeneity of the beginning materials was finalized in the agate mortar and progressively dried up to 673 K for 15 h to avoid ambient humidity and gases, particularly CO2 evaporation. The obtained black powder was ground again for 8 h and pressed into 8 mm pellets in diameter and 1 mm in thick using a 3 ton per cm2 uniaxial pressure and sintered at 1123 K for 15 h to make the blue (LCG) compound.
2.2. Apparatus
The X-ray powder diffraction (XRD) pattern of prepared ceramic samples was done at room temperature using a monochromatic Cu-Kα radiation (λkα = 1.5406 Å) in a wide range of Bragg angles from 10° to 60°. The crystal structure refinement was performed by the Rietveld analysis15 of the X-ray powder diffraction documents via the FULLPROF software.16 The morphology was investigated by EVO LS10 (Zeiss) scanning electron microscopy equipped with 0 energy-dispersive system: INCA-X (Oxford Instruments). The IR spectroscopic analysis was realized with an “FT-IR PerkinElmer” spectrometer in a wide range of wavenumber from 400 cm−1 to 1400 cm−1. The optical properties of the Li2CoGeO4 were measured at room temperature using a UV-3101PC scanning spectrophotometer in a broad range of wavelengths from 200 nm to 800 nm. The electrical measurements of this material in a pellet form are thoroughly analyzed and studied in the frequency range between 40 Hz and 1 MHz and in a temperature range between 553 K and 663 K using a complex impedance analysis. The measurements are comprehensively discussed based on a number of theoretical models.3. Results and discussion
3.1. X-ray diffractions analysis
The solid-state LCG is studied by powder X-ray diffraction for the analysis of the crystal structure. The Fig. 1 shows the experimental and calculated XRD profile of Li2CoGeO4 compounds. The Rietveld refinement of LCG samples was done to collect the detailed crystal structure information with the unique crystallographic data of LCG as the first model. It is clear that no secondary phase and no impurity peak was detected which confirms the pure and good quality of the sample. The crystal structure of Li2ZnGeO4 is taken as an initial model and the starting positions of all atoms were first considered by analogy to the structure of this compound. A refinement is then done which converged swiftly to reasonable and reliable factors. The best refinement of the experimental profile is carried out by the monoclinic system with the Pn space group. The quality factor confirms the concurrence between the calculated and the observed profiles is χ2 = 1.79. The refined lattice parameters are a = 6.369(2) Å, b = 5.461(2) Å, c = 5.006(1) Å, β(°) = 90.10(0) and V = 174.113(1) Å3. They are in good agreement with the results of a LCG compound synthesized by the hydrothermal method. The Table 1 summarizes the refined crystallographic parameters of the Li2CoGeO4 compound. The atomic positions are listed in the Table 2 whereas the distances and bond angles are given in Table 3.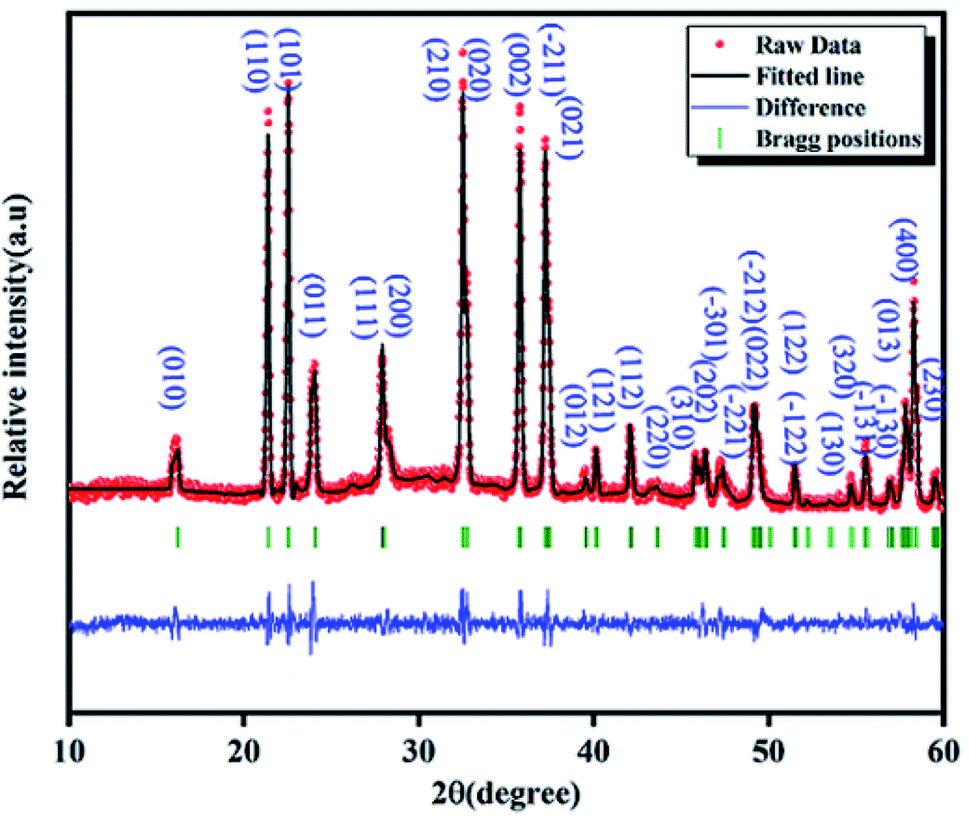 | ||
| Fig. 1 Refined powder X-ray diffraction pattern for solide-state LCG, at room temperature: calculated data (black solid line), observed data (red)and the Bragg positions are observable by vertical bar. | ||
| Formula | Li2CoGeO4 |
| Crystal system | Monoclinic |
| Space group | Pn |
| Unit lattice parameters (Å) | a = 6.369(2) |
| b = 5.461(2) | |
| c = 5.006(1) | |
| β(°) = 90.10(0) | |
| Unit cell volume (Å3) | V = 174.113(1) |
| Z | 2 |
| Rp (%) | 19.9 |
| Rwp (%) | 16.9 |
| Rexp (%) | 12.61 |
| RB (%) | 3.31 |
| RF (%) | 2.89 |
| χ2 | 1.79 |
| ρ (g cm−3) | 3.99 |
| Atom | Wyck | x | y | z | Occ |
|---|---|---|---|---|---|
| Co | 2a | 0.31648 | 0.32427 | 0.50740 | 1 |
| Ge | 2a | 0.06116 | 0.15955 | 0.00645 | 1 |
| Li(1) | 2a | 0.52714 | 0.19827 | 0.00513 | 1 |
| Li(2) | 2a | 0.82442 | 0.36037 | 0.48347 | 1 |
| O(1) | 2a | 0.54090 | 0.16070 | 0.36206 | 1 |
| O(2) | 2a | 0.33185 | 0.66021 | 0.43302 | 1 |
| O(3) | 2a | 1.07739 | 0.17905 | 0.36900 | 1 |
| O(4) | 2a | 0.30757 | 0.32104 | 0.88830 | 1 |
| Bond | Distance (Å) | Bond | Distance (Å) |
|---|---|---|---|
| Li(1)–O(1) | 1.80 | Co–O(1) | 1.87 |
| Li(1)–O(2) | 2.12 | Co–O(2) | 1.83 |
| Li(1)–O(3) | 2.19 | Co–O(3) | 1.85 |
| Li(1)–O(4) | 1.66 | Co–O(4) | 1.91 |
| <m> | 1.94 | <m> | 1.86 |
| Li(2)–O(1) | 2.19 | Ge–O(1) | 1.89 |
| Li(2)–O(2) | 2.25 | Ge–O(2) | 1.80 |
| Li(2)–O(3) | 1.97 | Ge–O(3) | 1.82 |
| Li(2)–O(4) | 1.80 | Ge–O(4) | 1.89 |
| <m> | 2.05 | <m> | 1.85 |
| Bond | Angle (°) | Bond | Angle (°) |
|---|---|---|---|
| O(1)–Co–O(3) | 106.46 | O(2)–Ge–O(3) | 102.51 |
| O(1)–Co–O(2) | 110.86 | O(2)–Ge–O(4) | 110.72 |
| O(1)–Co–O(4) | 114.59 | O(2)–Ge–O(1) | 111.83 |
| O(3)–Co–O(2) | 112.84 | O(3)–Ge–O(4) | 103.80 |
| O(3)–Co–O(4) | 110.16 | O(3)–Ge–O(1) | 115.96 |
| O(2)–Co–O(4) | 102.09 | O(4)–Ge–O(1) | 111.44 |
| <O–Co–O> | 109.50 | <O–Ge–O> | 109.37 |
3.2. Description of crystal structure
Li2BGeO4 (B = Zn, Mn, Co) is categorized among the C-type compounds. It crystallized in the three-dimensional (3D) frameworks of the CoO4 and GeO4 tetrahedral units. The powder structure of Li2CoGeO4 indicates that it is isostructural like the Li2ZnGeO4 structure.9 The framework structure of Li2CoGeO4 host can be considered as a Wurtzite structure with corner-sharing alternating between the corners of the GeO4 and ZnO4 tetrahedra. In general, the orthogermanates are characterized by tetrahedral anion units, in particular (GeO4)4, covalently connected to the BO4 polyhedra.17 The Pn-Li2CoGeO4 structure can be viewed as an accumulation of infinite zig–zag elements alternating (CoO4)4− and (GeO4)4− in the (a, b) plan. These tetrahedra built up a network with channels along the c axis in which the Li+ ions have conducting pathways as showed in the Fig. 2. In the repetitive structure moiety, the CoO4 and GeO4 tetrahedra pointed into (100), whereas the other moiety pointed into the inverse direction (−100) in an alternate way and were connected only by sharing corners. The process was generated by the parallel movement of Li+-ions along the c axis. It consists of binary chains of distorted (CoO4)4− tetrahedra that were alongside-propagated in the (a, b) plan and interlinked partially by corner-sharing. Each (GeO4)4 group was thus encircled by four (CoO4)4 tetrahedra and inversely, eventually forming cavities. The average values of the bond lengths of Co–O and Ge–O in the (CoO4)4 and (GeO4)4 tetrahedra are 1.86 Å and 1.85 Å respectively and are presented in the Table 3. It is very significant to point out that Li (1) and Li (2) were confined in two opposite direction cavities (T1 and T2) (Fig. 2). This result would have an important influence on the migration process of Li+-ions.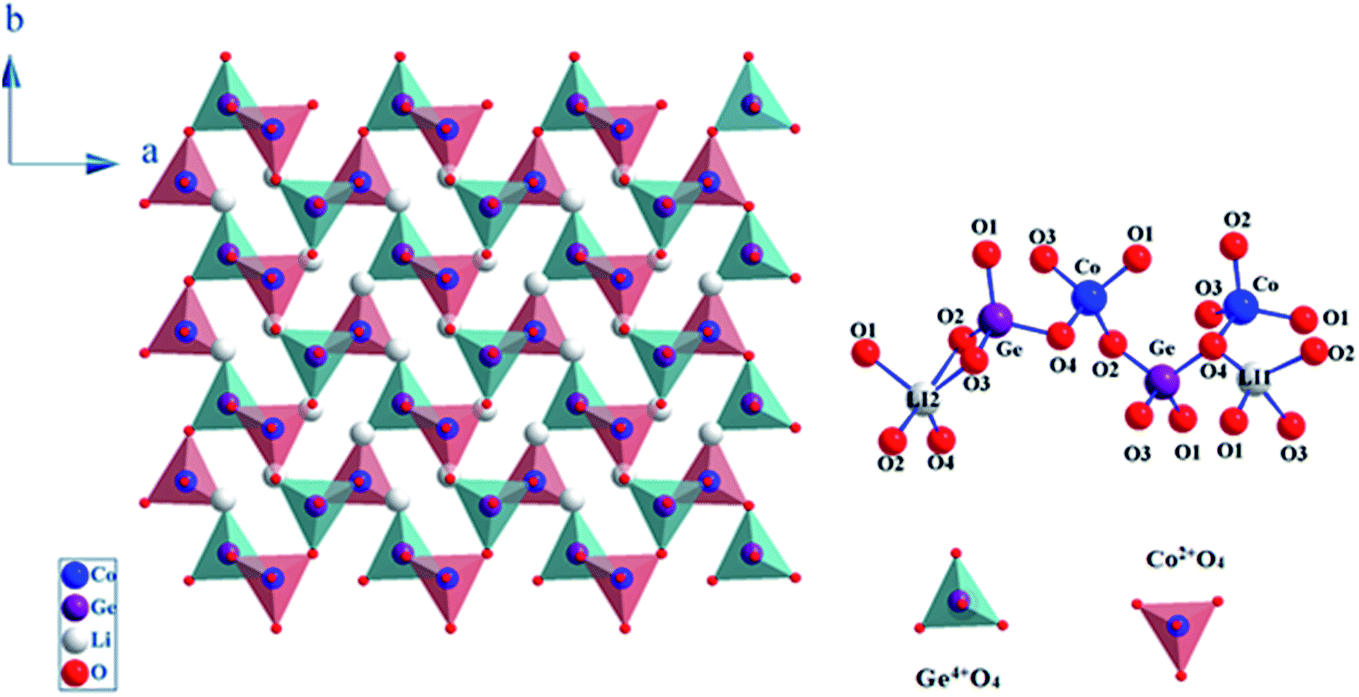 | ||
| Fig. 2 Li2CoGeO4 structures as a ‘Wurtzite’ with corner sharing CoO4 tetrahedra linked via GeO4 tetrahedra. | ||
3.3. Morphological description and particle size distribution studied by SEM and TEM imaging
The SEM and EDX technique were used in order to study the composition and the morphology of our sample.18 These supplementary studies make it feasible to differentiate the elements presents in the studied compound by detecting backscattered electrons. Based on the Fig. 3(a), it is clear that this micrograph show a collection of small and large-sized grains homogeneously distributed everywhere into the compound. Furthermore, there is a tendency to shape some types of agglomeration, due to the humidity caused by lithium attendance. In fact, as shown in the Fig. 3(b), the EDX spectrum reveals the presence of different elements, oxygen, cobalt and germanium. It is interesting to observe that lithium is not present in the Fig. 3(b) since it has the same atomic number than the element used as a reference for this compound which is beryllium. In order to further estimate the particle size distribution, the transmission electron microscopy (TEM) analysis was performed and the result is represented in the Fig. 3(c). By using the Image J software a manual statistical count of grain size was affected on TEM images. The results are shown as histograms in the Fig. 3(d) as counts (grain number) versus particle sizes. The figure shows that the gained particles sizes are mostly in the order of 0.4–0.9 μm.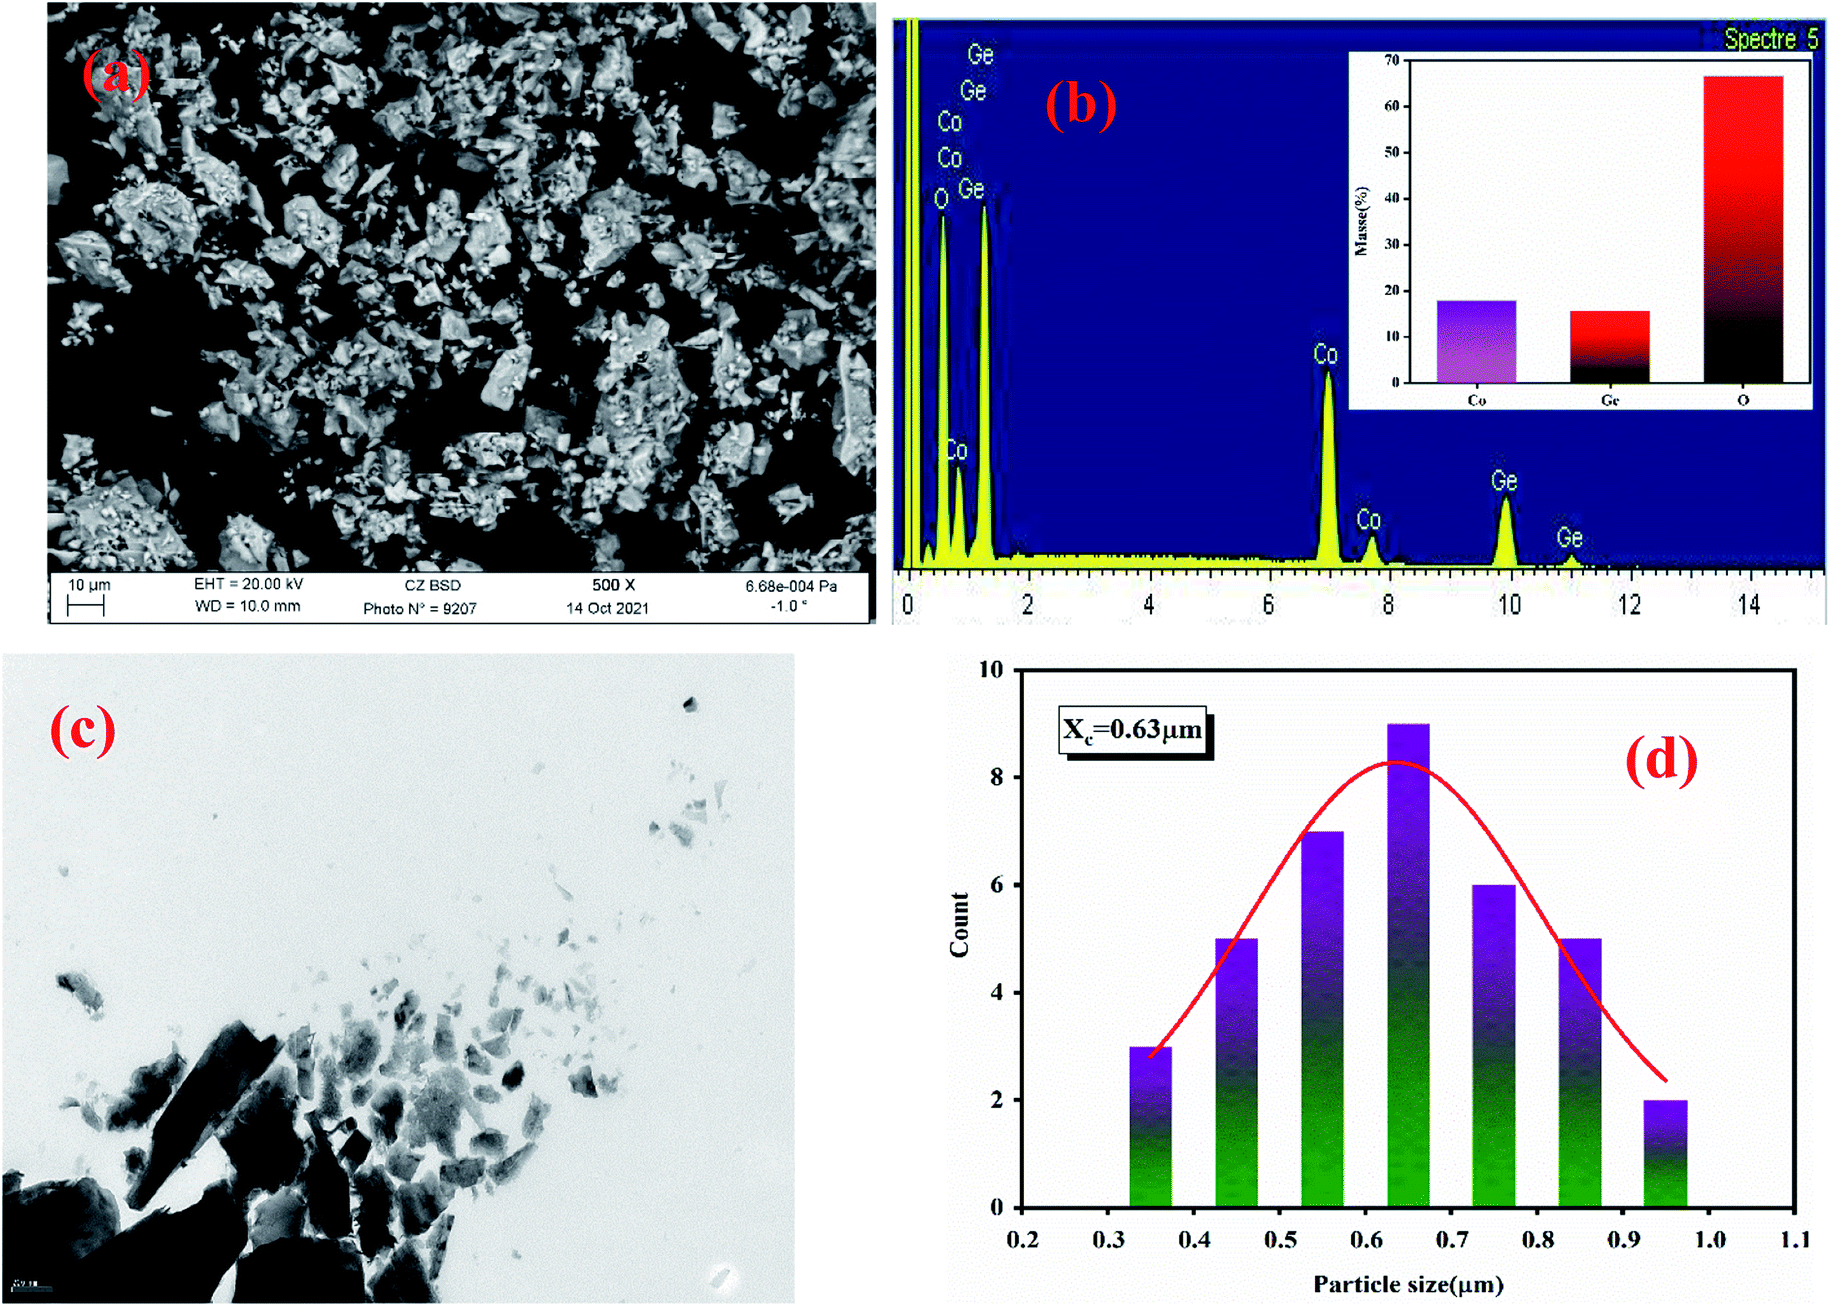 | ||
| Fig. 3 SEM image of LCG (a), the elemental analysis by EDX (b), TEM image of LCG (c) and the particle size distribution of LCG (d). | ||
3.4. Infrared spectra
The Fig. 4 shows the FTIR spectrum of the Li2CoGeO4 compound acquired at room temperature and in the wavenumber range from 400 cm−1 to 4000 cm−1. Based on spectra of comparable compounds, a detailed attribution of the bands is able to be performed.19–21 The band is centered at 439 cm−1 and corresponds to the asymmetric binding frequencies of GeO4. The remaining characteristic bands higher than 600 cm−1 are relative to the antisymmetric stretching GeO4.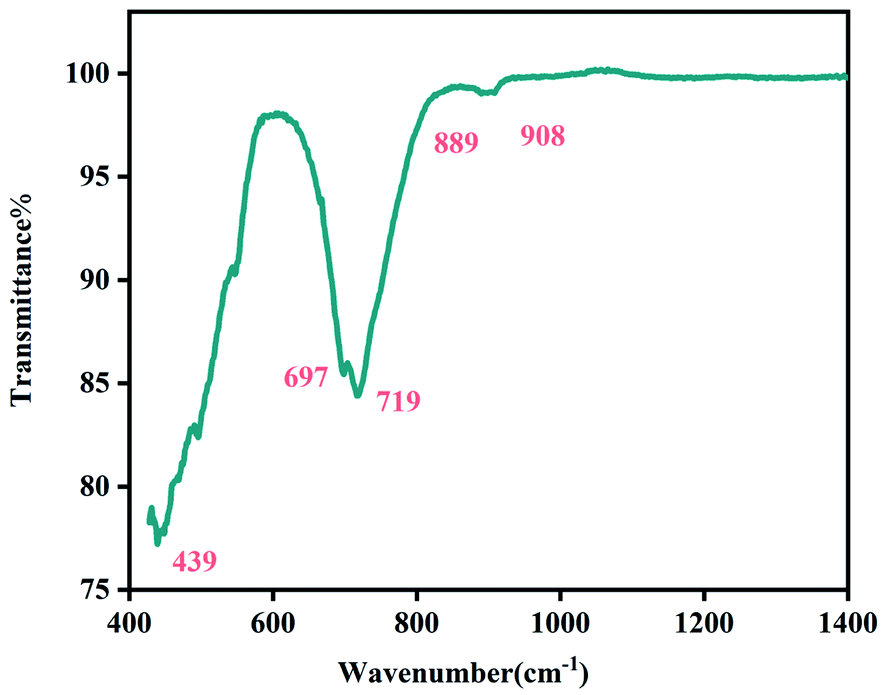 | ||
| Fig. 4 FTIR spectrum of Li2CoGeO4 at room temperature. | ||
3.5. Optical properties
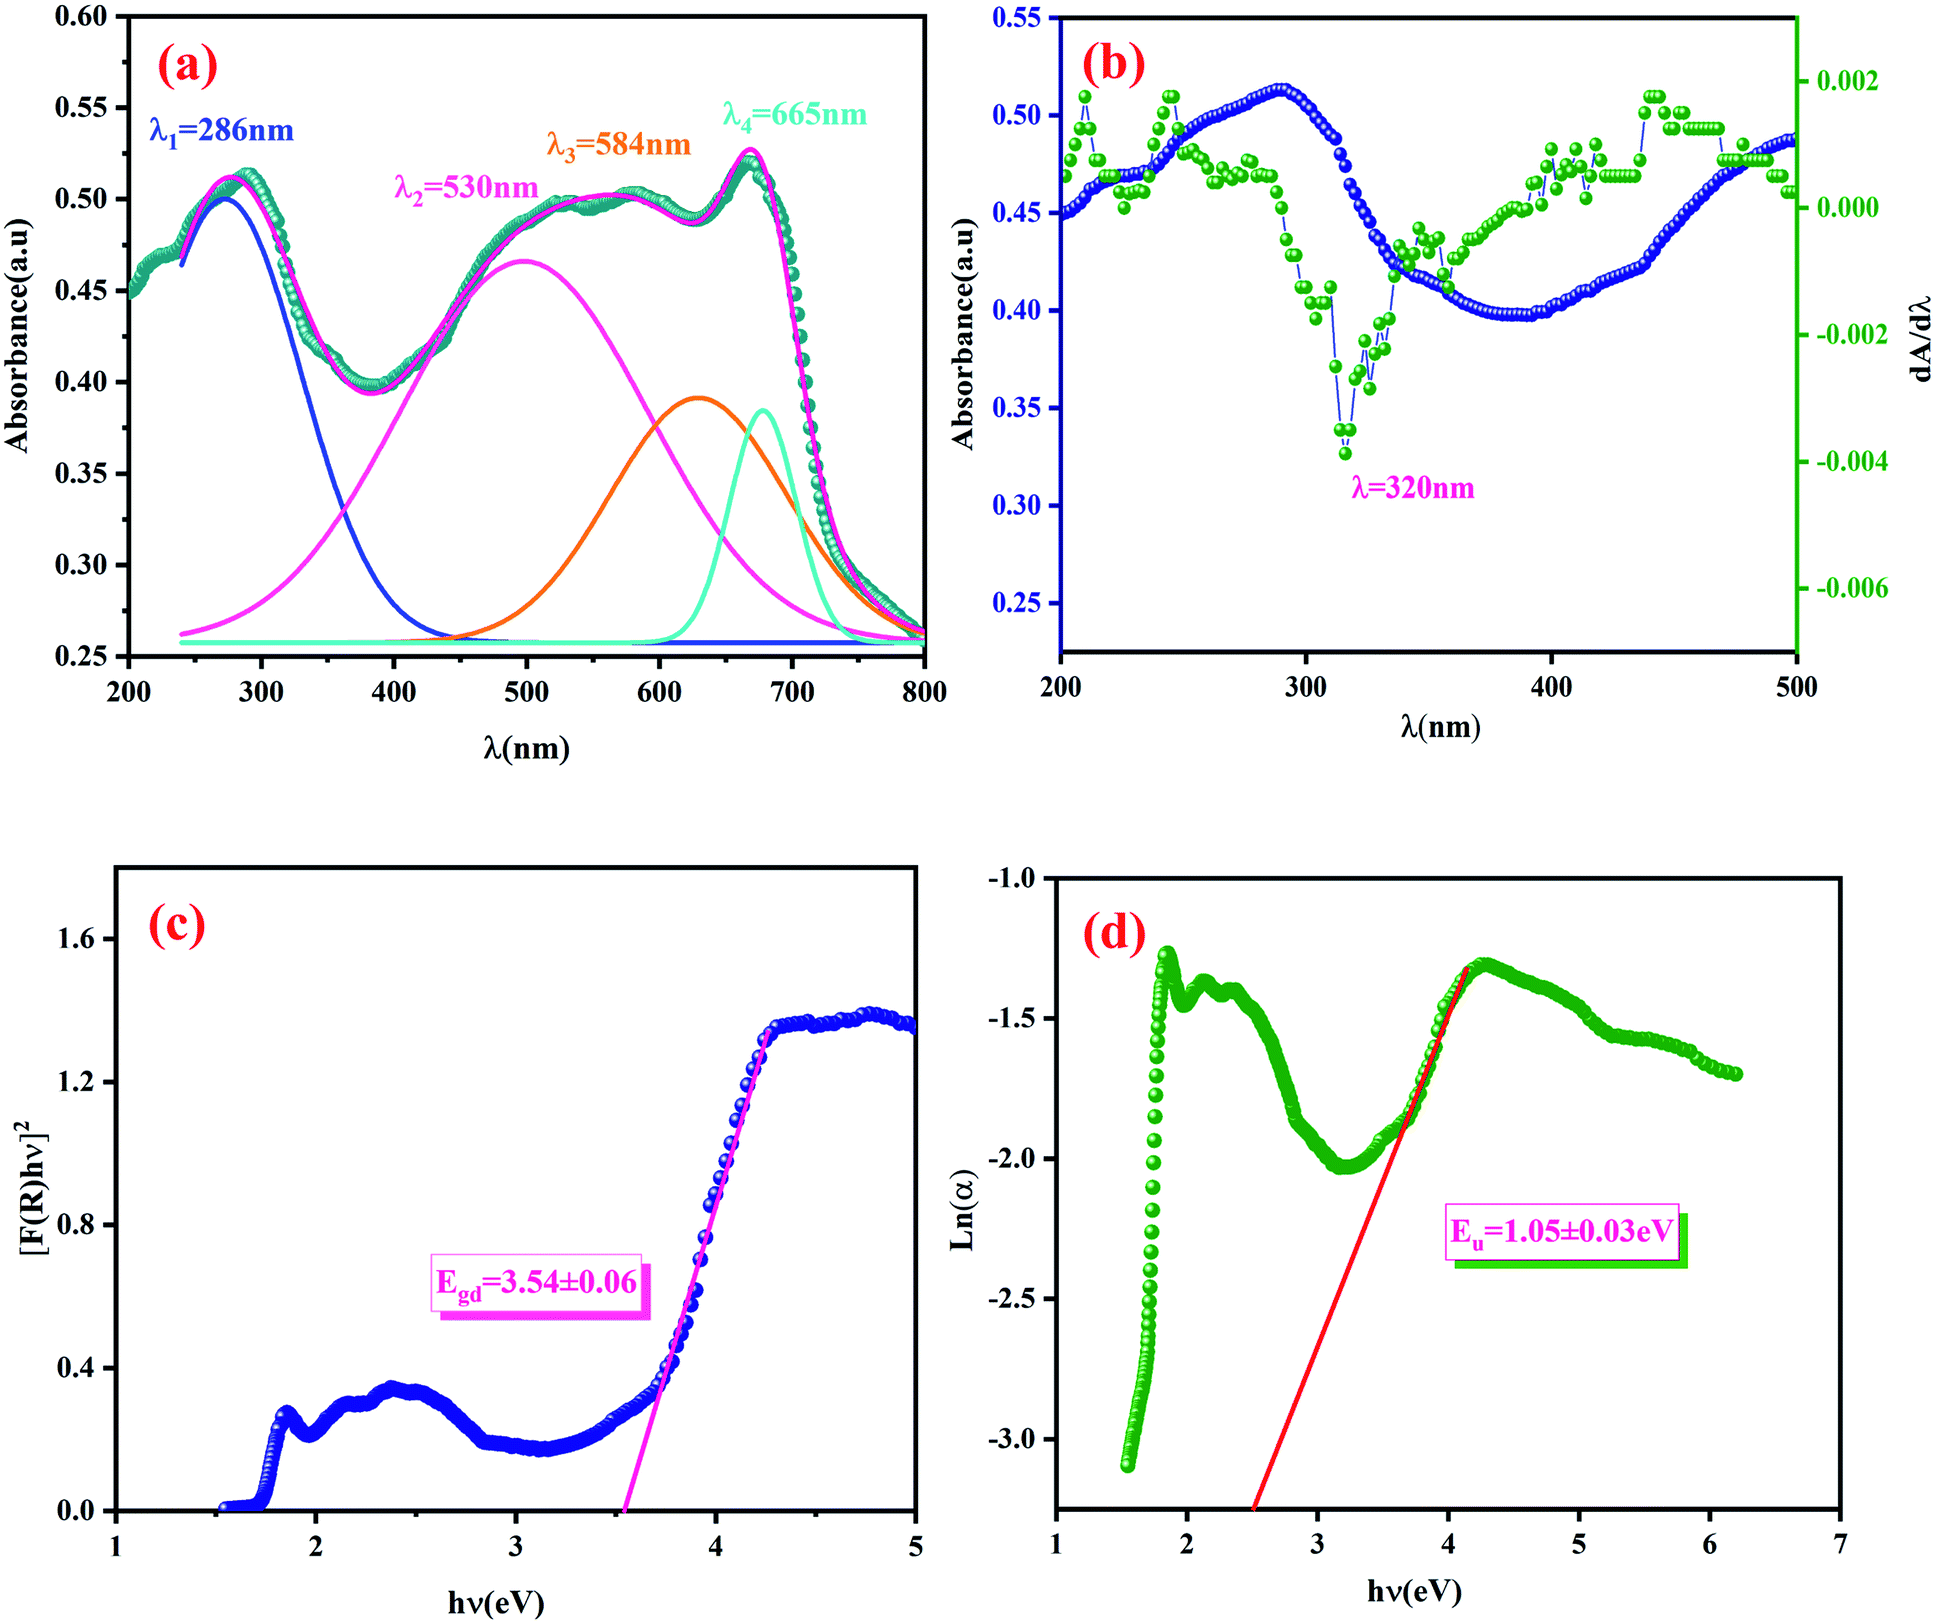 | ||
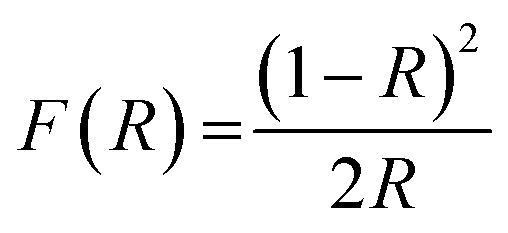
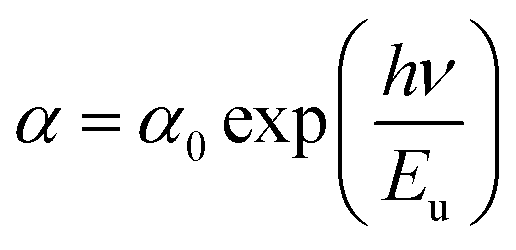
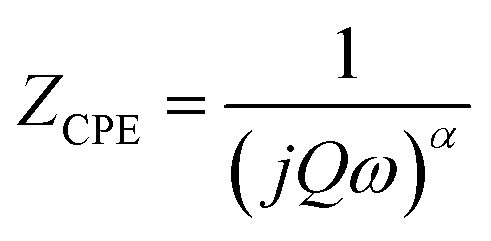
| Fig. 5 Absorbance spectra of LCG measured at room temperature (a), evolution of dA/dλ and the absorbance A as a function of λ (b), plot of (F(R)hν)2 versus (hν) of LCG compound (c) and determination of the Urbach energy for the LCG compound (d). | ||
 | (2) |
The dependence of (F(R)hν)2 on the photon energy for the LCG compound is displayed in the Fig. 5(c). The straight-line extrapolation of these plots to the zero absorption spectrum gives the band gap energy Eg = 3.54 ± 0.06 eV. Based on studies of comparable compounds,26 we can note that our compound has a lower gap energy value (3.54 eV).
 | (3) |
3.6. Complex impedance analysis
 | (4) |
 | (5) |
 | (6) |
 | ||
| Fig. 6 The Nyquist plots for LCG at various temperatures. | ||
The Fig. 7(a) displays the frequency dependence of the real part of the impedance (Z′) at different temperatures. The plots are described by an amplitude of Z′ that decreases when the temperature and the frequency increase. This result leads to the possibility of a rise in the ac conductivity as a consequence of the diminution in the resistive behaviour of the material with an increase of the temperature.32 Besides, all values of Z′ merge at higher frequencies. This behaviour is an indication of the build-up of space charge polarization effect in the material at higher temperatures.33,34 Furthermore, the Fig. 7(b) exhibits the frequency dependence of imaginary part of the impedance (−Z′′) at various temperatures. We can note that the impedance plots are described by the existence of peaks  at a particular frequency, which shift to higher frequencies with the rising temperature can be related to the type and intensity of the electrical relaxation phenomenon in the system. A important broadening of the peaks with an increase of temperatures suggests the existence of a temperature-reliant relaxation process in the system. The asymmetric widening of the peaks suggests the existence of electrical processes in the system which enlarges the relaxation time (marked by peak breadth) with two equilibrium portions. The relaxation types may probably be electrons/immobile species at low temperatures and defects at higher temperature.35 Finally, at higher frequencies, Z′′ reach a plateau for all temperatures, which may probably indicate an accumulation of space charges in the system.36 In the following figures (Fig. 7(a) and (b)) we point out a good agreement between the experimental curve (scatter) and theoretical (line) data. This result shows that the proposed equivalent circuit characterises the behaviour of the studied sample.
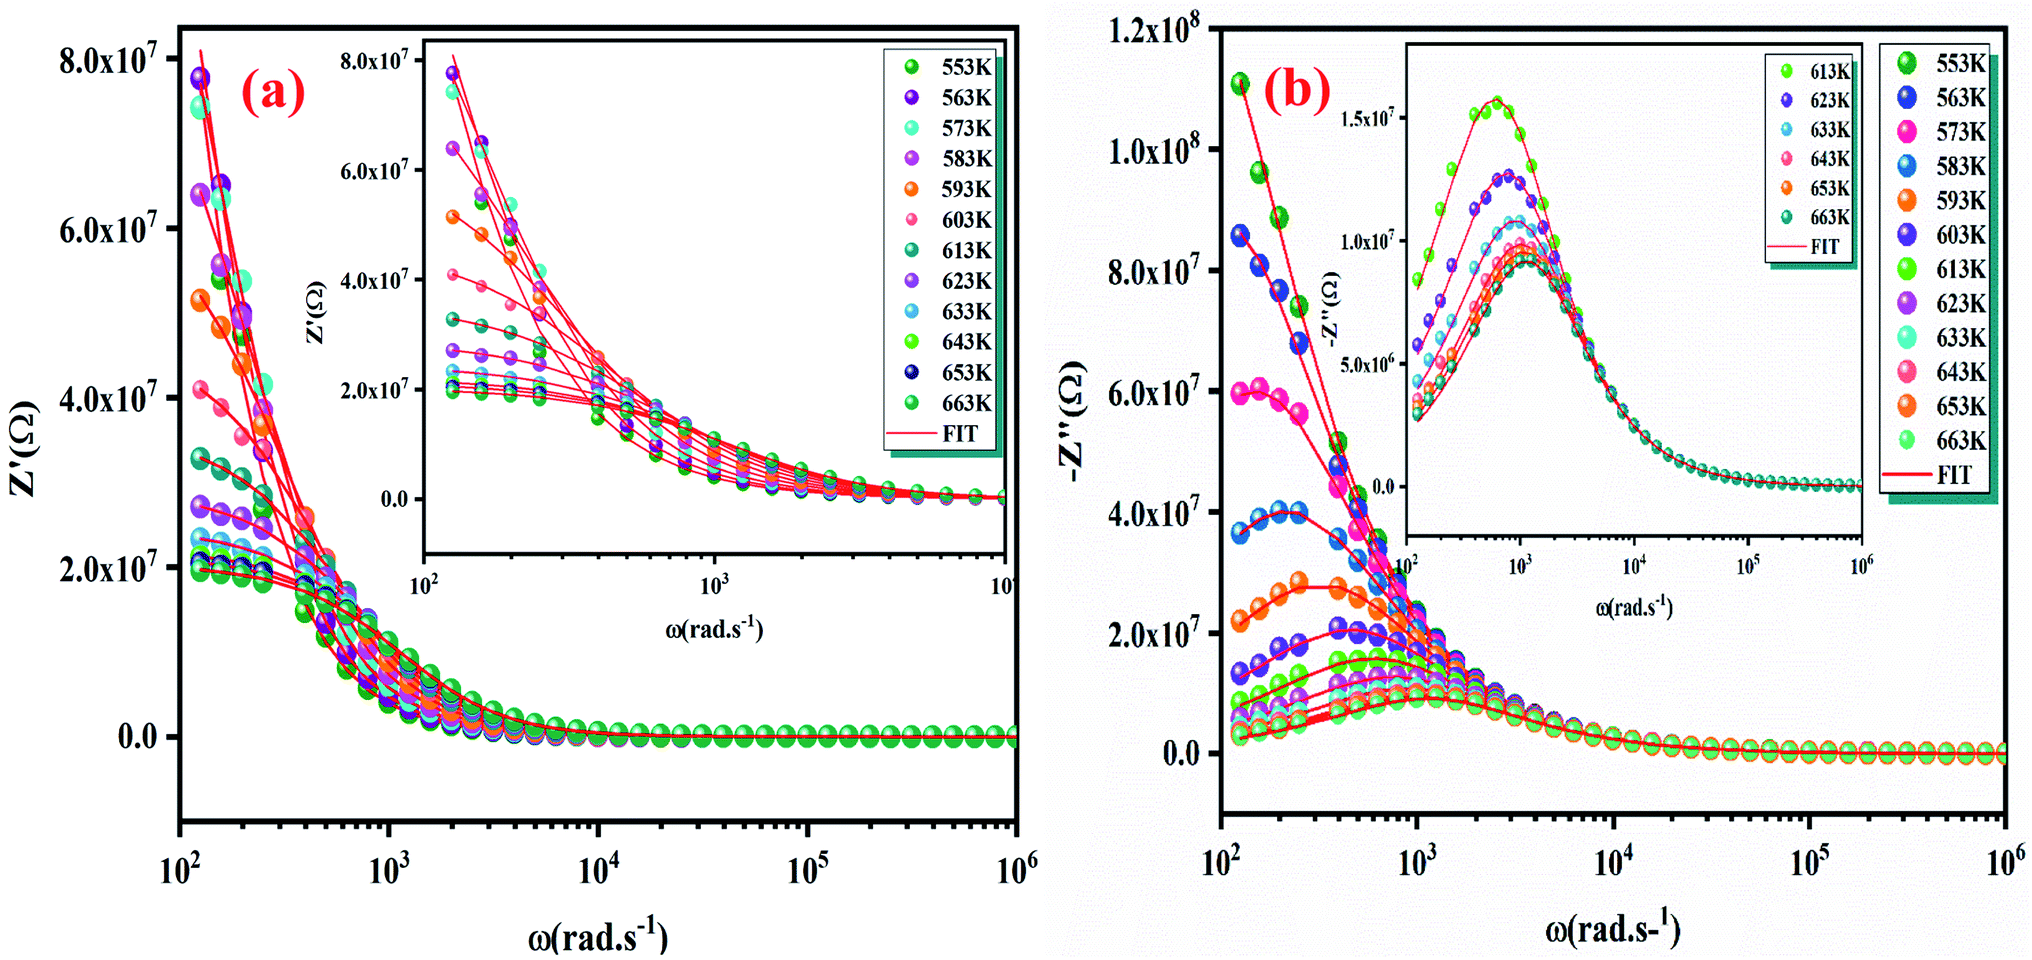 | ||
| Fig. 7 Frequency dependence at different temperatures of real part Z′ (a) and imaginary part Z′′ (b) at various temperatures of Li2CoGeO4 compound. | ||
 | (7) |
 | (8) |
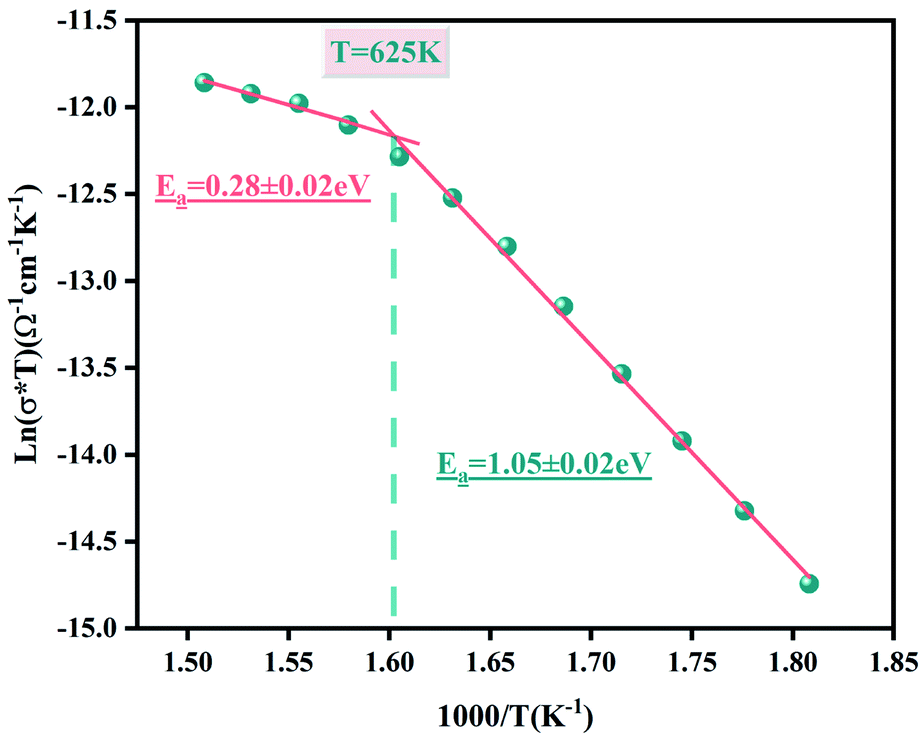 | ||
| Fig. 8 Arrhenius relation of Ln (σdcT) versus 1000/T for the Li2CoGeO4 compound. | ||
| σac = σdc + Aωs | (9) |
 | ||
| Fig. 9 The variation of the AC conductivity with the temperature as well as the frequency and the inset of the temperature dependence of the exponent s. | ||
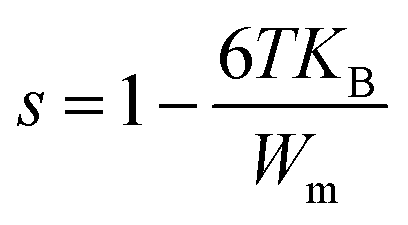
- The correlated barrier hopping (CBH) model in which S decreases linearly with the rising temperature.40,41
- The small polaron tunneling (NSPT) model whither the exponent s rises with the increasing temperature.42
- The quantum mechanical tunneling (QMT) model is characterized by an exponent s which increases very slowly with temperature, practically equal to a value of 0.8.43
- The overlapping large polaron tunneling (OLPT) model submitted by Long.44 The exponent s decreases with the temperatures to a minimum value and then increases slightly.
The Fig. 9 (inset) presents the temperature dependence of the exponent s. We can note that the exponent s exhibits two different regions as following:
- Part I, the exponent s decreases linearly with the temperature, which confirms that the (CBH) model is the suitable model.
- Part II, the exponent s increases with the increase in temperature to a minimum value and then increase with the temperature. Thus, the (NSPT) model is the appropriate model.
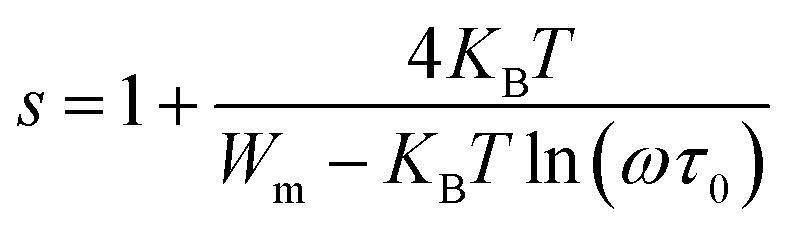
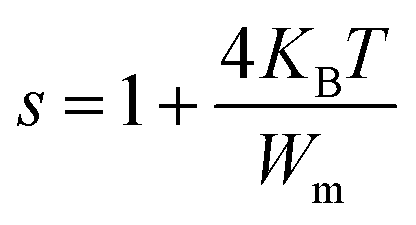
3.6.4.1 The correlated barrier hopping (CBH) model (region I). This model was first enhanced by Pike for the single polaron jump and was thereafter developed by Eliott for the two-polaron jump.45 Which considers the jump of Li+ charge carriers amidst two sites on a barrier separating them? From the CBH formalism, the next equation gives the exponent s:46
 | (10) |
 | (11) |
For this simple model, the alternating conductivity is given by:47
 | (12) |
 | (13) |
Moreover, NNp can be presented by:
| NNp = NT2(bipolaron-hoping) |
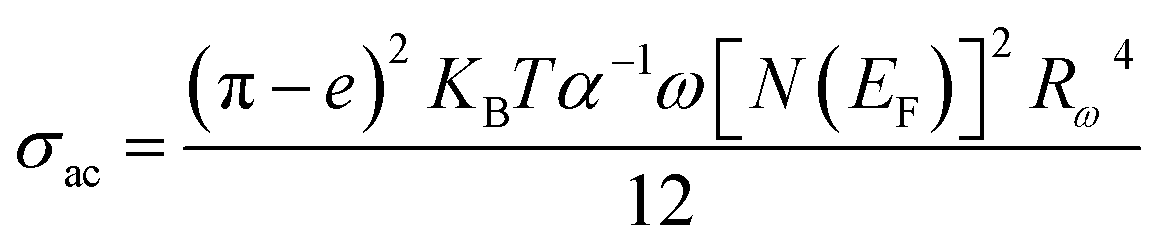
The Fig. 10(a) displays the variation of the AC conductivity (Ln (σac)) as a function of (1000/T) in the sample Li2CoGeO4. The AC conductivity of this sample has been explained quite satisfactorily by considering a single conduction mechanism (single polaron). We can notice that theoretical values (lines) are in good agreement with the experimental values (symbols) and implied that this formalism is the simplest assumed formalism to qualify the approximate frequency dependence of AC conductivity. The different parameters used in the fitting procedure are summarized in Table 4. The negative sign of effective energy is connected with the strong interaction between electron and photon. The Fig. 11(a) shows the temperature dependence of Rω at different frequencies. We note that the values of Rω vary is in the interval of distances of 2.74–2.75 Å. These values are of the order of the inter-atomic distance Li–Li: 2.75 Å. Based on these results, it may be thought that the AC conductivity in Li2CoGeO4 is assured by the mobility of polarons because of the movement of Li+ ions located in cavities along the c-axis.
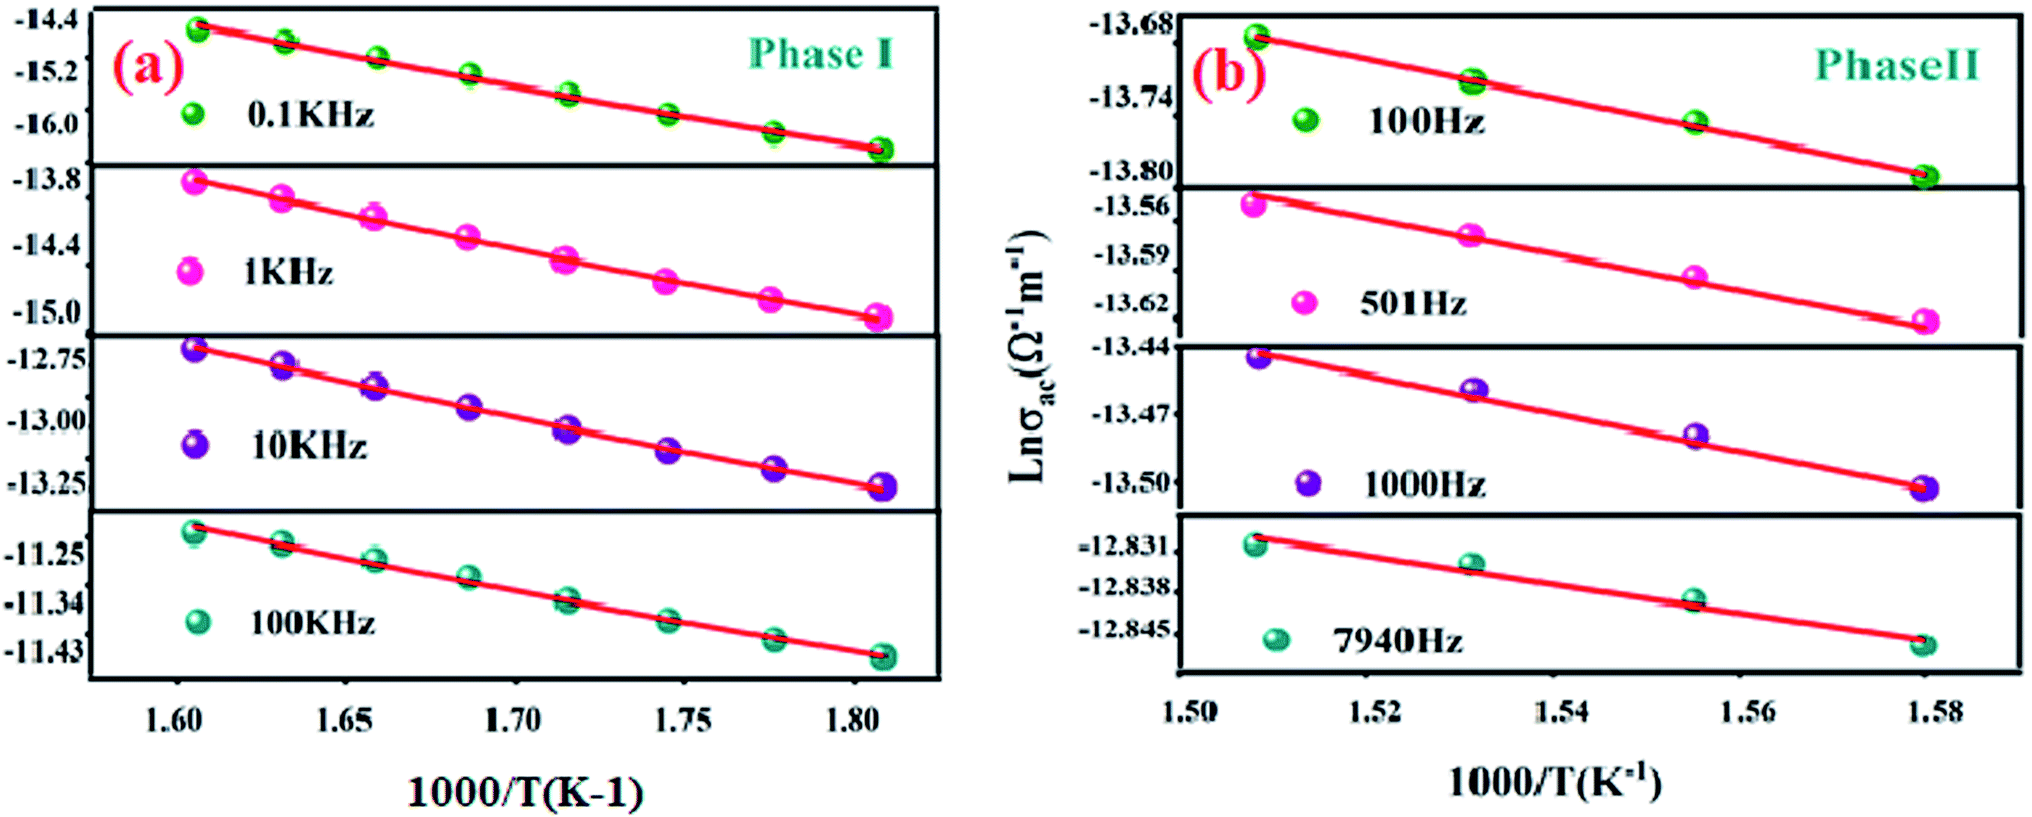 | ||
| Fig. 10 Variation of Ln (σac) with inverse of temperature at various frequencies for Li2CoGeO4 phase I (a) and phase II (b). | ||
| Phase I | Phase II | ||||||
|---|---|---|---|---|---|---|---|
| Frequency (Hz) | Ueff (eV) | N(EF) (eV−1 m−3) | Wm (eV) | Frequency (Hz) | N(EF) (eV−1 m−3) | α (Å−1) | Wm (eV) |
| 1 × 10² | −0.0046 | 9.58 × 10¹⁵ | 0.3 | 1 × 10² | 5.61 × 10¹⁹ | 1.18 | 0.34 |
| 1 × 10³ | −0.0031 | 1.83 × 10¹⁷ | 501 | 2.99 × 10¹⁹ | 1.3 | 0.19 | |
| 1 × 10⁴ | −0.0014 | 5.84 × 10¹⁸ | 1 × 10³ | 2.14 × 10¹⁹ | 1.35 | 0.07 | |
| 1 × 10⁵ | −5.98 × 10⁻⁴ | 5.65 × 10¹⁹ | 7940 | 9.94 × 10¹⁸ | 1.47 | 0.04 | |
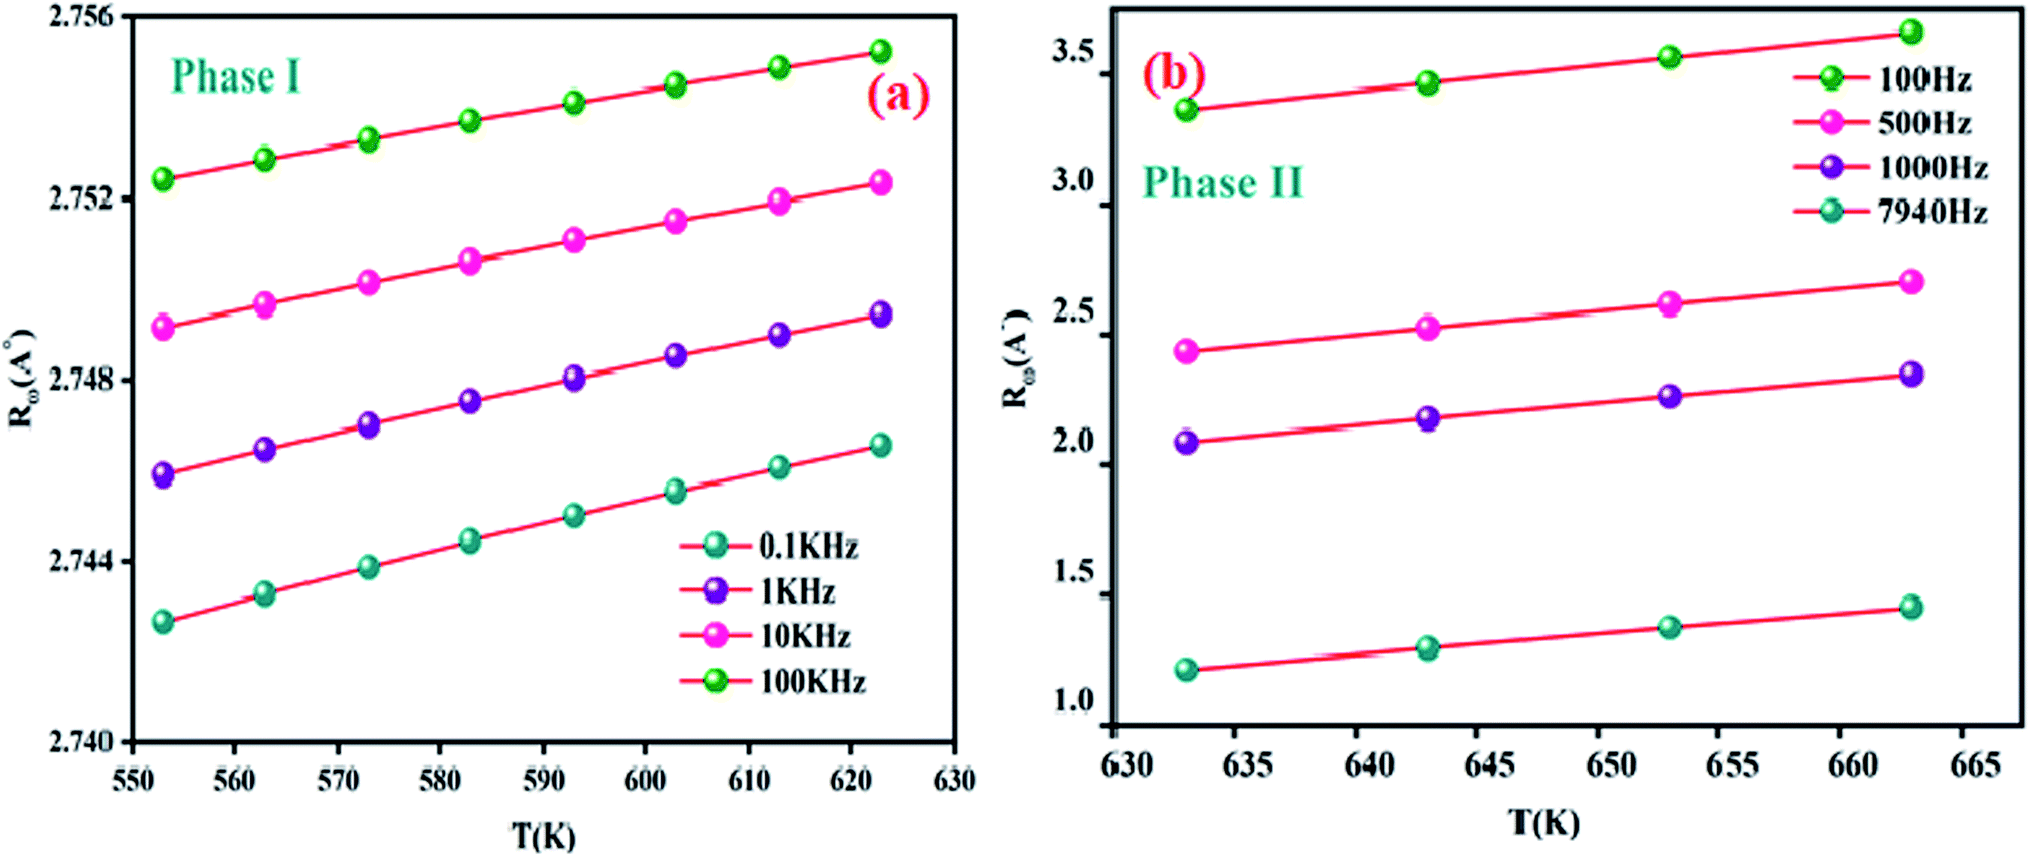 | ||
| Fig. 11 Variation of the hopping tunneling distance Rω as a function as temperature at different frequencies phase (I) (a) and phase (II) (b). | ||
3.6.4.2 The non-overlapping small-polaron tunnelling (NSPT) model (region II). In the NSPT formalism, the exponent s could be determined by the following equation:48
 | (14) |
 | (15) |
Considering the NSPT approach, σac was given by the following formula:49
 | (16) |
 | (17) |
| M* = M′ + jM′′ | (18) |
| M′ = ωC0Z′′ | (19) |
| M′′ = ωC0Z′ | (20) |
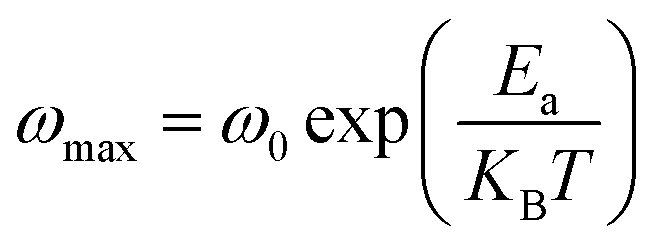
 (the normalized imaginary part of the modulus) as a function of the frequency at various temperatures. The benefit of these plots is to demonstrate that the relaxation mechanism is dominated by the short or long distance movement of charge carriers. From the Fig. 13 it can be noted that the isolation between the normalized peaks M′′ point out that the relaxation mechanism is controlled by the short distance displacement of the charge carriers. The Cole–Cole plot (M′′ vs. M′) for Li2CoGeO4 at T = 663 K is shown in the Fig. 14. The Cole–Cole plot (M′′ vs. M′) is more powerful than the Nyquist plot of impedance (Z′′ vs. Z′) in isolating the relaxation effects from grains and grain boundaries in our compound. It can be observed from the Fig. 14 the presence of single semicircle presenting the existence of electrical relaxation phenomena in our sample and also approves the only-phase characteristics of the studied material. For each temperature, the frequency ωmax designates the relaxation time τω = 1. In order to gain the activation energy demanded for the dielectric relaxation process, the corresponding curve of Ln (ωmax) as a function of the opposite of the absolute temperature (1000/T) is shown in the inset of the Fig. 14. This plot presents an Arrhenius-type behaviour defined by the next formula:59
 | (21) |
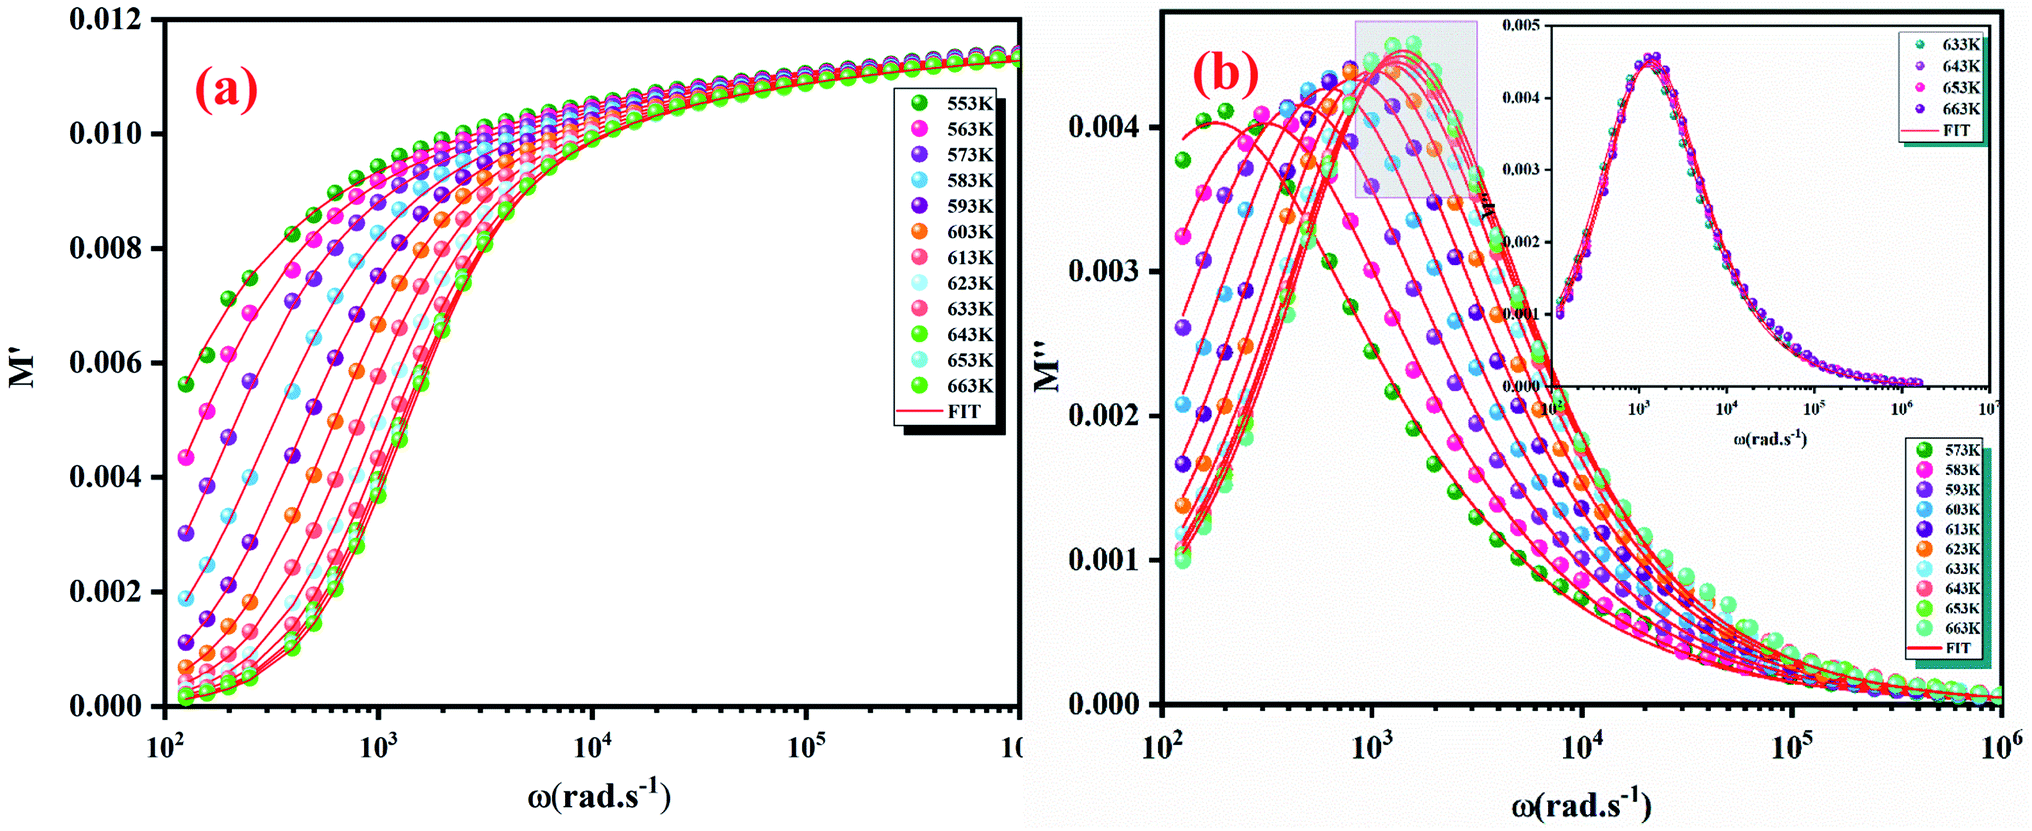 | ||
| Fig. 12 Frequency dependence of real part (M′) (a) and imaginary part (M′′) of electric modulus at various temperatures (b). | ||
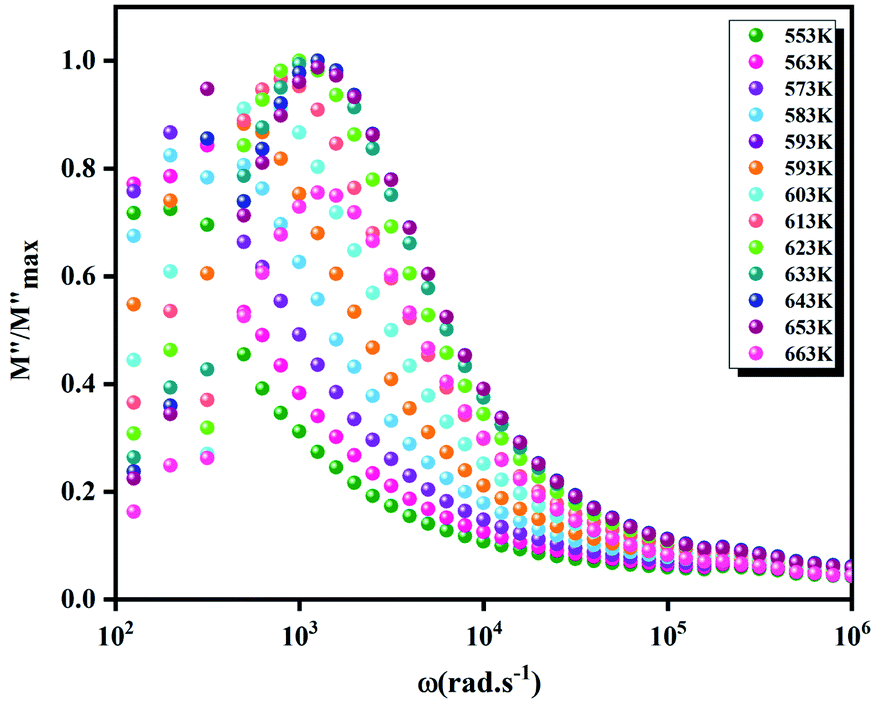 | ||
Fig. 13 The normalized imaginary part of modulus  | ||
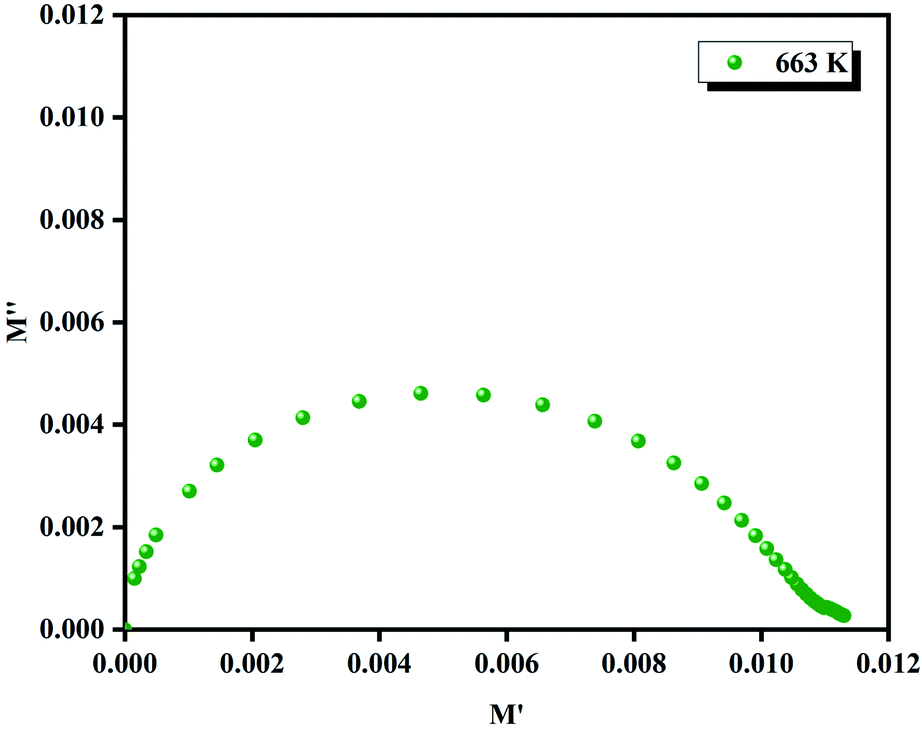 | ||
| Fig. 14 Nyquist (M′′ vs. M′) plot at 663 K and the inset of the Ln (ωmax) as a function of the opposite of the absolute temperature (1000/T). | ||
The estimated values of the activation energy (Eωmax) are: EaI = 1.01 ± 0.02 eV and EaII = 0.25 ± 0.02 eV. It can be noted that the values of Ea evaluated from the conductivity are similar to the activation energy Ea determinate by modulus plots M′′ implying that the electric parameters are accountable for the conduction and for the relaxation process and has the same impact in the investigated compound.
4. Conclusions
In summary, the ceramic compound Li2CoGeO4 was prepared by a solid-state method and fritted at 1073 K. This sample was found to crystallize in the monoclinic system with Pn space group. The characterization by XRD verifies that the synthetized sample is purely monophasic without impurities belonging to the monoclinic Pn space group. The SEM images display the existence of particles with the same shape and irregular sizes. EDS spectra of Li2CoGeO4 confirm the presence of Li, Co, Ge, and O elements. Afterward the vibrational study by IR spectroscopy confirms the existence of the functional group [GeO4]4−. Moreover, the optical properties of Li2CoGeO4 samples are done in the UV-vis spectral domain for determining significant parameters such as the band gap energy (Urbach energy). Finally, the analysis of the Nyquist plots displays a non-Debye relaxation. The equivalent circuit is a (R//C//CPE). A unique electric contribution was detected in this material, which is explained with the migration of lithium ion. The survey of AC conductivity has been investigated in detail and designated on the basis of correlated barrier jump (CBH) model (region I) and non-overlapping small polaron tunnelling (NSPT) model in (region II). The study of these models (CBH and NSPT) confirmed that the Li+ ions ensured the alternative current conduction in Li2CoGeO4. The activation energy was calculated from the DC conductivity as well as modulus plots. The weak variations of the activation energy values suppose that the process has a similar relaxation behaviour and conduction mechanism.Conflicts of interest
There are no conflicts of interest.References
- L. Xiukai, O. Shuxin, K. Naoki and Y. Jinhua, Novel Ag2ZnGeO4 photocatalyst for dye degradation under visible light irradiation, Appl. Catal., A, 2008, 334, 51–58 CrossRef.
- Z. Ning, O. Shuxin, K. Tetsuya and Y. Jinhua, Synthesis of hierarchical Ag2ZnGeO4 hollow spheres for enhanced photocatalytic property, Chem. Commun., 2012, 48, 9894–9896 RSC.
- L. Jin and Z. Gaoke, Facile synthesis and enhanced visible-light photocatalytic activity of micro/nanostructuredAg2ZnGeO4 hollow spheres, Mater. Sci. Eng., 2015, 193, 198–205 CrossRef.
- J. McDonald, Z. Ruigang, L. Chen, Z. Li Qin, Z. Ruibo, M. Stanley Whittingham and J. Hongfei, Hydrothermal synthesis, structure refinement, and electrochemical characterization of Li2CoGeO4 as an oxygen evolution catalyst, J. Mater. Chem. A, 2014, 2, 8428–18434 RSC.
- V. Nalbandyan, E. Zvereva, I. Shukaev, E. Gordon, V. Politaev, M. Whangbo, A. Petrenko, R. Denisov, M. Markina, M. Tzschoppe, K. Bukhteev, R. Klingeler and A. Vasiliev, A2MnXO4 family (A = Li, Na, Ag; X = Si, Ge): structural and magnetic properties, Inorg. Chem., 2017, 56, 14023–14039 CrossRef CAS PubMed.
- J. Grins, Structure and ionic conductivity of Na2BeGeO4, J. Solid State Chem., 1995, 118, 62–65 CrossRef CAS.
- J. Kamphorst and E. Hellstrom, Fast Li ionic conduction in solid solutions of the system Li4GeO4-Li2ZnGeO4-Li3PO4, Solid State Ionics, 1980, 1, 187–197 CrossRef CAS.
- G. Vaivars, Synthesis, structure and conductivity of Ag2ZnSiO4, Ag2ZnGeO4 and Ag2BeSiO4, Solid State Ionics, 1995, 78, 259–267 CrossRef CAS.
- S. Ben Yahya and B. Louati, Vibrational analysis and AC electrical conduction behavior of lithium zinc orthogermanate, Ionics, 2021, 27, 3027–3034 CrossRef CAS.
- S. Ben yahya and B. Louati, Characterization of the structure and conduction behavior of overlapping polaron tunnel of dipotassium zinc orthogermanate, J. Alloys Compd., 2021, 876, 159972 CrossRef.
- G. He, G. Popov and L. F. Nazar, Hydrothermal Synthesis and Electrochemical Properties of Li2CoSiO4/C Nano spheres, Chem. Mater., 2013, 25, 1024–1031 CrossRef CAS.
- G. Zhong, Y. Li, P. Yan, Z. Liu, M. Xie and H. Lin, Structural, Electronic, and Electrochemical Properties of Cathode Materials Li2MSiO4 (M = Mn, Fe, and Co): Density Functional Calculations, J. Phys. Chem. C, 2010, 114, 3693–3700 CrossRef CAS.
- C. Lyness, B. Delobel, A. R. Armstrong and P. G. Bruce, The lithium intercalation compounds Li2CoSiO4 and its behaviour as a positive electrode for lithium batteries, Chem. Commun., 2007, 46, 4890–4892 RSC.
- A. R. Armstrong, C. Lyness, M. Ménétrier and P. G. Bruce, Structural Polymorphism in Li2CoSiO4 Intercalation Electrodes: A Combined Diffraction and NMR Study, Chem. Mater., 2010, 22, 1892–1900 CrossRef CAS.
- H. M. Rietveld, A profile refinement method for nuclear and magnetic structures, J. Appl. Crystallogr., 1969, 2, 65–71 CrossRef CAS.
- T. Roisnel and J. Rodriguez-Carvajal, EPDIC-8, European Powder Diffraction Conference, Powder Diffr., 2002, 17, 337–338 CrossRef.
- V. Nalbandyan, E. Zvereva, I. Shukaev, E. Gordon, V. Politaev, M. Whangbo, A. Petrenko, R. Denisov, M. Markina, M. Tzschoppe, K. Bukhteev, R. Klingeler and A. Vasiliev, A2MnXO4 family (A = Li, Na, Ag; X = Si, Ge): structural and magnetic properties, Inorg. Chem., 2017, 56, 14023–14039 CrossRef CAS PubMed.
- M. Enneffati, B. Louati, K. Guidara, M. Rasheed and R. Barillé, Crystal structure characterization and AC electrical conduction behavior of sodium cadmium orthophosphate, J. Mater. Sci.: Mater. Electron., 2018, 29, 171–179 CrossRef CAS.
- N. L. Ross and A. Navrotsky, The Mg2GeO4 olivine-spinel phase transition, Phys. Chem. Miner., 1987, 14, 473–481 CrossRef CAS.
- H. L. Zheng, Z. C. Zhang, J. G. Zhou, S. S. Yang and J. Zhao, Vibrational spectra of CaGa2O4, Ca2GeO4, CaIn2O4 and CaSnO3 prepared by electrospinning, Appl. Phys. A, 2012, 108, 465–473 CrossRef CAS.
- V. V. Fomichev and E. V. Proskuryakova, Vibrational spectra and energy characteristics of the superionics Li4SiO4 and Li4GeO4, J. Solid State Chem., 1997, 134, 232–237 CrossRef CAS.
- N. V. Kosova, V. F. Anufrienko, T. V. Larina, A. Rougier, L. Aymard and J. M. Tarasconz, Disordering and electronic state of cobalt ions in mechano chemically synthesized LiCoO2, J. Solid State Chem., 2002, 165, 56–64 CrossRef CAS.
- O. V. Livitska, N. Y. Strutynska, I. V. Zatovsky and N. S. Slobodyanik, The double phosphates MIMIIPO4 (MI = Na, K; MII = Mg, Mn, Co, Ni, Zn) – synthesis from chloride melts and characterization, Cryst. Res. Technol., 2015, 50, 626–632 CrossRef CAS.
- D. Senol, E. Ozugurlu and L. Arda, The effect of cobalt and boron on the structural, microstructural, and optoelectronic properties of ZnO nanoparticles, Ceram. Int., 2020, 46, 7033–7044 CrossRef.
- P. Kubelka and F. Munk, An article on optics of paint layers, J. Tech. Phys., 1931, 12, 593 Search PubMed.
- Y. Jin, Y. Hu, Y. Fu, G. Ju, Z. Mu, R. Chen, J. Lin and Z. Wang, Preparation, Design, and Characterization of the Novel Long Persistent Phosphors: Na2 ZnGeO4 and Na2 ZnGeO4 :Mn2+, J. Am. Ceram. Soc., 2015, 98, 1555–1561 CrossRef CAS.
- A. Barhoumi, G. Leroy, B. Duponchel, J. Gest, L. Yang, N. Waldhoff and S. Guermazi, Aluminum doped ZnO thin films deposited by direct current sputtering: structural and optical properties, Superlattices Microstruct., 2015, 82, 483–498 CrossRef CAS.
- J. T. C. Irvine, D. C. Sinclair and A. R. West, Electroceramics: Characterization by Impedance Spectroscopy, Adv. Mater., 1990, 2, 132–138 CrossRef CAS.
- S. Selvasekarapandian and M. Vijaykumar, The ac impedance spectroscopy studies on LiDyO2, Mater. Chem. Phys., 2003, 80, 29–33 CrossRef CAS.
- S. Sen and R. N. P. Choudhary, Impedance studies of Sr modified BaZr0.05Ti0.95O3 ceramics, Mater. Chem. Phys., 2004, 87, 256–263 CrossRef CAS.
- A. K. Jonscher, the Interpretation of Non-Ideal Dielectric Admittance and Impedance Diagrams, Phys. Status Solidi A, 1975, 32, 665–667 CrossRef CAS.
- P. C. Sati, M. Arora, S. Chauhan, M. Kumar and S. Chhoker, Structural, magnetic, vibrational and impedance properties of Pr and Ti codoped BiFeO3 multiferroic ceramics, Ceram. Int., 2014, 40, 7805–7816 CrossRef CAS.
- M. Ram, A.c. conductivity and dielectric properties of LiNi3/5Cu2/5VO4 ceramics, Phys. B, 2010, 405, 1359–1361 CrossRef CAS.
- Y. Q. Lin, Y. J. Wu, X. M. Chen, S. P. Gu, J. Tong and S. Guan, Dielectric relaxation mechanisms of BiMn2O5 ceramics, J. Appl. Phys., 2009, 105, 054109 CrossRef.
- S. Chatterjee, P. K. Mahapatra, R. N. P. Choudhary and A. K. Thakur, Complex impedance studies of sodium pyrotungstate–Na2W2O7, Phys. Status Solidi A, 2004, 201, 588–595 CrossRef CAS.
- K. P. Chandra, K. Prasad and R. N. Gupta, Impedance spectroscopy study of an organic semiconductor: Alizarin, Phys. B, 2007, 388, 118–123 CrossRef CAS.
- L. Mathes, T. Gigl, M. Leitner and C. Hugenschmidt, Breakdown of Arrhenius law of temperature-dependent vacancy concentration in FCC lanthanum, Phys. Rev. B, 2020, 101, 134105 CrossRef CAS.
- A. Rahal, S. Megdiche Borchani, K. Guidara and M. Megdiche, Studies of electric, dielectric, and conduction mechanism of LiNiV0.5P0.5O4, J. Alloys Compd., 2018, 735, 1885–1892 CrossRef CAS.
- A. K. Jonscher, Analysis of the alternating current properties of ionic conductors, J. Mater. Sci., 1978, 13, 553–562 CrossRef CAS.
- S. R. Elliot, A.C. conduction in amorphous chalcogenide and pnictide semiconductors, Adv. Phys., 1987, 36, 135–217 CrossRef.
- R. Punia, R. S. Kundu, M. Dult, S. Murugavel and N. Kishore, Temperature and frequency dependent conductivity of bismuth zinc vanadate semiconducting glassy system, J. Appl. Phys., 2012, 112, 083701–083705 CrossRef.
- R. H. Chen, R. Y. Chang and S. C. Shern, Dielectric and AC ionic conductivity investigations in K3H(SeO4)2 single crystal, J. Phys. Chem. Solids, 2002, 63, 2069–2077 CrossRef CAS.
- A. A. Dakhel, The annealing effect for structural, optical and electrical properties of dysprosium–manganese oxide films grown on Si substrate, Solid-State Electron., 2005, 49, 1996–2001 CrossRef CAS.
- A. R. Long, Frequency-dependent loss in amorphous semiconductors, Adv. Phys., 1982, 31, 553–637 CrossRef CAS.
- A. Zolanvari, N. Goyal and S. K. Tripathi, Electrical properties of a- GexSe100-x, Pramana, 2004, 63, 617–625 CrossRef CAS.
- C. A. Hogarth, M. H. Islam and A. S. M. S. Rahman, D.c. and a.c. electrical properties of vacuum evaporated thin SiO/GeO2 films, J. Mater. Sci., 1993, 28, 518–528 CrossRef CAS.
- S. R. Elliott, A.c. conduction in amorphous chalcogenide and pnictide semiconductors, Adv. Phys., 1987, 36, 135–217 CrossRef CAS.
- M. D. Migahed, N. A. Bakr, M. I. Abdel-Hamid, O. El-Hanafy and M. El Nimr, Dielectric relaxation and electric modulus behavior in poly(vinyl alcohol)-based composite systems, J. Appl. Polym. Sci., 1996, 59, 655–662 CrossRef CAS.
- S. R. Elliot, Adv. Phys., 1987, 36, 135–217 CrossRef.
- P. B. Macedo, C. T. Moynihan and R. Bose, Phys. Chem. Glasses, 1972, 13, 171–179 CAS.
- F. S. Howell, R. A. Bose, P. B. Macedo and C. T. Moynihan, Electrical relaxation in a glass- forming molten salt, J. Phys. Chem., 1974, 78, 639–648 CrossRef CAS.
- K. L. Nagi and C. Leon, Recent advances in relating macroscopic electrical relaxation data to microscopic movements of the ions in ionically conducting materials, Solid State Ionics, 1999, 125, 81–90 CrossRef.
- S. Sasaki, C. T. Prewitt and J. D. Bass, Orthorhombic perovskite CaTiO3 and CdTiO3: structure and space group, Acta Crystallogr., Sect. C: Cryst. Struct. Commun., 1987, 43, 1668–1674 CrossRef.
- Y. Ben Taher, N. Moutia, A. Oueslati and M. Gargouri, Electrical properties, conduction mechanism and modulus of diphosphate compounds, RSC Adv., 2016, 6, 39750–39757 RSC.
- R. Ranjan, R. Kumar, N. Kumar, B. Behera and R. N. P. Choudhary, Impedance and electric modulus analysis of Sm-modfied Pb(Zr0.55Ti0.45)1_x/4O3 ceramics, J. Alloys Compd., 2011, 509, 6388–6394 CrossRef CAS.
- F. Borsa, D. R. Torgeson, S. W. Martin and H. K. Patel, Relaxation and fluctuations in glassy fast-ion conductors: Wide-frequency-range NMR and conductivity measurements, Phys. Rev. B: Condens. Matter Mater. Phys., 1992, 46, 795–800 CrossRef CAS PubMed.
- A. Sinha and A. Dutta, Microstructure evolution, dielectric relaxation and scaling behavior of Dy-for-Fe substituted Ninanoferrites, RSC Adv., 2015, 6, 100330–100338 RSC.
- A. Chen, Y. Zhi and L. E. Cross, Oxygen-vacancy-related low frequency dielectric relaxation and electrical conduction in Bi: SrTiO3, Phys. Rev. B: Condens. Matter Mater. Phys., 2000, 62, 228–236 CrossRef CAS.
- L. Liu, M. Wu, Y. Huang, Z. Yang, L. Fang and C. Hu, Frequency and temperature dependent dielectric and conductivity behavior of 0.95(K0.5Na0.5) NbO3-0.05BaTiO3 ceramic, Mater. Chem. Phys., 2011, 126, 769–772 CrossRef CAS.
| This journal is © The Royal Society of Chemistry 2022 |