
 Open Access Article
 This Open Access Article is licensed under a Creative Commons Attribution-Non Commercial 3.0 Unported Licence
Experimental and theoretical study of ZrMo-KIT-6 solid acid catalyst with abundant Brønsted acid sites†
Jinglin Mua,
Manfen Lianga,
Hong Huanga,
Jian Menga,
Leilei Xu b,
Zhiling Songc,
Mei Wud,
Zhichao Miao*a,
Shuping Zhuoa and
Jin Zhou*a
b,
Zhiling Songc,
Mei Wud,
Zhichao Miao*a,
Shuping Zhuoa and
Jin Zhou*a
aSchool of Chemistry and Chemical Engineering, Shandong University of Technology, Zibo, 255000, P. R. China. E-mail: miaozhichao@sdut.edu.cn; zhoujin@sdut.edu.cn; Fax: +86 533 2781664
bCollaborative Innovation Center of Atmospheric Environment and Equipment Technology, Jiangsu Key Laboratory of Atmospheric Environment Monitoring and Pollution Control (AEMPC), Nanjing University of Information Science & Technology, Nanjing, 210044, P. R. China
cKey Laboratory of Optic-electric Sensing and Analytical Chemistry for Life Science, MOE, Shandong Key Laboratory of Biochemical Analysis, College of Chemistry and Molecular Engineering, Qingdao University of Science and Technology, Qingdao, 266042, P. R. China
dNational & Local Joint Engineering Research Center for Mineral Salt Deep Utilization, Huaiyin Institute of Technology, Huaian, 223003, P. R. China
First published on 24th March 2022
Abstract
Given their excellent reusability and environmental friendliness, solid acid catalysts have drawn considerable attention in acid-catalyzed reactions. However, the rational design and synthesis of solid acid catalysts with abundant Brønsted acid sites remains a challenge. In this paper, KIT-6, Zr-KIT-6, Mo-KIT-6, and ZrMo-KIT-6 solid acid catalysts are designed and synthesized. The textural properties, chemical bonds, and acidic properties of these catalysts are explored. Theoretical calculations are conducted to explore the formation mechanism of Brønsted acid sites. The theoretical trend of acidity is consistent with the experimental result of acidity and further demonstrates that the synergistic effect of Zr and Mo species improves the formation of Brønsted acid sites. The as-obtained ZrMo-KIT-6 solid acid catalysts are employed in Friedel–Crafts benzylation reaction, and the outstanding catalytic performance of the ZrMo-KIT-6 catalyst indicates that it is an excellent Brønsted solid acid catalyst.
1. Introduction
Brønsted acid catalysts are widely used for synthesizing multifarious fuels and fine chemicals, such as alkylation of aromatic compounds, isomerization of hydrocarbon, dehydration of carbohydrate, and esterification of organic acid.1–6 Homogeneous Brønsted acid catalysts such as H2SO4, HCl, and H3PO4 are widely used for producing various industrial chemicals. Nevertheless, the use of these catalysts leads to enormous energy costs for separating, reusing, and treating acidic waste water. In addition, homogeneous Brønsted acid catalysts have large corrosivity for the reaction equipment.7,8 By contrast, heterogeneous Brønsted acid catalysts have easy recovery and little influence on the environment and reaction equipment, which has drawn considerable attention in recent years.9,10The Brønsted solid acid catalyst primarily includes zeolite, MOF, ZrO2/SO42−, WO3/ZrO2, and heteropoly acid.11–15 Jiang et al. synthesized sulfated metal–organic framework-808, which was used in various acid-catalyzed reactions, including Friedel–Crafts (FC) acylation, esterification, and isomerization.16 Nguyen et al. fabricated tungstated zirconia solid acid catalysts for cellulose conversion in hydrothermal conditions and showed that uncalcined ZrW exhibited higher catalytic activity and stability than the calcined ZrW catalyst.17 The trial-and-error method is typically used in the preparation of solid acid catalysts, the rational fabrication of excellent Brønsted acid activity also points to the need for the interpretation of the origins of catalytic activity.18–20
Computational studies have been carried out to characterize the Brønsted and Lewis acidity of amorphous and crystalline solid catalysts. These methods are particularly useful because the local structures of the active sites are difficult to probe with the experimental approach. Larmier et al. confirmed the importance of pseudo-bridging silanols in the dehydration on amorphous silica–alumina.21 Jystad et al. collected 70 metal-doped amorphous silicates structures in METASIL, characterized catalytic activity of the active sites with ammonia adsorption simulation and provided robust evidence for the experimental trends.22 More investigations of acidity were also revealed by thermodynamic stability with deprotonation energy calculations in metal-doped amorphous silicates.23–25 Therefore, the combination of experimental research and theoretical calculation provides a potential strategy in the design and characterization of Brønsted solid acid catalysts.
Ordered mesoporous KIT-6 material has high specific surface area, tunable pore size and pore wall thickness. In addition, the interconnected Ia3d cubic structure can significantly enhance the diffusion of reactants.26–28 Bimetallic KIT-6 based catalysts, such as MoZr, WZr, WNb, and WSn catalysts with tunable acidity, have been reported in recent years.29–33 Xu et al. studied in detail the acidity of mesoporous MoOx/ZrO2 and WOx/ZrO2 materials by multinuclear solid state nuclear magnetic resonance (NMR) techniques as well as density functional theory (DFT) quantum chemical calculations.29 Bala Subramaniam and co-workers reported a series of W and Sn-containing KIT-6 solid acid catalysts and these catalysts exhibited superior catalytic performance for FC anisole benzylation.33 In this work, Zr and Mo species are chosen and introduced through a one-pot method to improve the amount of acid sites. The textural properties, chemical bonds, and acidic properties of KIT-6, Zr-KIT-6, Mo-KIT-6, and ZrMo-KIT-6 are explored. The DFT calculation is conducted to explore the formation mechanism of Brønsted acid site. The result obtained from DFT calculation further provides reasonably consistent evidence of association between the experimental acidity and structure. The as-obtained Brønsted solid acid catalyst is used for FC benzylation reaction, and the ZrMo-KIT-6 catalyst exhibits excellent catalytic performance, which is ascribed to the Brønsted acid sites.
2. Experimental section
2.1 Materials
(EO)20(PO)70(EO)20 triblock copolymer (Pluronic P123, Mav = 5800, Sigma-Aldrich), tetraethyl orthosilicate (TEOS, Aladdin Chemistry Co. Ltd), zirconyl chloride octahydrate (ZrOCl2·8H2O, Aladdin Chemistry Co. Ltd), ammonium molybdate ((NH4)6Mo7O24·4H2O, Sinopharm Chemical Reagent Co. Ltd), trimethylphosphine oxide (TMPO, Aladdin Chemistry Co. Ltd), dichloromethane (DCM, Aladdin Chemistry Co. Ltd), and ultrapure water (18.2 MΩ) were used in this work.2.2 Fabrication of KIT-6, Zr-KIT-6, Mo-KIT-6, and ZrMo-KIT-6 materials
The design and synthesis of KIT-6, Zr-KIT-6, Mo-KIT-6, and ZrMo-KIT-6 materials were performed as follows,34,35 and the cheap and easily obtained ZrOCl2·8H2O and (NH4)6Mo7O24·4H2O materials were chosen as the Zr and Mo precursors. In a general synthesis, P123 (1 g) was added and completely dissolved in 0.5 M HCl solution (35 mL). After adding n-butanol (1 g) and stirring for another 1 h, TEOS (2.1 g) and different ZrOCl2·8H2O and (NH4)6Mo7O24·4H2O (the molar ratio of Zr or Mo/Si was 1/20) were successively added into the above-mentioned solution. Then, the mixture was stirred at 35 °C for 18 h and transferred to a Teflon autoclave at 100 °C for 48 h. Finally, the as-obtained solid product was washed, dried, and calcined at 700 °C for 4 h. Consequently, the KIT-6, Zr-KIT-6, Mo-KIT-6, and ZrMo-KIT-6 materials were obtained.2.3 Characterization
Powder X-ray diffraction (XRD) was performed on a Bruker D8 Advance diffractometer, using Cu Kα radiation at 40 kV, 40 mA, and Kα = 0.15406 nm. The small-angle XRD (SXRD) and wide-angle XRD (WXRD) patterns were recorded in 2θ range from 0.6° to 5.0° and 10.0° to 80.0°.Nitrogen adsorption–desorption isotherms were recorded at −196 °C on a 3-flex surface characterization analyzer (Micromeritics Instrument). The sample was pretreated at 300 °C for 2 h under vacuum before measurements.
TEM images, HRTEM images, energy dispersive X-ray spectroscopy (EDS), and elemental mapping tests were obtained on a high-resolution transmission electron microscope (FEI TECNAI G2 F20) with an accelerating voltage of 200 kV.
Raman spectra were collected with a LabRam HR system equipped with a CCD detector and laser beam (λ = 532 nm) in the range of 100–1500 cm−1 at ambient conditions.
Diffuse reflectance UV-visible (UV-vis) spectra were achieved in the 200–800 nm range on PE Lambda 650S at room temperature.
H2 temperature-programmed reduction (H2-TPR) for catalysts (0.1 g) was performed on Chembet PULSAR TPR/TPD (Quantachrome Instruments U.S.). H2–Ar mixed gas (5 mol% H2–95 mol% Ar) steam (40 mL min−1) was collected as the reducing agent with a ramping rate of 20 °C min−1 from 40 °C to 950 °C.
X-ray photoelectron spectroscopy (XPS) was performed on a Thermon Scientific ESCALAB250xi spectrometer. All the obtained Si, Zr, Mo, and O spectra were calibrated to the C1s line (284.8 eV).
X-ray fluorescence (XRF) spectrum was carried out on Magix PW2403 (PANalytical, Inc.) to obtain the real contents of Zr, Mo, and Si species.
Temperature-programmed desorption of ammonia (NH3-TPD) was performed on a Chembet PULSAR TPR/TPD (Quantachrome Instruments U.S.). First, 0.1 g of catalyst was pretreated at 500 °C under He gas to remove the adsorbed moisture. After cooling down to 100 °C, NH3 (10 mol% NH3–90 mol% He gas (40 mL min−1)) was introduced and kept at 100 °C for 30 min. Afterward, the physically absorbed NH3 molecules were removed at 100 °C under He gas. The catalyst was increased to 500 °C (10 °C min−1), and NH3 was detected using an AMETEK (LC-D-200 Dycor AMETEK) mass spectrometer (m/z = 16).
The infrared spectra of adsorbed pyridine (pyridine-IR spectra) were measured on a PE Frontier FT-IR spectrometer. The dehydrated catalyst was pressed into a self-supporting wafer. Following this step, the catalyst was heated and degassed at 400 °C for 1 h. Subsequently, the catalyst was cooled down to room temperature, and the pyridine vapor was introduced for 30 min to achieve adsorption saturation. The spectra were recorded in the range of 1300–2000 cm−1 after desorption at 150 °C, 250 °C, and 400 °C under vacuum. The amounts of Brønsted and Lewis acid sites were determined at 1540 and 1440 cm−1 as reported by Emeis.36
The magic-angle spinning nuclear magnetic resonance (MAS NMR) spectra were recorded on a Bruker AVANCE III HD 400 MHz spectrometer at resonance frequencies of 161.98 MHz for 31P. Typically, free-induction-decay signals were accumulated using a single pulse sequence with a recycle delay of 6.25 s, 4 mm zirconium oxide rotors, and a sample spinning frequency of 12 kHz. Prior to NMR measurements, ZrMo-KIT-6 (0.3 g) was dehydrated at 300 °C under evacuation conditions overnight to remove any adsorbed water. Under dry nitrogen conditions, a DCM solution (10 mL) containing a known amount of TMPO (30 mg) was added to the sample tube with the ZrMo-KIT-6 and stirred overnight at room temperature. Finally, the DCM was removed via heating to 353 K under evacuation conditions for 6 h. For 31P MAS NMR analysis, the ZrMo-KIT-6 dosed with TMPO was packed into zirconia MAS NMR rotors with gastight caps in a glovebox. A Gaussian deconvolution method was used to analyze the 31P MAS NMR spectra.
2.4 DFT calculation
As the key steps of Brønsted acid catalyzed reactions, the deprotonation of acid can be revealed by acid dissociation:| HA → H+ + A− |
| ΔG = ΔG(H+) + ΔG(A−) − ΔG(HA). |
Lower energies indicated that the dissociation products were more stable, and amorphous silica could easily provide Brønsted acid sites. Numerous methods have been achieved to obtain this result with high accuracy.37,38 In the current system, all catalysts are in the same reference state, so the values of ΔG(H+) are identical and not taken into account.
The cluster model had been chosen for the solid acid catalyst because of its insulative property and the localized interaction with the metal site. Since METASIL, developed by Caricato et al., has provided the thermodynamically stable and the most prevalent cluster models in the synthesis, and our amorphous silicate structure was built from METASIL to simulate deprotonation in a realistic environment.22 Hydrogen ions were removed from different alcoholic hydroxyl groups to simulate the reactive site as completely as possible. Subsequently, all the geometries were fully optimized before and after deprotonation, using the B3LYP hybrid functional39 with Grimme's D3 dispersion corrections40 and 6-31+G (d, p) basis sets for Si, O, and H. Similar calculations have been used in surface acidity characterization.22,41 On the basis of the optimal amorphous silica, we constructed metal-doped materials by replacing Si4+ with tetra-coordinated Zr4+ and Mo6+ and calculated deprotonation with the same calculation level to evaluate their Brønsted acidity except that the Def2TZVP basis set was added for metals. Multisubstituted cluster models were investigated to further simulate the ZrO2 frameworks and polymolybdate species observed in the experimental section. All these calculations have been carried out within Gaussian 16 package.42
2.5 Application of ZrMo-KIT-6 as solid acid catalysts
In a typical liquid-phase FC benzylation reaction, anisole (100 mmol), benzyl alcohol (BzOH) (10 mmol), n-heptane (0.20 mL, internal standard for quantitative analysis), and catalyst (50 mg) were charged into a 50 mL round bottom flask with a reflux condenser. The reaction mixture was stirred at 130 °C for 1 h. After reaction, the used catalyst was recovered from the reaction system by separated, washed and calcined at 500 °C for 2 h to remove the strongly adsorbed organic species. The BzOH and products were analyzed by Agilent-7890B gas chromatography equipped with a PE-6 column (50 m × 0.32 mm × 0.25 μm). The C balance based on the analysis of reactants and liquid phase products was nearly 100 ± 3%.The o-benzylanisole (o-BA), p-benzylanisole (p-BA), and dibenzyl ether (DBE) were detected and no other products were observed in this reaction. The conversion of benzyl alcohol (con. of BzOH) and selectivity of o-BA and p-BA (sel. of o-BA and sel. of p-BA) were calculated according to the following equations:


The turnover frequency (TOF) is calculated using the following equations based on the yield of BA and amounts of Brønsted acid site with different strength:
3. Results and discussion
3.1 Ordered mesoporous structure
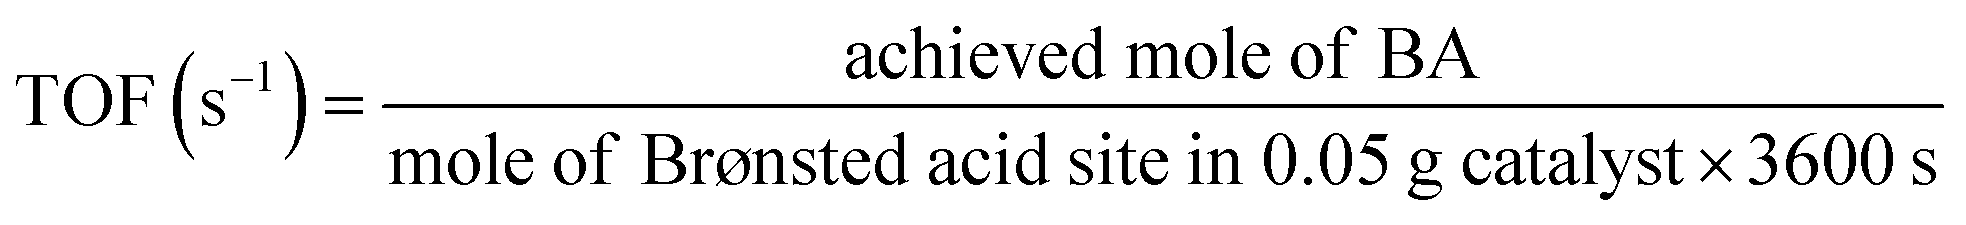
The ordered mesoporous structure of KIT-6, Zr-KIT-6, Mo-KIT-6, and ZrMo-KIT-6 materials was explored by SXRD, N2-physisorption, and pore-size distribution (PSD). As shown in Fig. 1a, evident diffraction peaks are clearly observed. In particular, a peak at approximately 1°, corresponding to the (211) reflection of cubic Ia3d symmetry, is detected for all the samples.43,44 In addition, another two peaks are found at 1.2° and 1.5°, which are ascribed to the (220) and (420) reflections. All the peaks imply the formation of well-ordered pore structure. Furthermore, the peak position transfers to the low position with the introduction of Zr or/and Mo, indicating the enhancement of unit parameter. This phenomenon confirms the successful introduction of Zr or/and Mo species into the KIT-6 skeleton.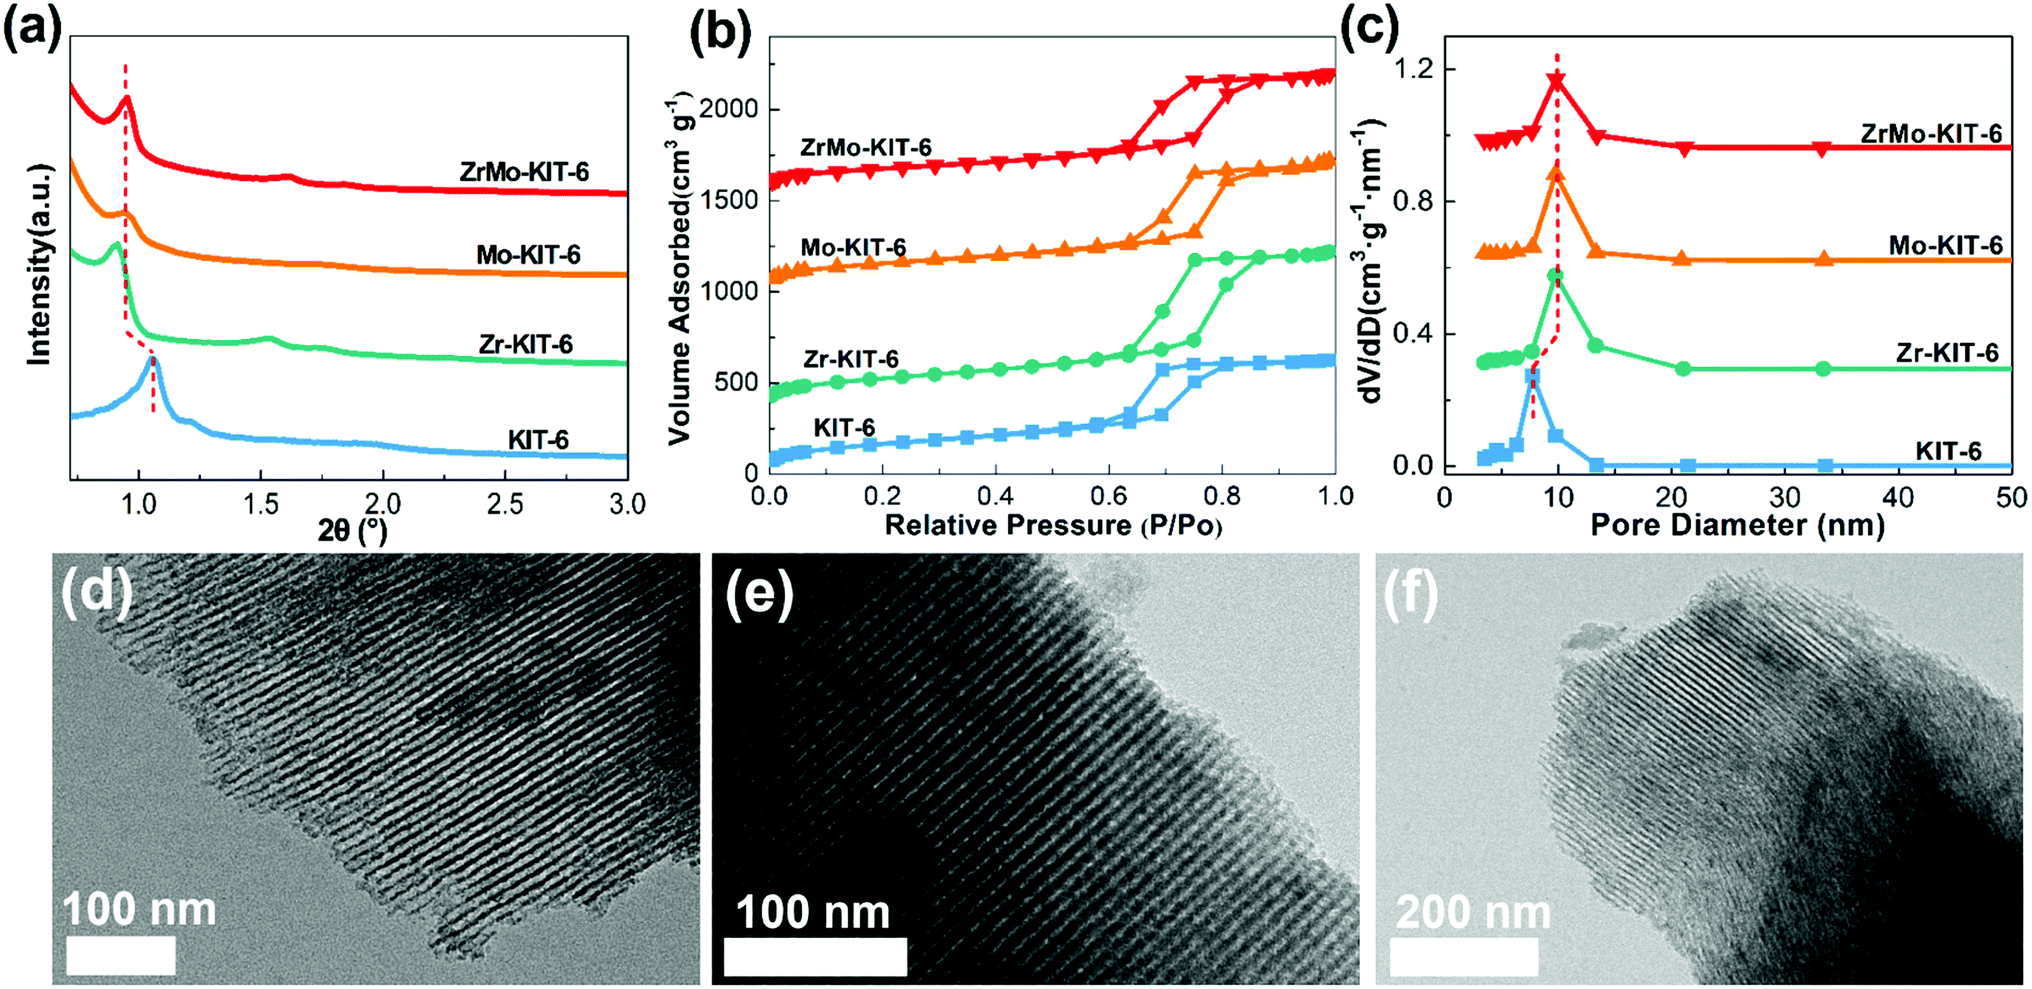 | ||
| Fig. 1 (a) SXRD patterns, (b) isotherms, and (c) pore size distributions of KIT-6, Zr-KIT-6, Mo-KIT-6, and ZrMo-KIT-6. TEM images of (d) Zr-KIT-6, (e) Mo-KIT-6, and (f) ZrMo-KIT-6. | ||
The N2 adsorption–desorption isotherms of materials are displayed in Fig. 1b. Typical type IV isotherm with an H1-type hysteresis loop in the scope of 0.6–0.9 P/P0 can be observed.45,46 These results are consistent with the reported KIT-6-type materials, implying the presence of ordered mesostructure. The ordered mesoporous pores can be observed from the parallel and vertical directions in the TEM images (Fig. S1a† and 1d–f). With the adding of Zr or/and Mo species, the position of the hysteresis loop, especially the adsorption isotherm, transfers to the higher P/P0 region, implying the enhancement of pore size. As for the PSD patterns (Fig. 1c), narrow distribution of pore size approximately 5–15 nm is detected, and the pore size increases for Zr-KIT-6, Mo-KIT-6, and ZrMo-KIT-6 materials. The textural parameters of all the materials are displayed in Table 1. With the introduction of Zr or/and Mo species, the specific surface area of materials gradually decreases from 628 m2 g−1 (KIT-6) to 465 m2 g−1 (ZrMo-KIT-6). Moreover, the pore size enhances from 6.4 nm to 9.8 nm with the addition of Zr or/and Mo, confirming the introduction of Zr or/and Mo species into the skeleton of KIT-6. In addition, the compositions of all the materials are investigated by XPS, EDS, and XRF characterizations (Table 2). It can be found that all the elements have been introduced and the Zr source added together with Mo source increases the efficiency of introducing Mo species.
| Samples | d211a (nm) | Specific surface areab (m2 g−1) | Pore sizec (nm) | Pore volumed (cm3 g−1) | Acidity from NH3-TPD (mmol g−1) | Brønsted aciditye (mmol g−1) | Lewis aciditye (mmol g−1) |
|---|---|---|---|---|---|---|---|
| a Acquired from XRD patterns using Bragg's law.b The specific surface area was calculated via Brunauer–Emmett–Teller (BET) method with the relative pressure ranging from 0.05 to 0.30.c The pore size was obtained from the adsorption branch of isotherms by using Barrett–Joyner–Halenda (BJH) method.d The pore volume was determined from the amount of nitrogen adsorbed at relative pressure of 0.990.e The Brønsted and Lewis acidity was obtained from the pyridine-IR spectra after desorption at 150 °C. | |||||||
| KIT-6 | 8.33 | 628 | 6.4 | 0.93 | 0 | 0 | 0.031 |
| Zr-KIT-6 | 9.70 | 602 | 9.7 | 1.28 | 0.11 | 0.035 | 0.132 |
| Mo-KIT-6 | 9.29 | 550 | 9.8 | 1.03 | 0.07 | 0 | 0.050 |
| ZrMo-KIT-6 | 9.29 | 465 | 9.8 | 0.96 | 0.64 | 0.097 | 0.167 |
| Samples | XPS (at%) | EDS (at%) | XRF (at%) | |||||||||
|---|---|---|---|---|---|---|---|---|---|---|---|---|
| Si | Zr | Mo | O | Si | Zr | Mo | O | Si | Zr | Mo | O | |
| Zr-KIT-6 | 30.1 | 1.0 | — | 68.9 | 41.7 | 2.8 | — | 55.5 | 31.7 | 1.6 | — | 66.7 |
| Mo-KIT-6 | 31.7 | — | 0.2 | 68.1 | 42.0 | — | 0.2 | 57.8 | 32.8 | — | 0.4 | 66.8 |
| ZrMo-KIT-6 | 26.5 | 2.9 | 1.5 | 69.1 | 37.8 | 1.7 | 1.7 | 56.1 | 30.2 | 1.4 | 1.3 | 67.1 |
| ZrMo-KIT-6-used | 27.0 | 2.5 | 1.4 | 69.1 | 40.3 | 1.7 | 1.6 | 56.4 | 30.1 | 1.4 | 1.4 | 67.1 |
3.2 Chemical bonds
The existing states of Zr and Mo and chemical bonds of KIT-6, Zr-KIT-6, Mo-KIT-6, and ZrMo-KIT-6 materials were investigated by elemental mapping, WXRD, Raman, UV, and H2-TPR characterizations. As shown in the elemental mapping (Fig. S2†), Zr and Mo are introduced as designed. In addition, Zr and Mo species are highly dispersed in the framework of materials. The crystal structure of materials is investigated by the WXRD patterns (Fig. 2a). For the KIT-6, Zr-KIT-6, and Mo-KIT-6 materials, no peaks of crystalline phases are observed, implying the presence of an amorphous feature. The (101), (110), (112), and (211) crystal faces of t-ZrO2 (JCPDS card no. 80-0784) are identified at 30.2°, 35.5°, 50.4°, and 60.3°, demonstrating the appearance of crystalline t-ZrO2 in ZrMo-KIT-6 materials.47,48 This conclusion is also confirmed by the HRTEM images (Fig. S1c†), in which small particles with d-spacing of 0.293 nm are observed, corresponding to the (101) crystal face of t-ZrO2.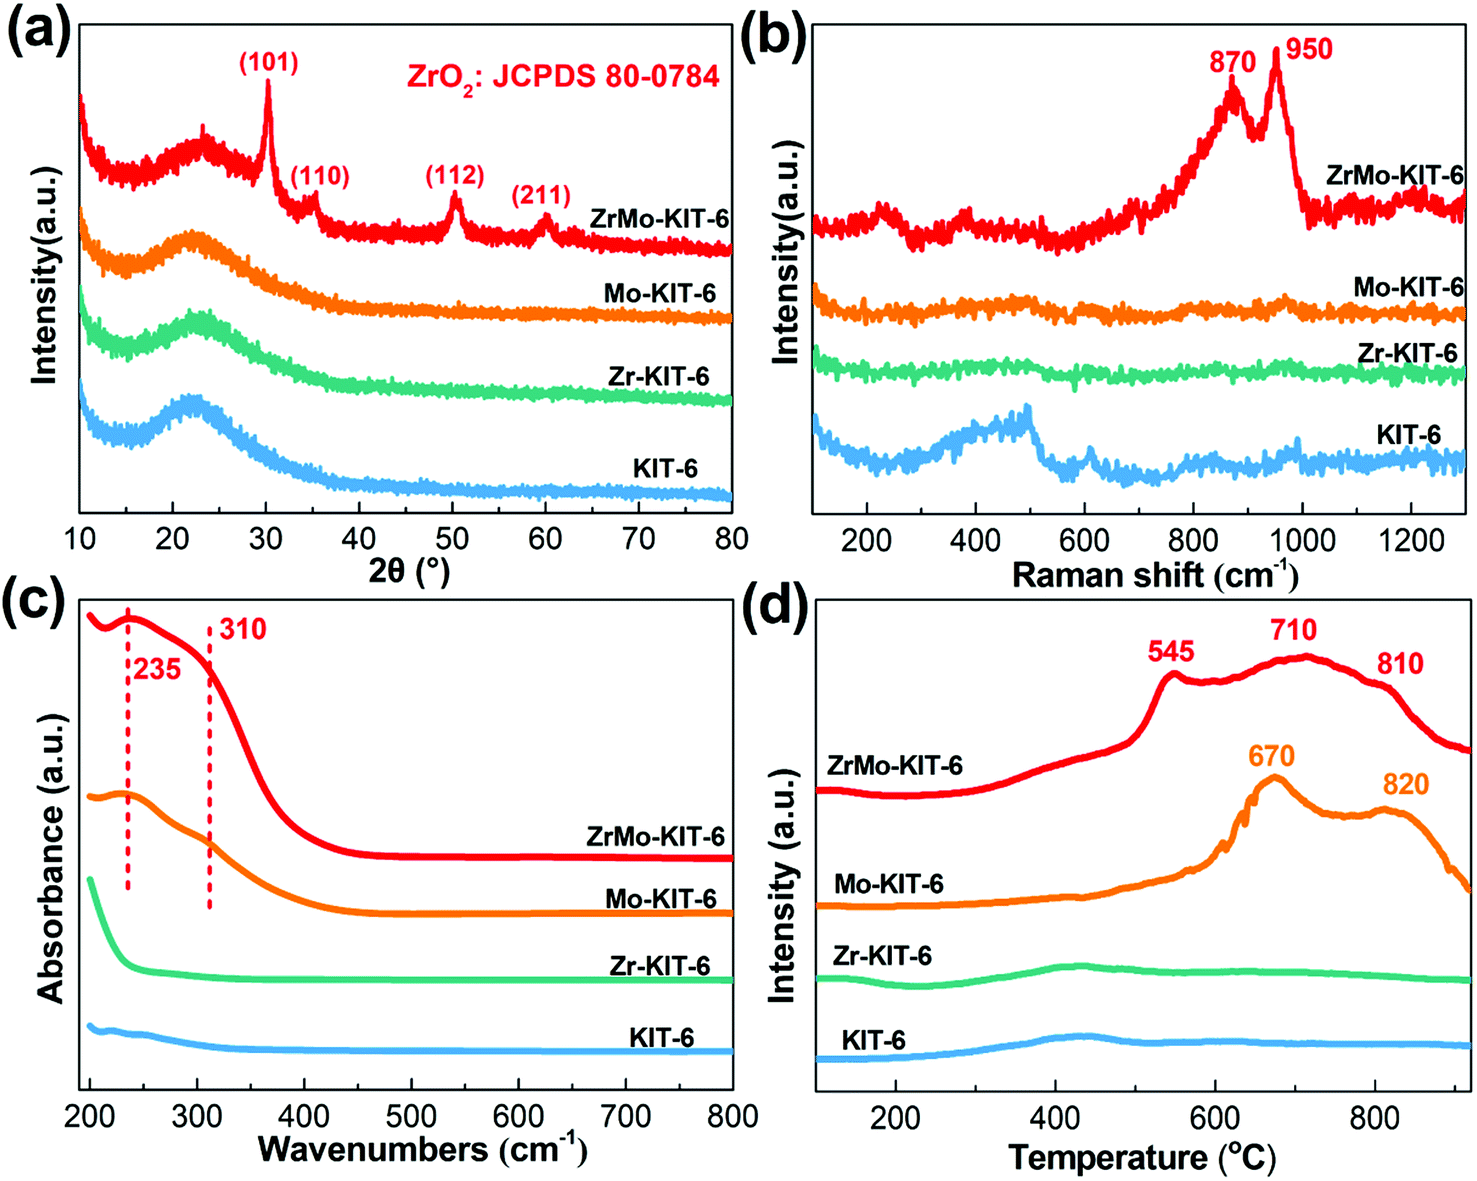 | ||
| Fig. 2 (a) WXRD patterns, (b) Raman spectra, (c) UV-vis spectra, and (d) H2-TPR patterns of KIT-6, Zr-KIT-6, Mo-KIT-6, and ZrMo-KIT-6. | ||
In the Raman spectra (Fig. 2b) of materials, no evident peak is observed in the KIT-6, Zr-KIT-6, and Mo-KIT-6 materials. In the ZrMo-KIT-6 sample, two weak bands can be found at approximately 870 and 950 cm−1. The band at 870 cm−1 is ascribing to the vibration mode of oligomeric species (Mo–O–Mo), and the band at 950 cm−1 is owing to the isolated molybdate species.49–51 As displayed in UV-vis spectra (Fig. 2c), the KIT-6 and Zr-KIT-6 materials have no evident peak. For the Mo-KIT-6 and ZrMo-KIT-6 materials, peaks at 235 and 310 nm appear, attributing to the isolated tetrahedral molybdate species and oligomeric octahedral molybdate species (Mo–O–Mo) in the skeleton of the mesostructure,49,52 which is in agreement with XRD and Raman results.
H2-TPR characterization was performed to confirm the existing states of the introduced Mo. In general, the reduction of MoO3 is performed as follows: MoO3 to MoO2 and MoO2 to Mo.53–55 As shown in Fig. 2d, the KIT-6 and Zr-KIT-6 materials have no discernible reduction peaks. For the Mo-KIT-6 materials, the reduction peak at approximately 670 °C is attributed to the isolated molybdate species, which are readily reduced. Meanwhile, the peak at 820 °C is due to the reduction of oligomeric molybdate species from Mo6+ to Mo4+. For the ZrMo-KIT-6 material, the reduction peaks change to lower temperature. In particular, the reduction of isolated Mo species occurs at 545 °C, and the reduction of oligomeric molybdate species from Mo6+ to Mo4+ and Mo4+ to Mo0 occurs at 710 °C and 810 °C, respectively. The decreased reduction temperature implies the interaction between Mo and Zr species, which causes the easy reduction of Mo species in ZrMo-KIT-6 materials.
XPS spectra were used to confirm the composition of samples and valence state of Zr and Mo species. As shown in Fig. 3a, the Si 2p signal exhibits a peak at 103.8 eV, implying the presence of Si4+ species.56 As for the Zr 3d signal (Fig. 3b), Zr 3d5/2 exhibits a peak at 185.7 eV, and Zr 3d3/2 exhibits a peak at 183.3 eV, which imply the presence of Zr4+ species.57 Meanwhile, the binding energy changes to 184.8 eV and 182.6 eV for ZrMo-KIT-6, indicating the interaction between Zr and Mo species. This phenomenon further confirms the conclusion obtained from H2-TPR characterization. In addition, the Mo 3d (Fig. 3c) signal has two contributions. In particular, the signals at 235.9 eV and 232.7 eV are attributed to 3d5/2 and 3d3/2 of Mo6+,58 further demonstrating the Raman and UV-vis results. For the O 1s signal (Fig. 3d), the large peak at 532.8 eV is assigned to the Si–O bond. Meanwhile, the Zr–O and Mo–O bonds are observed at 530.2 eV.59
 | ||
| Fig. 3 XPS spectra of (a) Si 2p, (b) Zr 3d, (c) Mo 3d, and (d) O 1s spectra of KIT-6, Zr-KIT-6, Mo-KIT-6, and ZrMo-KIT-6. | ||
3.3 Acidic characteristics
The NH3-TPD pattern was used to analyze the acidic property of materials. As shown in Fig. 4a, KIT-6, Zr-KIT-6, and Mo-KIT-6 exhibit weak peaks, implying the poor acidic properties of these three samples. As for the ZrMo-KIT-6 sample, a wide peak at 100–400 °C is observed, showing the presence of abundant acid sites. Furthermore, the acid sites in the ZrMo-KIT-6 material are distinguished by the pyridine-IR spectra. As shown in Fig. 4b, the bands at 1540 and 1640 cm−1, which are caused by the pyridine adsorbed on the Brønsted acid sites in the materials, can be confirmed. The bands at 1450, 1575, and 1610 cm−1 are the diagnostic bands for Lewis acid sites. Meanwhile, the band at 1490 cm−1 is ascribed to the combination of Brønsted (band at 1450 cm−1) and Lewis (band at 1540 cm−1) acid sites in ZrMo-KIT-6.60–62 In addition, the ZrMo-KIT-6 material shows more Brønsted acid sites than the other three samples, which can be further confirmed by DFT calculations. The pyridine-IR spectra achieved after treating at 150 °C, 250 °C, and 400 °C were used to study the strength of Brønsted acid sites in ZrMo-KIT-6. As shown in Table S1 and Fig. S3,† the Brønsted acid sites can also be found even after treating at 250 °C and 400 °C, implying the presence of excellent Brønsted acid sites in the ZrMo-KIT-6.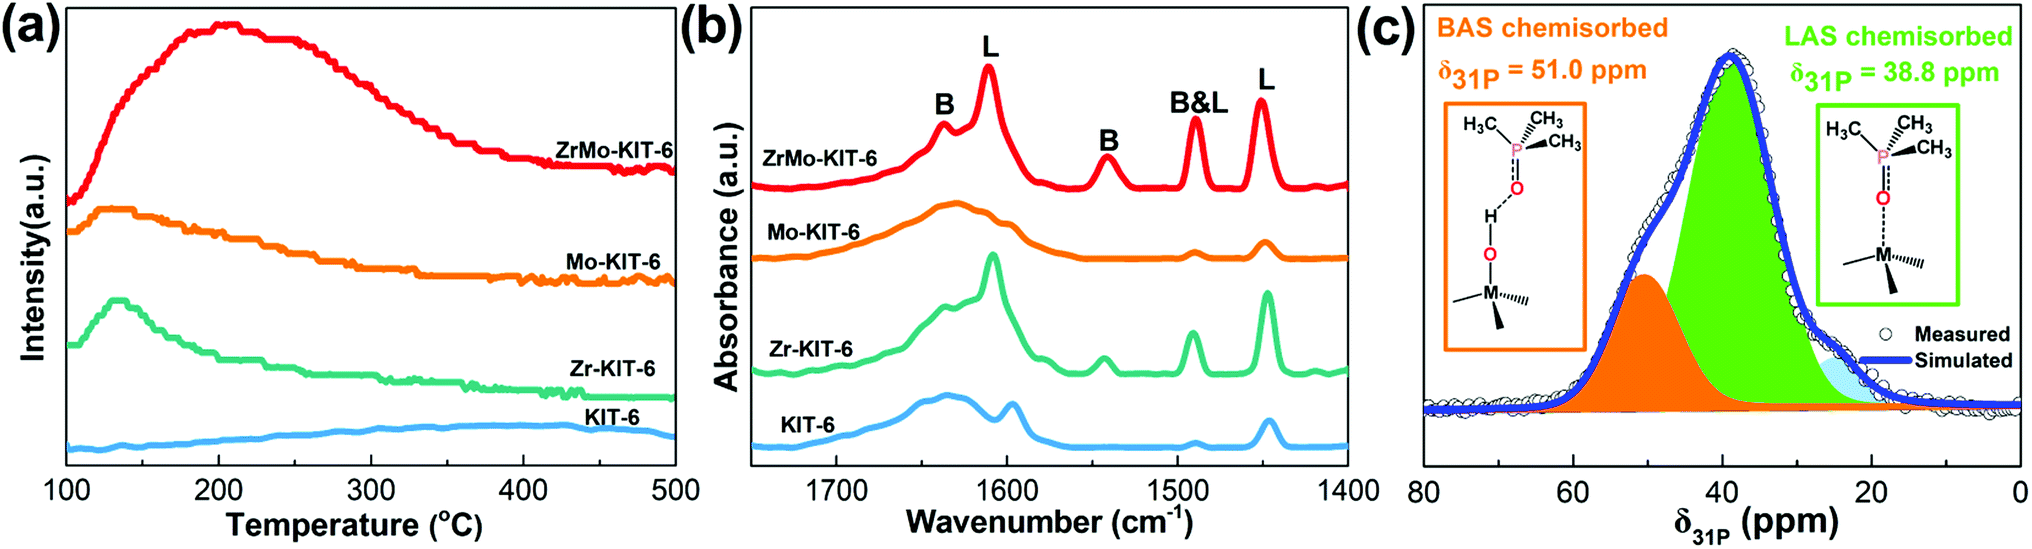 | ||
| Fig. 4 (a) NH3-TPD and (b) FT-IR spectra of adsorbed pyridine of KIT-6, Zr-KIT-6, Mo-KIT-6, and ZrMo-KIT-6; (c) 31P MAS NMR spectra and signal assignment of TMPO adsorbed on ZrMo-KIT-6. | ||
The Brønsted and Lewis acid sites of ZrMo-KIT-6 were also investigated by 31P MAS NMR using TMPO as a probe molecule. The signal over 50.0 ppm (δ31P) is typical of TMPO adsorbed on Brønsted acid sites.63,64 The signal at 38.8 ppm (δ31P) is due to TMPO being adsorbed on Lewis acid sites.65,66 As shown in Fig. 4c and S4,† both Brønsted and Lewis acid sites are detected in the ZrMo-KIT-6 material, further confirming the conclusion obtained from pyridine-IR spectra.
3.4 DFT results
Theoretical simulations were carried out to explore the Brønsted acid site of KIT-6, Zr-KIT-6, Mo-KIT-6, and ZrMo-KIT-6 materials. The optimal models of these solid acid catalysts are shown in Fig. 5. The deprotonation energies of these catalysts were calculated to evaluate the Brønsted acid site, and the low deprotonation energy implies the easy formation of the Brønsted acid site and excellent catalytic performance. As shown in Fig. 5, the KIT-6 catalyst has the largest deprotonation energy (1265 kJ mol−1), which provides a solid evidence for the difficulty in the formation of Brønsted acid site. As the introduction of Zr or Mo species, the deprotonation energy decreases to 1242 kJ mol−1 or 1253 kJ mol−1. Among these catalysts, ZrMo-KIT-6 has the lowest deprotonation energy (1221 kJ mol−1), indicating the easy formation of the Brønsted acid site in ZrMo-KIT-6. In addition, as proved by WXRD and HRTEM characterizations, t-ZrO2 appears in the ZrMo-KIT-6 material. For investigating the influence of t-ZrO2 in Brønsted acid site, the multisubstituted Zr-KIT-6 model was also investigated. As shown in Fig. S5,† multisubstituted Zr-KIT-6 exhibits a higher deprotonation energy (1232 kJ mol−1) than the ZrMo-KIT-6 material, further demonstrating that the synergistic effect of Zr and Mo improves the formation of Brønsted acid site.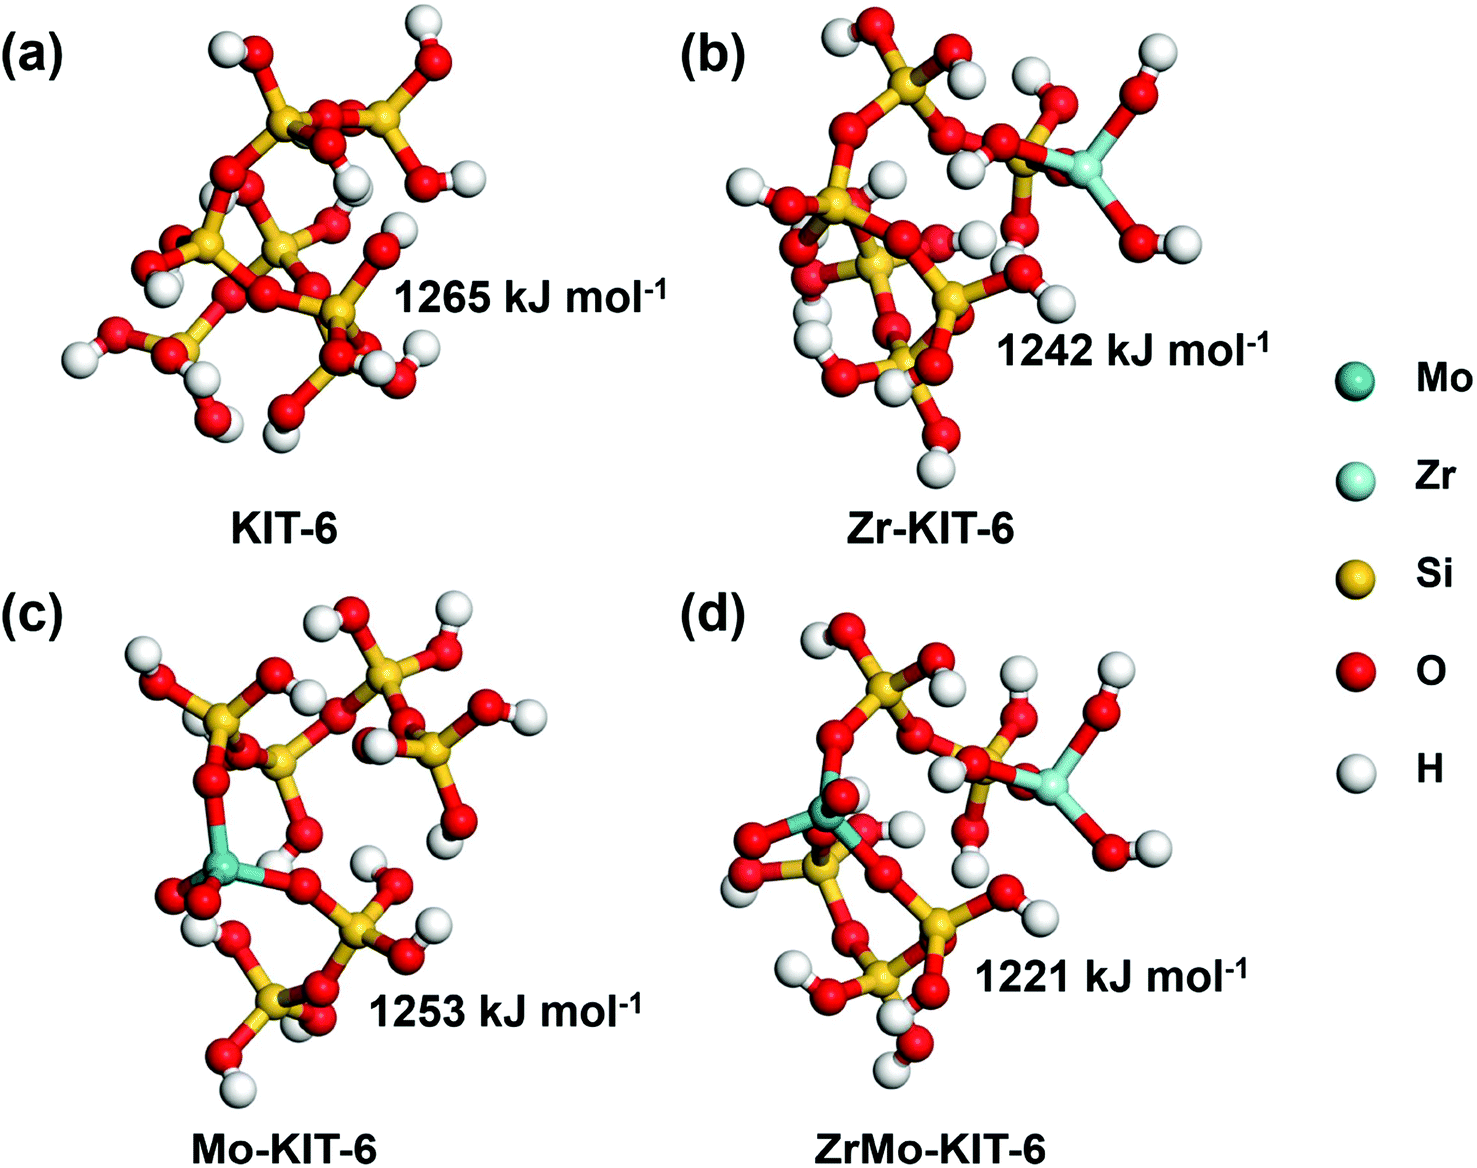 | ||
| Fig. 5 Deprotonation energies of calculation models: (a) KIT-6, (b) Zr-KIT-6, (c) Mo-KIT-6, and (d) ZrMo-KIT-6. | ||
These energies are associated with many aspects, but the most significant is the chemical environment of the deprotonated silanols. In the deprotonation reaction, the proton is carried away from the hydroxyl group of the silanols, which results in oxygen anion. Subsequently, this conjugate base is stabilized by nearby chemical groups. As shown in Fig. S6,† this oxygen anion exhibits two strong hydrogen bonds with the adjacent hydroxyl groups and the average hydrogen bond distance is 1.58 Å in the KIT-6. In contrast, the average hydrogen bond distance is 1.50 Å with the introduction of Mo species. This is attributed to the Mo![[double bond, length as m-dash]](https://www.rsc.org/images/entities/char_e001.gif) O bonds, which possess strong tendency to attract electrons, create electron-deficient properties and increase the Brønsted acidity of hydroxyl groups. Compared with KIT-6 and Mo-KIT-6, the conjugate base of silanol in Zr-KIT-6 is stabilized through the coordinate bond rather than H bonds. This coordinate bond formed between oxygen anion (electron pair donors) and Zr ion (electron pair acceptors) is stronger than the H bonds, leading to lower deprotonation energy and stronger acidity. Similar coordinate bond is created in the deprotonation process of ZrMo-KIT-6, the conjugate base is further stabilized by the MoO bonds. This synergistic effect of isolated Zr and Mo favors the formation of Brønsted acid sites. As for the Lewis acid sites, it can be found that the introduced Zr species play a vital role by comparing the Lewis acid sites of KIT-6 and Zr-KIT-6 materials. In addition, the Lewis acid site of ZrMo-KIT-6 is higher than Zr-KIT-6, implying the introduced Mo species, especially oligomeric MoOx species, improve the Lewis acid sites of ZrMo-KIT-6.
O bonds, which possess strong tendency to attract electrons, create electron-deficient properties and increase the Brønsted acidity of hydroxyl groups. Compared with KIT-6 and Mo-KIT-6, the conjugate base of silanol in Zr-KIT-6 is stabilized through the coordinate bond rather than H bonds. This coordinate bond formed between oxygen anion (electron pair donors) and Zr ion (electron pair acceptors) is stronger than the H bonds, leading to lower deprotonation energy and stronger acidity. Similar coordinate bond is created in the deprotonation process of ZrMo-KIT-6, the conjugate base is further stabilized by the MoO bonds. This synergistic effect of isolated Zr and Mo favors the formation of Brønsted acid sites. As for the Lewis acid sites, it can be found that the introduced Zr species play a vital role by comparing the Lewis acid sites of KIT-6 and Zr-KIT-6 materials. In addition, the Lewis acid site of ZrMo-KIT-6 is higher than Zr-KIT-6, implying the introduced Mo species, especially oligomeric MoOx species, improve the Lewis acid sites of ZrMo-KIT-6.
3.5 Catalytic performance
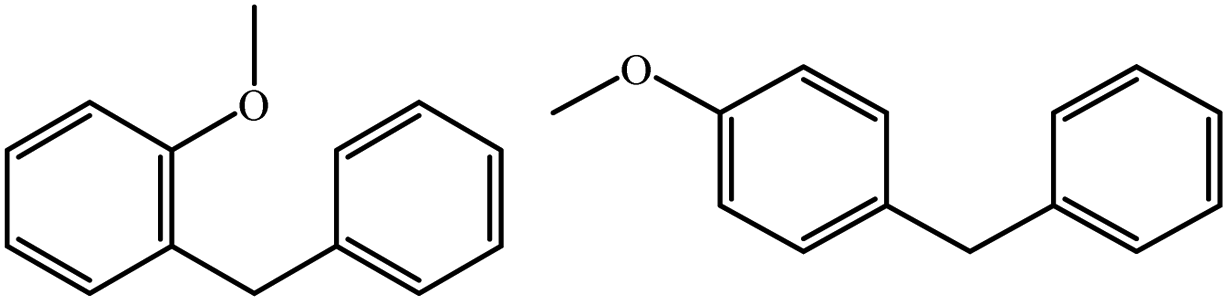
The FC benzylation reaction (Scheme 1) is a significant strategy to synthesize different kinds of diarylalkanes in organic chemistry.67–69 The benzylation of anisole with BzOH reacts on the Brønsted acid sites, and the self-etherification step of BzOH to DBE happens on the Lewis acid sites. In addition, DBE also acts as an alkylating agent to produce the BA products.33 As shown in Fig. 6a, KIT-6, Zr-KIT-6, and Mo-KIT-6 exhibit poor catalytic performance, and this result is ascribed to the few Brønsted acid sites in these three samples. As for the ZrMo-KIT-6 catalyst, the conversion of BzOH reaches 100% and the selectivity of BA reaches 97.4%, illustrating the excellent catalytic performance of ZrMo-KIT-6 catalysts. In conclusion, the Brønsted acidity and yield of BA have a linear relation with deprotonation energies, meaning that the catalytic performance is associated with the acidity and chemical environment of hydroxyl group. In addition, the TOF values are calculated based on the strength of Brønsted acidity between different temperatures. As shown in Table S2,† the TOF values of Zr-KIT-6 and ZrMo-KIT-6 with strength of Brønsted acidity between 150–250 °C are higher than others. Therefore, we deduce that the Brønsted acid site with strength between 150–250 °C is the optimal active site for FC benzylation.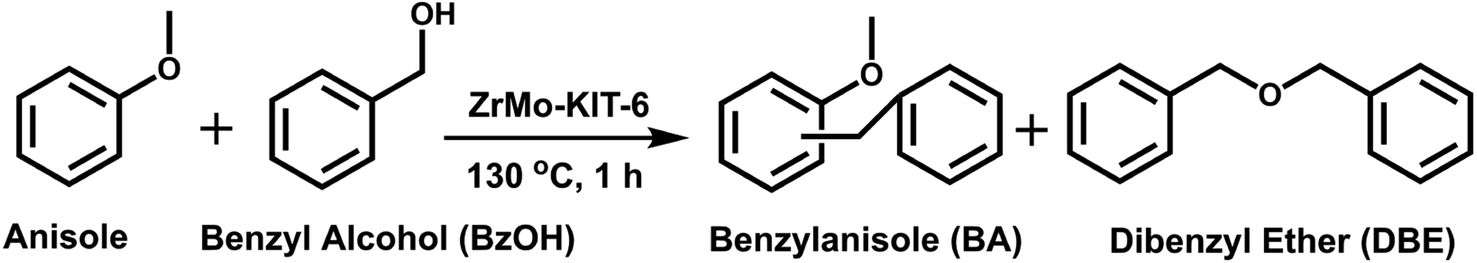 | ||
| Scheme 1 Friedel–Crafts benzylation of anisole with BzOH over ZrMo-KIT-6. | ||
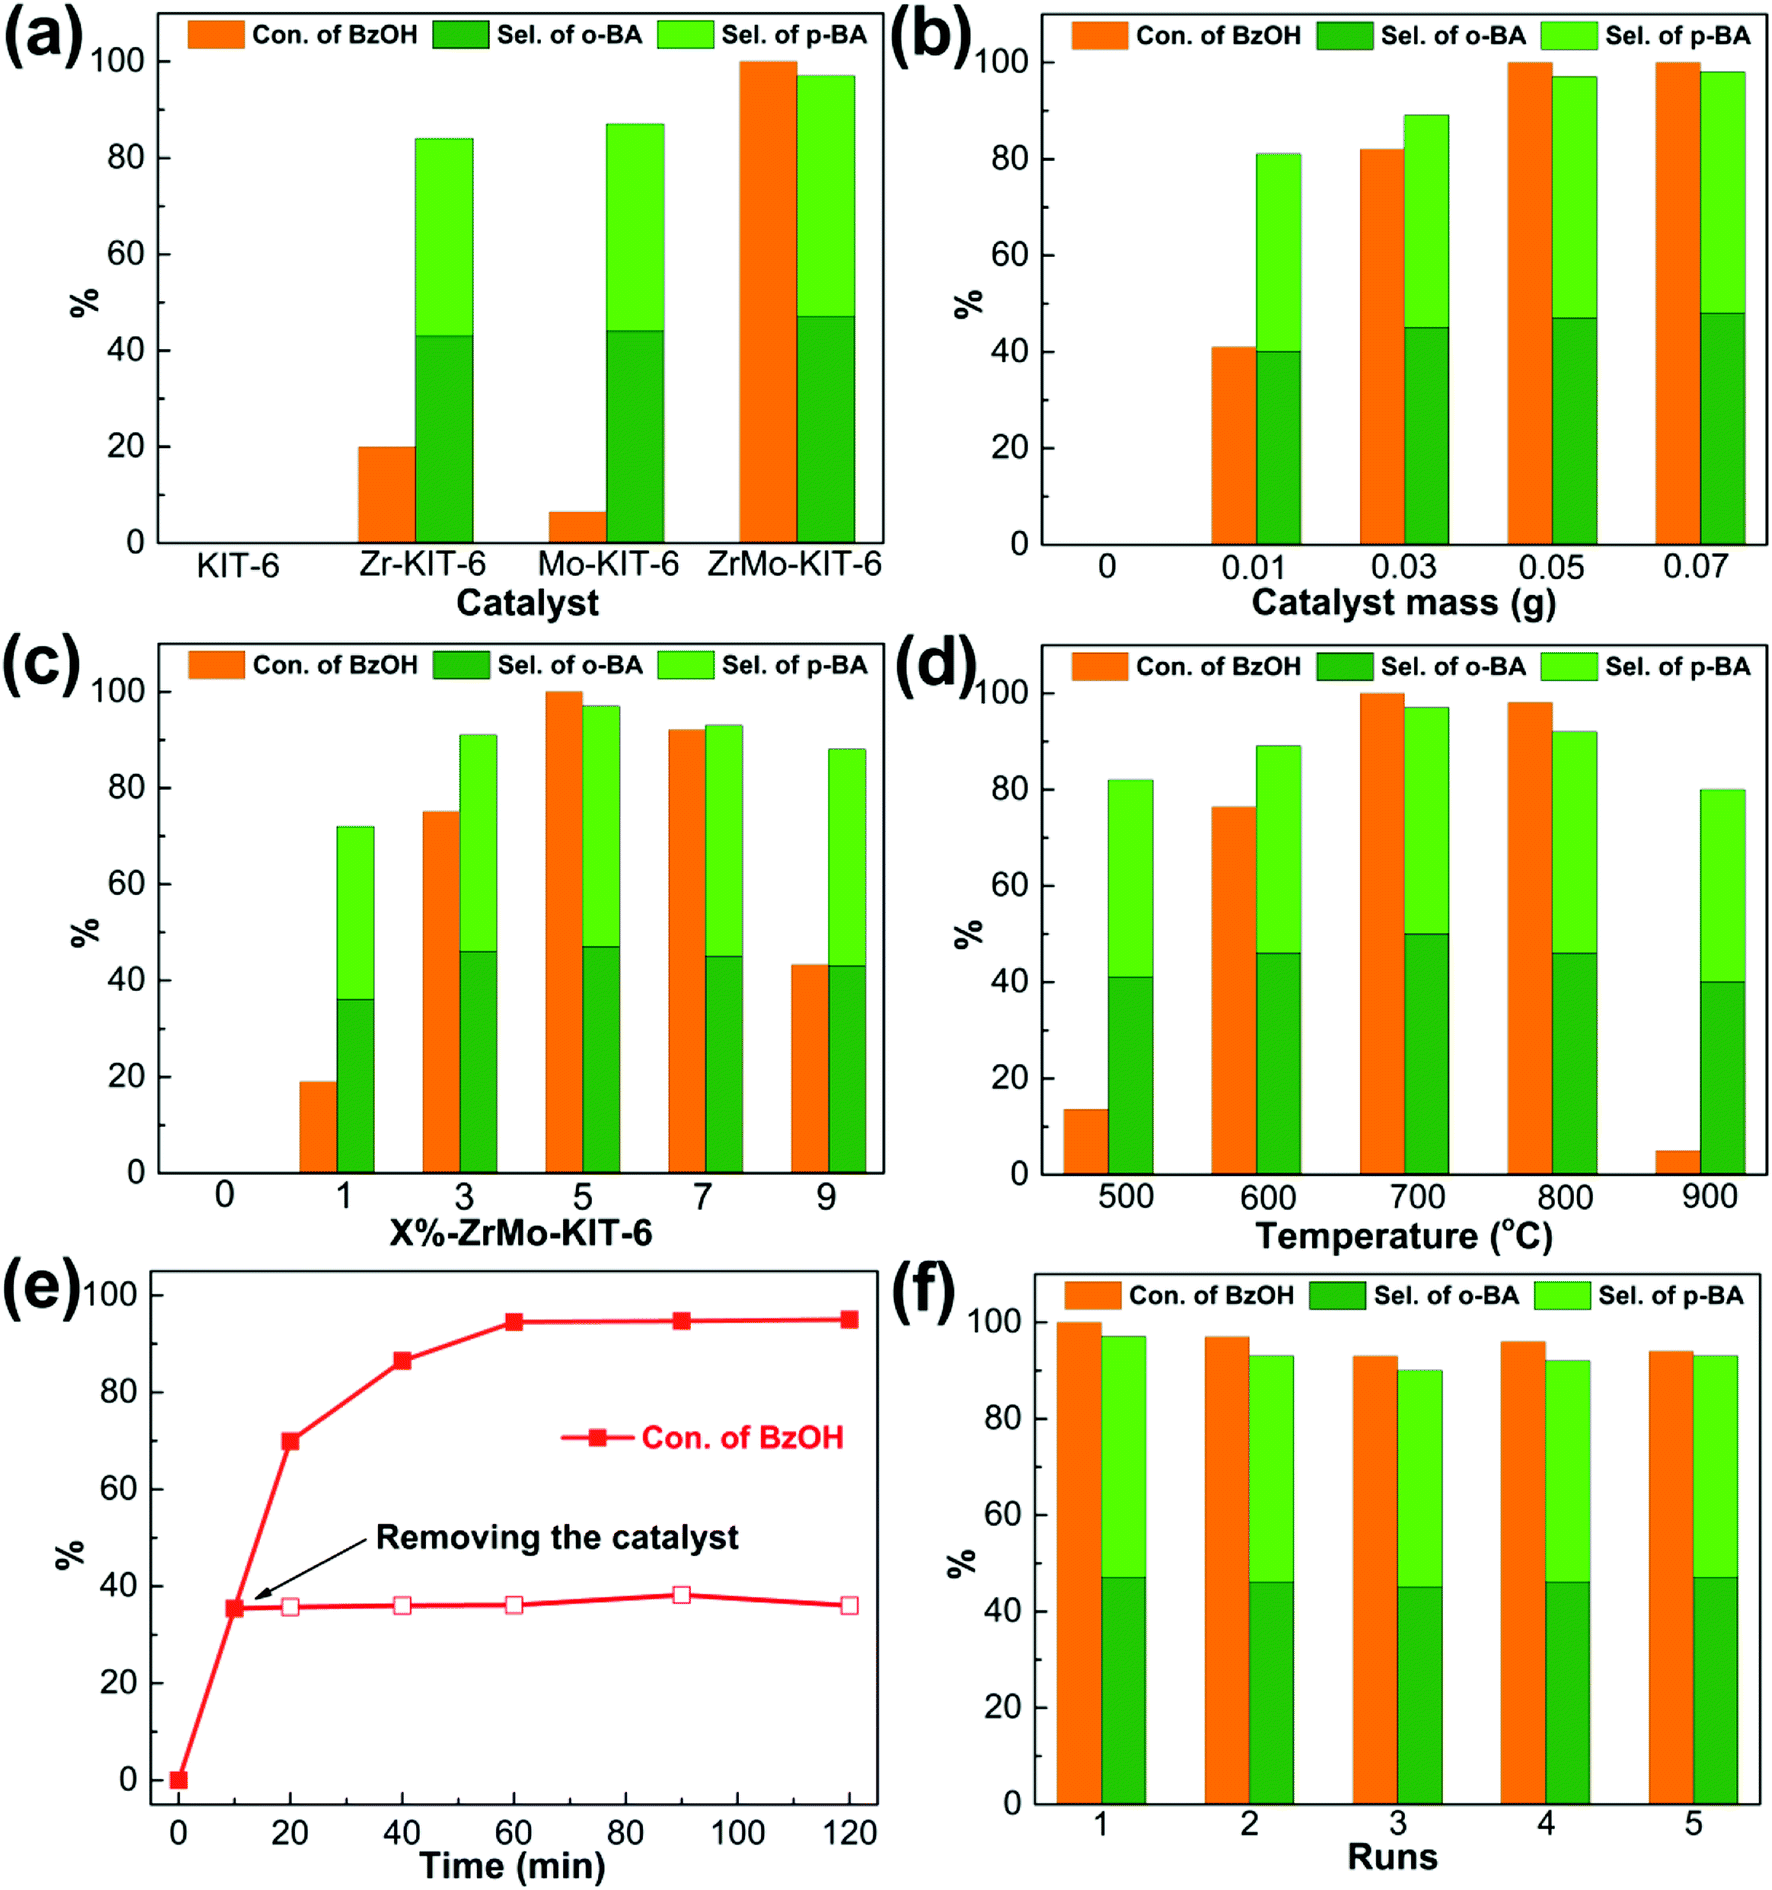 | ||
| Fig. 6 Friedel–Crafts benzylation of anisole with BzOH over ZrMo-KIT-6: (a) catalyzed by KIT-6, Zr-KIT-6, Mo-KIT-6, and ZrMo-KIT-6, (b) different catalyst mass, (c) ZrMo-KIT-6 with different Zr and Mo contents, (d) ZrMo-KIT-6 treated at different temperature, (e) different times and leaching test, and (f) recyclability of ZrMo-KIT-6 (reaction conditions: anisole 100 mmol, BzOH 10 mmol, catalyst 50 mg, 130 °C, 1 h). | ||
The effect of catalyst amount was tested and displayed in Fig. 6b, the conversion of BzOH and selectivity of BA gradually increase as the increasing of catalyst amount from 0 to 0.05 g, implying that sufficient acid sites are beneficial for improving the catalytic performance. The benzylation of different arenes over ZrMo-KIT-6 was shown in Table 3. The ZrMo-KIT-6 exhibits excellent catalytic performance for the benzylation with different arenes. In addition, compared with the catalytic performance in literature reports (Table S3†), the superiority of ZrMo-KIT-6 over other solid acid catalysts indicates that it is a promise solid acid catalyst for benzylation reaction.
| Entry | Arenes | Major benzylation products | Con. (%) | Sel. (%) |
|---|---|---|---|---|
| a Reaction conditions: arenes 100 mmol, BzOH 10 mmol, catalyst 50 mg, 130 °C, 1 h.b Reaction conditions: arenes 100 mmol, BzOH 10 mmol, catalyst 50 mg, 110 °C, 2 h.c Reaction conditions: arenes 100 mmol, BzOH 10 mmol, catalyst 50 mg, 130 °C, 2 h. | ||||
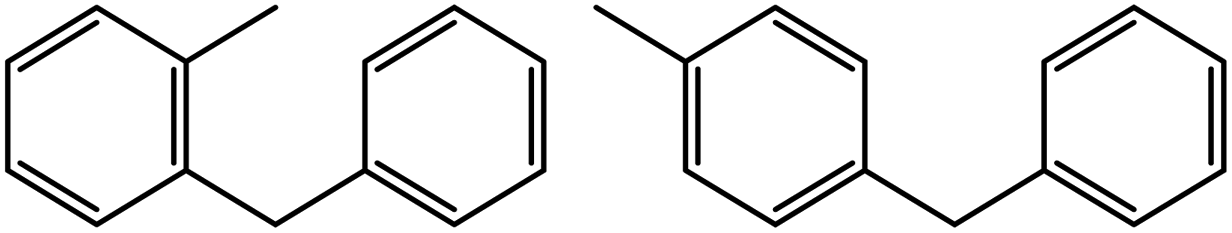
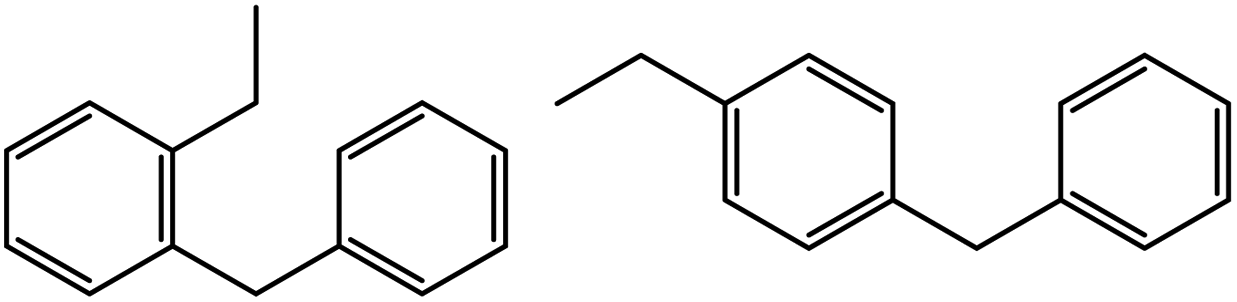
| 1a |  |
 |
100 | 49![[thin space (1/6-em)]](https://www.rsc.org/images/entities/char_2009.gif) :48 :48 |
| 2a |  |
 |
100 | 100 |
| 3b | 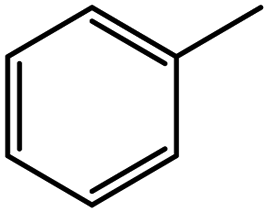 |
 |
68 | 35:35 |
| 4c | 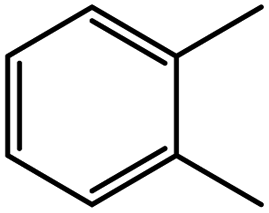 |
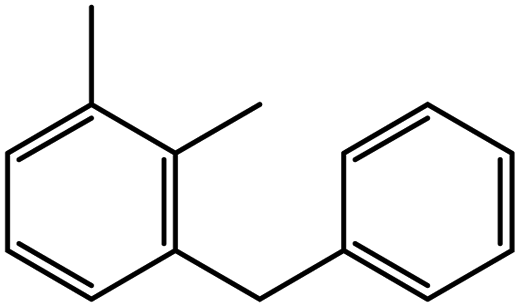 |
100 | 90 |
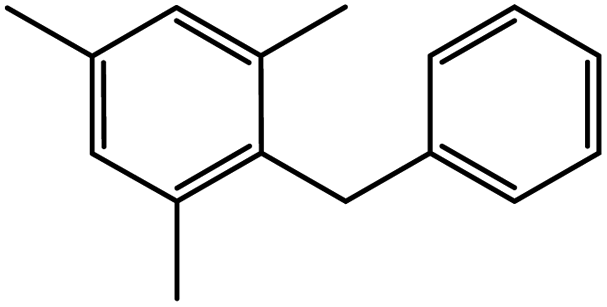
| 5c | 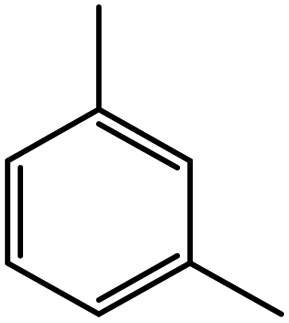 |
 |
100 | 17:75 |
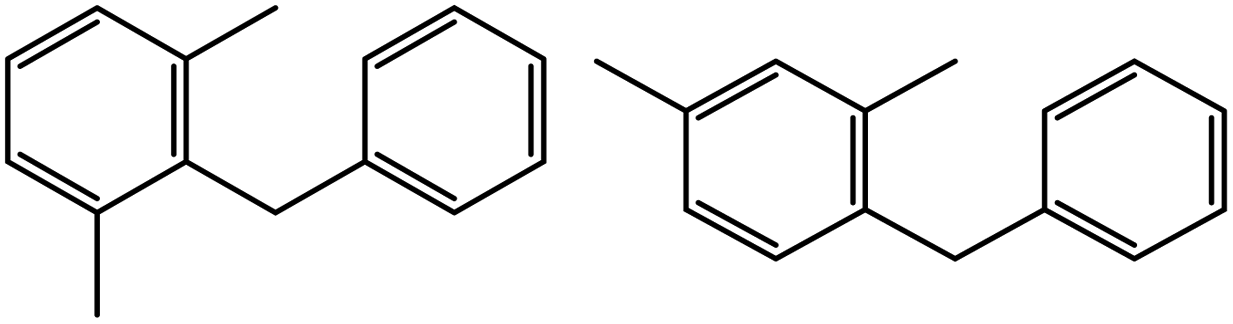
| 6c | 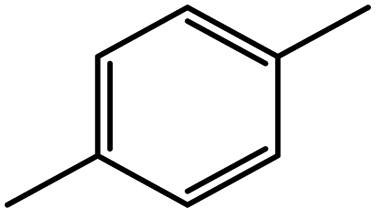 |
 |
90 | 82 |
| 7c |  |
 |
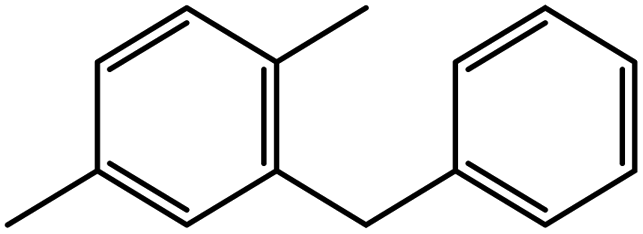
88 | 47:37 |
| 8c | 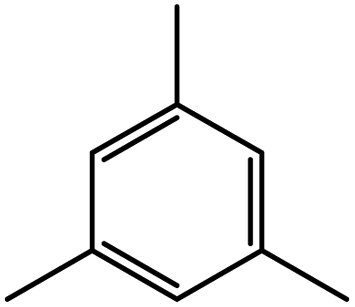 |
 |
100 | 97 |
The effect of Zr and Mo contents on the acidity, conversion of BzOH and the selectivity of BA were investigated and optimized. As shown in Fig. S7,† 6c and Table S4,† the acidity and catalytic performance are improved with the increase of Zr and Mo contents, and the optimal catalytic activity is obtained for 5%-ZrMo-KIT-6 among all the catalysts. The conversion of BzOH and the selectivity of BA begin to decrease with the increase of Zr and Mo contents to 7% and 9%, respectively. The acidity and catalytic performance of ZrMo-KIT-6 after treating at different temperatures were also investigated. The ZrMo-KIT-6 materials calcined at 500–900 °C were used in benzylation reaction, and the results are displayed in Fig. S8† and 6d. When the calcination temperature is under 700 °C, the conversion and selectivity slightly enhance to 100% and 97.4%, respectively. However, the catalytic performance is attenuated, and the catalyst treated at 900 °C only shows poor conversion of BzOH (5.0%).
As an important parameter for evaluating solid acid catalysts, the heterogeneity and reutilization of ZrMo-KIT-6 were examined. As shown in Fig. 6e, the conversion of BzOH changes little after removing the catalyst at 10 min, confirming the heterogeneity of the catalytic system. Meanwhile, we performed five runs over ZrMo-KIT-6 under the above-mentioned optimized reaction conditions (Fig. 6f) to check the reutilization of catalysts. No decrease in conversion of BzOH and selectivity of BA happens, implying that ZrMo-KIT-6 can be recycled as a solid acid catalyst in benzylation reaction.
The textural properties and chemical bonds of ZrMo-KIT-6 catalyst after five cycles were detailedly investigated. As displayed in Fig. 7, the (211), (200), and (420) reflections are clearly detected. In addition, H1-type hysteresis loop and narrow pore size distribution are observed, implying the preservation of ordered mesostructure. The textural properties (specific surface area, pore size, and pore volume) and ordered mesostructure have little change after five cycles (Fig. S9 and S10†).
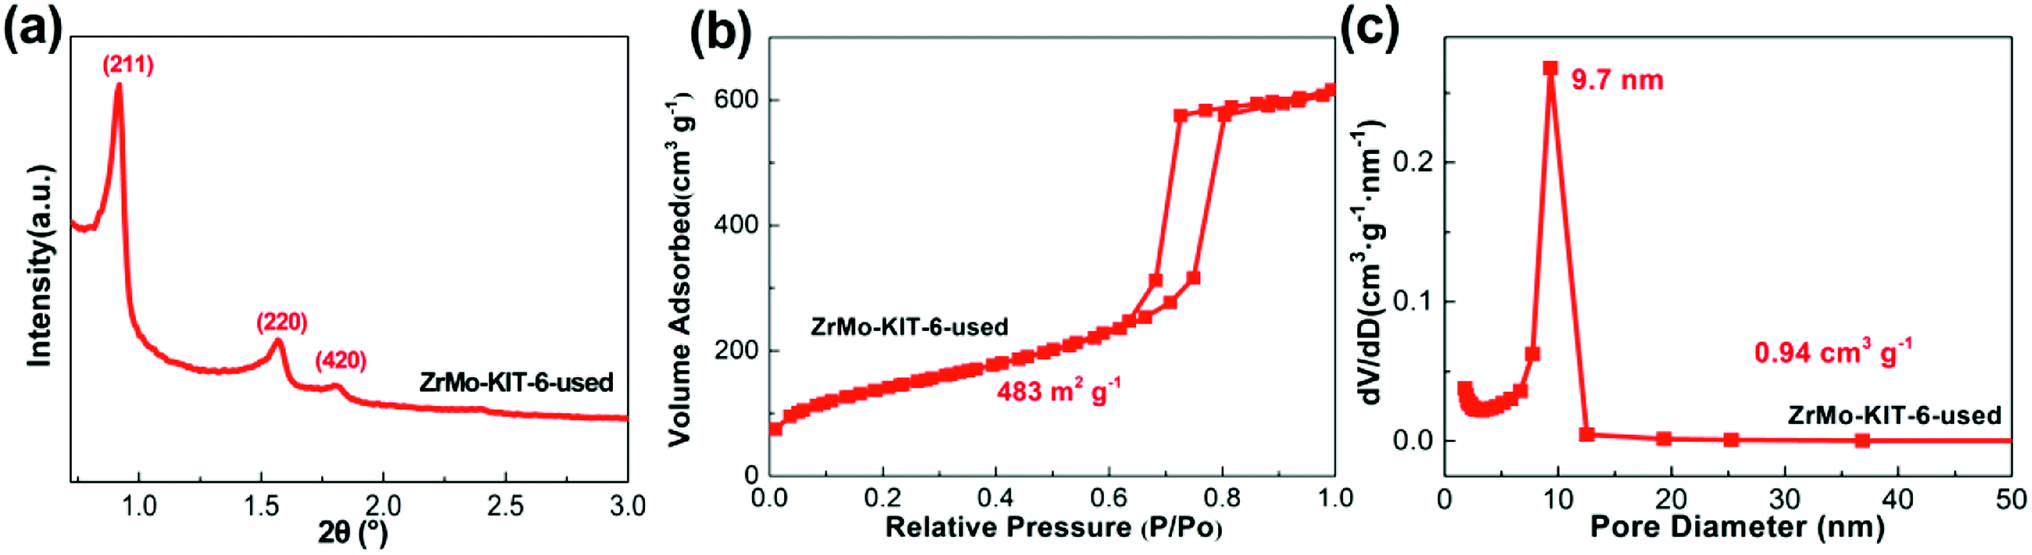 | ||
| Fig. 7 (a) SXRD pattern, (b) isotherms, and (c) pore size distribution of ZrMo-KIT-6 catalyst after five cycles. | ||
Apart from the textural properties, the chemical bonds change little even after five runs (Fig. 8 and 9). The contents of Zr and Mo species before and after reaction are investigated by the XPS, EDS, and XRF characterizations. As shown in Table 2, the Zr and Mo contents in ZrMo-KIT-6-used catalyst have no obvious change compared with the fresh catalyst. As a result, the ZrMo-KIT-6 is a robust Brønsted solid acid catalyst for FC benzylation reaction.
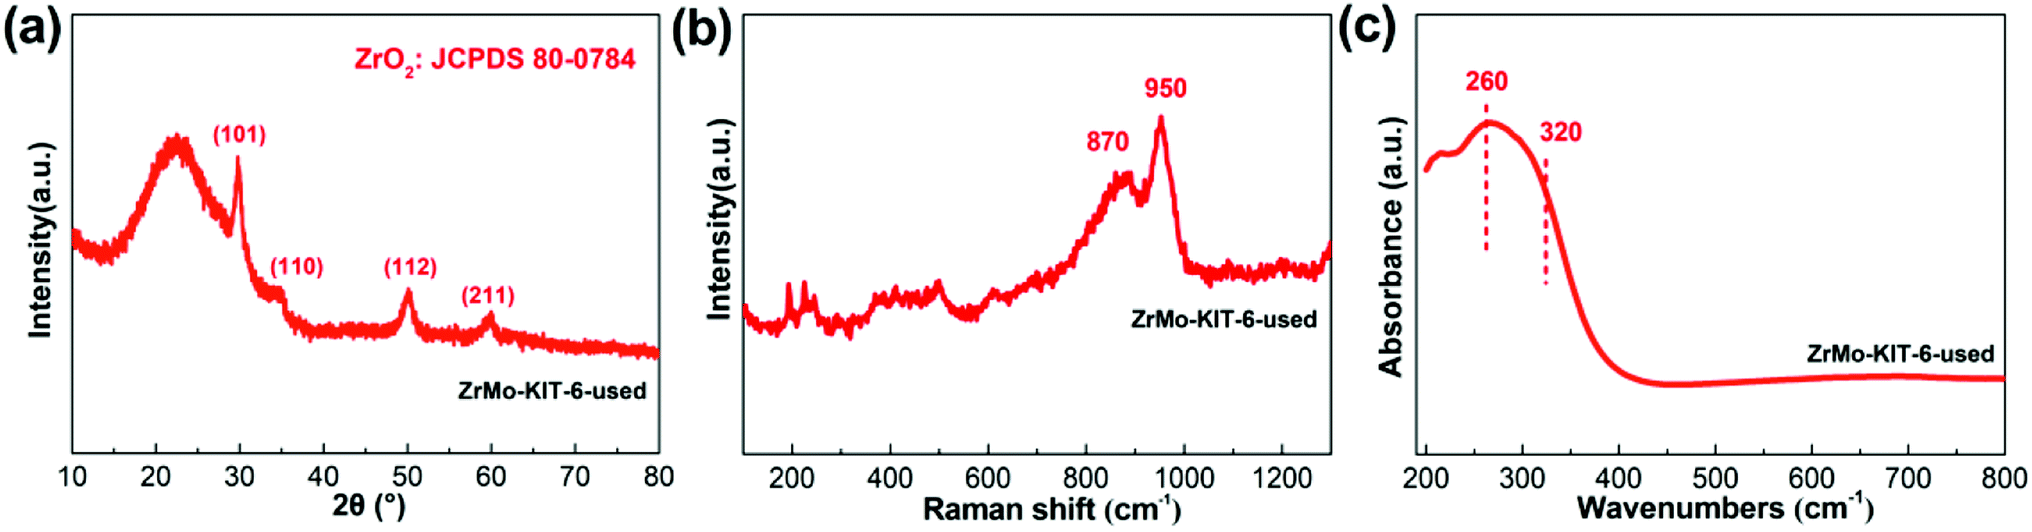 | ||
| Fig. 8 (a) WXRD pattern, (b) Raman spectra, and (c) UV-vis spectra of ZrMo-KIT-6 catalyst after five cycles. | ||
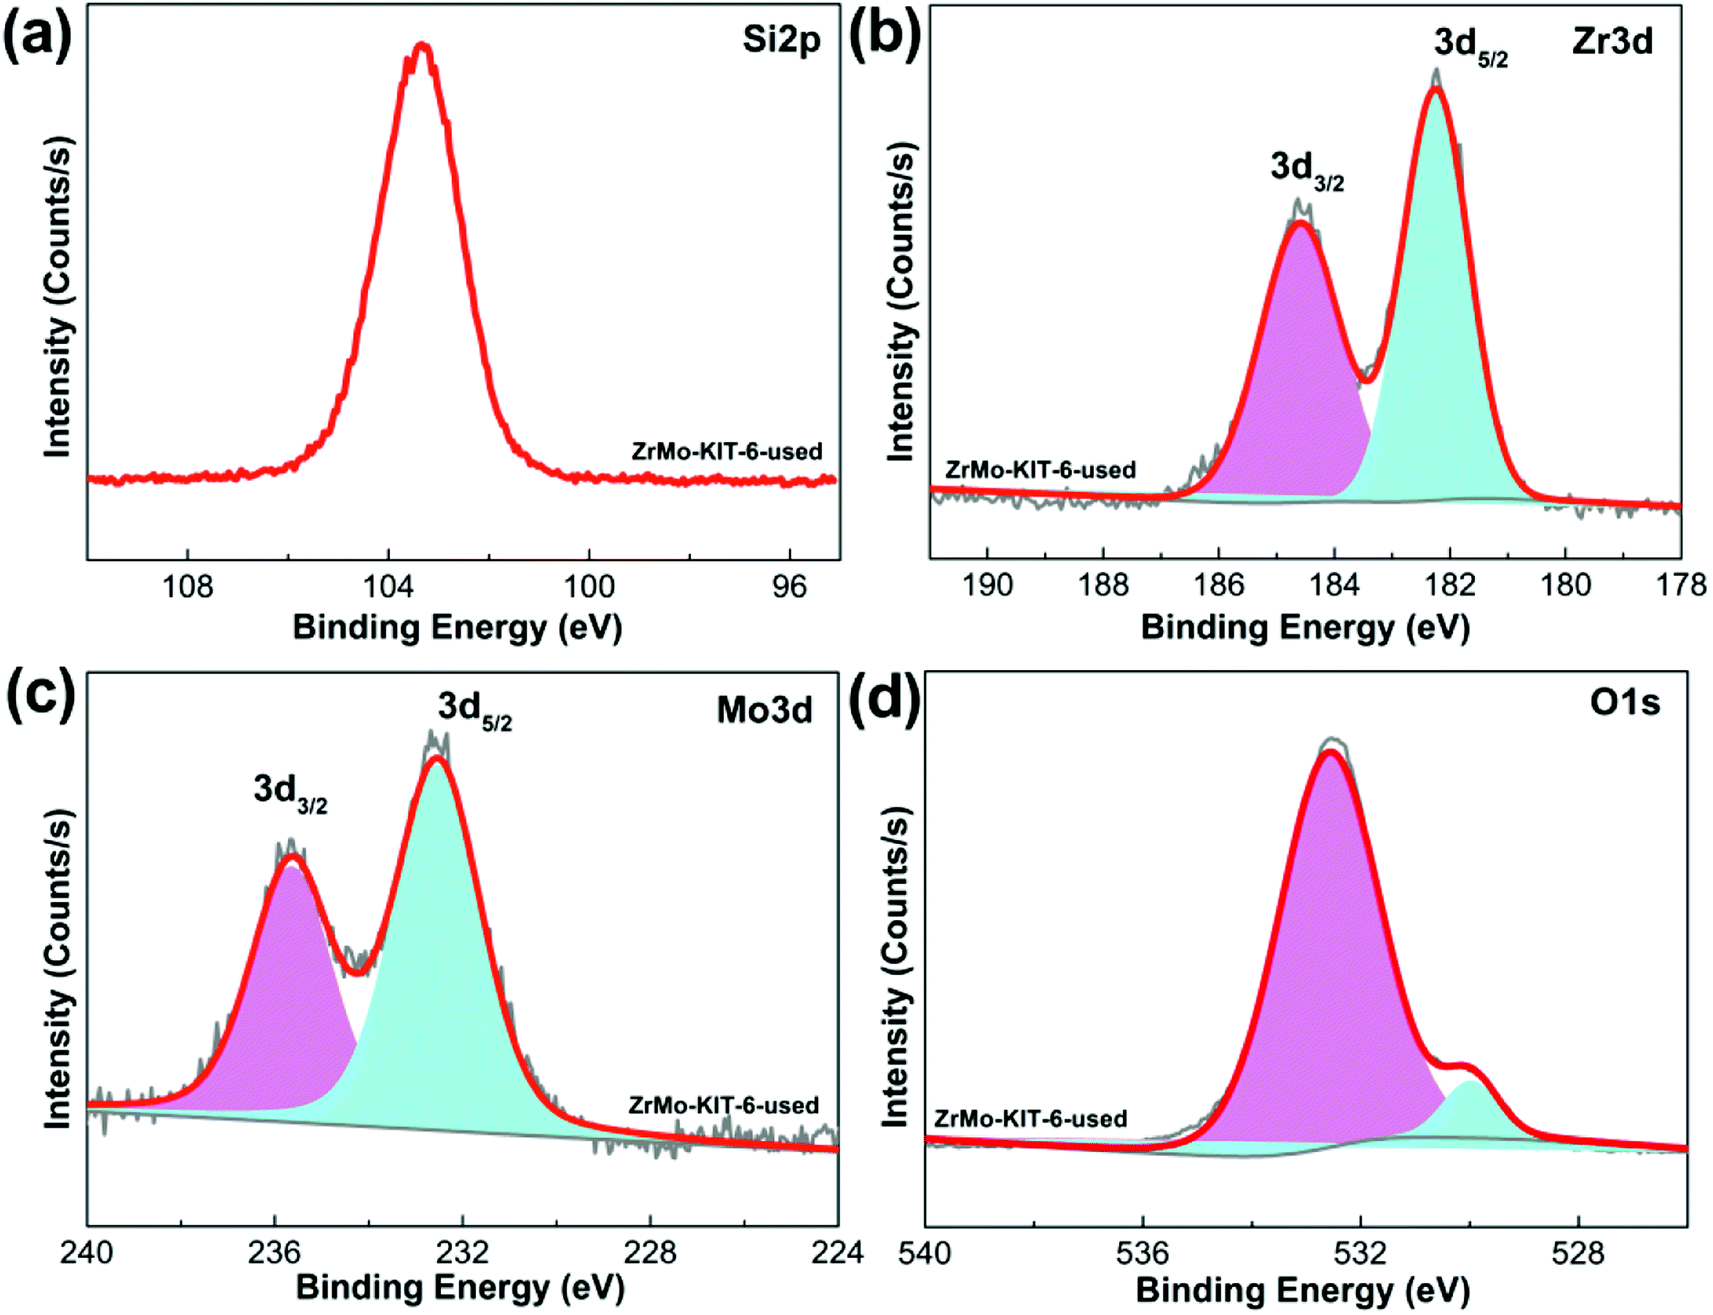 | ||
| Fig. 9 XPS spectra of (a) Si 2p, (b) Zr 3d, (c) Mo 3d, and (d) O 1s spectra of ZrMo-KIT-6 catalyst after five cycles. | ||
4. Conclusion
In this paper, KIT-6, Zr-KIT-6, Mo-KIT-6, and ZrMo-KIT-6 solid acid catalysts are designed and synthesized. The textural properties, chemical bonds, and acidic properties of these catalysts are explored. Theoretical calculation reproduces experimental trend of acidity, suggesting that the synergistic effect of Zr and Mo species improves the formation of Brønsted acid sites. The as-obtained ZrMo-KIT-6 solid acid catalysts are used for FC benzylation reaction, and the outstanding catalytic performance of the ZrMo-KIT-6 catalyst indicates that it is an excellent Brønsted solid acid catalyst.Conflicts of interest
The authors declare that they have no known competing financial interests or personal relationships that could have appeared to influence the work reported in this paper.Acknowledgements
We sincerely acknowledge the financial support of the Natural Science Foundation of China (21703121 and 22078179), the Natural Science Foundation of Shandong Province (ZR2020QB048), and the Taishan Scholar Foundation (tsqn201812063), open fund by Jiangsu Key Laboratory of Atmospheric Environment Monitoring and Pollution Control (KHK2010), open fund by National & Local Joint Engineering Research Center for Mineral Salt Deep Utilization, Huaiyin Institute of Technology (SF201908).References
- M. Barbero, S. Cadamuro, S. Dughera, M. Rucci, G. Spano and P. Venturello, Tetrahedron, 2014, 70, 1818–1826 Search PubMed.
- Z. Miao, Z. Li, J. Zhao, W. Si, J. Zhou and S. Zhuo, Mol. Catal., 2018, 444, 10–21 Search PubMed.
- C. Wen, J. Xu, X. Wang and Y. Fan, Energy Fuels, 2020, 34, 9498–9508 Search PubMed.
- H. Imai, M. Abe, K. Terasaka, H. Yamazaki, R. Osuga, J. N. Kondo and T. Yokoi, Fuel Process. Technol., 2020, 197, 106182 Search PubMed.
- X. Sun, J. Wang, J. Chen, J. Zheng, H. Shao and C. Huang, Microporous Mesoporous Mater., 2018, 259, 238–243 Search PubMed.
- Q. Shu, G. Tang, H. Lesmana, L. Zou and D. Xiong, Renewable Energy, 2018, 119, 253–261 Search PubMed.
- S. V. Tsukanov, M. D. Johnson, S. A. May, M. Rosemeyer, M. A. Watkins, S. P. Kolis, M. H. Yates and J. N. Johnston, Org. Process Res. Dev., 2016, 20, 215–226 Search PubMed.
- T. D. Swift, C. Bagia, V. Choudhary, G. Peklaris, V. Nikolakis and D. G. Vlachos, ACS Catal., 2013, 4, 259–267 Search PubMed.
- A. Mahajan and P. Gupta, Environ. Chem. Lett., 2019, 18, 299–314 Search PubMed.
- P. Gupta and S. Paul, Catal. Today, 2014, 236, 153–170 Search PubMed.
- P. Liu, Z. Li, X. Liu, W. Song, B. Peng, X. Zhang, S. Nie, P. Zeng, Z. Zhang, X. Gao and B. Shen, ACS Catal., 2020, 10, 9197–9214 Search PubMed.
- W. Gong, Y. Liu, H. Li and Y. Cui, Coord. Chem. Rev., 2020, 420, 213400 Search PubMed.
- Z. Miao, J. Zhou, J. Zhao, D. Liu, X. Bi, L. Chou and S. Zhuo, Appl. Surf. Sci., 2017, 411, 419–430 Search PubMed.
- S. Li, C. Jin, N. Feng, F. Deng, L. Xiao and J. Fan, Catal. Commun., 2019, 123, 54–58 Search PubMed.
- S. R. Matkovic, M. Bosco, S. E. Collins and L. E. Briand, Appl. Surf. Sci., 2019, 495, 143565 Search PubMed.
- J. Jiang, F. Gandara, Y. B. Zhang, K. Na, O. M. Yaghi and W. G. Klemperer, J. Am. Chem. Soc., 2014, 136, 12844–12847 Search PubMed.
- V. C. Nguyen, A. Dandach, T. T. H. Vu, P. Fongarland and N. Essayem, Mol. Catal., 2019, 476, 110518 Search PubMed.
- C. A. Trickett, T. M. Osborn Popp, J. Su, C. Yan, J. Weisberg, A. Huq, P. Urban, J. Jiang, M. J. Kalmutzki, Q. Liu, J. Baek, M. P. Head-Gordon, G. A. Somorjai, J. A. Reimer and O. M. Yaghi, Nat. Chem., 2019, 111, 70–176 Search PubMed.
- W. Gong, D. Chu, H. Jiang, X. Chen, Y. Cui and Y. Liu, Nat. Commun., 2019, 10, 600 Search PubMed.
- C. Schroeder, V. Siozios, C. Mück-Lichtenfeld, M. Hunger, M. R. Hansen and H. Koller, Chem. Mater., 2020, 32, 1564–1574 Search PubMed.
- K. Larmier, C. Chizallet, S. Maury, N. Cadran, J. Abboud, A. F. Lamic-Humblot, E. Marceau and H. Lauron-Pernot, Angew. Chem., Int. Ed., 2017, 56, 230–234 Search PubMed.
- A. M. Jystad, A. Biancardi and M. Caricato, J. Phys. Chem. C, 2017, 121, 22258–22267 Search PubMed.
- G. Skara, R. Baran, T. Onfroy, F. de Proft, S. Dzwigaj and F. Tielens, Microporous Mesoporous Mater., 2016, 225, 355–364 Search PubMed.
- H. Guesmi, R. Grybos, J. Handzlik and F. Tielens, RSC Adv., 2016, 6, 39424–39432 Search PubMed.
- D. C. Tranca, A. Wojtaszek-Gurdak, M. Ziolek and F. Tielens, Phys. Chem. Chem. Phys., 2015, 17, 22402–22411 Search PubMed.
- A. Ramanathan, R. Maheswari, D. H. Barich and B. Subramaniam, Microporous Mesoporous Mater., 2014, 190, 240–247 Search PubMed.
- A. Ramanathan, B. Subramaniam, R. Maheswari and U. Hanefeld, Microporous Mesoporous Mater., 2013, 167, 207–212 Search PubMed.
- C. Pirez, J. M. Caderon, J. P. Dacquin, A. F. Lee and K. Wilson, ACS Catal., 2012, 2, 1607–1614 Search PubMed.
- J. Xu, A. Zheng, J. Yang, Y. Su, J. Wang, D. Zeng, M. Zhang, C. Ye and F. Deng, J. Phys. Chem. B, 2006, 110, 10662–10671 Search PubMed.
- H. Zhu, R. V. Chaudhari, B. Subramaniam, A. Ramanathan and J. F. Wu, AIChE J., 2017, 63, 2888–2899 Search PubMed.
- H. Zhu, A. Ramanathan, J. F. Wu and B. Subramaniam, ACS Catal., 2018, 8, 4848–4859 Search PubMed.
- H. Tao, J. Li, Q. Ma, Z. Chen, X. Zhang, Y. Quan, P. Yang and C. Qi, Chem. Eng. J., 2020, 382, 123045 Search PubMed.
- R. Maheswari, A. Ramanathan, H. Zhu, A. Araújo do Nascimento Araújo, C. Chapman, Y. Tang, F. Tao and B. Subramaniam, J. Catal., 2020, 389, 657–666 Search PubMed.
- B. Li, X. Luo, J. Huang, X. Wang and Z. Liang, Chin. J. Catal., 2017, 38, 518–528 Search PubMed.
- T. W. Kim, F. Kleitz, B. Paul and R. Ryoo, J. Am. Chem. Soc., 2005, 127, 7601–7610 Search PubMed.
- C. A. Emeis, J. Catal., 1993, 141, 347–354 Search PubMed.
- P. G. Seybold and G. C. Shields, Wiley Interdiscip. Rev.: Comput. Mol. Sci., 2015, 5, 290–297 Search PubMed.
- K. S. Alongi and G. C. Shields, Annual Reports in Computational Chemistry, Elsevier, 2010, pp. 113–138 Search PubMed.
- A. D. Becke, J. Chem. Phys., 1993, 98, 5648–5652 Search PubMed.
- S. Grimme, J. Antony, S. Ehrlich and H. Krieg, J. Chem. Phys., 2010, 132, 154104 Search PubMed.
- A. Jystad, H. Leblanc and M. Caricato, J. Phys. Chem. C, 2020, 124, 15231–15240 Search PubMed.
- M. J. Frisch, G. W. Trucks, H. B. Schlegel, G. E. Scuseria, M. A. Robb, J. R. Cheeseman, G. Scalmani, V. Barone, G. A. Petersson, H. Nakatsuji, X. Li, M. Caricato, A. V. Marenich, J. Bloino, B. G. Janesko, R. Gomperts, B. Mennucci, H. P. Hratchian, J. V. Ortiz, A. F. Izmaylov, J. L. Sonnenberg, D. Williams-Young, F. Ding, F. Lipparini, F. Egidi, J. Goings, B. Peng, A. Petrone, T. Henderson, D. Ranasinghe, V. G. Zakrzewski, J. Gao, N. Rega, G. Zheng, W. Liang, M. Hada, M. Ehara, K. Toyota, R. Fukuda, J. Hasegawa, M. Ishida, T. Nakajima, Y. Honda, O. Kitao, H. Nakai, T. Vreven, K. Throssell, J. A. Montgomery Jr, J. E. Peralta, F. Ogliaro, M. J. Bearpark, J. J. Heyd, E. N. Brothers, K. N. Kudin, V. N. Staroverov, T. A. Keith, R. Kobayashi, J. Normand, K. Raghavachari, A. P. Rendell, J. C. Burant, S. S. Iyengar, J. Tomasi, M. Cossi, J. M. Millam, M. Klene, C. Adamo, R. Cammi, J. W. Ochterski, R. L. Martin, K. Morokuma, O. Farkas, J. B. Foresman and D. J. Fox, Gaussian 16 Revision B.01, Gaussian, Inc., Wallingford, CT, 2016 Search PubMed.
- A. Prabhu and M. Palanichamy, Microporous Mesoporous Mater., 2013, 168, 126–131 Search PubMed.
- F. Kleitz, S. Hei Choi and R. Ryoo, Chem. Commun., 2003, 2136–2137 Search PubMed.
- B. Zhou, C. Y. Li, N. Qi, M. Jiang, B. Wang and Z. Q. Chen, Appl. Surf. Sci., 2018, 450, 31–37 Search PubMed.
- M. Thommes, K. Kaneko, A. V. Neimark, J. P. Olivier, F. Rodriguez-Reinoso, J. Rouquerol and K. S. W. Sing, Pure Appl. Chem., 2015, 87, 1051–1069 Search PubMed.
- O. Marie, X. Portier, N. Korsunska and L. Khomenkova, Appl. Catal., B, 2020, 278, 119258 Search PubMed.
- H. Zhao, H. Song, F. Wang, Z. Miao and L. Chou, Mol. Catal., 2020, 495, 111141 Search PubMed.
- T. L. Drake and P. C. Stair, Top. Catal., 2017, 60, 1618–1630 Search PubMed.
- C. Quilfen, T. Tassaing, D. Uzio and C. Aymonier, J. Supercrit. Fluids, 2018, 141, 104–112 Search PubMed.
- E. Dominguez Garcia, J. Chen, E. Oliviero, L. Oliviero and F. Maugé, Appl. Catal., B, 2020, 260, 117975 Search PubMed.
- A. Uchagawkar, A. Ramanathan, Y. Hu and B. Subramaniam, Catal. Today, 2020, 343, 215–225 Search PubMed.
- H. Huang, Z. Zhou, J. Qin, Y. Li, G. Liu and W. Wu, React. Kinet., Mech. Catal., 2020, 130, 363–379 Search PubMed.
- S. Mishra, M. Ali Haider and K. K. Pant, Catal. Lett., 2020, 150, 3653–3666 Search PubMed.
- K. Zhao, L. Jia, J. Wang, B. Hou and D. Li, New J. Chem., 2019, 43, 4130–4136 Search PubMed.
- X. Zhou, J. Ju, Z. Li, M. Zhang, N. Deng, B. Cheng and W. Kang, Ceram. Int., 2017, 43, 9729–9737 Search PubMed.
- A. Ramanathan, H. Zhu, R. Maheswari and B. Subramaniam, Chem. Eng. J., 2015, 278, 113–121 Search PubMed.
- S. Li, C. Cheng, A. Sagaltchik, P. Pachfule, C. Zhao and A. Thomas, Adv. Funct. Mater., 2019, 29, 1807419 Search PubMed.
- J. Iglesias, J. A. Melero, G. Morales, M. Paniagua, B. Hernández, A. Osatiashtiani, A. F. Lee and K. Wilson, Catal. Sci. Technol., 2018, 8, 4485–4493 Search PubMed.
- L. Xing, K. Wei, Q. Li, R. Wang, S. Zhang and L. Wang, Environ. Sci. Technol., 2020, 54, 13944–13952 Search PubMed.
- L. Li, B. Yan, H. Li, S. Yu and X. Ge, Renewable Energy, 2020, 146, 643–650 Search PubMed.
- M. Fan, Z. Si, W. Sun and P. Zhang, Fuel, 2019, 252, 254–261 Search PubMed.
- J. D. Lewis, M. Ha, H. Luo, A. Faucher, V. K. Michaelis and Y. Román-Leshkov, ACS Catal., 2018, 8, 3076–3086 Search PubMed.
- D. Zeng, S. Liu, W. Gong, G. Wang, J. Qiu and H. Chen, Appl. Catal., A, 2014, 469, 284–289 Search PubMed.
- S. Torii, K. Jimura, S. Hayashi, R. Kikuchi and A. Takagaki, J. Catal., 2017, 355, 176–184 Search PubMed.
- H. Xu, Z. Wang, Z. Miao, Y. Zhu, A. Marianov, L. Wang, P. Castignolles, M. Gaborieau, J. Huang and Y. Jiang, ACS Sustainable Chem. Eng., 2019, 7, 8931–8942 Search PubMed.
- X. Mo, J. Yakiwchuk, J. Dansereau, J. A. McCubbin and D. G. Hall, J. Am. Chem. Soc., 2015, 137, 9694–9703 Search PubMed.
- M. Niggemann and M. J. Meel, Angew. Chem., Int. Ed., 2010, 49, 3684–3687 Search PubMed.
- T. Tsuchimoto, T. Maeda, E. Shirakawa and Y. Kawakami, Chem. Commun., 2000, 1573–1574 Search PubMed.
Footnote |
| † Electronic supplementary information (ESI) available. See DOI: 10.1039/d2ra00586g |
| This journal is © The Royal Society of Chemistry 2022 |