 Open Access Article
Insights into glyphosate removal efficiency using a new 2D nanomaterial†
Leila Razavi ,
Heidar Raissi
 * and
Farzaneh Farzad
Department of Chemistry, University of Birjand, Birjand, Iran. E-mail: leiia.razavi69@birjand.ac.ir; hraeisi@birjand.ac.ir; ffarzad5487@birjand.ac.ir; Tel: +98 5632502064
First published on 31st March 2022
Abstract
Glyphosate (GLY) is a nonselective herbicide that has been widely used in agriculture for weed control. However, there are potential genetic, development and reproduction risks to humans and animals associated with exposure to GLY. Therefore, the removal of this type of environmental pollutants has become a significant challenge. Some of the two-dimensional nanomaterials, due to the characteristics of hydrophilic nature, abundant highly active surficial sites and, large specific surface area are showed high removal efficiency for a wide range of pollutants. The present study focused on the adsorption behavior of GLY on silicene nanosheets (SNS). In order to provide more detailed information about the adsorption mechanism of contaminants on the adsorbent's surface, molecular dynamics (MD) and well-tempered metadynamics simulations are performed. The MD results are demonstrated that the contribution of the L-J term in pollutant/adsorbent interactions is more than coulombic energy. Furthermore, the simulation results demonstrated the lowest total energy value for system-A (with the lowest pollutant concentration), while system-D (contains the highest concentration of GLY) had the most total energy (Etot: −78.96 vs. −448.51 kJ mol−1). The well-tempered metadynamics simulation is accomplished to find the free energy surface of the investigated systems. The free energy calculation for the SNS/GLY system indicates a stable point in which the distance of GLY from the SNS surface is 1.165 nm.
1. Introduction
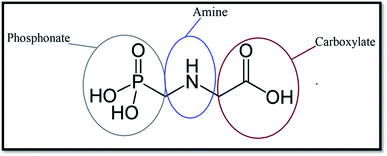
Issues associated with air and water pollution have become a significant issue across the whole world. Environmental pollutants come in many forms, including bacteria, gases, and heavy metal ions.1 They can have considerable negative impacts on human beings and other living organisms. For instance, in some cases, they can cause serious illnesses, and even cancer, in human beings.2Glyphosate (GLY, Scheme 1) is a widely used broad-spectrum herbicide in many regions worldwide and causes damage to human cells.3–5 Various reports indicate that the half-life of GLY in the soil extends to months, increasing the risk of erosion and contamination of surface and groundwater sources.6,7
Furthermore, the possible degradation product of GLY (DPG) i.e., aminomethyl phosphonic acid (APA), is known as equally toxic as GLY.8 Therefore, the removal of GLY from a medium is essential to protect human health and the environment.
Among various pollutants removal techniques such as ion exchange, solvent extraction, and membrane filtration,9–11 adsorption has particularly attracted researchers' attention, since it has several advantages, for example, cost-effective, easy-operation and also can prevent secondary pollution which is generated by other harmful substances.12–15
It is well known that in the adsorption method, the choice of suitable adsorbents is of great importance. The adsorbents usually possess active sites and large specific surface area for adsorbing pollutants.16,17
Recently, two-dimensional (2D) nanomaterial has been widely used for the removal of environmental pollutants.18–21 In several studies, 2D materials such as graphene, arsenene, phosphorene, and germanene have been reported to detect pollution particles.22–24 In particular, we are interested in another 2D material: silicene, a 2D nanomaterial that has a 2D hexagonal lattice structure with slight buckling and has been found to show graphene-like properties.25,26 Lately, Guerrero-Sánchez et al.25 used SNS as an effective adsorbent to chemically adsorb and inactivate SO2 molecules. They showed the process begins by first chemically adsorbing the SO2 molecule. The next step of the reaction is achieved when an S–O bond is broken and the released atom bonds with two silicon atoms of the substrate. In the last step, the reaction ends when the second S–O bond breaks down to form oxygen lines separated by sulfur in the substrate.
Molecular dynamics (MD) simulation is known as a powerful tool for exploring different properties of molecular systems at the atomic level, which are usually outside the scopes of experimental tools. The MD simulations can render beneficial information about the activity of structures and interactions between adsorbents during the adsorption.27,28
In the present research, we study the use of SNS to physically adsorb and removal GLY by using MD and well-tempered metadynamics (WT-MtD) simulations. The classical MD simulation is applied to get deep insight into the diffusion and dynamic properties of GLY adsorption on SNS in the environment. In addition, WT-MtD has been employed to gain the free energy surfaces (FES) of GLY on the SNS surface. Overall, our MD results may help the theoretical researchers expand their area of research, and even develop the pace of employing the 2D nanomaterials in practical environmental systems.
2. Materials and methods
2.1 Systems preparation
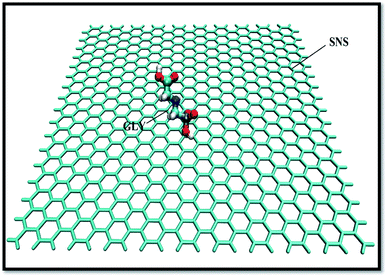
Atomistic simulations and the design of SNS structure are carried out by the GuassView program and optimized using the Gaussian 09 software package.29 Fig. 1 demonstrates a scheme of the SNS model consisting 680 silicon atoms with sp3 hybridization. The unsaturation effect at the extremes of the SNS is damped by adding hydrogen atoms at the edges.30The structural data file for the GLY molecule is taken from the PubChem (PubChem CID: 3496) database.31 The first complex (system-A) is elaborated by manually positioning a GLY molecule around the SNS structure with a distance of ∼2 nm to avoid initial GLY-SNS interactions (Fig. 1). To ascertain the effect of pollutant concentration on dynamic properties of GLY adsorption on the SNS nanosheet, four systems have been designed. In the simulation systems, GLY molecules are located on both sides of the SNS with different contents from 1 to 3, 5, and 10, namely A, B, C, and D systems, respectively. It should be noted that the simulations are accomplished in a 10 × 10 × 8 nm3 box.
2.2 MD simulation
The four investigated systems are simulated for 100 ns using the GROMACS 2019.2 package.32,33 The CHARMM36 force field parameters are assigned to generate topology and parameter files.34 All simulated systems are filled with TIP3P explicit water molecules and, then a concentration of 0.15 M Na+ and Cl− ions are added to neutralize the system.35 The temperature and pressure at 310 K and 1 bar are employed a 2 fs time-step and the leap-frog integration algorithm for integrating the equations of motion.36A cut-off radius of 1.4 nm is used for nonbonded interactions and short-range electrostatic, and long-range electrostatic interactions are calculated with the particle mesh Ewald method.37 Bonds involving hydrogen are constrained during the simulation using a LINCS method.38 All molecular images are rendered using the visual molecular dynamics program.39
2.3 Well-tempered metadynamics
The WT-MtD simulation is implemented with GROMACS 2019.2 and its plugin PLUMED (version 2.5.2) for 100 ns.33,40 The FES is explored as a function of the distance between the center of mass (COM) of GLY and SNS surface. More details about the WT-MtD simulation are provided and analyzed in the “Metadynamics results” section.3. Results and discussion
3.1 MD simulation results
To obtain a reliable assessment of the effects of pollutant concentrations on the adsorption, a set of descriptors, such as the radial distribution functions (RDF), the atomic RDF (aRDF), the number of contacts between GLY molecules and SNS, the mean square displacement (MSD), and the energy profiles throughout the simulation trajectory are evaluated. The snapshots corresponding to MD simulations of GLY molecules interacting with SNS at different concentrations are shown in Fig. 2.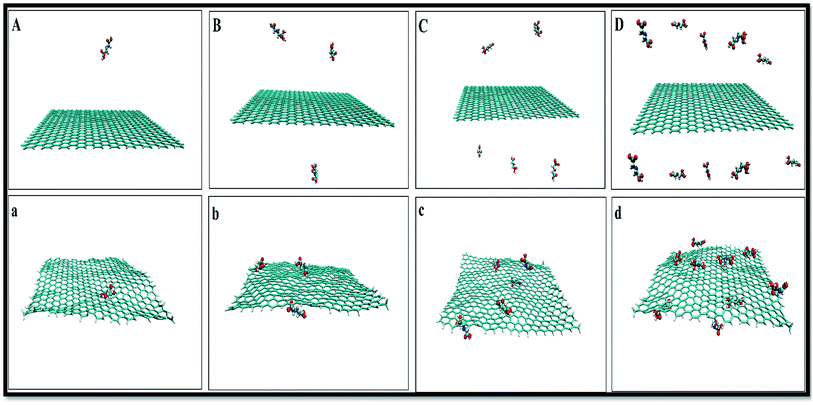 | ||
| Fig. 2 Initial (top) and final (down) snapshots for (A(a)) system-A, (B(b)) system-B, (C(c)) system-C and (D(d)) system-D. | ||
As seen in this figure, the GLY molecules have a good tendency to adsorb on the SNS and form a stable complex after 100 ns. In Fig. 3, the total reciprocal energy and its two constituent elements L-J and coulombic (coul) energies are depicted separately.
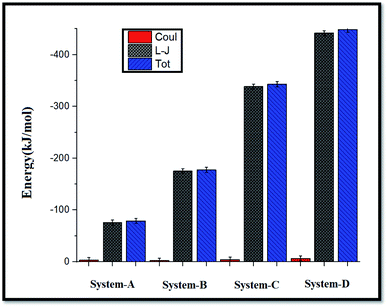 | ||
| Fig. 3 Average coul (red), L-J (gray), and total (blue) interaction energies between GLY molecules and SNSs. | ||
As shown in Fig. 3, the L-J energy is significantly larger than the coul energy for SNS/GLY in all of the systems, which indicates that L-J energy is the major interaction between SNS/GLY. Since the GLY contains phosphonate, carboxylate, and amine groups, it is expected that adsorbs on the SNS surface in parallel orientation. The L-J energy value between GLY and SNS becomes more negative when the number of the GLY increased, which shows the tendency of GLY to adsorb on the surface of SNS increased (see Fig. S1†). Also, the comparison of the adsorption energy values in this work with previous works (Table S1†) shows that GLY is physically adsorbed on SNS.3,41 It is found that the interaction of GLY with SNS is stronger than the other adsorbents, which confirms that SNS has good potential for the removal of GLY.
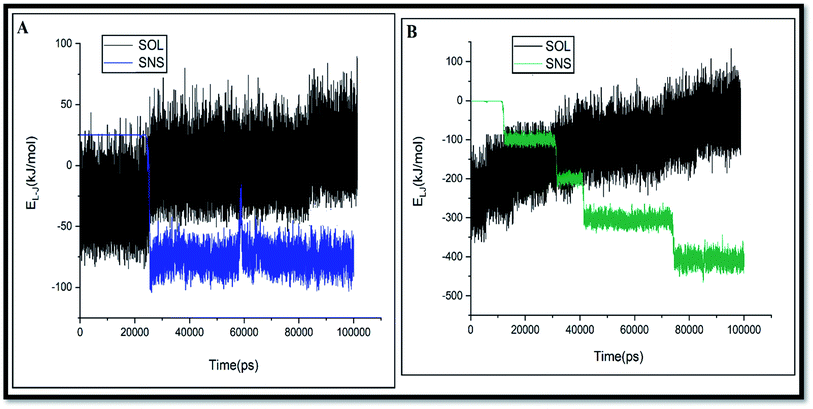
The adsorption tendency of pollutant molecules can be evaluated by comparison of L-J interactions of pollutants with its corresponding value for adsorbent and solvent. The profile of the L-J energy changes versus simulation time for GLY binding on SNS in A and D systems is shown in Fig. 4.
As seen in this figure, by increasing the L-J interactions of GLY with SNS, their interactions with water are decreased. Reducing interactions of the GLY and water can facilitate the diffusion of pollutant towards the adsorbent surface.
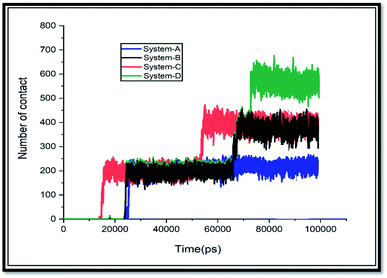
There is a significant correlation between L-J energy values and the obtained results from the number of contacts. As shown in Fig. 5, there are few contacts between SNS and GLY molecules at the initial time of MD simulation; then, when the GLY molecules approach the surface of SNS, the number of contacts increases and keeps small fluctuations until the end of the simulation. Due to the increase in pollutants concentration in system-D, the number of atomic contacts of GLY with the SNS in this system is higher than the corresponding value in the other systems.
Furthermore, the interacted molecules with the surface of SNS are counted as adsorbed molecules, and the obtained results are exhibited in Fig. S2.† As can be seen in this figure, in systems A, B, and C, all glyphosate molecules are adsorbed. While in system-D, about 80% of the contaminant molecules are adsorbed on the SNS surface. This finding confirms that SNS could adsorb a high amount of GLY molecules, and it is suggested as a good candidate for removal applications.
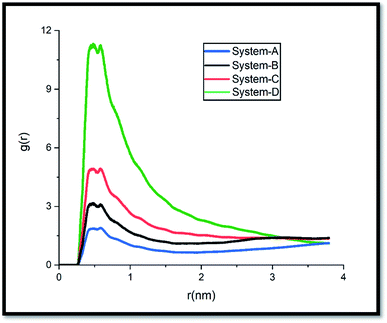
The pollutant/adsorbent radial distribution function (RDF) is analyzed to evaluate the interaction between GLY molecules and the SNS (see Fig. 6). The radial distribution function is an important estimation of the probable distance of pollutants from the SNS is obtained from eqn (1):42
 | (1) |
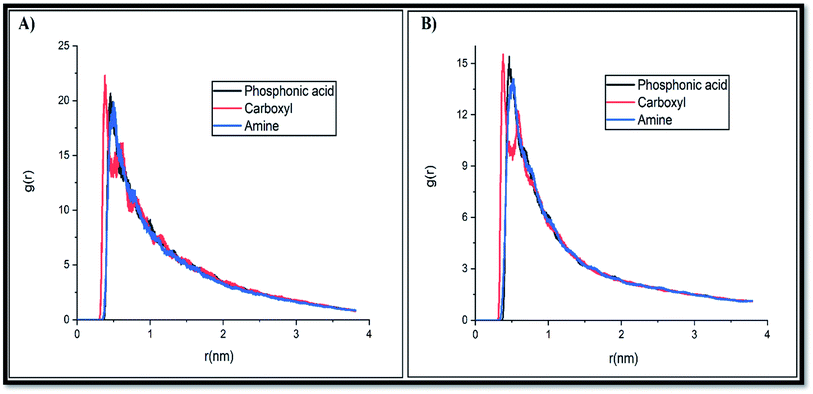 | ||
| Fig. 7 Atomic radial distribution function of the phosphonate, carboxylate and amine groups of the GLY molecule with SNS in (A) system-A and (B) system-D. | ||
It is important to note that to provide a fair comparison, the obtained results are presented only for one atom from each chosen active site (see Scheme 1). The intense peaks of the RDF plot for carboxylate and phosphonate sites are observed at about 0.2–0.5 nm, while the most probable distance for the amine site is located at around 0.49–0.52 nm. These results demonstrate that the pollutant molecules prefer to interact with the adsorbent surface through the OH groups.
The MSD is calculated to explore the behavior of pollutant diffusion on the SNS based on the eqn (2):43
| MSD(Δt) = 〈(ri(Δt) − ri(0))2〉 = 〈Δri(Δt)2〉 | (2) |
Here, ri(Δt) − ri(0) is the distance traveled by COM of the particle i over some time interval of length.
Using Einstein's relation (eqn (3)),44 the self-diffusion coefficient (Di) of the GLY molecules is calculated with respect to the SNS and the results are provided in Table 1. It should be noted that all of the Di values are extracted from the last 25 ns of MD productions.45–47
 | (3) |
| Systems | Di (10−5 cm2 s−1) | Error |
|---|---|---|
| System-A | 0.0440 | ±0.0527 |
| System-B | 0.0195 | ±0.0025 |
| System-C | 0.0187 | ±0.0120 |
| System-D | 0.0099 | ±0.0169 |
Factors such as pressure, temperature, size and structure of the adsorbent, and also density are effective in the diffusion of pollutant molecules.48 Comparison of the results presented in Table 1 indicates that the Di value in system-D is higher than that in other systems. This finding can be attributed to the high concentration of GLY in this system which leads to competition between the GLY molecules for adsorption. Since high MSD indicates high Di, therefore, for this purpose, the MSD of GLY molecules with different concentrations is plotted against simulation time in Fig. S3.† By visualizing the animated trajectory of the system, it is observed that the GLY molecules diffuse towards the SNS and adsorb on SNS. This fact is nicely confirmed by a decrease in the GLY total energy in simulation systems (cf. Table S2†).
Moreover, the MSD slope of system-D is much less than that of other systems. This finding can be attributed to the reduction of GLY molecules' movement with the increase of their concentration which requires more energy for moving towards the adsorbent (Fig. 3). These results are also confirmed by the RDF results in Fig. 6, which show the distance between GLY and SNS in A, B, and C systems is more than system-D.
3.2 Metadynamics results
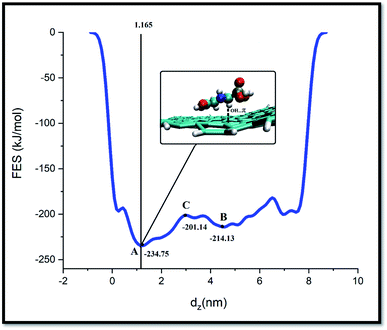
Metadynamics is one of the successful techniques among free energy calculation methods for exploring the energy of long-time processes. Metadynamics use Gaussian-like bias to overcome high energy barriers in FES. By defining collective variables (CVs) and adding bias potentials, metadynamics sampling could reconstruct the FES based on the biased CVs. This accelerates the sampling process for recording rare dynamic events, such as large-scale structural conformation changes. In WT-MtD, which is one of the types of metadynamics methods, the bias height of these Gaussians reduces over the simulation time.28,49As well as, metadynamics is one of the successful techniques used to investigate the free energy of long-time processes.50 This method allows the system to escape deep energy wells and to sample a large region of its conformational energy landscape. In the present work, the WT-MtD simulations are carried out to find the FES of system-A. In Fig. 8, the free energy as a function of the GLY COM distance from the adsorbent is shown.
As illustrated in this figure the free energy is set to zero when the GLY is positioned far from the SNS surface. Furthermore, the free energy decreases as the pollutant molecule moves toward the adsorbent surface during the adsorption process.
The FES profile for GLY adsorption on SNS demonstrates two free energy minima located at GLY/adsorbent distances of ∼1.3 and 4.2 nm minima. The pollutant molecule for reaching closest to the SNS surface (from minimum B to minimum A) must overcome an energy barrier of ∼13 kJ mol−1. After crossing this barrier, while the pollutant approaches the adsorbent surface, the decrease in free energy value is continued to reach the most stable state. Close inspection of the SNS/GLY configuration corresponding to minimum A showed that GLY and adsorbent interact together through phosphonate, carboxylate, and amine groups of pollutant. The GLY configuration on the SNS at the global minimum state is victualed by VMD, in which the distance of carboxylate, phosphonate, and amine groups from the SNS surface is about 0.41, 0.44, and 0.45 nm, respectively. These distances have good agreement with the obtained results from aRDF in MD simulations which indicated the simulation time is long enough for SNS/GLY complex to reach its most stable state.
3.3 Adsorption of DPGs on SNS
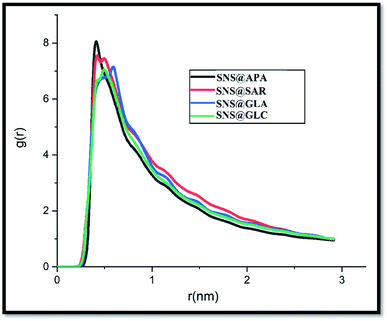
Investigation of GLY degradation products has long been in the spotlight; nevertheless, only a few detailed computational studies have been reported on the topic so far. These species have various effects indirectly on the human body and the environment. Here, MD simulations are performed for evaluating the adsorption of four main GLY degradation products i.e., APA, sarcosine (SAR), glyoxylic acid (GLA) and glycine (GLC) (see Fig. S4†) on SNS. To gain a deep understanding of the adsorption behavior of DPGs on the SNS, the pair interaction energy is calculated. The L-J, coul, and total energies of all studied complexes are collected in Table 2. The negative L-J and coul energy values for the interaction of DPGs with the SNS surface corroborate the physical adsorption process. Based on the results in Table 2, it is found that all of DPGs, like GLY, could be adsorbed on the SNS. This finding shows that the SNS enables the removal of these organic compounds. It should be noted that the highest interaction energy belongs to SNS@APA complex which can be related to the formation of strong N⋯π, P⋯π and OH⋯π interactions between SNS and APA (see Fig. S5†). In order to compare the adsorption mechanism, the RDF plot between the SNS and DPGs is calculated and depicted in Fig. 9. According to RDF plots, in SNS@SAR and SNS@GLA complexes, the probability of finding SAR and GLA around the adsorbent surface is more than GLC. Furthermore, SNS has strong interactions with APA molecules, with a maximal g(r) of 8.02 and peak distance of 0.41 nm.| Complexes | L-J | Coul | Total |
|---|---|---|---|
| SNS@APA | −514.57 | −0.38 | −514.19 |
| SNS@SAR | −444.43 | −0.11 | −444.32 |
| SNS@GLA | −382.25 | −1.11 | −381.14 |
| SNS@GLC | −322.029 | −0.213 | −321.87 |
4. Conclusion
In this research, classical MD and WT-MtD simulations to obtain molecular insight into the interaction between SNS and GLY are accomplished. Our results indicates that in all studied systems, the GLY molecules have a good tendency to adsorb on the SNS and form a stable complex. Additionally, the obtained MD results indicated that the L-J interaction is the main attractive contact during the adsorption of GLY on SNS. It is found that by increasing pollutant concentrations, the simulation system becomes more stable and the L-J interactions of the simulation system decrease. These findings are confirmed by RDF, MSD, and the number of contacts analyses. In SNS/GLY systems, phosphonate, carboxylate, and amine groups of GLY molecule cause that the GLY prefers parallel orientation to the SNS surface. Well-tempered metadynamics simulation provides the binding free energy profile of pollutant molecules during the adsorption on the SNS. The FES for the system-A also shows that the GLY molecule to reach a global minimum must be overcome an energy barrier. Generally, our results pave the way for the application of two-dimensional nanomaterials such as SNS as an efficient device to remove environmental pollutant molecules.Conflicts of interest
There are no conflicts to declare.References
- Y. Zhang, N. Zhang and C. Ge, Materials, 2018, 11, 2281 CrossRef PubMed.
- L. Järup, Br. Med. Bull., 2003, 68, 167 CrossRef PubMed.
- A. Pankajakshan, M. Sinha, A. A. Ojha and S. Mandal, ACS Omega, 2018, 3, 7832 CrossRef CAS PubMed.
- E. G. Hertwich, S. F. Mateles, W. S. Pease and T. E. McKone, Environ. Toxicol. Chem., 2001, 20(4), 928–939 CrossRef CAS PubMed.
- G. M. Williams, R. Kroes and I. C. Munro, Regul. Toxicol. Pharmacol., 2000, 31, 117 CrossRef CAS PubMed.
- G. Quaglia, I. Joris, S. Broekx, N. Desmet, K. Koopmans, K. Vandaele and P. Seuntjens, J. Environ. Manage., 2019, 246, 583–593 CrossRef CAS PubMed.
- I. S. Lima, N. C. Baumeier, R. T. Rosa, P. M. S. Campelo and E. A. R. Rosa, Braz. J. Microbiol., 2014, 45, 971 CrossRef CAS PubMed.
- N. Lemke, A. Murawski, M. I. H. Schmied-Tobies, E. Rucic, H. W. Hoppe, A. Conrad and M. Kolossa-Gehring, Environ. Int., 2021, 156, 106769 CrossRef CAS PubMed.
- F. Fu, L. Xie, B. Tang, Q. Wang and S. Jiang, Chem. Eng. J., 2012, 189, 283 CrossRef.
- G. F. Vandegrift, D. T. Reed, I. R. Tasker and others, Environmental Remediation: Removing Organic and Metal ion Pollutants, Washington, US, American Chemical Society, 1992 Search PubMed.
- B. Gu, Y.-K. Ku and P. M. Jardine, Environ. Sci. Technol., 2004, 38, 3184 CrossRef CAS PubMed.
- K. Y. Foo and B. H. Hameed, J. Hazard. Mater., 2010, 175, 1 CrossRef CAS PubMed.
- A. A. Adeyemo, I. O. Adeoye and O. S. Bello, Toxicol. Environ. Chem., 2012, 94, 1846 CrossRef CAS.
- S. Wang, H. Sun, H.-M. Ang and M. O. Tadé, Chem. Eng. J., 2013, 226, 336 CrossRef CAS.
- S. Sen Gupta and K. G. Bhattacharyya, Phys. Chem. Chem. Phys., 2012, 14, 6698 RSC.
- T. Ito, M. Kuramoto, M. Yoshioka and T. Tokuda, J. Phys. Chem., 1983, 87, 4411 CrossRef CAS.
- Z. Ren, B. Jia, G. Zhang, X. Fu, Z. Wang, P. Wang and L. Lv, Chemosphere, 2021, 262, 127895 CrossRef CAS PubMed.
- A. Ishag and Y. Sun, Ind. Eng. Chem. Res., 2021, 8007–8026 CrossRef CAS.
- S.-S. Yang, C. Wang, X. Yu, W. Shang, D. D. Y. Chen and Z.-Y. Gu, Anal. Chim. Acta, 2020, 1119, 60 CrossRef CAS PubMed.
- M. A. Creighton, Y. Ohata, J. Miyawaki, A. Bose and R. H. Hurt, Langmuir, 2014, 30, 3687 CrossRef CAS PubMed.
- Y. You, C. Yang, X. Zhang, H. Lin and J. Shi, Mater. Today Nano, 2021, 16, 100132 CrossRef CAS.
- P. Sang, Q. Wang, W. Wei, Y. Li and J. Chen, ACS Appl. Nano Mater., 2021, 1178–1184 Search PubMed.
- L. Meng, X. Yu, J. Du, J. Shi, C.-Z. Lu and P. Gao, J. Phys. Chem. C, 2021, 20241–20248 CrossRef CAS.
- W. Lee, Y. Lin, L.-S. Lu, W.-C. Chueh, M. Liu, X. Li, W.-H. Chang, R. A. Kaindl and C.-K. Shih, Nano Lett., 2021, 21, 7363 CrossRef CAS PubMed.
- J. Guerrero-Sánchez, D. M. Munoz-Pizza and N. Takeuchi, Appl. Surf. Sci., 2019, 479, 847 CrossRef.
- L. Razavi, H. Raissi and F. Farzad, J. Mol. Graphics Modell., 2021, 106, 107930 CrossRef CAS PubMed.
- Z. Khoshbin and M. R. Housaindokht, Computer-Aided aptamer design for sulfadimethoxine antibiotic: step by step mutation based on MD simulation approach, J. Biomol. Struct. Dyn., 2021, 39, 3071–3079 CAS.
- L. Zheng, A. A. Alhossary, C. K. Kwoh and Y. Mu, Molecular dynamics and simulation, Encyclopedia of Bioinformatics and Computational Biology: ABC of Bioinformatics, 2018, vol. 1–3, pp. 550–566 Search PubMed.
- S. A. Nazari, F. Farzad, A. Haghi and A. Bina, J. Mol. Graphics Modell., 2021, 108041 CrossRef CAS PubMed.
- L. Razavi, H. Raissi, H. Hashemzadeh and F. Farzad, J. Biomol. Struct. Dyn., 2020, 1 Search PubMed.
- T. H. Pham, L. Derian, C. Kervarrec, P.-Y. Kernanec, B. Jegou, F. Smagulova and A. Gély-Pernot, Toxicol. Sci., 2019, 169, 260 CrossRef CAS PubMed.
- A. Bina, H. Raissi, H. Hashemzadeh and F. Farzad, RSC Adv., 2021, 11, 18809 RSC.
- L. Carvalho Martins, E. A. Cino and R. S. Ferreira, J. Chem. Theory Comput., 2021, 4262–4273 CrossRef CAS PubMed.
- J. Delva-Wiley, I. Jahan, R. H. Newman, L. Zhang and M. Dong, ACS Omega, 2021, 29166–29170 CrossRef CAS PubMed.
- A. Sengupta, Z. Li, L. F. Song, P. Li and K. M. Merz Jr, J. Chem. Inf. Model., 2021, 61, 869 CrossRef CAS PubMed.
- J.-P. Ryckaert, G. Ciccotti and H. J. C. Berendsen, J. Comput. Phys., 1977, 23, 327 CrossRef CAS.
- L. Chen, A. Cruz, D. R. Roe, A. C. Simmonett, L. Wickstrom, N. Deng and T. Kurtzman, J. Chem. Theory Comput., 2021, 17, 2714 CrossRef CAS PubMed.
- M. Sahihi, A. Jaramillo-Botero, W. A. Goddard III and F. Bedoui, J. Phys. Chem. C, 2021, 21635–21644 CrossRef CAS.
- T. Yan and K. A. Fichthorn, J. Phys. Chem. B, 2021, 125, 4178 CrossRef CAS PubMed.
- D. Wang, L. Zhang, H. Wang and others, 2021, arXiv preprint arXiv:2104.01620.
- P. Bhatt, T. Joshi, K. Bhatt, W. Zhang, Y. Huang and S. Chen, J. Hazard. Mater., 2021, 409, 124927 CrossRef CAS PubMed.
- B.-H. Gao, H. Qi, D.-H. Jiang, Y.-T. Ren and M.-J. He, J. Quant. Spectrosc. Radiat. Transfer, 2021, 275, 107886 CrossRef CAS.
- I. Lado-Touriño and A. Páez-Pavón, Nanomaterials, 2021, 11, 1378 CrossRef PubMed.
- T. D. N. Reddy and B. S. Mallik, J. Phys. Chem. B, 2021, 5587–5600 CrossRef CAS PubMed.
- M. Moosavi, N. Banazadeh and M. Torkzadeh, J. Phys. Chem. B, 2019, 123, 4070 CrossRef CAS PubMed.
- S. B. Pour, J. J. Sardroodi and A. R. Ebrahimzadeh, Fluid Phase Equilib., 2022, 552, 113241 CrossRef CAS.
- S. B. Pour, J. J. Sardroodi and A. R. Ebrahimzadeh, J. Mol. Liq., 2021, 334, 115956 CrossRef.
- Z. Taheri and A. N. Pour, J. Mol. Model., 2021, 27, 1 CrossRef PubMed.
- D. M. Shadrack and H. S. Swai, J. Mol. Liq., 2019, 292, 111434 CrossRef CAS.
- P. Tiwary and M. Parrinello, Phys. Rev. Lett., 2013, 111, 230602 CrossRef PubMed.
Footnote |
| † Electronic supplementary information (ESI) available. See DOI: 10.1039/d2ra00385f |
| This journal is © The Royal Society of Chemistry 2022 |

