
 Open Access Article
 This Open Access Article is licensed under a Creative Commons Attribution-Non Commercial 3.0 Unported Licence
Visible-light-responsive reduced graphene oxide/g-C3N4/TiO2 composite nanocoating for photoelectric stimulation of neuronal and osteoblastic differentiation†
Ziru Yanab,
Kai Li*ab,
Dandan Shaoab,
Qingyi Shenc,
Yi Dinga,
Shansong Huanga,
Youtao Xieab and
Xuebin Zheng *ab
*ab
aKey Laboratory of Inorganic Coating Materials CAS, Shanghai Institute of Ceramics, Chinese Academy of Sciences, Shanghai, China. E-mail: likai@mail.sic.ac.cn; xbzheng@mail.sic.ac.cn
bCenter of Materials Science and Optoelectronics Engineering, University of Chinese Academy of Sciences, Beijing, China
cDepartment of Stomatology, Huashan Hospital, Fudan University, Shanghai, China
First published on 22nd March 2022
Abstract
Restoration of nerve supply in newly formed bone is critical for bone defect repair. However, nerve regeneration is often overlooked when designing bone repair biomaterials. In this study, employing graphitic carbon nitride (g-C3N4) as a visible-light-driven photocatalyst and reduced graphene oxide (rGO) as a conductive interface, an rGO/g-C3N4/TiO2 (rGO/CN/TO) ternary nanocoating with photoelectric conversion ability was fabricated on a Ti-based orthopedic implant for photoelectric stimulation of both bone and nerve repair. Compared with g-C3N4/TiO2 (CN/TO) and TiO2 nanocoatings, the ternary nanocoating exhibited stronger visible-light absorption as well as higher transient photocurrent density and open circuit potential under blue LED exposure. The improved photo-electrochemical properties of the ternary nanocoating were attributed to the enhanced separation of photogenerated carriers at the heterointerface. For the tested nanocoatings, introducing blue LED light irradiation enhanced MC3T3-E1 osteoblastic differentiation and neurite outgrowth of PC12 cells. Among them, the rGO/CN/TO nanocoating exerted the greatest enhancement. In a coculture system, PC12 cells on the ternary nanocoating released a higher amount of neurotransmitter calcitonin gene-related peptide (CGRP) under light irradiation, which in turn significantly enhanced osteoblastic differentiation. The results may provide a prospective approach for targeting nerve regeneration to stimulate osteogenesis when designing bone repair biomaterials.
1. Introduction
Bone is highly innervated by peripheral motor and sensory nerves, which transmit excitation signals to the central nervous system and convey information to target cells through secretion of neurotransmitters or neuropeptides.1 Accumulating evidence from experimental studies suggests that peripheral nerve fibers not only are crucial in regulating bone homeostasis, but also play fundamental roles in the repair mechanism of bone fractures.2 Sympathetic and sensory nerves are observed in the fracture callus,3 with substance P (SP)- and calcitonin gene-related peptide (CGRP)-positive sensory neurons identified prior to vascularization.4 Deficiencies in sympathetic or sensory nerves and blocking of neuropeptides suppress bone repair.5 Therefore, simultaneous regeneration of bone and neural elements is crucial for bone fracture healing.As bone and nerve are both electroactive tissues, exogenous electrical stimulation derived from implants and scaffolds are employed to stimulate bone and nerve repair.6 Application of electrical stimulation on conductive nanostructured Si surfaces enhanced osteoblastic differentiation.7 In our previous work, conductive composites of poly(3,4-ethylenedioxythiophene) (PEDOT) coated MnO2 nanocoatings were applied to pre-osteoblasts to improve cell proliferation under electric stimulation.8 However, applying an external power supply to electroactive implants or scaffolds is not appropriate for long-term stimulation due to possible cellular damage9 and high risk of bacterial contamination.10 Therefore, photo stimulation by utilizing photocatalysts to trigger optoelectronic conversion under light irradiation would be an efficient way to solve these problems. For example, reduced graphene oxide/titania (rGO/TiO2) heterostructure was designed to generate electrical signals for inducing neuronal differentiation of human neural stem cells under flash photo stimulation.11
The addition of nanostructured TiO2 to the surface of Ti-based implants as a means of mimicking bone microstructure has been considered as an effective approach to improve osteoblastic cell activity and osteointegration.12 Moreover, as a photocatalyst, TiO2 could produce holes and electrons under ultraviolet (UV) light exposure. Suzurikawa and his colleagues successfully developed a TiO2 film on a light addressable electrode and confirmed its photoelectric properties for selective neural stimulation.13 However, because of its wide band gap of ∼3.1 eV, TiO2 mainly functions under UV light illumination; besides, the related cellular/genomic toxicity is a possible concern associated with TiO2 exposure to UV irradiation. In order to broaden the photo-response range and facilitate photogenerated charge separation, TiO2 is usually formed into a heterostructured composite with a narrow bandgap semiconductor, such as g-C3N4,14 BiVO415 and Cu2O.16 Among them, g-C3N4 is a superior metal-free semiconductor material because of its high physicochemical stability as well as suitable band gap (2.7 eV) for visible light absorption (mainly above 400 nm). A growing body of studies have tried to construct g-C3N4/TiO2 nanocomposites.17 However, the poor electrical conductivity is a bad problem that limits photocatalytic activities of g-C3N4-based materials. Since graphene and its derivatives have superior electron transport properties, coupling graphene-based materials with g-C3N4 was reported to suppress the recombination of photoinduced carriers via improved electron transfer across the heterojunction.18 Zhang and his colleagues reported that improved photocatalytic activities of g-C3N4 were realized by spreading g-C3N4 on reduced graphene oxide (rGO) coated fibrous scaffolds.19 Enhanced neurite protraction was observed on rGO/g-C3N4-coated scaffolds under visible-light exposure. As mentioned above, rGO and g-C3N4 co-modified TiO2 composite on Ti-based implants appears as an ideal candidate to enable the fabrication of innervated bone substitutes.
As chemical mediators involved in the neural transmission, neuropeptides and neurotransmitters can be directly or indirectly modified to render the microenvironment more suitable for fracture healing.20 Some studies have developed bone repair biomaterials based on this strategy. For example, Bio-Oss scaffold was used in combination with CGRP to promote osteogenesis.21 As the most potent neuropeptide secreted by sensory nerves, CGRP functions as an anabolic agent in the physiology of bone. In a study by Huang et al., calcium alginate gel loaded with adipose-derived stem cells was combined with exogenous CGRP to enhance osteoblastic differentiation and bone formation.22 Researchers have also generated novel designs with indirect CGRP regulation approaches either chemically or electrically. Increase of CGRP at peripheral cortical sites in the rat femur was achieved through evaluation of extracellular Mg ions from intramedullary nails containing ultrapure Mg, which promoted bone formation via enhancing osteoblastic differentiation of stem cells.23 Recent studies have shown that it is possible to facilitate the release of CGRP by means of electrical stimulation.24 In vitro study revealed that antidromic electrical stimulation of the trigeminal ganglion at 10 Hz caused CGRP release from rat dura mater encephali (4.5-fold of baseline).25 Since CGRP release is most commonly associated with the activation of the neurons by electrical stimulation, the implants with photoelectric properties may yield a novel means by which to augment CGRP release in neurons.
In this study, a photocatalytic composite coating rGO/g-C3N4/TiO2 was achieved on a Ti implant by sequentially decorating the hydrothermally formed TiO2 nanostructures with g-C3N4 nanoparticles and rGO nanosheets via in situ sintering and electrodeposition (Scheme 1). Compared with the TiO2 and CN/TO nanocoatings, the rGO/CN/TO exhibited the enhanced visible-light-responsive photoelectric property. MC3T3-E1 and PC12 cells were used as osteoblast and neuronal cell mode, respectively. The photoelectric effects of the composite coatings on osteoblastic differentiation of MC3T3-E1 cells as well as neuronal growth and differentiation of PC12 cells were investigated under irradiation of blue LED light (460 nm). What's more, the effect of photo-stimulated PC12 cells excretions on MC3T3-E1 cells was identified.
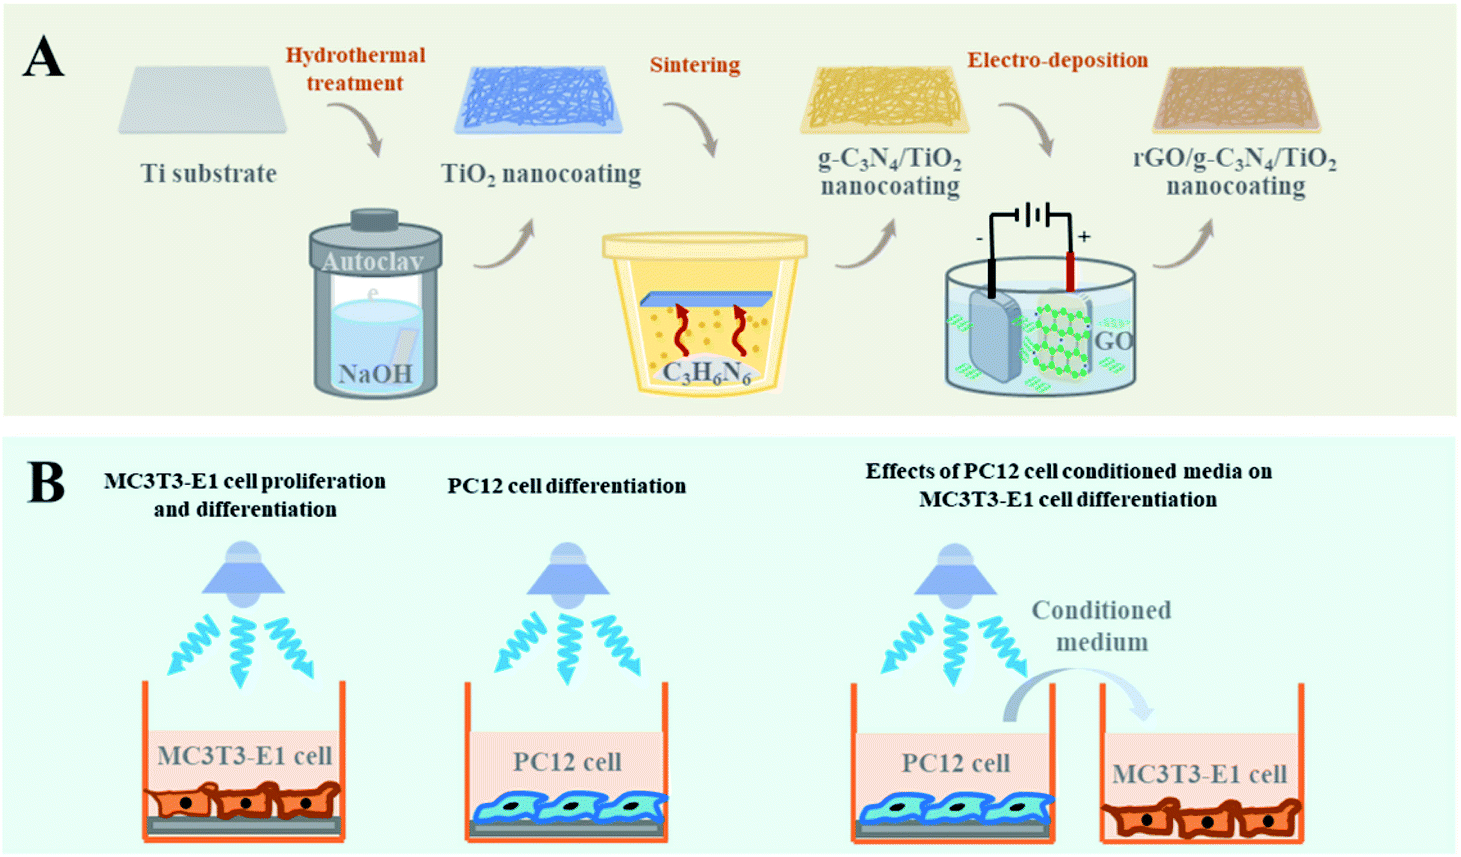 | ||
| Scheme 1 (A) Schematic preparation of the TiO2, CN/TO, and rGO/CN/TO nanocoatings. (B) In vitro investigation of the effects of photoelectric stimulation induced by the visible-light-responsible nanocoatings on MC3T3-E1 and PC12 cells. | ||
2. Materials and methods
2.1 Nanocoating preparation
Ti plates (Shenyang Zhonghang Titanium Co. Ltd, China) were cleaned by sonication in ethanol then deionized (DI) water. Nanowire structured TiO2 was prepared on the surface of Ti plate by a hydrothermal process.26 Briefly, Ti plates were treated by NaOH (2 M, 60 mL) in a Teflon-lined vessel at 220 °C for 15 h. Finally, the hydrothermally prepared samples further were immersed in HCl (0.1 M) for 2 h and annealed at 550 °C for 3 h.The g-C3N4/TiO2 (labeled as CN/TO) nanocoating was synthesized via a thermal sintering process. Briefly, melamine powder (1.0 g) was added into a crucible with a quartz cover. The surface of the as-prepared TiO2-coated Ti plate was placed face-down to the melamine powder and heated at 550 °C for 3 h to deposit g-C3N4 onto the TiO2 nanocoating. The obtained g-C3N4 in the crucible was ground into powder and used as referential g-C3N4.
Coating of rGO nanosheets onto the CN/TO nanocoating was achieved through a cathodic electrodeposition method. Generally, GO was synthesized via a modified Hummers' method.27 The electrodeposition process occurred in a three-electrode system in GO (10 mg L−1) solution at a constant voltage of 3 V for 40 min, using the CN/TO-coated Ti plate as the anode, the Pt foil as the cathode and the saturated calomel electrode as the reference electrode. The rGO/g-C3N4/TiO2 nanocoating labeled as rGO/CN/TO.
2.2 Surface characterization
Micro-BCA Protein Assay Kit (Thermo Fisher Scientific, USA) was used to detect the adsorption amount of fibronectin on the samples. Enzyme-linked immunosorbent assay (ELISA) was used to examine the exposed cell recognition site of adsorbed fibronectin. The chemical compositions of all nanocoatings were investigated by X-ray diffraction (XRD, Rigaku D/max-2550, Japan) with Cu Kα radiation. Raman spectra were collected by Raman spectrometer (Renishaw, UK) over the range of 100–1800 cm−1. Surface morphology of all nanocoatings were observed by using Field emission scanning electron microscopy (FE-SEM, Hitachi SU8220, Japan). The microstructure of the powder collected from each nanocoating was investigated by Transmission electron microscopy (TEM, Tecnai F20, Netherlands). X-ray photoelectron spectroscopy (XPS, Thermo Fisher Scientific ESCALAB-250, UK) was used to investigate the surface chemistry of the nanocoatings. The binding energies were referenced to the C 1s peak at 284.8 eV. The electron spin resonance (ESR) signal of the powder collected from each nanocoating was recorded by ESR spectroscopy (JEOL ESED3X, Japan). The surface wettability of the nanocoatings was measured by a contact angle meter (Solon Tech. Co. Ltd, SL200B, China) equipped with a digital camera. In order to examine fibronectin adsorption and conformation, the samples were immersing in 15 μg mL−1 fibronectin solution at 37 °C. Part of the samples were also exposed to blue LED light (460 nm) with an irradiance of 1 W cm−2 every day for 10 min. After 4 h, Micro-BCA Protein Assay Kit (Thermo Fisher Scientific, USA) was used to detect the adsorption amount of fibronectin on the samples, as previously described.28 Enzyme-linked immunosorbent assay (ELISA) was used to examine the exposed cell recognition site of adsorbed fibronectin for cell-binding, as previously described.292.3 Charge separation properties and electronic band structure of the nanocoatings
Photoluminescence (PL) spectra of the samples were acquired from LS-55 fluorescence spectrophotometer (PerkinElmer, USA) using 320 nm He–Cd laser as the exciting source. UV-vis diffuse reflectance spectra (UV-vis DRS) of all nanocoatings were measured by UV-vis spectrophotometer (Shanghai Metash Instruments Co. Ltd, UV4100, China). The band gap energy (Eg) of the samples was calculated by using Tauc's equation: αhν = A(hv − Eg)2, where α, hν and A are the absorption coefficient, the photon energy, and the proportionality constant, respectively.30 Ultraviolet photoelectron spectroscopy (UPS, Thermo Fisher Scientific ESCALAB-250, UK) was used to investigate the valence band photoemission spectra of the TiO2 powder collected from the TiO2 nanocoating and the g-C3N4 powder.2.4 The positions of the valence and conduction band edges of the relevant components
The photo-electrochemical properties of the samples, including the open circuit potential and transient photocurrent response as well as the electrochemical impedance spectra (EIS) curves, were measured using an electrochemical workstation (CS310, Wuhan Corrtest Instrument Co. Ltd, China). Briefly, 0.1 M Na2SO4 served as electrolyte for three-electrode system using the coated Ti plate as the anode, the Pt foil as the cathode and the saturated calomel electrode as the reference electrode.2.5 Cell culture
Mouse osteoblastic cell line (MC3T3-E1) and PC12 cell line were purchased from Shanghai cell bank of Chinese Academy of Sciences. The MC3T3-E1 cells were incubated in α-minimum essential medium (α-MEM, Hyclone, USA) containing 10% fetal calf serum and 1% antibiotics in an incubator supplied with 5% CO2 at 37 °C. The PC12 cells were incubated in F12K (Gibco, USA) containing 10% fetal calf serum and 5% horse serum in an incubator supplied with 5% CO2 at 37 °C. For neuronal differentiation, PC12 cells were cultured in media containing 50 ng mL−1 nerve growth factor (NGF, Thermo Fisher Scientific, USA).2.6 MC3T3-E1 cell morphology and proliferation
1 × 10⁴ cells per well were cultured on the samples in 48-well plates. A monochromatic light of 460 nm wavelength with 1 W cm−2 intensity was used as the visible-light source. Visible-light irradiation every day for 30 min was used as photo stimulation in the subsequent experiments unless indicated. After incubated for 1 day, the cells were fixed overnight in 2% glutaraldehyde, dehydrated with a graded ethanol series and air-dried. FE-SEM was used for cell morphology observation. Cell proliferation was measured by using Cell Counting Kit-8 (CCK-8, Tongren institute of chemistry, Japan) according to the manufacturer's protocol.2.7 Alkaline phosphatase (ALP) activity and extracellular matrix (ECM) mineralization assay
1 × 10⁴ cells per well were cultured on the samples in 48-well plates for 14 days. In order to measure ALP activity, the cells on the samples were lysed by 0.5% Triton X-100 solution, and centrifugated at 1 × 10⁵ rpm for 5 min. ALP activity was assayed following the manufacturer's protocol (Beyotime Biotechnology, China). For the ECM mineralization assay, the cells on the samples were fixed in 4% paraformaldehyde for 15 min at 4 °C, and stained by Alizarin Red S (ARS, Xi'an Hett Biotechnology Co. Ltd, China) for 30 min at 37 °C. Semiquantitative analysis of ARS staining was performed by dissolving the calcium deposits from the sample's surface in cetylpyridinium chloride (Energy, China) for 15 min and measuring absorbance of medium at 590 nm.2.8 Intracellular Ca2+ measurement of MC3T3-E1 cells
1 × 10⁴ cells per well were cultured on the samples in 48-well plates. After 24 h incubation, the media were removed. Then a Ca2+-sensitive dye (Fluo-4 AM, Abcam, USA) was added into the plates, followed by 30 min incubation. Fluorescent images of intracellular Ca2+ were observed by confocal microscope system (TCS SP5 II, Leica, Germany).2.9 Immunofluorescence observation and CGRP release of PC12 cells
PC12 cells were cultured on the samples in 48-well plates at a density of 2 × 10⁴ cells per well. After incubated for 4 days, the cells were treated by 4% paraformaldehyde fixation and 0.5% Triton X-100 permeabilization. After incubation in blocking buffer (5% bovine serum albumin in 0.1 M PBS), the cells were treated by anti-vinculin antibody (1![[thin space (1/6-em)]](https://www.rsc.org/images/entities/char_2009.gif) :100, LiankeBio, China) overnight at 4 °C. Then the cells were treated by fluorescence-conjugated anti-mouse secondary antibody (1:200, LiankeBio, China) for 30 min at 37 °C. Afterward, the cells were treated by rhodamine phalloidin (Yeasen, China) and DAPI (Beyotime Biotechnology, China) for actin and nucleus staining, respectively. Confocal microscope system (TCS SP5 II, Leica, Germany) was used for immunofluorescence observation. Image J software was used to analyze cell fluorescent images, including measuring neurite length, cell area, cell aspect ratio and cell circularity. Cell aspect ratio was calculated as the length of the cell's long axis divided by the length of the short axis across the nucleus.31 Cell circularity was calculated as (4π × cell area)/perimeter2.32 5 × 10⁵ cells per well were cultured on the samples in 48-well plates for 1 day. The CGRP release was then assayed according to the instruction provided with the CGRP ELISA kit (CUSABIO, China).
:100, LiankeBio, China) overnight at 4 °C. Then the cells were treated by fluorescence-conjugated anti-mouse secondary antibody (1:200, LiankeBio, China) for 30 min at 37 °C. Afterward, the cells were treated by rhodamine phalloidin (Yeasen, China) and DAPI (Beyotime Biotechnology, China) for actin and nucleus staining, respectively. Confocal microscope system (TCS SP5 II, Leica, Germany) was used for immunofluorescence observation. Image J software was used to analyze cell fluorescent images, including measuring neurite length, cell area, cell aspect ratio and cell circularity. Cell aspect ratio was calculated as the length of the cell's long axis divided by the length of the short axis across the nucleus.31 Cell circularity was calculated as (4π × cell area)/perimeter2.32 5 × 10⁵ cells per well were cultured on the samples in 48-well plates for 1 day. The CGRP release was then assayed according to the instruction provided with the CGRP ELISA kit (CUSABIO, China).
2.10 Effects of PC12 cell conditioned media (CM) on the differentiation and mineralization of MC3T3-E1 cells
PC12 cells were cultured on the samples in 6-well plates at a density of 5 × 10⁵ cells per well for 2 days. The culture medium was collected and then mixed with complete culture medium at a ratio of 1:3 and stored for use in further CM experiments. MC3T3-E1 cells were cultured in 48-well plates at a density of 1 × 10⁴ cells per well, and incubated for 14 days with CM culture medium. The ALP activity and ECM mineralization assay was performed as described in Section 2.7.
2.11 Statistical analysis
The data were shown as mean ± standard deviation (SD) of three independent experiments (sample size n = 3 performed in triplicate). One-way ANOVA followed by SNK post hoc test was employed for analysis of statistical difference. Significance was indicated by * (p < 0.05), ** (p < 0.01) and *** (p < 0.001).3. Results and discussion
3.1 Surface characterization
The XRD patterns of all nanocoatings were presented in Fig. 1A. For the TiO2 nanocoating, the diffraction peaks at 2θ = 25.2°, 37.7°, 48.0° and 62.5° were ascribed to anatase-phase TiO2 (JCPDS no. 21–1272).33 Two diffraction peaks of the referential g-C3N4 at 2θ = 13.3° and 27.7° corresponded to the (100) in-plane structural packing of the conjugated aromatic system and the (002) interlayer-stacking motif in g-C3N4 phase (JCPDS no. 87-1526), respectively.34 The characteristic diffraction peaks of CN/TO composite nanocoating can be indexed as TiO2-anatase and g-C3N4, indicating that g-C3N4 was successfully loaded on TiO2. Moreover, compared with the diffraction peaks of referential TiO2 and g-C3N4, the intensity of the TiO2 characteristic peaks in CN/TO composite nanocoating became obviously broader and the diffraction peak of g-C3N4 in the composite nanocoating shifted slightly to higher angle. These suggested the heterostructure between g-C3N4 and TiO2 were formed. The absence of characteristic peaks of rGO in the ternary nanocoating may attribute to its low content on the surface. In order to characterize the reduction of GO, we deposited GO onto TiO2 nanocoating instead of CN/TO nanocomposite, which could avoid interference of g-C3N4 in C 1s spectra. Fig. S1 (ESI†) showed the C 1s spectra of the GO powder and the rGO/TiO2 nanocoating. The intensity of the C–O and C![[double bond, length as m-dash]](https://www.rsc.org/images/entities/char_e001.gif) O peaks for the rGO/TiO2 nanocoating were significantly lower than that for the GO powder. This indicated the reduction of GO when GO was coated onto the TiO2 nanocoating via anodic electrodeposition. As shown in Fig. 1B, Raman spectra confirmed the presence of rGO in the rGO/CN/TO nanocomposite. The two characteristic peaks of rGO appeared at around 1345 and 1598 cm−1 ascribing to the D and G band, respectively.
O peaks for the rGO/TiO2 nanocoating were significantly lower than that for the GO powder. This indicated the reduction of GO when GO was coated onto the TiO2 nanocoating via anodic electrodeposition. As shown in Fig. 1B, Raman spectra confirmed the presence of rGO in the rGO/CN/TO nanocomposite. The two characteristic peaks of rGO appeared at around 1345 and 1598 cm−1 ascribing to the D and G band, respectively.
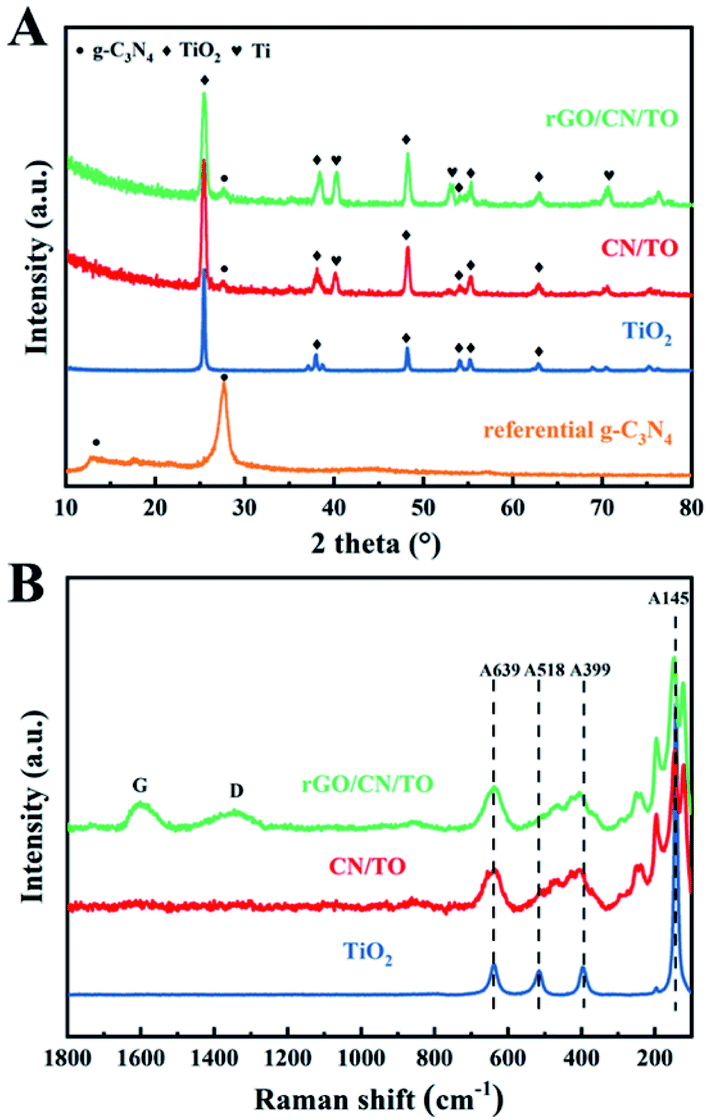 | ||
| Fig. 1 (A) The XRD patterns of the referential g-C3N4 powder and the TiO2, CN/TO and rGO/CN/TO nanocoatings; (B) Raman spectra of the TiO2, CN/TO and rGO/CN/TO nanocoatings. | ||
The FE-SEM images (Fig. 2A) displayed the morphologies of the as-prepared nanocoatings. The TiO2 nanocoating surface had anisotropic nanowire-like structures with diameters from 20 to 60 nm. For the CN/TO nanocomposite, there was no obvious morphology change after g-C3N4 deposition. This indicated that a conformal g-C3N4 coating was formed on the TiO2 nanowire surface. The high-resolution TEM (HRTEM) image of three composites shown in Fig. 2B, the g-C3N4 layer clung to the surface of the TiO2 nanowire closely. The HRTEM image of CN/TO composite showed the clear lattice fringe of TiO2 (d = 0.35 nm corresponding to the (101) crystal plane of anatase) which was in agreement with the inserted SAED pattern. The presence of N 1s peak in the wide scan XPS spectrum of the CN/TO composite also confirmed the existence of g-C3N4 (Fig. S2, ESI†). It could be clearly seen that transparent irregularity film was deposited on the top of the nanowires after loading the rGO nanoparticles (Fig. 2A). The formation of composite heterogeneous interface between rGO nanoparticle and CN/TO nanowire was confirmed by HRTEM in Fig. 2B. The EDS element mapping images (Fig. S3, ESI†) further demonstrated the existence of Ti, O, N and C in the rGO/CN/TO nanocomposite. According to the above results, it clearly explained that rGO/CN/TO was three-phase hybrid which had strong interactions among rGO, g-C3N4 and TiO2.
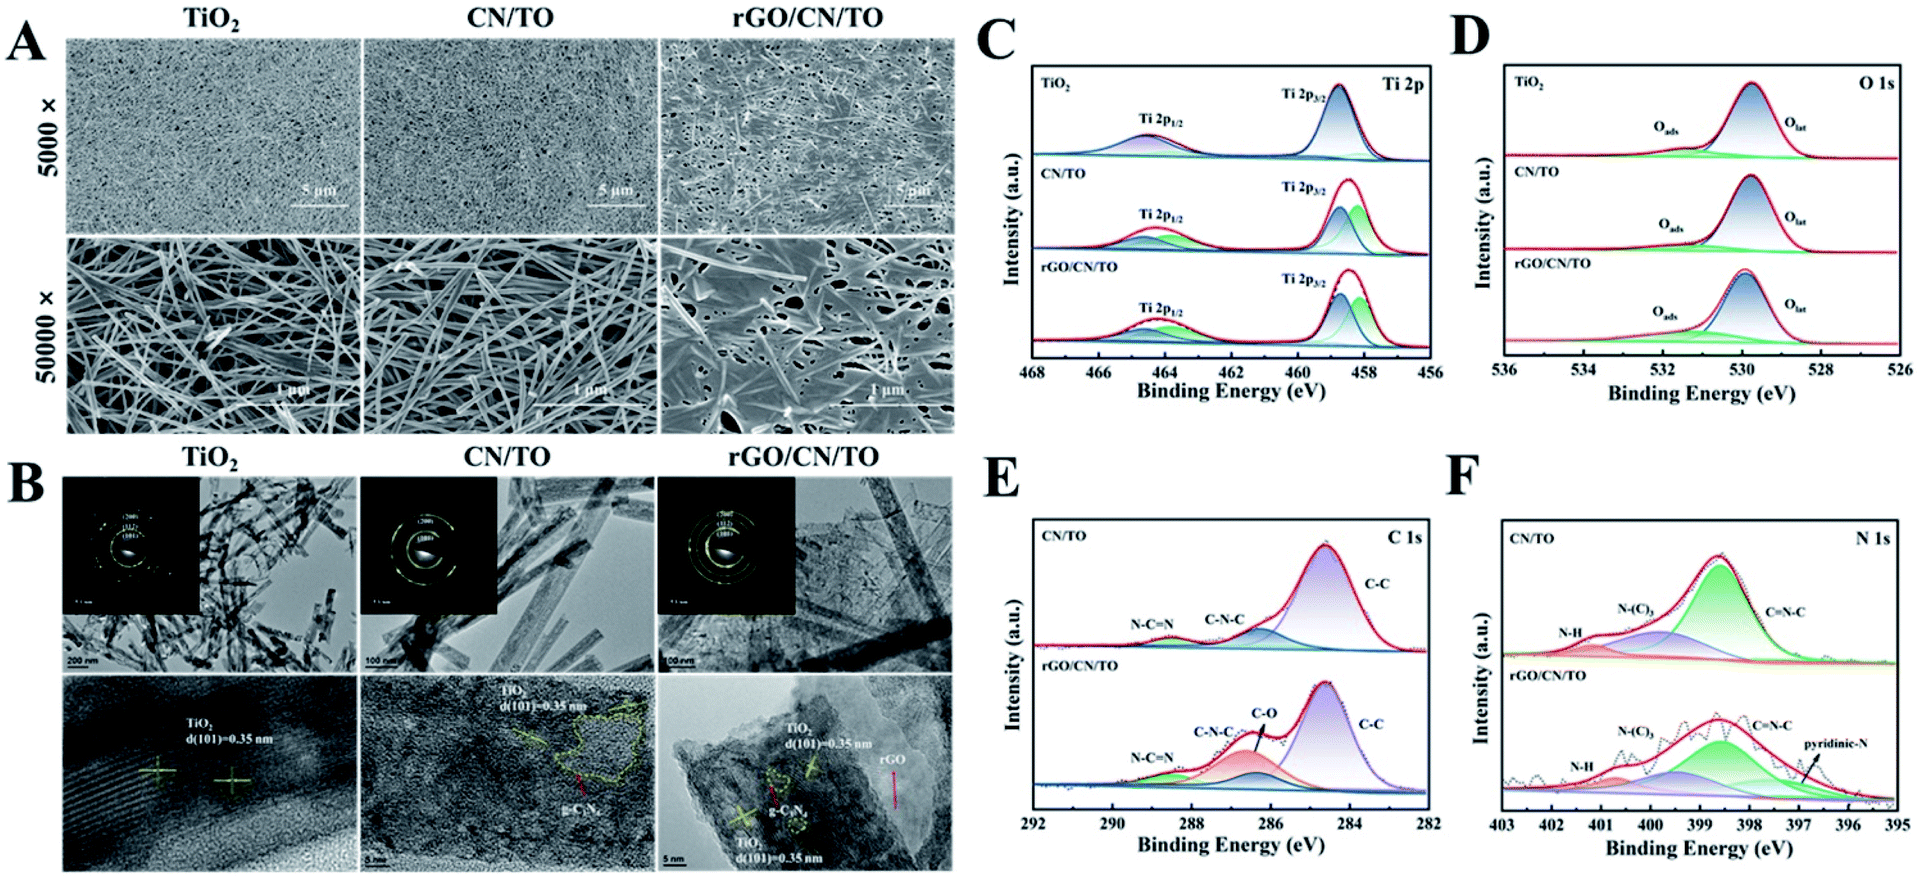 | ||
| Fig. 2 (A) The FE-SEM images and (B) the TEM images of the TiO2, CN/TO and rGO/CN/TO nanocoatings; XPS spectra with peak fitting analysis for (C) Ti 2p, (D) O 1s, (E) C 1s, and (F) N 1s of the as-prepared nanocoatings. | ||
XPS was used to investigate the elemental composition and chemical state of the samples. Fig. 2C showed the Ti 2p spectra of the TiO2, CN/TO and rGO/CN/TO nanocoatings. The binding energy peak of Ti 2p3/2 was found at 458.7, 458.4, and 458.4 eV over TiO2, CN/TO and rGO/CN/TO, respectively. The shift of Ti 2p peaks (0.3 eV) for CN/TO and rGO/CN/TO indicated the chemical environment change as the interaction between g-C3N4 and TiO2. Moreover, the fraction of Ti3+ in CN/TO and rGO/CN/TO was considerably higher than that in TiO2 (Table S1, ESI†), which was attributed to electron transfer between g-C3N4 and TiO2. The O 1s spectrum of the TiO2 nanocoating (Fig. 2D), two peaks were found at 531.5 and 529.8 eV, related to chemisorbed oxygen species (Oads) and lattice oxygen (Olat) in TiO2, respectively. Table S1, ESI† showed that the content of Oads was ranked by rGO/CN/TO > CN/TO > TiO2. The content of Oads corresponded to the content of defect sites (oxygen vacancies, VO) with low oxygen coordination. The ESR was further employed to determine the presence of VO in the as-prepared nanocoatings. An obvious characteristic signal of VO occurred in the spectrum of each sample (Fig. 3). The rGO/CN/TO observed the highest signal intensity.
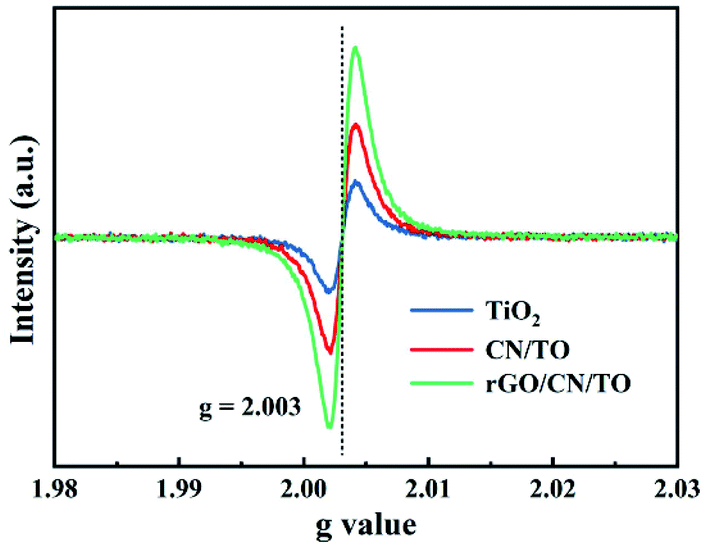 | ||
| Fig. 3 EPR spectra of the powder collected from the nanocoatings. | ||
As shown in Fig. 2E, three peaks at 284.6, 286.2 and 288.5 eV were found in the C 1s spectrum of the CN/TO composite. Which were corresponded to C–C bond, CN or C–NH2 bond, and sp2 bonded carbon in N–CN, respectively. For the rGO/CN/TO composite, the emergence peak at 286.6 eV was due to the existence of C–O bonds, coming from the rGO after undergoing the reduction of GO.35 In the N 1s spectrum of the TiO2 nanocoating (Fig. 2F), three peaks were found at 398.4, 399.4, and 400.8 eV, related to C–NC, N–(C)3 and C–N–H, respectively. However, when compared with the CN/TO nanocoating, the characteristic peaks of N 1s in rGO/CN/TO shifted slightly to higher binding energy, revealing the chemical crosslinking between rGO and g-C3N4. Moreover, the appearance of the pyridinic-N peak at 397.6 eV was observed in rGO/CN/TO, which was ascribed to the nitrogen–graphene interaction.
3.2 Charge separation properties of the as-prepared samples and their relationship to band structure
PL spectra was employed to investigate the separation and recombination of photoinduced charges in the as-prepared samples. Fig. 4A showed that referential g-C3N4 presented a strong emission peak at around 450 nm that came from its band edge emission. In contrast, the PL intensity decreased significantly after combination with TiO2, suggesting that the photoinduced charge recombination was suppressed. The PL intensity of rGO/CN/TO at the peak of 350 nm was lower than that of CN/TO and TiO2, indicating that the separation of carriers was further enhanced in rGO/CN/TO. It was probable that rGO as conductive interface, the recombination of electron–hole was further suppressed.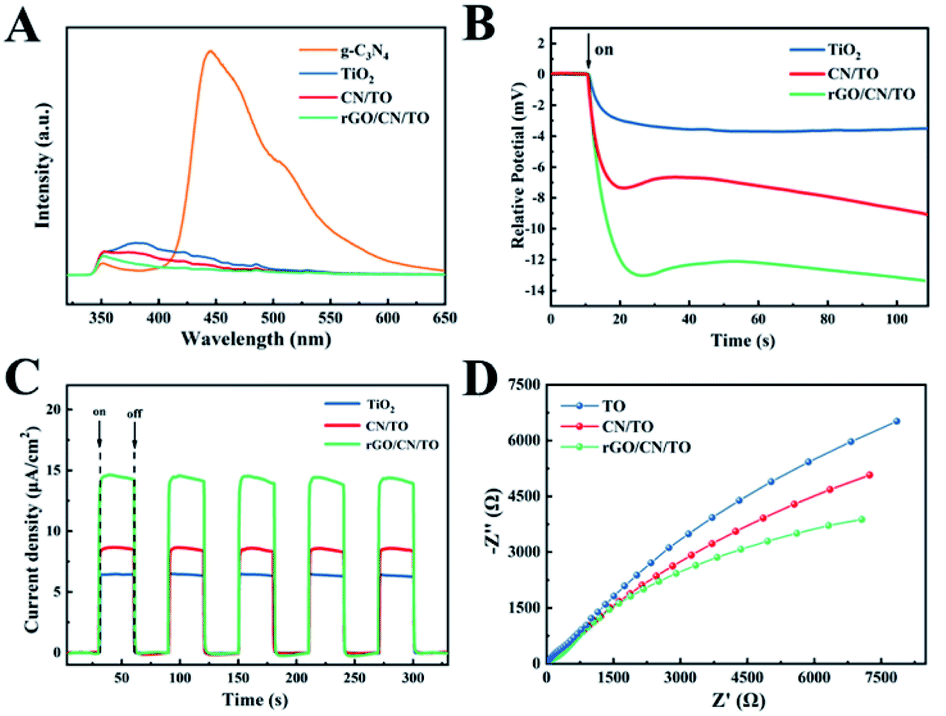 | ||
| Fig. 4 (A) The PL emission spectra, (B) the photovoltage response curves, (C) the photocurrent response curves, and (D) the EIS spectra of the TiO2, CN/TO, and rGO/CN/TO nanocoatings. | ||
To further investigate the photoelectric conversion capability of the nanocoatings, the open circuit potential and transient photocurrent response of the nanocoatings under visible-light illumination were measured. Fig. 4B showed that the open circuit potential of the rGO/CN/TO was the highest (∼13.5 mV), which was 3.6-fold that of the TiO2 (∼3.7 mV) and 1.5-fold that of the CN/TO (∼8.9 mV). The open circuit potential of the CN/TO was considerably increased compared with that of the TiO2. The transient photocurrent curves of the as-prepared samples with five on–off cycles were shown in Fig. 4C. The photocurrent of each sample increased or decreased rapidly when the light was switched on or off. TiO2 nanocoating showed the lowest photocurrent response value (6.3 μA cm−2) due to its poor electrical conductivity and fast rate of carrier recombination. The addition of g-C3N4 layer elevated the value to 8.5 μA cm−2. The highest photocurrent response value was showed in the rGO/CN/TO composite (14.8 μA cm−2), which was 2.3-fold that of the TiO2 and 1.7-fold that of the CN/TO. The increased intensity resulted from higher efficiency of the rGO/CN/TO in photogenerated carrier separation and migration. EIS was employed to analyze the electrochemical impedance of the as-prepared samples. The smallest radius of rGO/CN/TO in the EIS impedance plots (Fig. 4D) indicated reduced charge transfer resistance and improved charged separation efficiency, which was in agreement with the results of the open circuit potential and transient photocurrent response.
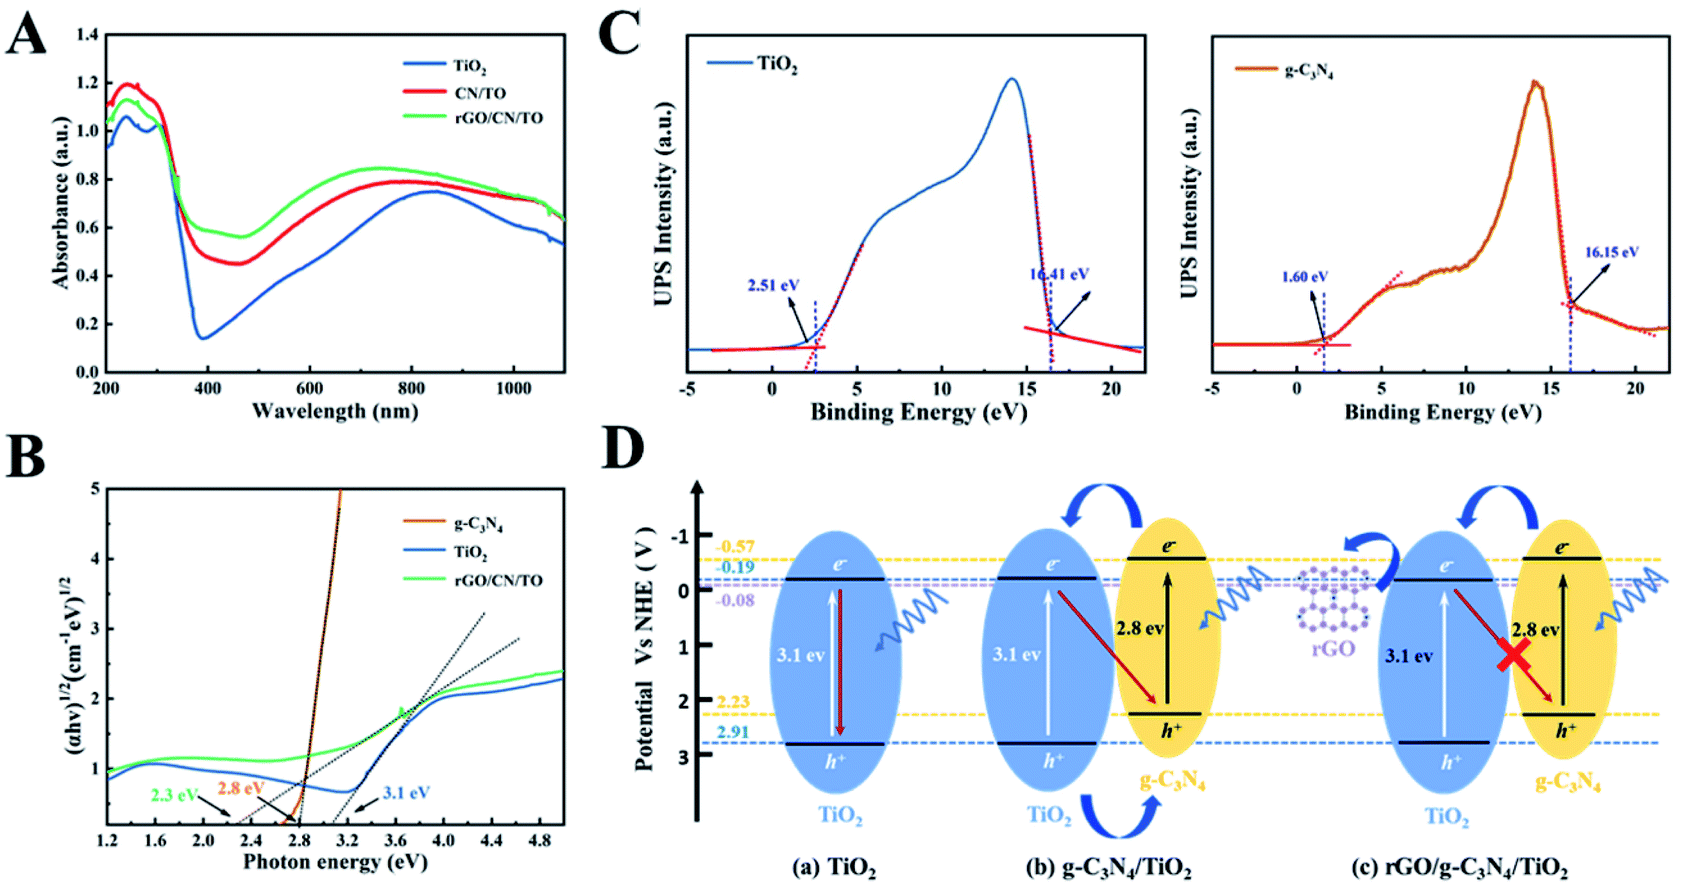
The UV-vis DRS of all nanocoatings were depicted in Fig. 5A. For the TiO2 nanocoating, the absorption edge was located at wavelength in the UV range (<390 nm); however, the absorption regions of the CN/TO and rGO/CN/TO composites were broadened to the visible-light. This might be attributed to the outstanding visible-light-harvesting capacity of g-C3N4. Moreover, the rGO/CN/TO composite exhibited more obvious bathochromic shift and relatively stronger absorption intensity, indicating rGO could tune the band gap and facilitate the generation of electron–hole pairs.
 | ||
| Fig. 5 (A) The UV-vis DRS spectra and (B) the Tauc plots of the TiO2, CN/TO, and rGO/CN/TO nanocoatings. (C) Valence band photoemission spectra of the TiO2 powder collected from the TiO2 nanocoating and the g-C3N4 powder. (D) Photocatalytic mechanism of the TiO2, CN/TO and rGO/CN/TO composite. | ||
As shown in the Tauc plots of Fig. 5B, the Eg of TiO2, g-C3N4 and rGO/CN/TO were estimated as 3.1, 2.8 and 2.3 eV, respectively. In order to detect the pathway of charge transport in CN/TO and rGO/CN/TO, UPS was employed to determine the positions of valence band (VB) edges of the relevant components. According to Fig. 5C, the VB potentials (Evb) of TiO2 and g-C3N4 were estimated as 7.31, and 6.67 eV (vs. vacuum), respectively, which were calculated by using excitation energy of 21.22 eV to subtract the width of the spectrum. The energy values (vs. vacuum) could be converted to the potential vs. the normal hydrogen electrode (NHE) by using the formula ENHE = Evacuum − 4.44. Therefore, Evb of TiO2 and g-C3N4 were calculated as 2.91 and 2.23 V (vs. NHE), respectively. According to the Eg of TiO2 and g-C3N4, the conduction band (CB) potentials of TiO2 and g-C3N4 were estimated as −0.19 and −0.57 V (vs. NHE), respectively. We obtained the band structure of all composites as shown in Fig. 5D.
For the CN/TO heterojunction, g-C3N4 could absorb the visible light easily. Under LED light, excited-state electrons in the CB of g-C3N4 could jump to that of TiO2, while holes in the VB of TiO2 could be transferred to that of g-C3N4. Therefore, the photoinduced electron–hole pairs were postponed to recombinant. However, the electrons accumulated in the CB of TiO2 might recombine with the holes accumulated in the VB of g-C3N4, which limited the photoelectrical activity. For the rGO/CN/TO composite, due to the CB potential of TiO2 is higher than the work function of rGO (−0.08 V vs. NHE),36 the electrons in the CB of TiO2 can be transferred by rGO. Therefore, the rGO will facilitate the effective separation of the photoinduced carriers, leading to higher photoelectrical activity.
3.3 The enhanced cellular activities of the MC3T3-E1 and PC12 cells on the nanocoatings under visible-light stimulation
The biocompatibility of all nanocoatings for MC3T3-E1 osteoblasts was examined by SEM and CCK-8 assay. The MC3T3-E1 have a good attachment with the surfaces of all samples after 1 day of culture (Fig. S4, ESI†). Moreover, the cells on the rGO/CN/TO nanocoating surface exhibited higher adhesion density and greater degree of cell–cell interactions. Similarly, as shown in Fig. 6A, the cell proliferation rate for the rGO/CN/TO group at the pre-determined time point (day 1, 4 and 7) was considerably higher than that for the TiO2 and CN/TO groups. No significant difference was observed between the TiO2 and CN/TO groups. These indicated that the rGO/CN/TO composite surface provided more favorable surface for MC3T3-E1 attachment (corresponding to its moderate hydrophilicity, as shown in Fig. S5†) and proliferation (probably due to the oxygen-containing functional groups). Normally hydrophilic surfaces are favorable for cell adhesion. Specifically, better cell adhesion was achieved on moderately hydrophobic surfaces (water contact angle of 20°–40°).37 This could be ascribed to the preferential adsorption of cell-adhesive proteins onto the moderately hydrophilic surfaces.38 This was in agreement with previous studies that rGO can efficiently enhance the adhesion and proliferation of osteoblastic and neural cell lines.39–41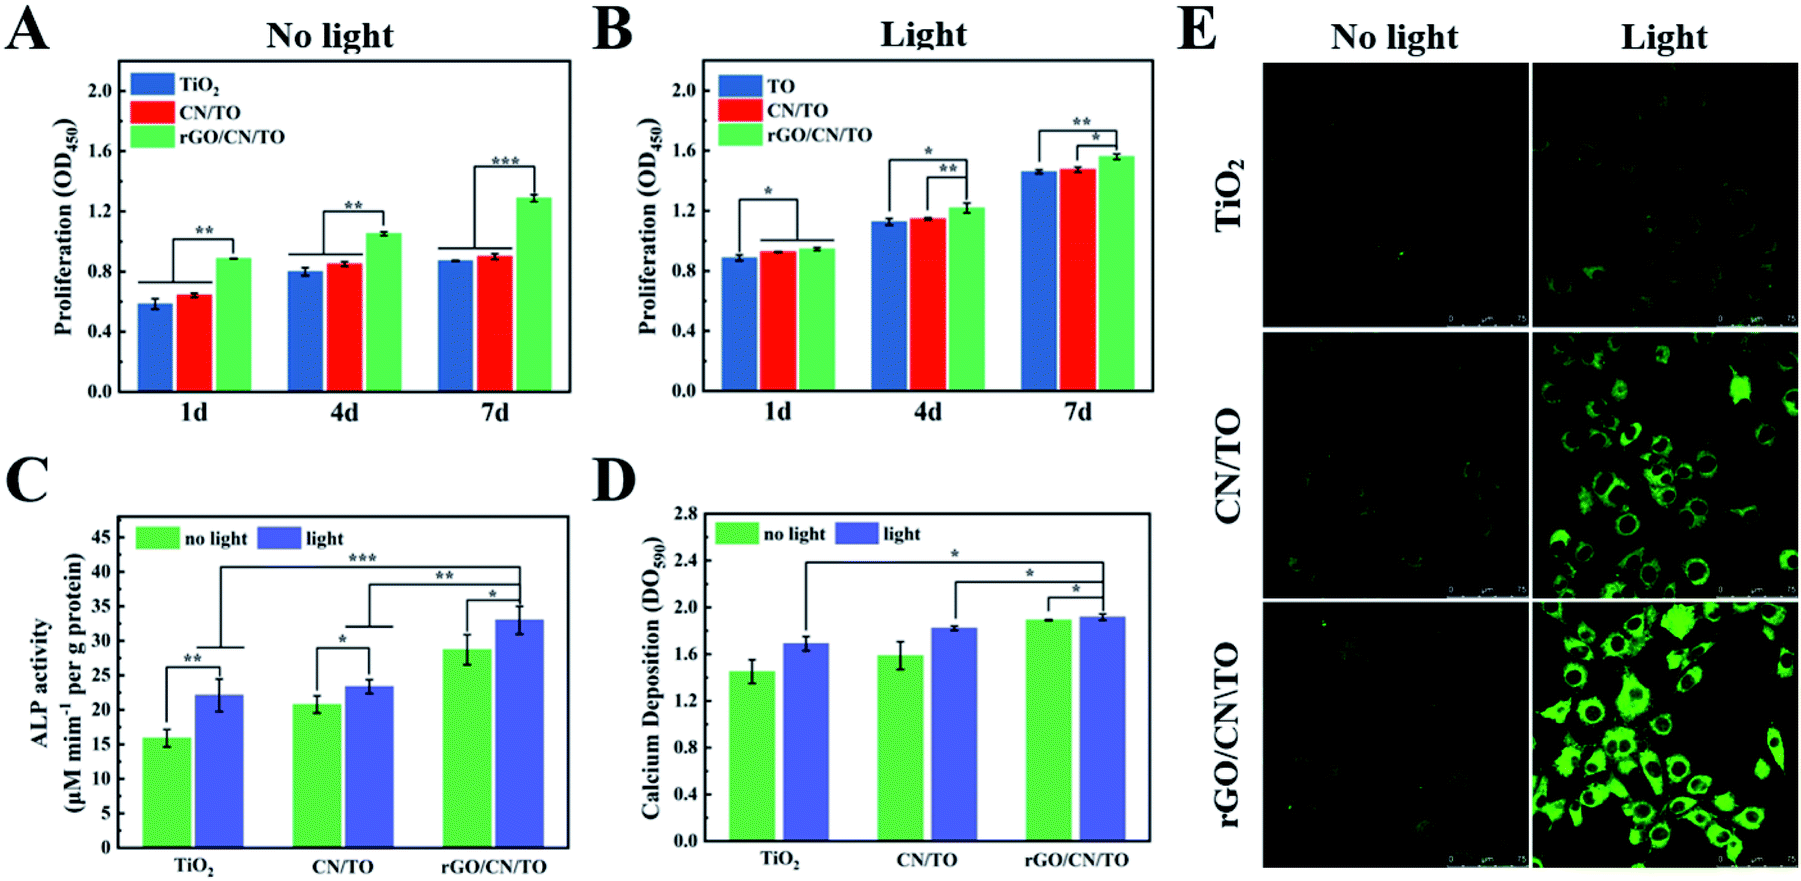 | ||
| Fig. 6 Cell proliferation on the various groups for 1, 4, and 7 days (A) without or (B) with visible-light stimulation. (C) ALP activity and (D) calcium deposits of MC3T3-E1 cells after cultured on the different groups for 14 days with or without visible-light stimulation. (E) Immunofluorescence images of MC3T3-E1 cells on the samples' surface to evaluate intracellular Ca2+ level using a Ca2+-sensitive dye (Fluo-4 AM). | ||
We further investigated the effects of visible-light stimulation on the proliferation and differentiation behaviors of MC3T3-E1 cells. A monochromatic light of 460 nm wavelength with 1 W cm−2 intensity was used to be the light source. All the samples exhibited a positive response to the visible-light stimulation (Fig. 6B), resulting in an increased cell proliferation rate. The cells on rGO/CN/TO showed the highest proliferation rate. Fig. 6C showed that the ALP activity of the osteoblasts on the rGO/CN/TO surface in the dark was significantly greater than that of the cells on TiO2 and CN/TO. This enhancement was probably because graphene has high affinity to proteins and small molecules involved in osteoblast growth and differentiation through π–π and hydrophobic interactions.42,43 This enhancement was also agreement with previous studies that the graphene-based materials could significantly enhance ALP activity and osteogenic-related genes expressions of the osteoblasts.44,45 Under visible-light irradiation, the ALP activity for the TiO2, CN/TO and rGO/CN/TO groups increased 39.1%, 15.0%, and 12.6%, respectively. A similar trend was found for the level of calcium deposition by the cells for different groups (Fig. 6D). The cells on rGO/CN/TO with or without visible-light stimulation showed the highest level of calcium deposition.
Ca2+ influx is the most consistently occurring cell response to electrical stimulation and is implicated to play a vital role in triggering Ca2+ dependent cell signaling cascade at the stage of osteoblastic differentiation.46 To investigate whether photoelectric stimulation can increase Ca2+ influx, Fluo-4 AM (a Ca2+-sensitive dye) was employed to evaluate the intracellular Ca2+ level. Under normal culture condition, there was no significant difference in fluorescent densities among all the nanocoatings (Fig. 6E). However, visible-light irradiation induced stronger fluorescent densities for the cells on the nanocoatings indicating Ca2+ influx through electrical cues. Moreover, the rGO/CN/TO nanocoating showed the greatest increase in fluorescence densities, followed by the CN/TO and TiO2 nanocoatings. This trend was consistent with the trend of the differentiation of preosteoblasts on the nanocoatings under light irradiation. Fu et al. developed a photoelectric-responsive bismuth sulfide/hydroxyapatite (BS/HAp) film on artificial implants. When electrons were created by BS/HAp under NIR irradiation, they were transferred to the cell membranes and enhanced osteogenic differentiation via activating the Wnt/Ca2+ signaling pathway in the MSCs.47
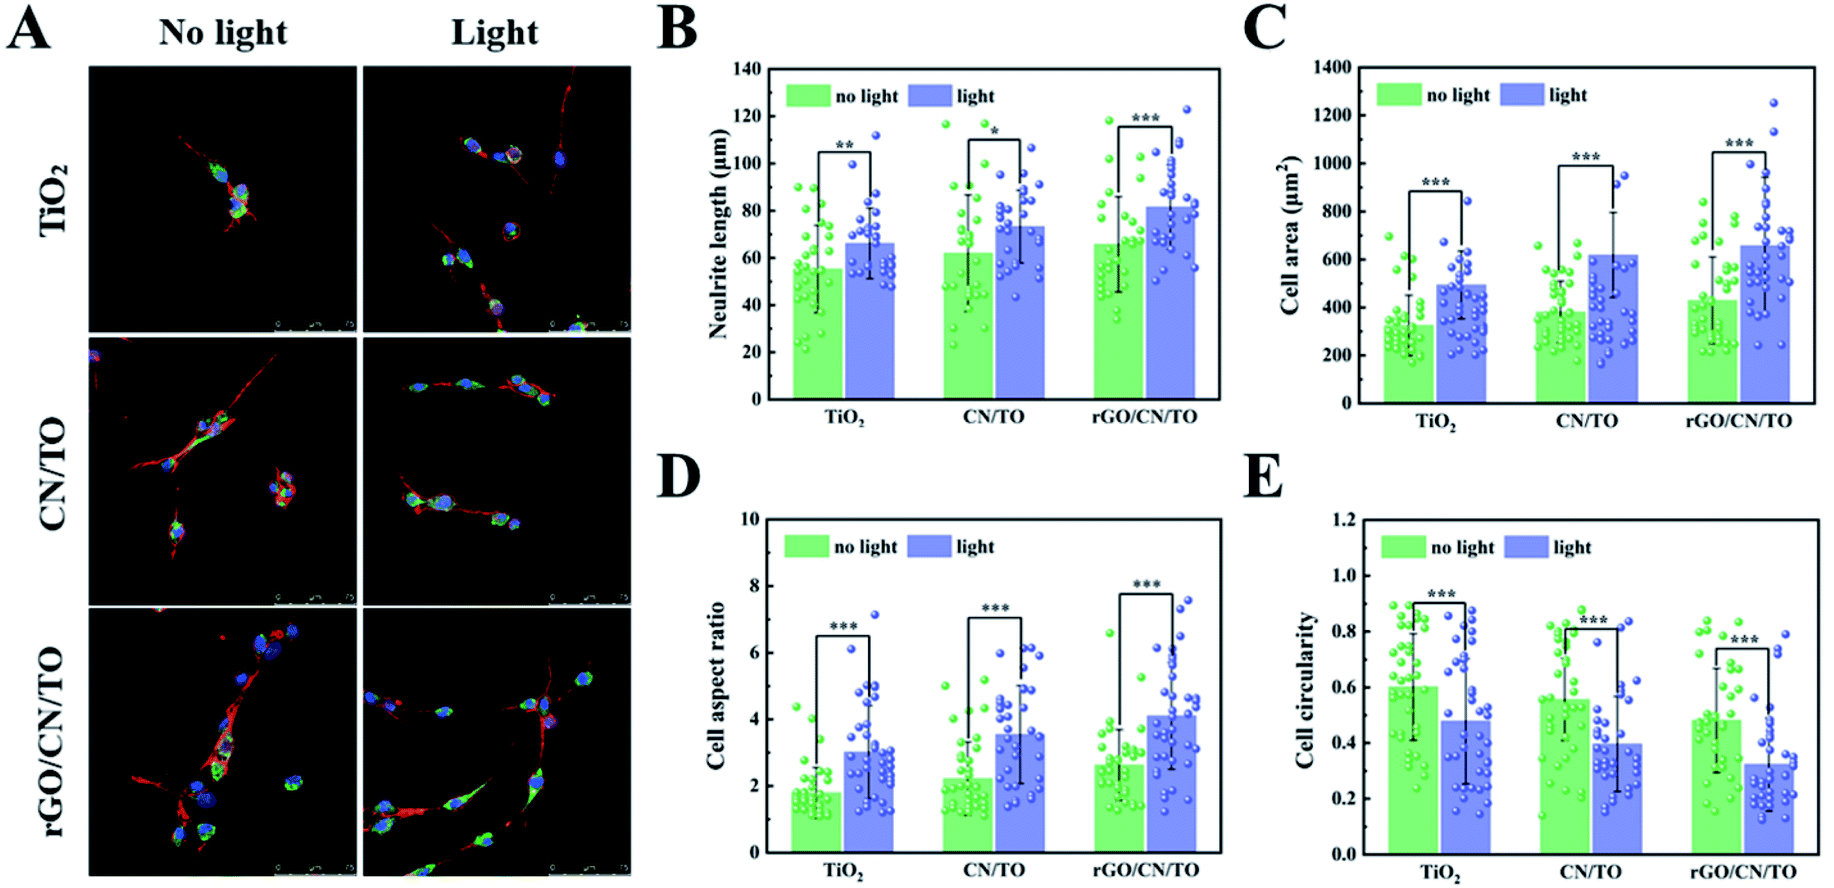
Fig. 7A showed the typical images of PC12 cells on all the nanocoatings after 4 days of differentiation with or without visible-light stimulation. Cell morphology and neuronal differentiation was characterized by immunofluorescent staining48 in which F-actin was stained with TRITC phalloidin (red), vinculin was stained anti-vinculin–FITC antibody (green), and nuclei was stained with DAPI (blue). Under the visible-light stimulation, the neuronal differentiation of PC12 cells on the rGO/CN/TO surface was highly promoted. The cells on the rGO/CN/TO surface had elongated cell shape with the best neurite outgrowth suggesting the formation of neural networks. Vinculin is an adaptor protein that localizes in the sites upon cellular adhesion. Enhanced vinculin dots were observed for the cells in the rGO/CN/TO group compared with the TiO2 and CN/TO groups. This was consistent with the results of the enhanced MC3T3-E1 cell attachment on rGO/CN/TO. The increased fibronectin adsorption and the more exposure of the integrin-binding domain of adsorbed fibronectin (Fig. S6, ESI†) on the rGO/CN/TO surface could contribute to the enhanced cell attachment. Under the visible-light stimulation, the cells on the rGO/CN/TO surface had more vinculin dots colocalized with the neurite. Evidence suggested that vinculin might play an important part in establishing cell–substrate contacts.29,49 In the work by Varnum-Finney et al., vinculin-deficient PC12 cells exhibited a reduced rate of neurite outgrowth.50
 | ||
| Fig. 7 (A) Immunofluorescence images of PC12 cells on the various nanocoatings with or without visible-light stimulation, and the cell staining: F-actin with TRITC phalloidin (red), vinculin with anti-vinculin–FITC antibody (green), and nuclei with DAPI (blue). Analysis results of (B) neurite length, (C) cell area, (D) cellaspect ratio, and (E) cell circularity of PC12 cells on the different nanocoatings with or without visible-light stimulation. | ||
Based on the obtained fluorescent images, neurite length, cell area, cell aspect ratio and cell circularity were quantified as indicators of cell functions,41 and summarized in Fig. 7B, C, D, and E, respectively. Under visible light stimulation, the rGO/CN/TO nanocoating significantly improved average neurite length when compared with the other nanocoatings. Visible-light stimulation further increased the neurite length by 24.0% over the rGO/CN/TO group. After visible-light stimulation to the coatings, the cell area and the cell aspect ratio for each coating were up-regulated, while the down-regulated cell circularity was observed. Regardless of visible-light stimulation, PC12 cells in the rGO/CN/TO group had a higher aspect ratio and cell area as well as a lower circularity level when compared with the TiO2 and CN/TO groups. These results indicated that the rGO/CN/TO nanocoating exerted greater effects on enhancing the functions of PC12 cells. A growing body of studies demonstrated that photo-stimulating biomaterials could positively regulate neuronal cell behavior. Akhavan et al. reported that the rGO/TiO2 heterojunction film accelerated neuronal differentiation of hNSCs under UV light stimulation.11 Yang et al. developed a nanoweb substrates composed of photoactive polymer poly(3-hexylthiophene) (P3HT) which activated the voltage-gated ion channels in human fetal neural stem cells and further enhanced neuronal differentiation.51 In order to improve the conductivity of P3HT, Yuan et al. developed a fibrous membrane heterojunction composed of P3HT, polycaprolactone (PCL) and polypyrrole (PPY). Under visible light stimulation, PCL-P3HT/PPY enhanced Ca2+ influx and facilitated neurogenesis of PC12 cells in vitro.52
The potential mechanism of cellular response to light-initiated electrical stimulation has not yet been completely understood, although its effect on cellular functions in the skeletal and nervous system has been generally proven. The g-C3N4 layer can produce electron–hole pairs with visible-light irradiation. The electrons can transfer to the relatively conductive rGO layer which further affects the cells through activation of plasma membrane Ca2+ channels. Besides, production of reactive oxygen species (ROS) in response to photocatalytic stimulation could be another plausible explanation of enhanced neuronal and osteoblastic differentiation. It has been demonstrated that ROS participated in vital signaling pathways associated with the differentiation processes of MC3T3-E1 and PC12 cells.46,53,54 Given the evidence of the capability of g-C3N4 as a photocatalysts for ROS generation under visible-light irradiation, it can speculate that g-C3N4 based photocatalytic system might affect the functions of MC3T3-E1 and PC12 cells through inducing ROS production, similar to direct electrical stimulation.
3.4 Targeting CGRP through photocatalytic stimulation to enhance MC3T3-E1 cell differentiation
To verify the effect of the nerve microenvironment induced by photoelectric materials on osteogenesis, MC3T3-E1 cells were exposed to conditioned medium (CM) from PC12 cells cultured on different samples' surfaces with or without visible-light irradiation. Fig. 8A showed that CM from the cells in different samples with irradiation upregulated the level of ALP activities of MC3T3-E1 cells. The level of ALP activities by MC3T3-E1 cells for the CN/TO and rGO/CN/TO groups without irradiation was considerably increased compared to that for the TiO2 group without irradiation. CM from the cells in different samples with irradiation considerably upregulated the level of ALP activities with the rGO/CN/TO group showing the highest level. The level of calcium deposition of MC3T3-E1 cells that cultured with CM from PC12 cells, have similar trend as shown in Fig. 8B. Given the evidence that stimulated release of CGRP from PC12 cells by electrical stimulation can promote osteogenesis, we also investigated the amount of CGRP secreted by PC12 cells on different nanocoating surfaces with or without light stimulation (Fig. 8C). The level of CGRP production for different groups was significantly upregulated by light stimulation. PC12 cells on the rGO/CN/TO nanocoating showed the highest level of CGRP production regardless of light stimulation. This was consistent with the results of the level of ALP activities of MC3T3-E1 cells cultured with CM from PC12 cells grown on the groups.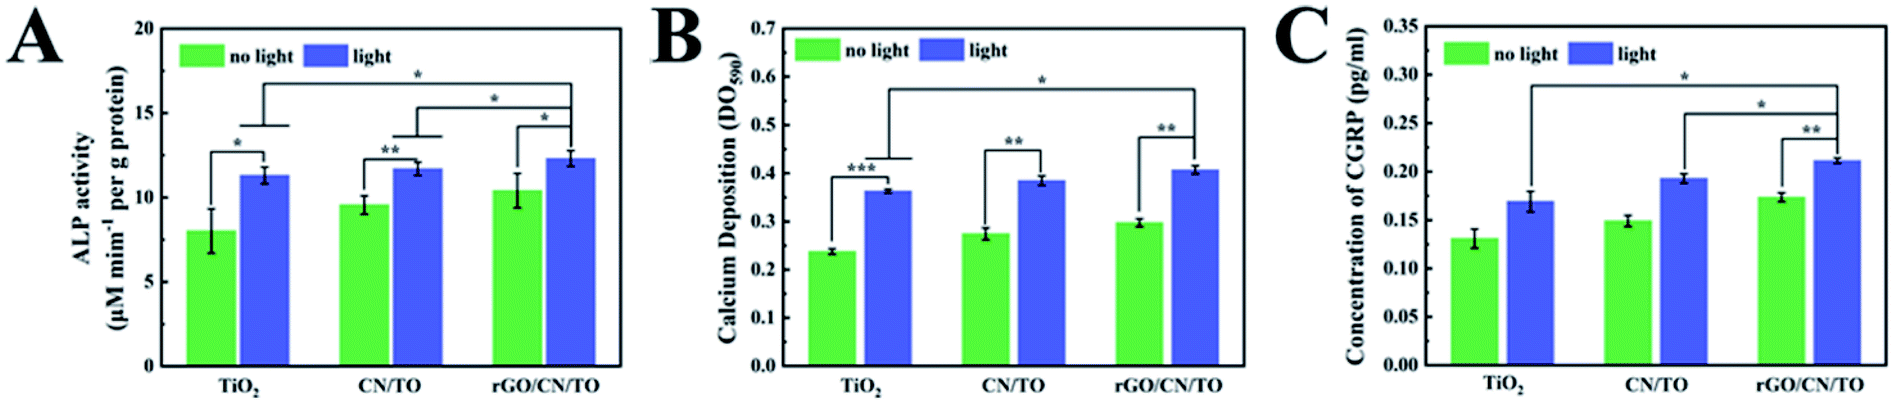 | ||
| Fig. 8 (A) ALP activity and (B) calcium deposits for MC3T3-E1 cells cultured in PC12 cell conditioned medium with or without visible-light stimulation. (C) CGRP secretion of PC12 cells on the various nanocoatings with or without visible-light stimulation. | ||
Although the ternary nanocoating exerted photo-stimulation on MC3T3-E1 and PC12 cells in vitro, it is difficult to be used in vivo to treat bone defect. It is because penetration of visible-light through muscle and skin would be a problem. In order to realize the potential in vivo application, it is necessary to further expand the light absorption range of the nanocoating to the near-infrared (NIR) or IR regions. For example, in a recent work by Fu and co-workers, they utilized NIR light to activate photoelectrons with a bismuth sulfide/hydroxyapatite film to enhance bone regeneration in vivo.47
4. Conclusion
In this work, the rGO/CN/TO ternary nanocoating was prepared via a combination of the hydrothermal and chemical co-precipitation methods. g-C3N4 layer employed as photosensitizer expanded the light absorption range of the TiO2 nanocoating, and further addition of rGO nanosheets enhanced electronic conductivity of the composite nanocoating. Under blue LED exposure, the rGO/CN/TO ternary nanocoating exhibited higher open circuit potential and transient photocurrent density when compared with the TiO2 and CN/TO nanocoatings. The enhanced photo-electrochemical properties of the rGO/CN/TO nanocoating were attributed to the improved separation of photoinduced charge at the heterointerface, according to the energy band diagram of the ternary nanocoating. Compared with the TiO2 and CN/TO nanocoatings, the ternary nanocoating exerted greater effects on enhancing osteogenic differentiation of MC3T3-E1 cells through increasing Ca2+ influx under visible-light stimulation. PC12 cells on the ternary nanocoating exhibited highly improved neurite outgrowth and more CGRP release under light irradiation, which induced osteoblastic differentiation of MC3T3-E1 cells in an indirect co-culture system. Overall, utilizing photocatalytic nanocoating to trigger optoelectronic conversion under light irradiation would be a promising approach for simultaneous regeneration of bone and nerves.Conflicts of interest
There are no conflicts to declare.Acknowledgements
This work was supported by the National Natural Science Foundation of China (Grant No. 51971236), the Shanghai Rising-Star Program (Grant No. 21QA1410400), the Science and Technology Commission of Shanghai Municipality (Grant No. 21S31901200), and the Youth Innovation Promotion Association of the Chinese Academy of Sciences (Grant No. 2020254).References
- F. Elefteriou, Physiol. Rev., 2018, 98, 1083–1112 CrossRef CAS PubMed.
- R. Li, T. Ahmad, M. Spetea, M. Ahmed and A. Kreicbergs, J. Bone Miner. Res., 2001, 16, 1505–1510 CrossRef PubMed.
- J. E. Madsen, M. Hukkanen, A. K. Aune, I. Basran, J. F. Møller, J. M. Polak and L. Nordsletten, Clin. Orthop. Relat. Res., 1998, 351, 230–240 CrossRef.
- M. Hukkanen, Y. T. Konttinen, S. Santavirta, P. Paavolainen, X.-H. Gu, G. Terenghi and J. M. Polak, Neuroscience, 1993, 54, 969–979 CrossRef CAS PubMed.
- J. Cao, S. Zhang, A. Gupta, Z. Du, D. Lei, L. Wang and X. Wang, Int. J. Med. Sci., 2019, 16, 831–837 CrossRef CAS PubMed.
- J. L. Whited and M. Levin, Curr. Opin. Genet. Dev., 2019, 57, 61–69 CrossRef CAS PubMed.
- Y. Huang, H. Deng, Y. Fan, L. Zheng, J. Che, X. Li and K. E. Aifantis, Mater. Sci. Eng., C, 2019, 103, 109748 CrossRef CAS PubMed.
- S. W. Liu, K. Li, Q. Y. Shen, D. D. Shao, S. S. Huang, Y. T. Xie and X. B. Zheng, Appl. Surf. Sci., 2021, 545, 148827 CrossRef CAS.
- D. McCreery, V. Pikov and P. R. Troyk, Journal of Neural Engineering, 2010, 7, 036005 CrossRef PubMed.
- Z. Zhang, L. H. Klausen, M. Chen and M. Dong, Nano Micro Small, 2018, 14, 1801983 Search PubMed.
- O. Akhavan and E. Ghaderi, Nanoscale, 2013, 5, 10316–10326 RSC.
- K. Li, S. Liu, T. Hu, I. Razanau, X. Wu, H. Ao, L. Huang, Y. Xie and X. Zheng, ACS Biomater. Sci. Eng., 2020, 6, 969–983 CrossRef CAS PubMed.
- J. Suzurikawa, M. Nakao, Y. Jimbo, R. Kanzakie and H. Takahashi, Sens. Actuators, B, 2014, 192, 393–398 CrossRef CAS.
- X. Wang, F. Wang, B. Chen, K. Cheng, J. Wang, J. Zhang and H. Song, Appl. Surf. Sci., 2018, 453, 320–329 CrossRef CAS.
- W. Li, Z. Wang, D. Kong, D. Du, M. Zhou, Y. Du, T. Yan, J. You and D. Kong, J. Alloys Compd., 2016, 688, 703–711 CrossRef CAS.
- J. Li, L. Liu, Y. Yu, Y. Tang, H. Li and F. Du, Electrochem. Commun., 2004, 6, 940–943 CrossRef CAS.
- L. Zhou, J. Lei, L. Wang, Y. Liu and J. Zhang, Res. Chem. Intermed., 2017, 43, 2081–2101 CrossRef CAS.
- G. Liao, S. Chen, X. Quan, H. Yu and H. Zhao, J. Mater. Chem., 2012, 22, 2721–2726 RSC.
- Z. Y. Zhang, R. D. Xui, Z. G. Wang, M. D. Dong, B. X. Cui and M. L. Chen, ACS Appl. Mater. Interfaces, 2017, 9, 34736–34743 CrossRef CAS PubMed.
- N. Abeynayake, A. Arthur and S. Gronthos, Bone, 2021, 142, 115645 CrossRef CAS PubMed.
- Y. Li, L. Yang, Z. Zheng, Z. Li, T. Deng, W. Ren, C. Wu and L. Guo, Exp. Ther. Med., 2017, 14, 4001–4008 CAS.
- C.-z. Huang, X.-n. Yang, D.-c. Liu, Y.-g. Sun and X.-m. Dai, Cell Biochem. Biophys., 2015, 73, 609–617 CrossRef CAS PubMed.
- Y. F. Zhang, J. K. Xu, Y. C. Ruan, M. K. Yu, M. O'Laughlin, H. Wise, D. Chen, L. Tian, D. F. Shi, J. L. Wang, S. H. Chen, J. Q. Feng, D. H. K. Chow, X. H. Xie, L. Z. Zheng, L. Huang, S. Huang, K. Leung, N. Lu, L. Zhao, H. F. Li, D. W. Zhao, X. Guo, K. M. Chan, F. Witte, H. C. Chan, Y. F. Zheng and L. Qin, Nat. Med., 2016, 22, 1160–1169 CrossRef CAS PubMed.
- J.-S. Han, Trends Neurosci., 2003, 26, 17–22 CrossRef CAS PubMed.
- A. Ebersberger, B. Averbeck, K. Messlinger and P. W. Reeh, Neuroscience, 1999, 89, 901–907 CrossRef CAS PubMed.
- H. H. Pan, Y. T. Xie, K. Li, D. D. Hu, J. Zhao, X. B. Zheng and T. T. Tang, RSC Adv., 2015, 5, 101834–101842 RSC.
- Y. X. Xu, H. Bai, G. W. Lu, C. Li and G. Q. Shi, J. Am. Chem. Soc., 2008, 130, 5856 CrossRef CAS PubMed.
- S. W. Liu, K. Li, D. D. Shao, Q. Y. Shen, S. S. Huang, H. Ji, Y. T. Xie and X. B. Zheng, Appl. Surf. Sci., 2020, 534, 147649 CrossRef CAS.
- L. Lv, Y. T. Xie, K. Li, T. Hu, X. Lu, Y. Z. Cao and X. B. Zheng, Adv. Healthcare Mater., 2018, 7, 1800675 CrossRef PubMed.
- A. Ghobadi, T. G. Ulusoy, R. Garifullin, M. O. Guler and A. K. Okyay, Sci. Rep., 2016, 6, 30587 CrossRef CAS PubMed.
- C. A. Bashur, L. A. Dahlgren and A. S. Goldstein, Biomaterials, 2006, 27, 5681–5688 CrossRef CAS PubMed.
- H. Y. Yu, K. P. Lim, S. J. Xiong, L. P. Tan and W. Shim, Adv. Healthcare Mater., 2013, 2, 1188–1197 CrossRef CAS PubMed.
- Y. Chen, W. Huang, D. He, Y. Situ and H. Huang, ACS Appl. Mater. Interfaces, 2014, 6, 14405–14414 CrossRef CAS PubMed.
- X. Wang, J. M. Carlsson, K. Domen, K. Maeda, A. Thomas, K. Takanabe, G. Xin and M. Antonietti, Nat. Mater., 2009, 8, 76–80 CrossRef CAS PubMed.
- K. L. Lv, S. Fang, L. L. Si, Y. Xia, W. K. Ho and M. Li, Appl. Surf. Sci., 2017, 391, 218–227 CrossRef CAS.
- W. J. Ong, L. L. Tan, S. P. Chai, S. T. Yong and A. R. Mohamed, Nano Energy, 2015, 13, 757–770 CrossRef CAS.
- K. Webb, V. Hlady and P. A. Tresco, J. Biomed. Mater. Res., 1998, 41, 422–430 CrossRef CAS PubMed.
- J. H. Lee, G. Khang, J. W. Lee and H. B. Lee, J. Colloid Interface Sci., 1998, 205, 323–330 CrossRef CAS PubMed.
- K. Yang, J. Lee, J. S. Lee, D. Kim, G. E. Chang, J. Seo, E. Cheong, T. Lee and S. W. Cho, ACS Appl. Mater. Interfaces, 2016, 8, 17763–17774 CrossRef CAS PubMed.
- K. H. Zhang, H. H. Zheng, S. Liang and C. Y. Gao, Acta Biomater., 2016, 37, 131–142 CrossRef CAS PubMed.
- X. F. Liu, A. L. Miller, S. Park, B. E. Waletzki, Z. F. Zhou, A. Terzic and L. C. Lu, ACS Appl. Mater. Interfaces, 2017, 9, 14677–14690 CrossRef CAS PubMed.
- W. C. Lee, C. H. Y. X. Lim, H. Shi, L. A. L. Tang, Y. Wang, C. T. Lim and K. P. Loh, ACS Nano, 2011, 5, 7334–7341 CrossRef CAS PubMed.
- H. H. Yoon, S. H. Bhang, T. Kim, T. Yu, T. Hyeon and B. S. Kim, Adv. Funct. Mater., 2014, 24, 6455–6464 CrossRef CAS.
- Z. Z. Tian, L. X. Huang, X. B. Pei, J. Y. Chen, T. Wang, T. Yang, H. Qin, L. Sui and J. Wang, Colloids Surf., B, 2017, 155, 150–158 CrossRef CAS PubMed.
- X. J. Li, K. L. Lin and Z. L. Wang, RSC Adv., 2017, 7, 14430–14437 RSC.
- G. Thrivikraman, S. K. Boda and B. Basu, Biomaterials, 2018, 150, 60–86 CrossRef CAS PubMed.
- J. N. Fu, X. M. Liu, L. Tan, Z. D. Cui, Y. F. Zheng, Y. Q. Liang, Z. Y. Li, S. L. Zhu, K. W. K. Yeung, X. B. Feng, X. B. Wang and S. L. Wu, ACS Nano, 2019, 13, 13581–13594 CrossRef CAS PubMed.
- M. Stiess and F. Bradke, Dev. Neurobiol., 2011, 71, 430–444 CrossRef CAS PubMed.
- S. Liu, K. Li, T. Hu, X. Wu, H. Ao, Y. Xie and X. Zheng, Adv. Mater. Interfaces, 2020, 7, 1902127 CrossRef CAS.
- B. Varnumfinney and L. E. Reichardt, J. Cell Biol., 1994, 127, 1071–1084 CrossRef CAS PubMed.
- K. Yang, J. Y. Oh, J. S. Lee, Y. Jin, G. E. Chang, S. S. Chae, E. Cheong, H. K. Baik and S. W. Cho, Theranostics, 2017, 7, 4591–4604 CrossRef CAS PubMed.
- B. Yuan, M. R. F. Aziz, S. Li, J. Wu, D. Li and R.-K. Li, Acta Biomater., 2022, 139, 82–90 CrossRef CAS PubMed.
- W. Jing, Y. F. Zhang, Q. Cai, G. Q. Chen, L. Wang, X. P. Yang and W. H. Zhong, ACS Chem. Neurosci., 2019, 10, 348–357 CrossRef CAS PubMed.
- D. Shao, K. Li, T. Hu, S. Wang, H. Xu, S. Zhang, S. Liu, Y. Xie and X. Zheng, Chem. Eng. J., 2021, 415, 128913 CrossRef CAS.
Footnote |
| † Electronic supplementary information (ESI) available. See DOI: 10.1039/d2ra00282e |
| This journal is © The Royal Society of Chemistry 2022 |