 Open Access Article
Creative Commons Attribution 3.0 Unported Licence
Facile synthesis of ZnMoO4/AlPO4-5 nanorod composites as visible-light-driven photocatalysts and high-performance energy storage materials†
Delvin Aman *ab,
Samira Abdel-Azimc,
S. Said
 a and
Saad G. Mohamedd
aCatalysis Laboratory, Refining Department, Egyptian Petroleum Research Institute (EPRI), Nasr City, 11727, Cairo, Egypt
bEPRI-Nanotechnology Center, Egyptian Petroleum Research Institute (EPRI), Nasr City, 11727, Cairo, Egypt. E-mail: delvin.aman@epri.sci.eg
cProcess Development Division, Egyptian Petroleum Research Institute (EPRI), Nasr City, 11727, Cairo, Egypt
dMining and Metallurgy Engineering Department, Tabbin Institute for Metallurgical Studies (TIMS), Tabbin, Helwan 109, Cairo, 11421, Egypt. E-mail: sgmmohamed@gmail.com
First published on 2nd March 2022
Abstract
The present article describes the facile one-step hydrothermal synthesis of single-crystalline ZnMoO4/AlPO4-5 nanorod composites. The physicochemical properties of the synthesized materials, such as structure, morphology, and bandgap, were determined using techniques such as X-ray diffraction (XRD), field emission scanning electron microscopy (FE-SEM), N2 adsorption–desorption isotherms, X-ray photoelectron (XPS), ultraviolet-visible (UV-vis), and photoluminescence (PL). The XRD pattern of synthesized ZnMoO4/AlPO4-5 verifies the synthesis of nanocomposites. Diffuse UV-vis spectra reveal that ZnMoO4/AlPO4-5 nanorod composites exhibit an indirect semiconductor with an optical bandgap between 3.15 and 3.7 eV depending on Mo![[thin space (1/6-em)]](https://www.rsc.org/images/entities/char_2009.gif) :
:![[thin space (1/6-em)]](https://www.rsc.org/images/entities/char_2009.gif) Zn ratio. In comparison to pure AlPO4-5, ZnMoO4/AlPO4-5 nanocrystal composites showed significantly higher photocatalytic activity for the degradation of para-nitrophenol (PNP, 0.04 g l−1), with 14, 99, 70, and 54% for AlPO4-5, Mo
Zn ratio. In comparison to pure AlPO4-5, ZnMoO4/AlPO4-5 nanocrystal composites showed significantly higher photocatalytic activity for the degradation of para-nitrophenol (PNP, 0.04 g l−1), with 14, 99, 70, and 54% for AlPO4-5, Mo![[thin space (1/6-em)]](https://www.rsc.org/images/entities/char_2009.gif) :
:![[thin space (1/6-em)]](https://www.rsc.org/images/entities/char_2009.gif) Zn (2)/AlPO4-5, Mo
Zn (2)/AlPO4-5, Mo![[thin space (1/6-em)]](https://www.rsc.org/images/entities/char_2009.gif) :
:![[thin space (1/6-em)]](https://www.rsc.org/images/entities/char_2009.gif) Zn (4)/AlPO4-5, and Mo
Zn (4)/AlPO4-5, and Mo![[thin space (1/6-em)]](https://www.rsc.org/images/entities/char_2009.gif) :
:![[thin space (1/6-em)]](https://www.rsc.org/images/entities/char_2009.gif) Zn (6)/AlPO4-5, respectively. This result might be attributed to the composite's efficient charge transfer and optimized electron–hole pair recombination. The supercapacitive ability of ZnMoO4/AlPO4-5 nanorod composites was also investigated in this work. For the prepared electrodes using AlPO4-5, Mo
Zn (6)/AlPO4-5, respectively. This result might be attributed to the composite's efficient charge transfer and optimized electron–hole pair recombination. The supercapacitive ability of ZnMoO4/AlPO4-5 nanorod composites was also investigated in this work. For the prepared electrodes using AlPO4-5, Mo![[thin space (1/6-em)]](https://www.rsc.org/images/entities/char_2009.gif) :
:![[thin space (1/6-em)]](https://www.rsc.org/images/entities/char_2009.gif) Zn (2)/AlPO4-5, Mo
Zn (2)/AlPO4-5, Mo![[thin space (1/6-em)]](https://www.rsc.org/images/entities/char_2009.gif) :
:![[thin space (1/6-em)]](https://www.rsc.org/images/entities/char_2009.gif) Zn (4)/AlPO4-5, and Mo
Zn (4)/AlPO4-5, and Mo![[thin space (1/6-em)]](https://www.rsc.org/images/entities/char_2009.gif) :
:![[thin space (1/6-em)]](https://www.rsc.org/images/entities/char_2009.gif) Zn (6)/AlPO4-5, the capacitance values were 400, 725, 450, and 481.25 F g−1, respectively, at a current density of 0.5 A g−1. This study shows that ZnMoO4/AlPO4-5 nanorod composites are a potential visible-light-responsive photocatalyst. The electrochemical results further demonstrate the high capacitance of ZnMoO4/AlPO4-5 nanorod composites toward energy-storage applications.
Zn (6)/AlPO4-5, the capacitance values were 400, 725, 450, and 481.25 F g−1, respectively, at a current density of 0.5 A g−1. This study shows that ZnMoO4/AlPO4-5 nanorod composites are a potential visible-light-responsive photocatalyst. The electrochemical results further demonstrate the high capacitance of ZnMoO4/AlPO4-5 nanorod composites toward energy-storage applications.
1. Introduction
Nanocrystalline semiconductor materials have gained increased attention because of their increased activity, high surface-to-volume ratio, and unique optical and electrical properties relative to bulk materials.1,2 In photocatalytic applications, titanium dioxide (TiO2) has received extensive research. Due to those materials' disadvantages in electron/hole recombination, their doped and composite forms have been widely synthesized and deemed successful.3 So, to achieve high photocatalytic efficiency cost-effectively as an alternative to TiO2 materials/composites, various types of semiconductor nanomaterials based on Zn were given more consideration.4 ZnO has been used as an effective, inexpensive, and nontoxic semiconductor to degrade a wide range of different pollutants. Due to the advantages of photocatalysis-based ZnO, semiconductors have been widely used in recent years for the photodegradation of various phenolic compounds.5 Although the positive attributes of photocatalysts, their applicability is limited due to the poor adsorption properties of semiconductors. Indeed, molybdenum trioxide (MoO3), an n-type semiconductor, can be used in enhancement visible light photocatalytic properties of ZnO semiconductor,6 where MoO3 has good structural stability, less toxicity, and low cost. Semiconductor zinc molybdate, ZnMoO4, among the various types of zinc-based materials, is a particularly significant inorganic material with a wide range of applications in catalysis,7 electrochemical applications,8,9 and photoluminescence10 due to its superior optical and electrical properties and non-toxicity. It is an inorganic substance found in nature with two distinct crystalline phases: a-triclinic and b-monoclinic.11 Zinc atoms (Zn) are bound to six oxygen atoms (O), forming distorted octahedral clusters [ZnO6]; zinc and molybdenum atoms are bound to six O atoms which encourage the origin of distorted octahedral clusters [ZnO6]/[MoO6].12,13 The photoactivity of ZnMoO4 is a result of its structural diversity, superior optical properties in a broad emission spectrum, and substantial charge transfer between the bands of activated 2p (O2) and 4d (Mo6+) orbitals.14 In addition, possible improvements to the photocatalytic capabilities of traditional inorganic semiconductors could include their large specific surface area, broad visible-light absorption, and adjustable bandgap edges.15 It has been demonstrated that loading and dispersing ZnMoO4 particles on suitable supports is a viable alternative method for achieving the aforementioned goals. Various supports such as graphene oxide,16,17 carbon nanotubes,18 BiVO4,19 BiFeWO6,20 and polydopamine21 were studied previously to improve the loading and dispersion of semiconductor photocatalyst particles. Supports for ZnMoO4 photocatalyst should be developed that are inexpensive and highly efficient, such as AlPO4-n molecular sieves. AlPO4-n molecular sieves have a large surface area, uniform pores, and high thermal stability, making them ideal for use as photocatalyst supports.22 To our knowledge, no study has been conducted on preparing a composite photocatalyst ZnMoO4/AlPO4-5 for the degradation of harmful pollutants.On the other hand, supercapacitors (SCs) materials have long been regarded as an attractive class of energy storage devices due to their rapid charge–discharge capability, long cycle life, safety, and reliability.23 Furthermore, many studies have reported that surface modification of electrode materials can lead to superior cycle and rate performance due to improved thermal and structural stability and the prevention of cation leaching.24,25 In ZnMoO4, the electrochemical contributions from both zinc and molybdenum ions are expected to be more diverse than those from a single binary oxide, resulting in improved electrochemical energy storage performance. Recently, R. Roshani and A. Tadjarodi synthesized and used ZnMoO4 nanoparticles as an electrode for energy storage applications.26 In addition, phosphide material coatings on electrode materials have shown excellent performance since the (PO4)3− combination produces more excellent thermal stability than oxide materials.24,25,27 In this study, we facile fabricated ZnMoO4 loaded AlPO4 as an electrode for the first time and investigated its electrochemical performance.
Our findings have unveiled a helpful perspective for advancing inorganic composite materials with exceptional performance and improved stability for environmental purification and energy storage application. The photocatalytic performance of the ZnMoO4/AlPO4 was investigated by degrading p-nitrophenol (PNP) in the visible region of the spectrum light. Additionally, the other objective of this study is to develop an electrode material with high power, energy density, and cycling stability. ZnMoO4/AlPO4-5 nanocomposites, principally, demonstrated promising potential for energy storage applications.
2. Experimental
2.1. Preparation of the catalysts
Aluminophosphate was prepared by hydrothermal method with stepwise stages. The molar ratio of aluminium isopropoxide and phosphoric acid was 0.02![[thin space (1/6-em)]](https://www.rsc.org/images/entities/char_2009.gif) :
:![[thin space (1/6-em)]](https://www.rsc.org/images/entities/char_2009.gif) 1. The trimethylamine (TEA) is used as structure directing agent (SDA). The molar ratio of the synthesis mixture gel was Al2O3
1. The trimethylamine (TEA) is used as structure directing agent (SDA). The molar ratio of the synthesis mixture gel was Al2O3![[thin space (1/6-em)]](https://www.rsc.org/images/entities/char_2009.gif) :
:![[thin space (1/6-em)]](https://www.rsc.org/images/entities/char_2009.gif) 1.3 P2O5
1.3 P2O5![[thin space (1/6-em)]](https://www.rsc.org/images/entities/char_2009.gif) :
:![[thin space (1/6-em)]](https://www.rsc.org/images/entities/char_2009.gif) 1.2(SDA)
1.2(SDA)![[thin space (1/6-em)]](https://www.rsc.org/images/entities/char_2009.gif) :
:![[thin space (1/6-em)]](https://www.rsc.org/images/entities/char_2009.gif) 205H2O. The gel was transferred to a Teflon lined autoclave and heated at 185 °C for one day. Then, the resultant material was washed three times and dried at 80 °C overnight. The dried sample calcined at 600 °C for 6 h in presence of dried air to remove any residue of the organic template (TEA).7 Incipient wetness impregnation method using molybdic acid and zinc acetate solution (purchased from Merck Company) and used without further purification to prepare ZnMoO4 supported on AlPO4-5 samples. Range of Mo/Zn molar ratios (2, 4 & 6) was used to study the suitable ratio for ZnMoO4/AlPO4-5 composites formation. The prepared samples are labeled: Mo
205H2O. The gel was transferred to a Teflon lined autoclave and heated at 185 °C for one day. Then, the resultant material was washed three times and dried at 80 °C overnight. The dried sample calcined at 600 °C for 6 h in presence of dried air to remove any residue of the organic template (TEA).7 Incipient wetness impregnation method using molybdic acid and zinc acetate solution (purchased from Merck Company) and used without further purification to prepare ZnMoO4 supported on AlPO4-5 samples. Range of Mo/Zn molar ratios (2, 4 & 6) was used to study the suitable ratio for ZnMoO4/AlPO4-5 composites formation. The prepared samples are labeled: Mo![[thin space (1/6-em)]](https://www.rsc.org/images/entities/char_2009.gif) :
:![[thin space (1/6-em)]](https://www.rsc.org/images/entities/char_2009.gif) Zn (2)/AlPO4-5, Mo
Zn (2)/AlPO4-5, Mo![[thin space (1/6-em)]](https://www.rsc.org/images/entities/char_2009.gif) :
:![[thin space (1/6-em)]](https://www.rsc.org/images/entities/char_2009.gif) Zn (4)/AlPO4-5 and Mo
Zn (4)/AlPO4-5 and Mo![[thin space (1/6-em)]](https://www.rsc.org/images/entities/char_2009.gif) :
:![[thin space (1/6-em)]](https://www.rsc.org/images/entities/char_2009.gif) Zn (6)/AlPO4-5. The resultant samples were left to sit for drying at 120 °C for 4 hours. Then the samples were calcined at 500 °C for 4 hours according to TGA analysis.
Zn (6)/AlPO4-5. The resultant samples were left to sit for drying at 120 °C for 4 hours. Then the samples were calcined at 500 °C for 4 hours according to TGA analysis.
2.2. Characterization of the samples
The prepared samples were characterized using various techniques, including X-ray diffraction (XRD) on a Shimadzu XD-1 diffractometer using Cu Kα radiation (λ = 0.1542 nm) at a beam voltage of 40 kV and a current of 40 mA. The XRD peaks were indexed using the Joint Committee on Powder Diffraction Society's (JCPDS) database.The surface area, total pore volume, and average pore diameter using N2 adsorption–desorption isotherms were measured using NOVA 3200 S Unite, a comprehensive automated gas sorption analyzer (Quanta chrome Corporation). Before adsorption, all samples were degassed for four hours at 300 °C in a nitrogen atmosphere to ensure a dry, clean surface. The Barrett–Joyner–Halenda (BJH) method was used to determine the pore size distributions for the desorption branch of the isotherm.
The morphology of prepared samples was tested under Field Emission Electron Microscope (FE-SEM) (Zeiss, Sigma 300VP, Germany) using an accelerating voltage of 30 kV.
X-ray photoelectron spectroscopy (XPS) was collected on K-ALPHA (Thermo Fisher Scientific, USA) with monochromatic X-ray Al K-alpha radiation −10 to 1350 eV spot size 400 μ at pressure 10–9 mbar with full-spectrum pass energy 200 eV and narrow-spectrum 50 eV.
Thermal analysis (DTC-TGA), was performed to study the structural changes of the prepared samples with thermal treatment on SDTQ-600 (TA-USA) thermo balance instrument. 10 mg of sample was heated up to 1100 °C, with a heating rate of 10 °C min−1 in an air flow at a rate of 100 mL min−1.
UV-vis spectrophotometer (Jasco model V-570) was used for recording the UV-vis spectrum with a diffuse reflectance attachment IRS-2200 (Shimadzu). Also, the spectrofluorophotometer RF-5301PC (Shimadzu) with an excitation wavelength of 300 nm was measured by photoluminescence spectra (PL).
2.3. Photocatalytic decomposition of p-nitrophenol (PNP)
The experiments were carried out using a medium pressure 125 W mercury lamp (300–460 nm, λg ∼ 450 nm) in a photocatalytic oxidation reactor located in the center of the cylindrical reactor. A schematic diagram of the visible light laboratory-scale photoreactor used in the current research was shown in S1.† Degeneration of p-nitrophenol (PNP) in an aqueous solution was evaluated at various irradiation periods. Before starting illumination, a suspension containing 1.0 g l−1 of catalyst and 0.04 g l−1 of PNP were stirred continuously in the dark for 30 min to reach an adsorption–desorption equilibrium between the surface of photocatalyst and nitrophenol molecules in the dark. The concentration of PNP in solution was used as the initial value for the kinetic treatment of the photodegradation processes. During the experiments, cooling by water circulation at 25 °C was performed at constant stirring. At illumination intervals, the sample of the solution was collected, centrifuged, and filtered through a Millipore filter (pore size 0.22 m). The filtrate was analyzed by UV-vis spectrophotometry (Shimadzu Scientific Instruments, Inc., Columbia, MD, USA). The spectral measurements were taken at a maximum absorption wavelength of PNP at 402 nm.2.4. Electrochemical measurements
The electrochemical performance of the pristine AlPO4-5 and its corresponding ZnMoO4 supported AlPO4-5 samples: MZ (2)/AlPO4-5, MZ (4)/AlPO4-5, and MZ (6)/AlPO4-5 were examined as active electrode material for SC applications by the method of three-electrode cell system in 6 M KOH aqueous electrolyte solution using an electrochemical testing station (Voltalab 40 PGZ 301, Radiometer Analytical, France) at the room temperature, with a platinum wire as a counter electrode and saturated calomel electrode (SCE) as a reference electrode. The preparation of working electrodes proceeded by mixing the as-synthesized active material with carbon black, which acts as a conductive additive, and Nafion as a binder material in a mass ratio of 80![[thin space (1/6-em)]](https://www.rsc.org/images/entities/char_2009.gif) :
:![[thin space (1/6-em)]](https://www.rsc.org/images/entities/char_2009.gif) 10
10![[thin space (1/6-em)]](https://www.rsc.org/images/entities/char_2009.gif) :
:![[thin space (1/6-em)]](https://www.rsc.org/images/entities/char_2009.gif) 10, respectively. To obtain a suspended solution from the previous mixture, 0.7 mL of ethyl alcohol was added with continuous sonication. Consequently, this suspended solution was drop-casted onto the nickel foam as a current collector (1 cm (width), 2 cm (length)) (Xiamen Tob New Energy Technology Co. Ltd, China). The obtained coat was then dried at 80 °C overnight. The mass loading of the used-active material of each electrode was about 2 ± 0.5 mg cm−2. The electrochemical behavior for the prepared electrodes was achieved and characterized based on cyclic voltammetry (CV), galvanostatic charge–discharge (GCD), and electrochemical impedance spectroscopy (EIS) measurements.
10, respectively. To obtain a suspended solution from the previous mixture, 0.7 mL of ethyl alcohol was added with continuous sonication. Consequently, this suspended solution was drop-casted onto the nickel foam as a current collector (1 cm (width), 2 cm (length)) (Xiamen Tob New Energy Technology Co. Ltd, China). The obtained coat was then dried at 80 °C overnight. The mass loading of the used-active material of each electrode was about 2 ± 0.5 mg cm−2. The electrochemical behavior for the prepared electrodes was achieved and characterized based on cyclic voltammetry (CV), galvanostatic charge–discharge (GCD), and electrochemical impedance spectroscopy (EIS) measurements.
The CV measurements were achieved within a potential range of −0.1 to 0.6 V (vs. SCE) at different scan rates from 10 to 200 mV s−1. Additionally, at varied current densities from 0.5 to 10 A g−1, the GCD measurements were evaluated within a potential range from −0.1 to 0.4 V (vs. SCE). The Nyquist plots tested the EIS measurements in the frequency range of 100 kHz to 0.01 Hz. Based on the GCD discharge curves, the specific capacitance (Csp) (F g−1) and specific capacity (Cs) (C g−1) were estimated according to eqn (1) and (2), respectively.28
 | (1) |
 | (2) |
3. Results and discussions
3.1. Structure and morphology
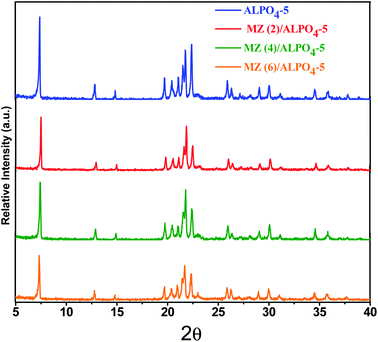
X-ray diffraction pattern of the prepared Mo![[thin space (1/6-em)]](https://www.rsc.org/images/entities/char_2009.gif) :
:![[thin space (1/6-em)]](https://www.rsc.org/images/entities/char_2009.gif) Zn (x) AlPO4-5 nanocomposite x = 0, 2, 4, and 6 are represented in Fig. 1. The pattern for the AlPO4-5 sample identifies peaks that are sharp, narrow, and strong, at 2θ = 7.4, 12.84, 14.86, 19.71, 21.54, 22.38, 25.9, 29.01°. The peaks are corresponding with a hexagonal prism-shaped AlPO4-5 pattern (JCPDS 31-735). Else, weak and low-intensity peaks are detected at 2θ = 21.07, 26.3, 29.9, 34.5°, assuming AlPO4-5 orthorhombic structure. Furthermore, diffracted weak peaks detected at 2θ = 20.34, 21.78, 23.03, 35.7, are appropriate with the tridymite phase (JCPDS 36-735, dense aluminum phosphate). Therefore, the X-ray diffraction confirms that the prepared sample via hydrothermal method at heating temperature 185 °C for 24 h consisted of a mixture of AlPO4-5 and tridymite phases.
Zn (x) AlPO4-5 nanocomposite x = 0, 2, 4, and 6 are represented in Fig. 1. The pattern for the AlPO4-5 sample identifies peaks that are sharp, narrow, and strong, at 2θ = 7.4, 12.84, 14.86, 19.71, 21.54, 22.38, 25.9, 29.01°. The peaks are corresponding with a hexagonal prism-shaped AlPO4-5 pattern (JCPDS 31-735). Else, weak and low-intensity peaks are detected at 2θ = 21.07, 26.3, 29.9, 34.5°, assuming AlPO4-5 orthorhombic structure. Furthermore, diffracted weak peaks detected at 2θ = 20.34, 21.78, 23.03, 35.7, are appropriate with the tridymite phase (JCPDS 36-735, dense aluminum phosphate). Therefore, the X-ray diffraction confirms that the prepared sample via hydrothermal method at heating temperature 185 °C for 24 h consisted of a mixture of AlPO4-5 and tridymite phases.
The XRD pattern for Mo![[thin space (1/6-em)]](https://www.rsc.org/images/entities/char_2009.gif) :
:![[thin space (1/6-em)]](https://www.rsc.org/images/entities/char_2009.gif) Zn (2–6)/AlPO4-5 samples demonstrated the phenomenon of pristine structure memorization without distortion, with well-resolved diffraction peaks related to the AFI structure, indicating that the prepared samples retain their AlPO4-5 crystal structure after loading and calcining. Meanwhile, as the amount of Mo
Zn (2–6)/AlPO4-5 samples demonstrated the phenomenon of pristine structure memorization without distortion, with well-resolved diffraction peaks related to the AFI structure, indicating that the prepared samples retain their AlPO4-5 crystal structure after loading and calcining. Meanwhile, as the amount of Mo![[thin space (1/6-em)]](https://www.rsc.org/images/entities/char_2009.gif) :
:![[thin space (1/6-em)]](https://www.rsc.org/images/entities/char_2009.gif) Zn ratio increases, the peak intensities of the AlPO4-5 phases decrease noticeably. In particular, the peak at 2θ = 30.5° has been slightly broadened. Since the main diffraction peak of the XRD spectrum of zinc molybdate ZnMoO4 is 30.52° (111) with the monoclinic structure according to (JCPDS card no: 25-1024).4 The broadening could be explained by a reduction in scattering contrast between pore walls and pores after the pore was covered with more molybdenum oxide in the AlPO4-5 support. This result is consistent with Abdelsayed et al.29 proposal that Mo species (MoO3) can thermally diffuse into the channels of HZSM-5 and anchor to the Brὂnsted acid sites. In general, the slight peak shift observed with MZ/AlPO4 catalysts is toward the lower and higher angles. The shift could result from lattice relaxation (a slight angle shift) or a strained lattice (a significant angle shift). Additionally, the presence of ZnMoO4 in MZ/AlPO4-5 catalysts results in AlPO4 lattice distortion, altering the interplanar distances within their crystal lattices.30 This result ultimately promotes good crystallinity and optical properties necessary for effective degradation/activity.
Zn ratio increases, the peak intensities of the AlPO4-5 phases decrease noticeably. In particular, the peak at 2θ = 30.5° has been slightly broadened. Since the main diffraction peak of the XRD spectrum of zinc molybdate ZnMoO4 is 30.52° (111) with the monoclinic structure according to (JCPDS card no: 25-1024).4 The broadening could be explained by a reduction in scattering contrast between pore walls and pores after the pore was covered with more molybdenum oxide in the AlPO4-5 support. This result is consistent with Abdelsayed et al.29 proposal that Mo species (MoO3) can thermally diffuse into the channels of HZSM-5 and anchor to the Brὂnsted acid sites. In general, the slight peak shift observed with MZ/AlPO4 catalysts is toward the lower and higher angles. The shift could result from lattice relaxation (a slight angle shift) or a strained lattice (a significant angle shift). Additionally, the presence of ZnMoO4 in MZ/AlPO4-5 catalysts results in AlPO4 lattice distortion, altering the interplanar distances within their crystal lattices.30 This result ultimately promotes good crystallinity and optical properties necessary for effective degradation/activity.
The data on the textural parameters, the N2 adsorption–desorption isotherms, and the average pore size distribution curves of prepared nanocomposite samples ZM (x)/AlPO4-5 shown in Fig. 2. The nitrogen adsorption–desorption isotherms of prepared samples, which were identical in shape and did not change with loading, were classified as a mixed type (a combination of types I, II) by the IUPAC classification characteristic aluminosilicate microporous materials. According to IUPAC, the patterns of H4 hysteresis also showed slit-like mesopores particles with internal vacuum, cage-like mesopores, or partially distorted cylindrical mesoporous. H4 hysteresis loop steps show that the pore size slightly decreased (low P/P°) with Mo![[thin space (1/6-em)]](https://www.rsc.org/images/entities/char_2009.gif) :
:![[thin space (1/6-em)]](https://www.rsc.org/images/entities/char_2009.gif) Zn (2–6) loading than parent AlPO4-5. The BET surface area decreases AlPO4-5 (168 m2 g−1) > MZ (2)/AlPO4-5 (139 m2 g−1) > MZ (4)/AlPO4-5 (134 m2 g−1) > MZ (6)/AlPO4-5 (129 m2 g−1). Meanwhile, MZ (2–6)/AlPO4-5 pore diameters were nearly similar to those of the pristine AlPO4-5, which suggests the dispersion of metal particles occurred both on the surface and in the intermediate pristine AlPO4-5 layers.
Zn (2–6) loading than parent AlPO4-5. The BET surface area decreases AlPO4-5 (168 m2 g−1) > MZ (2)/AlPO4-5 (139 m2 g−1) > MZ (4)/AlPO4-5 (134 m2 g−1) > MZ (6)/AlPO4-5 (129 m2 g−1). Meanwhile, MZ (2–6)/AlPO4-5 pore diameters were nearly similar to those of the pristine AlPO4-5, which suggests the dispersion of metal particles occurred both on the surface and in the intermediate pristine AlPO4-5 layers.
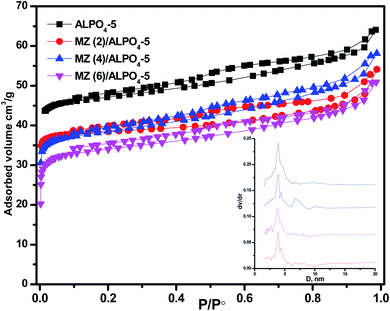 | ||
| Fig. 2 N2 adsorption/desorption isotherms of MZn (x)/AlPO4-5 nanocomposites, x = 0, 2, 4, and 6. The inset is the pore size distribution of the prepared nanocomposites. | ||
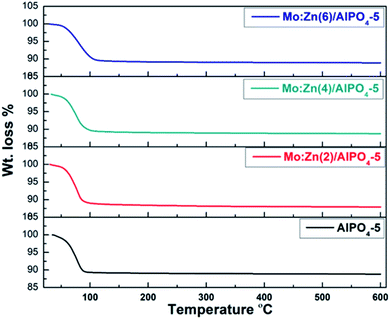
According to TGA curves of AlPO4-5 and Mo![[thin space (1/6-em)]](https://www.rsc.org/images/entities/char_2009.gif) :
:![[thin space (1/6-em)]](https://www.rsc.org/images/entities/char_2009.gif) Zn (2–6)-AlPO4-5 samples (Fig. 3). TGA analysis revealed that the prepared samples undergo two stages of weight reduction. At 60–140 °C, the initial weight loss occurs as a result of physisorbed water elimination and the onset of precursor destruction. At 120–600 °C, the second weight loss is due to the complete destruction of precursors, the dehydroxylation process, and the removal of any remaining directing agent. Indeed, when zinc and molybdenum species are co-impregnated, the overall weight loss increases slightly from 11.17 percent (AlPO4-5) to 12.11 percent (Mo
Zn (2–6)-AlPO4-5 samples (Fig. 3). TGA analysis revealed that the prepared samples undergo two stages of weight reduction. At 60–140 °C, the initial weight loss occurs as a result of physisorbed water elimination and the onset of precursor destruction. At 120–600 °C, the second weight loss is due to the complete destruction of precursors, the dehydroxylation process, and the removal of any remaining directing agent. Indeed, when zinc and molybdenum species are co-impregnated, the overall weight loss increases slightly from 11.17 percent (AlPO4-5) to 12.11 percent (Mo![[thin space (1/6-em)]](https://www.rsc.org/images/entities/char_2009.gif) :
:![[thin space (1/6-em)]](https://www.rsc.org/images/entities/char_2009.gif) Zn (2)-AlPO4-5). By contrast, increasing the Mo
Zn (2)-AlPO4-5). By contrast, increasing the Mo![[thin space (1/6-em)]](https://www.rsc.org/images/entities/char_2009.gif) :
:![[thin space (1/6-em)]](https://www.rsc.org/images/entities/char_2009.gif) Zn mole ratio to 4 and then to 6 has no discernible effect on weight reduction. This result may be explained by the blocking of certain Zn and Mo in the AlPO4-5 cavities, as illustrated in BET section.
Zn mole ratio to 4 and then to 6 has no discernible effect on weight reduction. This result may be explained by the blocking of certain Zn and Mo in the AlPO4-5 cavities, as illustrated in BET section.
Fig. 4 shows a high-magnification FE-SEM image of the as-prepared AlPO4-5 molecular sieves and MZ (x)/AlPO4-5 nanocomposites nanorods, demonstrating that the nanorods are relatively uniform in size. The composites form a hierarchical nanostructure with a large amount of open space, which can be thought of as an electroactive surface. Additionally, the FE-SEM images (Fig. 3b and c) demonstrate the presence of numerous sphere-like ZnMO4 particles with a mean particle size of 50–100 nm highly dispersed on the surface of AlPO4-5 molecular sieves. That is, by using AlPO4-5 molecular sieves as a support, the particle size of ZnMO4 can be significantly reduced, thereby facilitating the photocatalytic reaction. While increasing the M![[thin space (1/6-em)]](https://www.rsc.org/images/entities/char_2009.gif) :
:![[thin space (1/6-em)]](https://www.rsc.org/images/entities/char_2009.gif) Z ratio to 6 (Fig. 3d) resulted in the formation of significant molybdenum oxide adjacent to the ZnMO4 nanocrystalline, as confirmed by XRD and BET.
Z ratio to 6 (Fig. 3d) resulted in the formation of significant molybdenum oxide adjacent to the ZnMO4 nanocrystalline, as confirmed by XRD and BET.
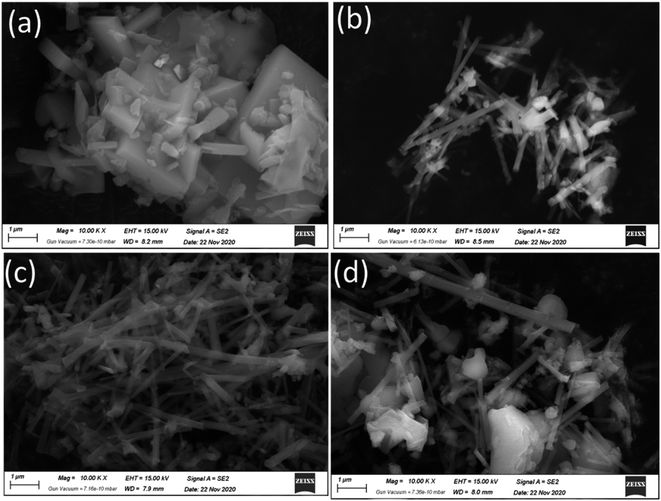 | ||
| Fig. 4 FE-SEM images of the as-prepared (a) AlPO4-5 molecular sieves, and (b–d)/MZ (2, 4 and 6) AlPO4-5 nanocomposite. | ||
3.2. XPS analysis
To examine the surface elemental composition and different valence states of doped molybdenum and zinc in MZ (x)/AlPO4-5 x = 0, 2, 4, or 4 catalysts, XPS was carried out (Fig. 5). The XPS survey spectrum (Fig. 5a) showed the presence of Al (2p), P (2p), O (1s), Mo (3d5/2, 3d3/2), and Zn (2p) in the prepared catalysts. Additionally, the Al (2p) peak (Fig. 5b) is not observed at a binding energy of 74 eV, implying the absence of Al2O3.31 The O 1s spectrum shown in (Fig. 5d) also indicates a change in the chemical state of O in MZ (2–6)/AlPO4-5 nanocomposite compared to bare AlPO4-5. Further, the high-resolution O 1s spectra shown are composed of the lattice oxygen species (O 1s) at 530.0 eV and surface adsorbed oxygen ions (Oads) at 532.5 eV,9 which could be assigned to oxygen in metal oxide for ZnO and MoO3 species. The Zn2p XPS spectrum (Fig. 5e) showed binding energy peaks at 1022.7 eV and at 1045.5 eV assigned to Zn (2p3/2 & 2p1/2) of the Zn2+ state. The intensity of the peaks decreases with the loading of Mo increased. Also, metallic Zn with a binding energy of 1021.50 eV was not observed, which confirmed that Zn exists only in the oxidized form.32 The elements individual (XPS) regarding Mo 3d in prepared samples depicted in (Fig. 5f) shows two well-resolved spectral peaks at the binding energy region of the Mo 3d ranging from 232.96 to 236.17 eV due to Mo6+ 3d3/2, Mo6+ 3d5/2, respectively.9 Thus, molybdenum oxides are very close to existing as MoO3 phase in agreement with the XRD results.33 The XPS results confirm that in the ZnMoO4 nanocrystals obtained; there are valence states of +2, −6, and −2, respectively. It was noticed that by increasing Mo![[thin space (1/6-em)]](https://www.rsc.org/images/entities/char_2009.gif) :
:![[thin space (1/6-em)]](https://www.rsc.org/images/entities/char_2009.gif) Zn molar ratio while maintaining the Mo content constant, the XPS peak intensity decreased by increasing the Mo content concentration up to Zn
Zn molar ratio while maintaining the Mo content constant, the XPS peak intensity decreased by increasing the Mo content concentration up to Zn![[thin space (1/6-em)]](https://www.rsc.org/images/entities/char_2009.gif) :
:![[thin space (1/6-em)]](https://www.rsc.org/images/entities/char_2009.gif) M (6)/AlPO4-5 catalysts. This finding suggests that bigger molybdenum oxide particles could be formed on the outer surface of AlPO4-5 support (matching BET results) may be due to the possible migration of molybdenum oxides into AlPO4-5 channels during the calcination step.
M (6)/AlPO4-5 catalysts. This finding suggests that bigger molybdenum oxide particles could be formed on the outer surface of AlPO4-5 support (matching BET results) may be due to the possible migration of molybdenum oxides into AlPO4-5 channels during the calcination step.
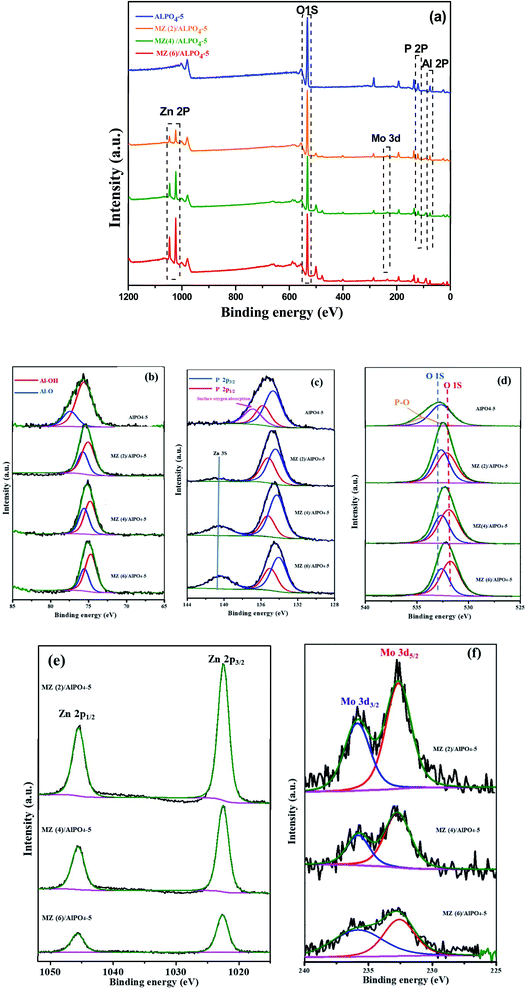 | ||
| Fig. 5 XPS spectra of Mn/Zn (x) AlPO4-5, X = 0, 0.1, 0.2 or 0.3 nanocomposites (a) survey of the samples, (b) Al, (c) P, (d) O, (e) Zn and (f) Mo spectra. | ||
3.3. Optical properties
It is well known that UV-vis diffuse reflectance spectroscopy is a vital characterization technique for semiconductor photocatalysts. The semiconductor optical properties have their origin in both intrinsic and extrinsic effects. Intrinsic optical transitions occur between the electrons in the conduction band and holes in the valence band caused by light excitation. In contrast, extrinsic properties are related to dopants/impurities, which usually create electronic states in the bandgap, which results in the dissipation and variation of optical parameters.34 The UV-vis diffuse reflectance spectra of the as-prepared AlPO4-5 and MZ (2, 4 and 6) AlPO4-5 nanocomposite were measured within the 200–700 nm region, and the results are shown in Fig. 6. It can be seen clearly that the pure AlPO4-5 molecular sieves are white powder and show no absorption in the range of visible light. However, after loading ZnMoO4 with different M/Z ratios over AlPO4-5 molecular sieves, the composite material exhibited absorption in the visible light range due to the transition between the valence and conduction band (Fig. 6a). Where the absorption was valued to 460, 365, and 360 nm for Mo![[thin space (1/6-em)]](https://www.rsc.org/images/entities/char_2009.gif) :
:![[thin space (1/6-em)]](https://www.rsc.org/images/entities/char_2009.gif) Zn (2)/AlPO4-5, Mo
Zn (2)/AlPO4-5, Mo![[thin space (1/6-em)]](https://www.rsc.org/images/entities/char_2009.gif) :
:![[thin space (1/6-em)]](https://www.rsc.org/images/entities/char_2009.gif) Zn (4)/AlPO4-5 and Mo
Zn (4)/AlPO4-5 and Mo![[thin space (1/6-em)]](https://www.rsc.org/images/entities/char_2009.gif) :
:![[thin space (1/6-em)]](https://www.rsc.org/images/entities/char_2009.gif) Zn (6)/AlPO4-5 catalysts, respectively. Thus, Mo
Zn (6)/AlPO4-5 catalysts, respectively. Thus, Mo![[thin space (1/6-em)]](https://www.rsc.org/images/entities/char_2009.gif) :
:![[thin space (1/6-em)]](https://www.rsc.org/images/entities/char_2009.gif) Zn (2)/AlPO4-5 catalyst has the highest absorbance with λg at 460 nm.35 Moreover, the absorption intensity slightly decreased for the MZ (2, 4, and 6) AlPO4-5 nanocomposite, increasing the M/Z ratio. The above results indicate that MZ (2, 4, and 6) AlPO4-5 nanocomposite are potential visible-light-driven photocatalysts.
Zn (2)/AlPO4-5 catalyst has the highest absorbance with λg at 460 nm.35 Moreover, the absorption intensity slightly decreased for the MZ (2, 4, and 6) AlPO4-5 nanocomposite, increasing the M/Z ratio. The above results indicate that MZ (2, 4, and 6) AlPO4-5 nanocomposite are potential visible-light-driven photocatalysts.
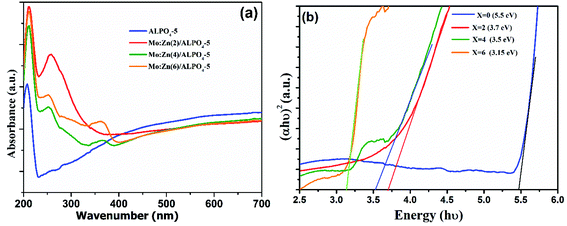 | ||
| Fig. 6 UV-Vis diffuse reflectance spectra (a) and (αhv)2 vs. hυ curves (b) of AlPO4-5 molecular sieves, and MZ (2, 4 and 6) AlPO4-5 nanocomposites. | ||
The reflectance data were transformed using the Kubelka–Munk function (3)36 to determine the gap energy. Thus, using the F(R) function in conjunction with the Tauc eqn (4), the spacing between the conduction band and the valence band of the synthesized material was estimated as follows:
 | (3) |
| (αhv) = (hv − Eg)n | (4) |
The extrapolation of the straight line to (αhν) = 0 gives the gap energy value. The estimated values for Eg of the samples in this work are between 3.15 and 3.7, as observed by linear region extrapolation. The obtained values are very consistent with those found in other studies. Zhang et al.36 determined the bandgap energy of α-ZnMoO4 synthesized electrochemically to be 3.64 eV. Some factors may interfere with the value of Eg, such as processing techniques structural characteristics (degree of crystallinity, mean particle size, lattice parameter values). A band around 3.15 eV (∼390 nm) is observed in Fig. 6; this characteristic is associated with defects present in the ZnMoO4 lattice due to high concentration molybdenum than zinc. The results indicate that the higher photocatalytic activity of Mo![[thin space (1/6-em)]](https://www.rsc.org/images/entities/char_2009.gif) :
:![[thin space (1/6-em)]](https://www.rsc.org/images/entities/char_2009.gif) Zn (2)/AlPO4-5 catalyst was due to the synergistic effect of Mo and ZnO in the presence of AlPO4-5 zeolites. While the incorporations of Mo-dopant on ZnO lead to a blue-shift in the optical gap energy.37 These incorporations create shallow donor states partially filled in the bottom of the conduction band around Fermi level.38 Furthermore, the difference between the valence electrons of Mo6+ and Zn2+ is 4, which can produce enough free carriers.39 Also, Mo has multiple valence states of +6, 5, 4, 3, 2,40 which suggests that each Mo atom can contribute 3 or 4 free electrons depending on valency to the ZnO lattice that can modify optical absorption and emission processes of ZnO. On the other hand, the presence of AlPO4-5 zeolites, which possess electrons rich sites and then can donate an electron to ZnO semiconductor molecules.
Zn (2)/AlPO4-5 catalyst was due to the synergistic effect of Mo and ZnO in the presence of AlPO4-5 zeolites. While the incorporations of Mo-dopant on ZnO lead to a blue-shift in the optical gap energy.37 These incorporations create shallow donor states partially filled in the bottom of the conduction band around Fermi level.38 Furthermore, the difference between the valence electrons of Mo6+ and Zn2+ is 4, which can produce enough free carriers.39 Also, Mo has multiple valence states of +6, 5, 4, 3, 2,40 which suggests that each Mo atom can contribute 3 or 4 free electrons depending on valency to the ZnO lattice that can modify optical absorption and emission processes of ZnO. On the other hand, the presence of AlPO4-5 zeolites, which possess electrons rich sites and then can donate an electron to ZnO semiconductor molecules.
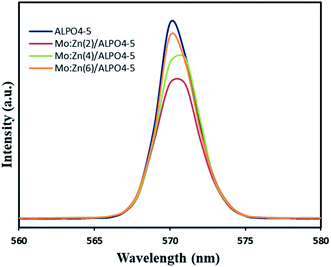
The photocatalytic efficiency is mainly controlled by the separation and migration of the photo-generated charge carriers because if the electron–hole pairs recombine during the photocatalytic process, a significant amount of photonic energy is lost. Therefore, it is vital to suppress the recombination of charge carriers to increase the catalyst's activity. Thus, the photoluminescence (PL) spectra have been used to investigate carrier trapping and charge carriers' recombination. Fig. 7 shows the photoluminescence (PL) obtained for bare AlPO4-5, Mo![[thin space (1/6-em)]](https://www.rsc.org/images/entities/char_2009.gif) :
:![[thin space (1/6-em)]](https://www.rsc.org/images/entities/char_2009.gif) Zn (2)/AlPO4-5, Mo
Zn (2)/AlPO4-5, Mo![[thin space (1/6-em)]](https://www.rsc.org/images/entities/char_2009.gif) :
:![[thin space (1/6-em)]](https://www.rsc.org/images/entities/char_2009.gif) Zn (4)/AlPO4-5 and Mo
Zn (4)/AlPO4-5 and Mo![[thin space (1/6-em)]](https://www.rsc.org/images/entities/char_2009.gif) :
:![[thin space (1/6-em)]](https://www.rsc.org/images/entities/char_2009.gif) Zn (6)/AlPO4-5 catalysts, measured in the range of 500–600 nm at an excitation wavelength of 300 nm. All the prepared catalysts showed one broad emission peak; a well-defined peak was observed in the spectrum at 570 nm, which can be attributed to the inter-band (CB–VB) radiation recombination. This main peak is a significant and characteristic emission peak for recombination of catalyst, which emits light with energy equal to or slightly greater than the bandgap of photocatalysts. We observed that bare AlPO4-5 shows a strong peak at 570 nm, and the position of this peak is not affected by doping of the bare AlPO4-5 with any amount of Mo
Zn (6)/AlPO4-5 catalysts, measured in the range of 500–600 nm at an excitation wavelength of 300 nm. All the prepared catalysts showed one broad emission peak; a well-defined peak was observed in the spectrum at 570 nm, which can be attributed to the inter-band (CB–VB) radiation recombination. This main peak is a significant and characteristic emission peak for recombination of catalyst, which emits light with energy equal to or slightly greater than the bandgap of photocatalysts. We observed that bare AlPO4-5 shows a strong peak at 570 nm, and the position of this peak is not affected by doping of the bare AlPO4-5 with any amount of Mo![[thin space (1/6-em)]](https://www.rsc.org/images/entities/char_2009.gif) :
:![[thin space (1/6-em)]](https://www.rsc.org/images/entities/char_2009.gif) Zn. But the intensity of this emission peak is significantly reduced with Mo
Zn. But the intensity of this emission peak is significantly reduced with Mo![[thin space (1/6-em)]](https://www.rsc.org/images/entities/char_2009.gif) :
:![[thin space (1/6-em)]](https://www.rsc.org/images/entities/char_2009.gif) Zn doped AlPO4-5, where these metal oxides can function as agents to capture photo-produced electrons.
Zn doped AlPO4-5, where these metal oxides can function as agents to capture photo-produced electrons.
3.4. Photocatalytic activity
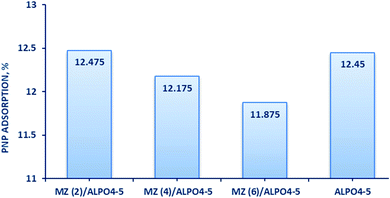
To evaluate the adsorption ability of bare AlPO4-5, Mo![[thin space (1/6-em)]](https://www.rsc.org/images/entities/char_2009.gif) :
:![[thin space (1/6-em)]](https://www.rsc.org/images/entities/char_2009.gif) Zn (2)/AlPO4-5, Mo
Zn (2)/AlPO4-5, Mo![[thin space (1/6-em)]](https://www.rsc.org/images/entities/char_2009.gif) :
:![[thin space (1/6-em)]](https://www.rsc.org/images/entities/char_2009.gif) Zn (4)/AlPO4-5, and Mo
Zn (4)/AlPO4-5, and Mo![[thin space (1/6-em)]](https://www.rsc.org/images/entities/char_2009.gif) :
:![[thin space (1/6-em)]](https://www.rsc.org/images/entities/char_2009.gif) Zn (6)/AlPO4-5 catalysts for degradation of PNP solution was run under 30 min dark condition, shown graphically in (Fig. 8). The high adsorption capacity of all catalysts in the dark can be attributed to their high surface area and porosity. It can be clarified that the adsorption process depends mainly on the surface area of the adsorbent. Since AlPO4-5 has the highest surface area (168 m2 g−1) and thus gave an adsorption capacity (12.45%). On the other hand, Mo
Zn (6)/AlPO4-5 catalysts for degradation of PNP solution was run under 30 min dark condition, shown graphically in (Fig. 8). The high adsorption capacity of all catalysts in the dark can be attributed to their high surface area and porosity. It can be clarified that the adsorption process depends mainly on the surface area of the adsorbent. Since AlPO4-5 has the highest surface area (168 m2 g−1) and thus gave an adsorption capacity (12.45%). On the other hand, Mo![[thin space (1/6-em)]](https://www.rsc.org/images/entities/char_2009.gif) :
:![[thin space (1/6-em)]](https://www.rsc.org/images/entities/char_2009.gif) Zn (2)/AlPO4-5, Mo
Zn (2)/AlPO4-5, Mo![[thin space (1/6-em)]](https://www.rsc.org/images/entities/char_2009.gif) :
:![[thin space (1/6-em)]](https://www.rsc.org/images/entities/char_2009.gif) Zn (4)/AlPO4-5 and Mo
Zn (4)/AlPO4-5 and Mo![[thin space (1/6-em)]](https://www.rsc.org/images/entities/char_2009.gif) :
:![[thin space (1/6-em)]](https://www.rsc.org/images/entities/char_2009.gif) Zn (6)/AlPO4-5 catalysts have less surface areas (139 m2 g−1, 134 m2 g−1 and 129 m2 g−1, respectively) but gave the similar adsorption capacity compare with unloaded AlPO4-5 (12.475, 12.175 and 11.875, respectively). The adsorption of PNP on the surface of the AlPO4-5 sample could occur via surface adsorption and electrostatic attraction between the protons of PNP and the negative charge on the AlPO4-5 surface in the present study.41 PNP is slightly acidic in solution and AlPO4-5 is composed of AlO4 and PO4 rings connected via oxygen bridges. Indeed, the formation of ZnMoO4/AlPO4-5 composites with varying MZ ratios can give a negative charge and basicity to the AlPO4-5 framework and change the porosity of the resultant composite be advantageous for boosting PNP adsorption. Additionally, the increased amount of PNP adsorbed by MZ ratios may be due to the fact that MZ cations increase the basicity of the composite surface, increasing its attraction for acidic molecules such as PNP.42 Also, the synergistic effect of ZnMoO4 and the AlPO4-5 matrix provided the MZ/AlPO4-5 composite with its adsorption capability.43 Instead, the MZ ions may act as unique adsorption sites, presumably by covalently interacting with the PNP molecule's benzene ring. Plus, as the number of active sites (Zn and Mo) on the composites surface increases, the electron transfer rate and adsorption of the PNP molecules increase, which are perfect properties as photocatalyst and supercapacitor.42,43
Zn (6)/AlPO4-5 catalysts have less surface areas (139 m2 g−1, 134 m2 g−1 and 129 m2 g−1, respectively) but gave the similar adsorption capacity compare with unloaded AlPO4-5 (12.475, 12.175 and 11.875, respectively). The adsorption of PNP on the surface of the AlPO4-5 sample could occur via surface adsorption and electrostatic attraction between the protons of PNP and the negative charge on the AlPO4-5 surface in the present study.41 PNP is slightly acidic in solution and AlPO4-5 is composed of AlO4 and PO4 rings connected via oxygen bridges. Indeed, the formation of ZnMoO4/AlPO4-5 composites with varying MZ ratios can give a negative charge and basicity to the AlPO4-5 framework and change the porosity of the resultant composite be advantageous for boosting PNP adsorption. Additionally, the increased amount of PNP adsorbed by MZ ratios may be due to the fact that MZ cations increase the basicity of the composite surface, increasing its attraction for acidic molecules such as PNP.42 Also, the synergistic effect of ZnMoO4 and the AlPO4-5 matrix provided the MZ/AlPO4-5 composite with its adsorption capability.43 Instead, the MZ ions may act as unique adsorption sites, presumably by covalently interacting with the PNP molecule's benzene ring. Plus, as the number of active sites (Zn and Mo) on the composites surface increases, the electron transfer rate and adsorption of the PNP molecules increase, which are perfect properties as photocatalyst and supercapacitor.42,43
The photocatalytic performances of AlPO4-5, Mo![[thin space (1/6-em)]](https://www.rsc.org/images/entities/char_2009.gif) :
:![[thin space (1/6-em)]](https://www.rsc.org/images/entities/char_2009.gif) Zn (2)/AlPO4-5, Mo
Zn (2)/AlPO4-5, Mo![[thin space (1/6-em)]](https://www.rsc.org/images/entities/char_2009.gif) :
:![[thin space (1/6-em)]](https://www.rsc.org/images/entities/char_2009.gif) Zn (4)/AlPO4-5, and Mo
Zn (4)/AlPO4-5, and Mo![[thin space (1/6-em)]](https://www.rsc.org/images/entities/char_2009.gif) :
:![[thin space (1/6-em)]](https://www.rsc.org/images/entities/char_2009.gif) Zn (6)/AlPO4-5 catalysts were tested by the degradation of PNP. As shown in Fig. 9, in the presence of Mo
Zn (6)/AlPO4-5 catalysts were tested by the degradation of PNP. As shown in Fig. 9, in the presence of Mo![[thin space (1/6-em)]](https://www.rsc.org/images/entities/char_2009.gif) :
:![[thin space (1/6-em)]](https://www.rsc.org/images/entities/char_2009.gif) Zn semiconductors in the AlPO4-5 zeolite catalysts, the degradation activity becomes much higher than the unloaded AlPO4-5 zeolite catalyst. It is found that a degradation percentage of PNP was attained over current prepared zeolite-based photocatalysts, 14.3, 99.25, 70.09, and 54.15% with unloaded AlPO4-5, Mo
Zn semiconductors in the AlPO4-5 zeolite catalysts, the degradation activity becomes much higher than the unloaded AlPO4-5 zeolite catalyst. It is found that a degradation percentage of PNP was attained over current prepared zeolite-based photocatalysts, 14.3, 99.25, 70.09, and 54.15% with unloaded AlPO4-5, Mo![[thin space (1/6-em)]](https://www.rsc.org/images/entities/char_2009.gif) :
:![[thin space (1/6-em)]](https://www.rsc.org/images/entities/char_2009.gif) Zn (2)/AlPO4-5, Mo
Zn (2)/AlPO4-5, Mo![[thin space (1/6-em)]](https://www.rsc.org/images/entities/char_2009.gif) :
:![[thin space (1/6-em)]](https://www.rsc.org/images/entities/char_2009.gif) Zn (4)/AlPO4-5 and Mo
Zn (4)/AlPO4-5 and Mo![[thin space (1/6-em)]](https://www.rsc.org/images/entities/char_2009.gif) :
:![[thin space (1/6-em)]](https://www.rsc.org/images/entities/char_2009.gif) Zn (6)/AlPO4-5, respectively after 180 min irradiation time. This result can be explained as during the photoexcitation of Mo
Zn (6)/AlPO4-5, respectively after 180 min irradiation time. This result can be explained as during the photoexcitation of Mo![[thin space (1/6-em)]](https://www.rsc.org/images/entities/char_2009.gif) :
:![[thin space (1/6-em)]](https://www.rsc.org/images/entities/char_2009.gif) Zn molecules can eject an electron which delocalizes through a framework or in clusters of charge balancing cations. Also, there are reverse processes in which zeolite-rich electron sites can donate an electron to Mo
Zn molecules can eject an electron which delocalizes through a framework or in clusters of charge balancing cations. Also, there are reverse processes in which zeolite-rich electron sites can donate an electron to Mo![[thin space (1/6-em)]](https://www.rsc.org/images/entities/char_2009.gif) :
:![[thin space (1/6-em)]](https://www.rsc.org/images/entities/char_2009.gif) Zn photoexcited molecules. Thus, the transferred photo-induced electrons participate in the oxidative degradation of organic pollutants, which leads to enhanced photocatalytic activity of the prepared zeolite-based photocatalysts. Where zeolite has several specific features that make them suitable as a host for photocatalyst,44 because of its inherent superior photocatalytic properties, Mo
Zn photoexcited molecules. Thus, the transferred photo-induced electrons participate in the oxidative degradation of organic pollutants, which leads to enhanced photocatalytic activity of the prepared zeolite-based photocatalysts. Where zeolite has several specific features that make them suitable as a host for photocatalyst,44 because of its inherent superior photocatalytic properties, Mo![[thin space (1/6-em)]](https://www.rsc.org/images/entities/char_2009.gif) :
:![[thin space (1/6-em)]](https://www.rsc.org/images/entities/char_2009.gif) Zn (2)/AlPO4-5, which contains the highest percentage of ZnO semiconductors, was found to have the highest photocatalytic activity. Also, this can be interpreted that in the case of the use of catalysts that have high Mo
Zn (2)/AlPO4-5, which contains the highest percentage of ZnO semiconductors, was found to have the highest photocatalytic activity. Also, this can be interpreted that in the case of the use of catalysts that have high Mo![[thin space (1/6-em)]](https://www.rsc.org/images/entities/char_2009.gif) :
:![[thin space (1/6-em)]](https://www.rsc.org/images/entities/char_2009.gif) Zn loading on AlPO4-5 zeolite, particles may tend to aggregate, reducing the interface between the reaction solution and the photocatalyst, decreasing the number of ZnO active sites on the catalyst surface by masking some parts of the photosensitive surface and consequently hinder or even reflect light penetration.45,46 Hence, Mo
Zn loading on AlPO4-5 zeolite, particles may tend to aggregate, reducing the interface between the reaction solution and the photocatalyst, decreasing the number of ZnO active sites on the catalyst surface by masking some parts of the photosensitive surface and consequently hinder or even reflect light penetration.45,46 Hence, Mo![[thin space (1/6-em)]](https://www.rsc.org/images/entities/char_2009.gif) :
:![[thin space (1/6-em)]](https://www.rsc.org/images/entities/char_2009.gif) Zn (2)/AlPO4-5 has to be added to confirm the total absorption of light photons for efficient photo-mineralization. This result agrees with XRD data in which successive increase in Mo
Zn (2)/AlPO4-5 has to be added to confirm the total absorption of light photons for efficient photo-mineralization. This result agrees with XRD data in which successive increase in Mo![[thin space (1/6-em)]](https://www.rsc.org/images/entities/char_2009.gif) :
:![[thin space (1/6-em)]](https://www.rsc.org/images/entities/char_2009.gif) Zn mole ratio from 2, 4, to 6 causes a noticeable decrease in the peak intensities of AlPO4-5 and tridymite phases. This result significantly reflects the covering of Zn particles onto the surface and strong interactions between Mo species and the AlPO4-5 framework, leading to lower crystallinity. Furthermore, the XPS spectra of the synthesized samples represented that the co-impregnation of Mo
Zn mole ratio from 2, 4, to 6 causes a noticeable decrease in the peak intensities of AlPO4-5 and tridymite phases. This result significantly reflects the covering of Zn particles onto the surface and strong interactions between Mo species and the AlPO4-5 framework, leading to lower crystallinity. Furthermore, the XPS spectra of the synthesized samples represented that the co-impregnation of Mo![[thin space (1/6-em)]](https://www.rsc.org/images/entities/char_2009.gif) :
:![[thin space (1/6-em)]](https://www.rsc.org/images/entities/char_2009.gif) Zn species on AlPO4-5 affected the intensity of the XPS bands. As clarified, the band intensity was increased with the increase of Mo
Zn species on AlPO4-5 affected the intensity of the XPS bands. As clarified, the band intensity was increased with the increase of Mo![[thin space (1/6-em)]](https://www.rsc.org/images/entities/char_2009.gif) :
:![[thin space (1/6-em)]](https://www.rsc.org/images/entities/char_2009.gif) Zn molar ratio from 2 to 4; meanwhile, it increases at molar ratio 6. Moreover, the Mo
Zn molar ratio from 2 to 4; meanwhile, it increases at molar ratio 6. Moreover, the Mo![[thin space (1/6-em)]](https://www.rsc.org/images/entities/char_2009.gif) :
:![[thin space (1/6-em)]](https://www.rsc.org/images/entities/char_2009.gif) Zn (2)/AlPO4-5 possesses oxygen-containing groups (O–Al–O, O–P–O, P–O–Zn and chemisorbed H–O–H molecules). These oxygen-containing groups may either recombine or interact with its charge carriers to produce reactive oxygen species.47 Therefore, these reactive oxygen species are responsible for breaking the compound's chemical bonds and could cause the complete mineralization of organic compounds.48
Zn (2)/AlPO4-5 possesses oxygen-containing groups (O–Al–O, O–P–O, P–O–Zn and chemisorbed H–O–H molecules). These oxygen-containing groups may either recombine or interact with its charge carriers to produce reactive oxygen species.47 Therefore, these reactive oxygen species are responsible for breaking the compound's chemical bonds and could cause the complete mineralization of organic compounds.48
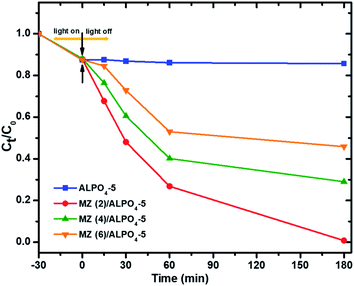 | ||
| Fig. 9 Photocatalytic degradation of PNP over prepared catalysts. Reaction conditions: the dosage of catalysts 1.0 g l−1, initial PNP concentration of 0.04 g l−1 after 180 min irradiation time. | ||
3.5. Kinetic fitting
Moreover, the regression curve of the natural logarithm of normalized PNP concentration versus reaction time is straightly linear, indicating that the kinetics of PNP degradation over these photocatalysts can be considered as simple first order as expressed in eqn (5):
 | (5) |
![[thin space (1/6-em)]](https://www.rsc.org/images/entities/char_2009.gif) :
:![[thin space (1/6-em)]](https://www.rsc.org/images/entities/char_2009.gif) Zn (2)/AlPO4-5, Mo
Zn (2)/AlPO4-5, Mo![[thin space (1/6-em)]](https://www.rsc.org/images/entities/char_2009.gif) :
:![[thin space (1/6-em)]](https://www.rsc.org/images/entities/char_2009.gif) Zn (4)/AlPO4-5 and Mo
Zn (4)/AlPO4-5 and Mo![[thin space (1/6-em)]](https://www.rsc.org/images/entities/char_2009.gif) :
:![[thin space (1/6-em)]](https://www.rsc.org/images/entities/char_2009.gif) Zn (6)/AlPO4-5, respectively. It can be observed that k for Mo
Zn (6)/AlPO4-5, respectively. It can be observed that k for Mo![[thin space (1/6-em)]](https://www.rsc.org/images/entities/char_2009.gif) :
:![[thin space (1/6-em)]](https://www.rsc.org/images/entities/char_2009.gif) Zn (2)/AlPO4-5 was the highest one; hence, this catalyst was the best one in our work.
Zn (2)/AlPO4-5 was the highest one; hence, this catalyst was the best one in our work.
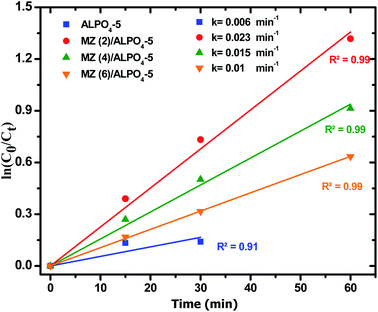 | ||
| Fig. 10 First order plots of PNP degradation over prepared catalysts. Reaction conditions: the dosage of catalysts 1.0 g l−1, initial PNP concentration of 0.04 g l−1 after 180 min irradiation time. | ||
3.6. Recyclability of the photocatalyst composite
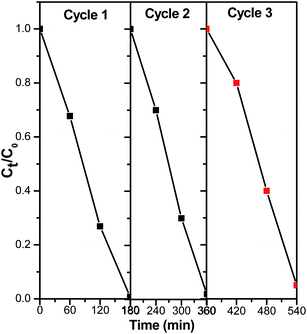
The photocatalytic regeneration study aids in determining the economic value of the photocatalytic degradation process in terms of the produced catalyst's ability to be reused several times while simultaneously degrading organic contaminants (PNP). Herein, photodegradation processes, 1.0 g l−1 of catalyst and 0.04 g l−1 of PNP were stirred continuously in the cylindrical reactor with illuminate by pressure 125 W mercury lamp for 180 min. After that the solution was filtered and the filtrate was analyzed for PNP concentration. These catalyst was washed several times with double distilled water (DDW) to ensure complete removal of PNP or its intermediate and it was then treated with another amount of PNP solution. The results of the multiple photocatalytic cyclic test of ZnMoO4/AlPO4-5 with MZ (2) for PNP degradation in an aqueous solution is shown in Fig. 11. The results demonstrate the possibility of ZnMoO4/AlPO4-5 with MZ (2) for the regeneration process, with photocatalytic efficiency of 99.25%, 98.05% and 94.75% after 180 min for three successive photodegradation cycles, respectively. As clarified, there was insignificant decrease in catalytic performance which may cause due to photocatalyst mass loss during recycling studies. This issue can be resolved by encapsulating the photocatalysts in a solid substrate 20. These findings suggest that ZnMoO4/AlPO4-5 with MZ (2) has considerable promise as a photodegradation catalyst for the practical degradation of PNP in aqueous solutions.3.7. Mechanism behind PNP by ZnMoO4/AlPO4-5
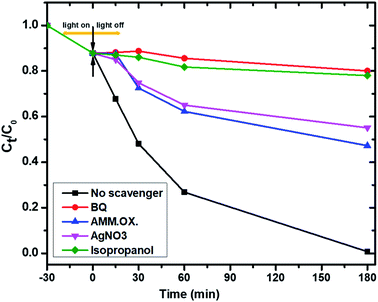
To further study the photocatalytic mechanism and identify the main oxidative species (h+, e−, ˙O2− and ˙OH) in the photocatalytic process, the effect of active-species scavengers on the photodegradation of PNP has been studied, and the results are presented in Fig. 12. Therefore, isopropyl alcohol (IPA), benzoquinone (BQ), ammonium oxalate (AO), and silver nitrate (AgNO3) were introduced as scavengers for hydroxyl radicals (˙OH), superoxide radicals (˙O2), holes (h+) and electrons (e−) respectively.49 As shown in Fig. 12, the photocatalytic degradation rates of PNP using Mo![[thin space (1/6-em)]](https://www.rsc.org/images/entities/char_2009.gif) :
:![[thin space (1/6-em)]](https://www.rsc.org/images/entities/char_2009.gif) Zn (2)/AlPO4-5 were decreased dramatically when BQ as an ˙O2− and IPA as ˙OH scavengers were added into the photoreaction system.50 Conversely, the addition of AO and AgNO3 minimize the photocatalytic degradation of PNP using the same catalyst, suggesting that the h+ and e− reactive species are only partially involved in the photocatalytic process. On the other hand, the degradation efficiencies decreased dramatically after adding BQ and IPA into the photoreaction system compared with no scavenger under similar conditions. Therefore, it can be concluded that:
Zn (2)/AlPO4-5 were decreased dramatically when BQ as an ˙O2− and IPA as ˙OH scavengers were added into the photoreaction system.50 Conversely, the addition of AO and AgNO3 minimize the photocatalytic degradation of PNP using the same catalyst, suggesting that the h+ and e− reactive species are only partially involved in the photocatalytic process. On the other hand, the degradation efficiencies decreased dramatically after adding BQ and IPA into the photoreaction system compared with no scavenger under similar conditions. Therefore, it can be concluded that:
(a) The ˙OH and ˙O2− radicals are the predominant active species of the PNP degradation51 which chemically bonded interface structure between Mo, ZnO, and AlPO4-5 catalysts52 while,
(b) The dissolved O2 and H2O molecules significantly influence PNP photocatalytic degradation reaction. Thus, the influences of the scavengers on the reaction rate were in the order of the main active oxidation species:
| BQ (for ˙O2−) > IPA (for ˙OH) > AO (for h+) > AgNO3 (for e−). |
Consequently, the photodegradation of 4-nitrophenol with hydroxyl radicals and superoxide anion radicals produces hydroquinone and benzoquinone, which are then oxidized to produce intermediates containing a large number of ring-opening products. Finally, these intermediates will be oxidized to form CO2 and water. These intermediated was confirmed by HPLC results Fig. S3 and S4† validated with standards for the identification of compounds show that the main photo products of PNP degradation are acid products (RT = 2.5 min at λ = 280 nm), hydroquinone (RT = 3.6 min at λ = 280 nm) and Benzoquinone (RT = 4.3 min at λ = 280 nm), where RT is the retention time and λ is the wavelength. At the zero time, the degradation of PNP equals zero. After 5 min the rate of nitrophenol degradation, acid products, hydroquinone, and benzoquinone began to increase with time. After 180 min, the rate of degradation of phenol reached nearly to 100% where that of benzoquinone, hydroquinone and acid products began to disappear. These results revealed that hydroquinone and p-benzoquinone were the major intermediates in the reaction, which revealed that the hydroxylation occur at the para position mainly. Additionally, it was thought that the majority of the organic nitrogen in PNP was oxidised to NO2− and NO3−, while the remaining organic nitrogen was transferred to N2, N2O, or smaller molecule organic nitrogen that was adsorbed or released into the air.53 As a result, Scheme 1 proposes the main degradation of PNP pathway.
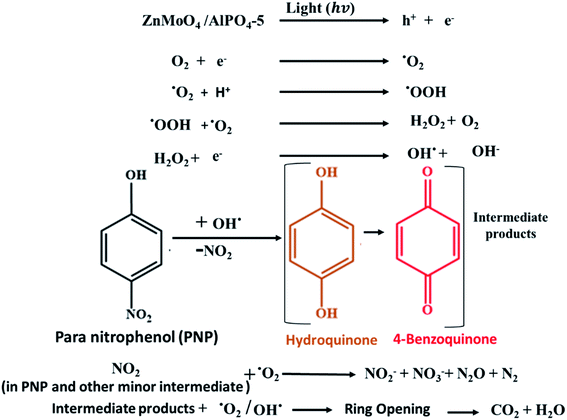 | ||
| Scheme 1 The proposed mechanism of the photocatalytic degradation of PNP on ZnMoO4/AlPO4-5 catalysts. | ||
4. Electrochemical measurements
The improvement of pristine AlPO4-5 as an electrode material for SC application depending on a co-impregnation method with different molar ratios of molybdenum and zinc bimetal supported AlPO4-5 (ZnMoO4/AlPO4-5) suggests a helpful strategy.In this regard, the electrochemical responses of pristine AlPO4-5 and its corresponding molybdenum–zinc supported AlPO4-5 samples: Mo![[thin space (1/6-em)]](https://www.rsc.org/images/entities/char_2009.gif) :
:![[thin space (1/6-em)]](https://www.rsc.org/images/entities/char_2009.gif) Zn (2)/AlPO4-5, Mo
Zn (2)/AlPO4-5, Mo![[thin space (1/6-em)]](https://www.rsc.org/images/entities/char_2009.gif) :
:![[thin space (1/6-em)]](https://www.rsc.org/images/entities/char_2009.gif) Zn (4)/AlPO4-5, and Mo
Zn (4)/AlPO4-5, and Mo![[thin space (1/6-em)]](https://www.rsc.org/images/entities/char_2009.gif) :
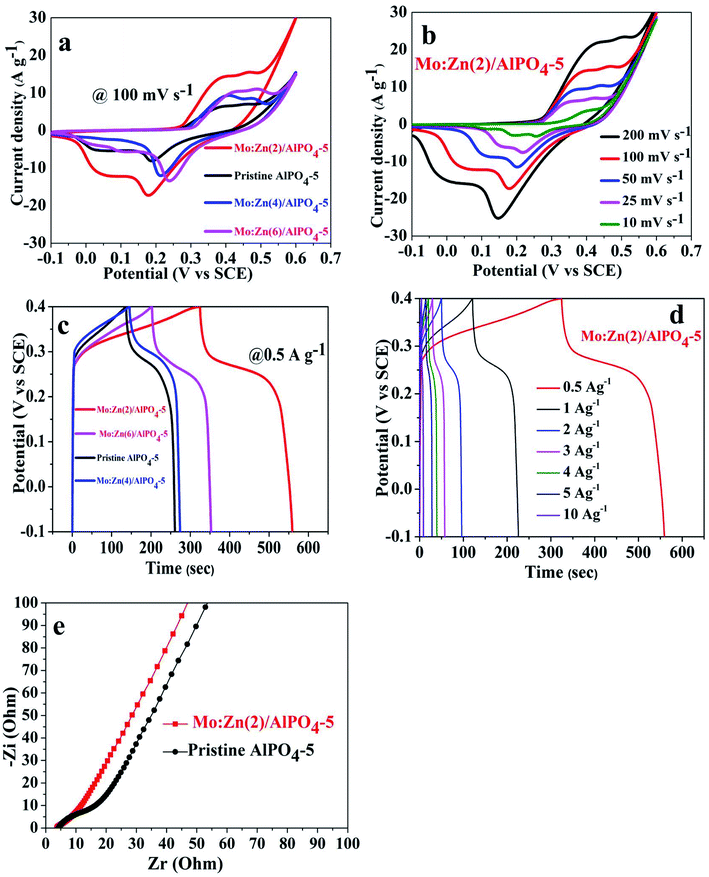
:![[thin space (1/6-em)]](https://www.rsc.org/images/entities/char_2009.gif) Zn (6)/AlPO4-5 were evaluated. Fig. 13a exhibited the CV curves of the pristine AlPO4-5 and its corresponding molybdenum–zinc supported AlPO4-5 samples with different ratios at a sweeping rate of 100 mV s−1. It is noticeable that the co-impregnation of Mo
Zn (6)/AlPO4-5 were evaluated. Fig. 13a exhibited the CV curves of the pristine AlPO4-5 and its corresponding molybdenum–zinc supported AlPO4-5 samples with different ratios at a sweeping rate of 100 mV s−1. It is noticeable that the co-impregnation of Mo![[thin space (1/6-em)]](https://www.rsc.org/images/entities/char_2009.gif) :
:![[thin space (1/6-em)]](https://www.rsc.org/images/entities/char_2009.gif) Zn species on AlPO4-5 affected its integral CV area that witnessed from the increment in the integral current CV curve area, which generally increased by adding Mo and Zn due to an increase in the number of active redox sites. Here, Mo
Zn species on AlPO4-5 affected its integral CV area that witnessed from the increment in the integral current CV curve area, which generally increased by adding Mo and Zn due to an increase in the number of active redox sites. Here, Mo![[thin space (1/6-em)]](https://www.rsc.org/images/entities/char_2009.gif) :
:![[thin space (1/6-em)]](https://www.rsc.org/images/entities/char_2009.gif) Zn (2)/AlPO4-5 sample achieved the best integral CV area resulting in low charge transports resistance and low ion diffusion resistance, suggesting its higher capacitance. It is revealed that when Mo, Zn mole ratio content increased above 2, the electrochemical response was slightly declined but still more than the pristine AlPO4-5. This result may be ascribed to when Mo, Zn mole ration increased more than 2 will block some of the redox-active sites which restricted the interaction with the ionic electrolyte leading to the loss of its capacitance.51,53–55 As shown in (Fig. 13b), the CV curves of Mo
Zn (2)/AlPO4-5 sample achieved the best integral CV area resulting in low charge transports resistance and low ion diffusion resistance, suggesting its higher capacitance. It is revealed that when Mo, Zn mole ratio content increased above 2, the electrochemical response was slightly declined but still more than the pristine AlPO4-5. This result may be ascribed to when Mo, Zn mole ration increased more than 2 will block some of the redox-active sites which restricted the interaction with the ionic electrolyte leading to the loss of its capacitance.51,53–55 As shown in (Fig. 13b), the CV curves of Mo![[thin space (1/6-em)]](https://www.rsc.org/images/entities/char_2009.gif) :
:![[thin space (1/6-em)]](https://www.rsc.org/images/entities/char_2009.gif) Zn (2)/AlPO4-5 were performed at different scan rates from 10 mV s−1 to 200 mV s−1 to evaluate its electrochemical performance as electroactive material for SC. The as-synthesized materials exhibited a prominent redox couple, suggesting its faradic-redox nature during the charge/discharge route, showing a typical battery-type material.25 By increasing the scan rate (Fig. 13b), the integral current CV area gradually increased, indicating low charge transfer and ion diffusion resistances. There is a slight deviation in the shape of CV curves at the low sweep rates, proposing the good reversibility of the redox reactions.56 At a high scan rate, the anodic and cathodic peaks are slightly shifted to more positive and more negative potentials, respectively, due to the polarization of electrode material.
Zn (2)/AlPO4-5 were performed at different scan rates from 10 mV s−1 to 200 mV s−1 to evaluate its electrochemical performance as electroactive material for SC. The as-synthesized materials exhibited a prominent redox couple, suggesting its faradic-redox nature during the charge/discharge route, showing a typical battery-type material.25 By increasing the scan rate (Fig. 13b), the integral current CV area gradually increased, indicating low charge transfer and ion diffusion resistances. There is a slight deviation in the shape of CV curves at the low sweep rates, proposing the good reversibility of the redox reactions.56 At a high scan rate, the anodic and cathodic peaks are slightly shifted to more positive and more negative potentials, respectively, due to the polarization of electrode material.
Moreover, the GCD curves were performed within a potential window from 0 to 0.4 V as exhibited in (Fig. 13c and d). The as-synthesized Mo![[thin space (1/6-em)]](https://www.rsc.org/images/entities/char_2009.gif) :
:![[thin space (1/6-em)]](https://www.rsc.org/images/entities/char_2009.gif) Zn (2)/AlPO4-5 achieved the longest discharging time. Practically flat charge/discharge plateaus of the GCD curves are observed for all the samples at a constant voltage stage, showing a classic battery-type material consistent with the results obtained from the CV curves.
Zn (2)/AlPO4-5 achieved the longest discharging time. Practically flat charge/discharge plateaus of the GCD curves are observed for all the samples at a constant voltage stage, showing a classic battery-type material consistent with the results obtained from the CV curves.
Based on eqn (1) and (2), the specific capacitances (Csp) (F g−1) and the specific capacities (Cs) (C g−1) of Mo![[thin space (1/6-em)]](https://www.rsc.org/images/entities/char_2009.gif) :
:![[thin space (1/6-em)]](https://www.rsc.org/images/entities/char_2009.gif) Zn (2)/AlPO4-5 were calculated at diverse current densities depending on the corresponding GCD discharge curves. Hopefully, the as-synthesized Mo
Zn (2)/AlPO4-5 were calculated at diverse current densities depending on the corresponding GCD discharge curves. Hopefully, the as-synthesized Mo![[thin space (1/6-em)]](https://www.rsc.org/images/entities/char_2009.gif) :
:![[thin space (1/6-em)]](https://www.rsc.org/images/entities/char_2009.gif) Zn (2)/AlPO4-5 electrode exhibited Csp of 725 F g−1 (290 C g−1), 328 F g−1 (164 C g−1), 150 F g−1 (60 C g−1), 87.5 F g−1 (35 C g−1), 62.5 F g−1 (25 C g−1), 50 F g−1 (20 C g−1), and 20 F g−1 (8 C g−1) at current densities of 0.5 A g−1, 1 A g−1, 2 A g−1, 3 A g−1, 4 A g−1, 5 A g−1, and 10 A g−1, respectively. Also, the calculated Csp and its corresponding Cs for pristine AlPO4-5 and its corresponding molybdenum–zinc supported AlPO4-5 samples: Mo
Zn (2)/AlPO4-5 electrode exhibited Csp of 725 F g−1 (290 C g−1), 328 F g−1 (164 C g−1), 150 F g−1 (60 C g−1), 87.5 F g−1 (35 C g−1), 62.5 F g−1 (25 C g−1), 50 F g−1 (20 C g−1), and 20 F g−1 (8 C g−1) at current densities of 0.5 A g−1, 1 A g−1, 2 A g−1, 3 A g−1, 4 A g−1, 5 A g−1, and 10 A g−1, respectively. Also, the calculated Csp and its corresponding Cs for pristine AlPO4-5 and its corresponding molybdenum–zinc supported AlPO4-5 samples: Mo![[thin space (1/6-em)]](https://www.rsc.org/images/entities/char_2009.gif) :
:![[thin space (1/6-em)]](https://www.rsc.org/images/entities/char_2009.gif) Zn (2)/AlPO4-5, Mo
Zn (2)/AlPO4-5, Mo![[thin space (1/6-em)]](https://www.rsc.org/images/entities/char_2009.gif) :
:![[thin space (1/6-em)]](https://www.rsc.org/images/entities/char_2009.gif) Zn (4)/AlPO4-5 and Mo
Zn (4)/AlPO4-5 and Mo![[thin space (1/6-em)]](https://www.rsc.org/images/entities/char_2009.gif) :
:![[thin space (1/6-em)]](https://www.rsc.org/images/entities/char_2009.gif) Zn (6)/AlPO4-5 at 0.5 A g−1 were 400 F g−1 (160 C g−1), 725 F g−1 (290 C g−1), 450 F g−1 (180 C g−1), and 481.25 F g−1 (192.5 C g−1), respectively.
Zn (6)/AlPO4-5 at 0.5 A g−1 were 400 F g−1 (160 C g−1), 725 F g−1 (290 C g−1), 450 F g−1 (180 C g−1), and 481.25 F g−1 (192.5 C g−1), respectively.
EIS is considered a supportive method to explore the kinetic of electrons within redox reactions and ion diffusion. In this regard, (Fig. 13e) showed the Nyquist plot for pristine AlPO4-5 and Mo![[thin space (1/6-em)]](https://www.rsc.org/images/entities/char_2009.gif) :
:![[thin space (1/6-em)]](https://www.rsc.org/images/entities/char_2009.gif) Zn (2)/AlPO4-5 sample. The slope of the straight line represented the ion diffusion resistance in the low-frequency region. In the high-frequency region, the semicircle diameter indicated the charge transfer resistance that assesses the ease of electronic transportation within the redox reactions and the equivalent series resistance (ESR) obtained from the intersection of the curve at the high-frequency part. ESR suggests the summation of electrolyte resistances, active material, and current collector contact resistance.57 As exhibited in Fig. 13e, the ESR of pristine AlPO4-5 and Mo
Zn (2)/AlPO4-5 sample. The slope of the straight line represented the ion diffusion resistance in the low-frequency region. In the high-frequency region, the semicircle diameter indicated the charge transfer resistance that assesses the ease of electronic transportation within the redox reactions and the equivalent series resistance (ESR) obtained from the intersection of the curve at the high-frequency part. ESR suggests the summation of electrolyte resistances, active material, and current collector contact resistance.57 As exhibited in Fig. 13e, the ESR of pristine AlPO4-5 and Mo![[thin space (1/6-em)]](https://www.rsc.org/images/entities/char_2009.gif) :
:![[thin space (1/6-em)]](https://www.rsc.org/images/entities/char_2009.gif) Zn (2)/AlPO4-5 sample is not changed. Moreover, in the low-frequency part, the straight line of Mo
Zn (2)/AlPO4-5 sample is not changed. Moreover, in the low-frequency part, the straight line of Mo![[thin space (1/6-em)]](https://www.rsc.org/images/entities/char_2009.gif) :
:![[thin space (1/6-em)]](https://www.rsc.org/images/entities/char_2009.gif) Zn (2)/AlPO4-5 electrode showed a comparatively more vertical line than that of the pristine sample, representing the co-impregnation of Mo and Zn reduced its ion diffusion resistance and charge transfer resistance.58 This result indicates that Mo
Zn (2)/AlPO4-5 electrode showed a comparatively more vertical line than that of the pristine sample, representing the co-impregnation of Mo and Zn reduced its ion diffusion resistance and charge transfer resistance.58 This result indicates that Mo![[thin space (1/6-em)]](https://www.rsc.org/images/entities/char_2009.gif) :
:![[thin space (1/6-em)]](https://www.rsc.org/images/entities/char_2009.gif) Zn (2)/AlPO4-5 is a promising material for SC applications.
Zn (2)/AlPO4-5 is a promising material for SC applications.
5. Conclusion
In summary, we developed a simple strategy for synthesizing ZnMoO4/AlPO4-5 nanorod composites with molar ratios of Mo![[thin space (1/6-em)]](https://www.rsc.org/images/entities/char_2009.gif) :
:![[thin space (1/6-em)]](https://www.rsc.org/images/entities/char_2009.gif) Zn of 2, 4 and 6. The photocatalytic efficiency of the composites was determined by measuring the degradation of PNP under visible light irradiation. Notably, the ZnMoO4/AlPO4-5 composite with Mo
Zn of 2, 4 and 6. The photocatalytic efficiency of the composites was determined by measuring the degradation of PNP under visible light irradiation. Notably, the ZnMoO4/AlPO4-5 composite with Mo![[thin space (1/6-em)]](https://www.rsc.org/images/entities/char_2009.gif) :
:![[thin space (1/6-em)]](https://www.rsc.org/images/entities/char_2009.gif) Zn molar ratios (2) exhibits the highest photocatalytic activity for PNP degradation. Additionally, supercapacitive tests on ZnMoO4/AlPO4-5 electrodes were conducted. This electrode has a maximum capacitance of 725 F g−1 at the current density of 0.5 A g−1 for Mo
Zn molar ratios (2) exhibits the highest photocatalytic activity for PNP degradation. Additionally, supercapacitive tests on ZnMoO4/AlPO4-5 electrodes were conducted. This electrode has a maximum capacitance of 725 F g−1 at the current density of 0.5 A g−1 for Mo![[thin space (1/6-em)]](https://www.rsc.org/images/entities/char_2009.gif) :
:![[thin space (1/6-em)]](https://www.rsc.org/images/entities/char_2009.gif) Zn molar ratios (2). These results demonstrate that the prepared composites are excellent as light-driven photocatalytic materials and suitable for supercapacitor applications.
Zn molar ratios (2). These results demonstrate that the prepared composites are excellent as light-driven photocatalytic materials and suitable for supercapacitor applications.
Conflicts of interest
There are no conflicts to declare.References
- Z. Razaghi, Z. Aghajani and A. Y. Faal, J. Mater. Sci.: Mater. Electron., 2016, 27, 13119–13126 CrossRef CAS.
- X. Peng, F. Ai, L. Yan, E. Ha, X. Hu, S. He and J. Hu, Cell Rep. Phys. Sci., 2021, 2, 100436 CrossRef CAS.
- Z. Xing, J. Zhang, J. Cui, J. Yin, T. Zhao, J. Kuang, Z. Xiu, N. Wan and W. Zhou, Appl. Catal., B, 2018, 225, 452–467 CrossRef CAS.
- K. Natarajan, S. Dave, H. C. Bajaj and R. J. Tayade, Mater. Today Chem., 2020, 17, 100331 CrossRef CAS.
- H. Liu, Y. Hu, Z. Zhang, X. Liu, H. Jia and B. Xu, Appl. Surf. Sci., 2015, 355, 644–652 CrossRef CAS.
- W. Wei, Z. Zhang, G. You, Y. Shan and Z. Xu, RSC Adv., 2019, 9, 28768–28774 RSC.
- S. Said, D. Aman, M. Riad and S. Mikhail, J. Solid State Chem., 2020, 287, 121335 CrossRef CAS.
- B. J. Reddy, P. Vickraman and A. S. Justin, Appl. Phys. A: Mater. Sci. Process., 2018, 124, 1–9 CrossRef CAS.
- L. Wang, W. Liang, S. He, M. Liu, Y. Zhao and W. Zhang, J. Alloys Compd., 2020, 816, 152673 CrossRef CAS.
- L. X. Lovisa, M. C. Oliveira, J. Andrés, L. Gracia, M. S. Li, E. Longo, R. L. Tranquilin, C. A. Paskocimas, M. R. D. Bomio and F. V Motta, J. Alloys Compd., 2018, 750, 55–70 CrossRef CAS.
- L. X. Lovisa, Y. L. R. L. Fernandes, L. M. P. Garcia, B. S. Barros, E. Longo, C. A. Paskocimas, M. R. D. Bomio and F. V. Motta, Opt. Mater., 2019, 96, 109332 CrossRef CAS.
- M. Ramezani and S. M. H. Ali, J. Mater. Sci.: Mater. Electron., 2015, 26, 7588–7594 CrossRef CAS.
- A. A. G. Santiago, C. R. R. Almeida, R. L. Tranquilin, R. M. Nascimento, C. A. Paskocimas, E. Longo, F. V. Motta and M. R. D. Bomio, Ceram. Int., 2018, 44, 3775–3786 CrossRef CAS.
- N. S. Kozlova, O. A. Buzanov, A. P. Kozlova, E. V Zabelina, Z. A. Goreeva, I. S. Didenko, V. M. Kasimova and A. G. Chernykh, Crystallogr. Rep., 2018, 63, 216–221 CrossRef CAS.
- Q. Hu, J. Di, B. Wang, M. Ji, Y. Chen, J. Xia and H. Li, Appl. Surf. Sci., 2019, 466, 525–534 CrossRef CAS.
- P. Thangadurai, R. Beura and J. S. Kumar, Nanomaterials with Different Morphologies for Photocatalysis, 2020 Search PubMed.
- H. L. Chen, F. Y. Liu, X. Xiao, J. Hu, B. Gao, D. Zou and C. C. Chen, J. Colloid Interface Sci., 2021, 601, 758–772 CrossRef CAS PubMed.
- H.-Y. Phin, Y.-T. Ong and J.-C. Sin, J. Environ. Chem. Eng., 2020, 8, 103222 CrossRef CAS.
- Q. Yuan, L. Chen, M. Xiong, J. He, S. Luo, C. Au and S. Yin, Chem. Eng. J., 2014, 255, 394–402 CrossRef CAS.
- P. J. Mafa, B. Ntsendwana, B. B. Mamba and A. T. Kuvarega, J. Phys. Chem. C, 2019, 123, 20605–20616 CrossRef CAS.
- A. Meng, B. Cheng, H. Tan, J. Fan, C. Su and J. Yu, Appl. Catal., B, 2021, 289, 120039 CrossRef CAS.
- B. V. S. Kumar, C. P. Sajan, K. M. L. Rai and K. Byrappa, Indian J. Chem. Technol., 2010, 17, 191–197 CAS.
- Y. Wang, Y. Song and Y. Xia, Chem. Soc. Rev., 2016, 45, 5925–5950 RSC.
- S. Lee, S. Lee, J. Yoon and H. Kim, J. Power Sources, 2015, 273, 839–843 CrossRef CAS.
- Y. Shao, M. F. El-Kady, J. Sun, Y. Li, Q. Zhang, M. Zhu, H. Wang, B. Dunn and R. B. Kaner, Chem. Rev., 2018, 118, 9233–9280 CrossRef CAS PubMed.
- R. Roshani and A. Tadjarodi, Mater. Today Commun., 2021, 26, 101794 CrossRef CAS.
- C. Hao, B. Yang, F. Wen, J. Xiang, L. Li, W. Wang, Z. Zeng, B. Xu, Z. Zhao, Z. Liu and Y. Tian, Adv. Mater., 2016, 28, 3194–3201 CrossRef CAS PubMed.
- S. I. El-hout, S. G. Mohamed, A. Gaber, S. Y. Attia, A. Shawky and S. M. El-sheikh, J. Energy Storage, 2021, 34, 102001 CrossRef.
- V. Abdelsayed, D. Shekhawat and M. W. Smith, Fuel, 2015, 139, 401–410 CrossRef CAS.
- L. X. Lovisa, Y. L. R. L. Fernandes, L. M. P. Garcia, B. S. Barros, E. Longo, C. A. Paskocimas, M. R. D. Bomio and F. V. Motta, Opt. Mater., 2019, 96, 109332 CrossRef CAS.
- C. Elmasides, D. I. Kondarides, W. Grünert and X. E. Verykios, J. Phys. Chem. B, 1999, 103, 5227–5239 CrossRef CAS.
- N. Gogurla, A. K. Sinha, S. Santra, S. Manna and S. K. Ray, Sci. Rep., 2014, 4, 6483 CrossRef CAS PubMed.
- S. Said and A. A. Abdelrahman, J. Sol-Gel Sci. Technol., 2020, 95, 308–320 CrossRef CAS.
- S. R. Tirumalareddygari, P. R. Guddeti and K. T. Ramakrishna Reddy, Appl. Surf. Sci., 2018, 458, 333–343 CrossRef CAS.
- L. T. T. Nguyen, L. T. H. Nguyen, A. T. T. Duong, B. D. Nguyen, N. Q. Hai, V. H. Chu, T. D. Nguyen and L. G. Bach, Materials, 2019, 12, 1195 CrossRef CAS PubMed.
- W. Zhang, J. Yin, F. Min, L. Jia, D. Zhang, Q. Zhang and J. Xie, J. Mol. Struct., 2017, 1127, 777–783 CrossRef CAS.
- R. Radha, A. Sakthivelu and D. Pradhabhan, IRA-Int. J. Appl. Sci., 2016, 04, 83–93 Search PubMed.
- A. Slassi, Opt. Quantum Electron., 2015, 47, 2465–2477 CrossRef CAS.
- H. K. Kim, S. H. Huh, J. W. Park, J. W. Jeong and G. H. Lee, Chem. Phys. Lett., 2002, 354, 165–172 CrossRef CAS.
- J. N. Duenow, T. A. Gessert, D. M. Wood, T. M. Barnes, M. Young, B. To and T. J. Coutts, J. Vac. Sci. Technol., A, 2007, 25, 955–960 CrossRef CAS.
- N. Yadav, D. Narayan Maddheshiaya, S. Rawat and J. Singh, Environmental Engineering Research, 2020, 25, 742–752 CrossRef.
- S. Moulai, R. Ghezini, A. Hasnaoui, A. Bengueddach and P. G. Weidler, Res. Chem. Intermed., 2019, 45, 1653–1668 CrossRef CAS.
- L. Roshanfekr Rad and M. Anbia, J. Environ. Chem. Eng., 2021, 9, 106088 CrossRef CAS.
- B. V. S. Kumar, C. P. Sajan, K. M. L. Rai and K. Byrappa, Indian J. Chem. Technol., 2010, 17, 191–197 CAS.
- A. Nezamzadeh-Ejhieh and S. Khorsandi, J. Ind. Eng. Chem., 2014, 20, 937–946 CrossRef CAS.
- A. Achilleos, E. Hapeshi, N. P. Xekoukoulotakis, D. Mantzavinos and D. Fatta-kassinos, Chem. Eng. J., 2010, 161, 53–59 CrossRef CAS.
- W. He, H. Jia, J. Cai, X. Han, Z. Zheng, W. G. Wamer and J.-J. Yin, J. Phys. Chem. C, 2016, 120, 3187–3195 CrossRef CAS.
- S. G. Kumar and K. S. R. K. Rao, RSC Adv., 2015, 5, 3306–3351 RSC.
- H.-L. Chen, F.-Y. Liu, X. Xiao, J. Hu, B. Gao, D. Zou and C.-C. Chen, J. Colloid Interface Sci., 2021, 601, 758–772 CrossRef CAS PubMed.
- S. Verma and R. Dutta, J. Environ. Chem. Eng., 2017, 5, 4776–4787 CrossRef CAS.
- Q. Mei, H. Cao, D. Han, M. Li, S. Yao, J. Xie, J. Zhan, Q. Zhang, W. Wang and M. He, J. Hazard. Mater., 2020, 389, 121901 CrossRef CAS PubMed.
- R. A. Rakkesh, D. Dhinasekaran, P. Karthe and B. Subrmanian, Process. Appl. Ceram., 2020, 13, 376–386 Search PubMed.
- Z. Xiong, B. Lai, Y. Yuan, J. Cao, P. Yang and Y. Zhou, Chem. Eng. J., 2016, 302, 137–145 CrossRef CAS.
- S. Y. Attia, Y. Barakat, H. Hassan and S. G. Mohamed, J. Energy Storage, 2020, 29, 101349 CrossRef.
- S. G. Mohamed, S. Y. Attia, Y. F. Barakat, H. H. Hassan and W. Al Zoubi, ChemistrySelect, 2018, 3, 6061–6072 CrossRef CAS.
- Z. Qu, M. Shi, H. Wu, Y. Liu, J. Jiang and C. Yan, J. Power Sources, 2019, 410–411, 179–187 CrossRef CAS.
- H. Chen, S. Chen, M. Fan, C. Li, D. Chen, G. Tian and K. Shu, J. Mater. Chem. A, 2015, 3, 23653–23659 RSC.
- B. Huang, W. Wang, T. Pu, J. Li, J. Zhu, C. Zhao, L. Xie and L. Chen, J. Colloid Interface Sci., 2018, 532, 630–640 CrossRef CAS PubMed.
Footnote |
| † Electronic supplementary information (ESI) available. See DOI: 10.1039/d2ra00268j |
| This journal is © The Royal Society of Chemistry 2022 |

