DOI:
10.1039/D2RA00171C
(Paper)
RSC Adv., 2022,
12, 3036-3043
Investigation of BaO reinforced TiO2–p2O5–li2O glasses for optical and neutron shielding applications
Received
10th January 2022
, Accepted 11th January 2022
First published on 24th January 2022
Abstract
The optical and radiation shielding characteristics of 15TiO2-70P2O5 – (15 − x) Li2O-x BaO x = (0 ≤ x ≤ 10 mol%) glasses were reported in this study. The glass status of the investigated samples was established by XRD. Although the molar volume decreases within 39.8–31.2 cm3 mol−1, the density was increased from 2.908 to 4.11 g cm−3 with the addition of BaO. UV-Vis-NIR spectroscopy was utilized for the examination of the optical characteristics of all compositions. Eindiropt. and Ediropt. both increased from 2.7 to 3.07 eV and 2.79 to 3.31 eV, while Eu decreased from 0.368 to 0.295 eV. Furthermore, the Phy-X/PSD code was used to evaluate the gamma-ray shielding parameter. Within the energy range of 15 keV to 15 MeV, the equivalent atomic number, as well as the EBF and EABF parameters, was evaluated. Overall, excellent material properties were detected for a glass with a high BaO content, which could be useful for future optical, shielding, and fast neutron shielding properties.
1. Introduction
Glasses have unique characteristics like microhardness, optical, non-toxicity, and flexibility. The dominated incorporation of specialized transition metal oxides (TMO) into phosphate glasses allows them to be used in a variety of applications.1–5 Adding various intermediate oxides to phosphate glasses has been found to improve their low chemical durability, according to several investigations. ZnO, CaO, BaO, ZrO2, TiO2, PbO2, Bi2O3, Al2O3, and Fe2O3 are the most widely recommended additions to P2O5.6–10
Due to their unique physical characteristics, such as ultraviolet (UV) emission, excellent moisture resistance, and a high thermal expansion coefficient, TiO2–P2O5 glasses have attracted a lot of attention in the last few decades. The main fields of application for TiO2–P2O5 glasses are microelectronics, photonic materials, optical amplifiers, and semiconductors. Regrettably, binary TiO2–P2O5 glass creation is limited, and elucidating these glasses requires a significant amount of energy. Glasses based on TiO2–P2O5 have been studied as semiconductor materials for a long time. Furthermore, because Ti4+ has empty or unfilled d-shells, which can be attributed to polarizabilities, the presence of TiO2 in P2O5 glasses may improve their optical and electrical characteristics. TiO2–P2O5 based glasses have been considered as potential applicants for Raman applications because of all these distinctive optical characteristics.3,7
Alkaline oxides, in specific, are found to lower the melting temperature of TiO2–P2O5 systems. When Li2O is added to TiO2–P2O5, lithium titanophosphate glasses are formed, which can be used in micro-batteries and electric devices. The optical absorption of glass systems is affected by the presence of TiO2 and BaO. To minimize thermal expansion and enhance mechanically, and thermal stability, metal oxides such as BaO were added to the glass system.11,12 BaO was doped in TiO2–P2O5–Li2O glasses in this investigation. Physical, optical, and radiation characteristics of BaO–TiO2–P2O5–Li2O glasses were developed and characterized.
The goal of this article was to develop BaO–TiO2–P2O5–Li2O glasses. This article can be used in the future for enhancing the optical requirements and to reduce the harmful effects of radiation on organisms. We have expanded our research into BaO in lithium titanophosphate glasses as a result of the above existing literature. As a result, we've developed lithium titanophosphate glasses with BaO substituted in a variety of compositions. In addition to the aforementioned studies, photons, neutrons, characteristics of BaO doped lithium titanophosphate glasses will be investigated using theoretical code in this work.
2. Materials and methods
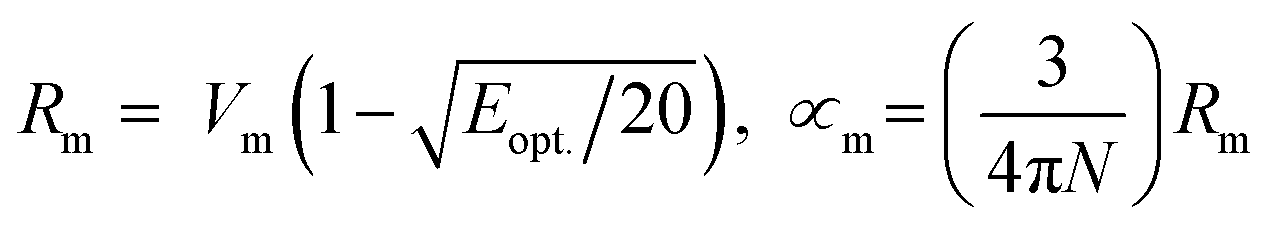
The melt-quenching technique was utilized for manufacturing the glass system in Table 1 70P2O5–15TiO2–(15 − x) Li2O − xBaO, where x = 0, 2, 4, 8, and 10 mol%. A digital electronic balance was used to weigh starting materials such as titanium oxide, TiO2, barium oxide BaO, lithium oxide Li2O as Li2CO3, and phosphorous oxide P2O5 as (NH4)2HPO4. The powder was put into the porcelain crucible and the mixture was preheated at 400 °C for 90 min. Then, the mixture was melted at 1150 °C. For the annealing procedure, the glasses were preheated at 375 °C to eliminate any thermal stress. The samples were cut to a thickness of 1 cm × 1 cm × 0.25 mm and polished on both sides before optical measurement. The UV-Vis-NIR data were collected at room temperature using a JASCO V-670 spectrometer. The absorption coefficient, (α), ∝ = (2.303|d) × A, optical bandgap, (Eindiropt. & Ediropt.), Urbach energy, (Eu), refractive index (nD), and dispersion parameters have been estimated using optical absorbance. Molar refractivity Rm, molar polarizability ∝m, reflection loss RL, metallization M, electronegativity χ, electron polarizability ∝, and optical basicity ∧ were calculated as physical parameters related to optical energy:  .
. 
 , χ = 0.2688Eopt. ∝ = −0.9χ + 3.5 and ∧ = −0.5χ + 1.7. Rm, ∝m, ∝02−, and Λ were calculated as physical parameters related to the refractive index nD: Rm = n2 − 1|n2 + 2Vm,
  , and
, and  .
.
Table 1 Glasses that have been prepared have the following chemical composition
| Code |
P2O5 |
TiO2 |
Li2O |
BaO |
| G 1 |
70 |
15 |
15 |
0 |
| G 2 |
70 |
15 |
13 |
2 |
| G 3 |
70 |
15 |
11 |
4 |
| G 4 |
70 |
15 |
7 |
8 |
| G 5 |
70 |
15 |
5 |
10 |
Using the Archimedes Code, the density (ρ) of the investigated glasses is calculated. The following is the formula for calculating molar volume: Vm = M/ρ.
Bai content was determined  . The inter-ionic, polaron, and internuclear distances were calculated as follows:
  ,
,  , and
, and  . Ba–Ba separation is calculated using
  and
and 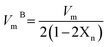 .
.
Phy-X/PSD is a new software developed by Sakar et al.13 that can compute several shielding factors and parameters at any energies using a remote server with an Intel (R) Core(TM) i7-2600 CPU@3.40 GHz CPU and 1 GB installed memory. Equivalent atomic number expected as 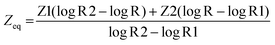 , the parameters for G–P fitting were calculated as follows:
 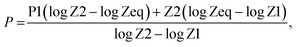 P1 and P2 are G–P fitting variables that correlate to the atomic numbers Z1 and Z2. G–P fitting was used to estimate EABF and EBF.
 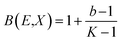 (Kx − 1) for K ≠ 1, B(E,X) = 1 + (b − 1)x K = 1 where
 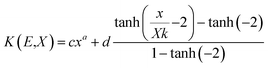 for x ≤ 40.
3. Results and discussion
3.1 Physical investigations
The XRD of the samples is depicted in Fig. 1, and they are all amorphous. The XRD showed a broad hump instead of peaks, demonstrating that the glasses are amorphous.14–21
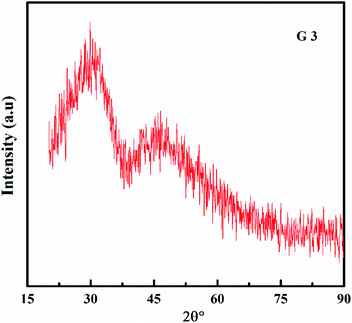 |
| | Fig. 1 XRD of 70P2O5–15TiO2–11Li2O–4BaO glasses. | |
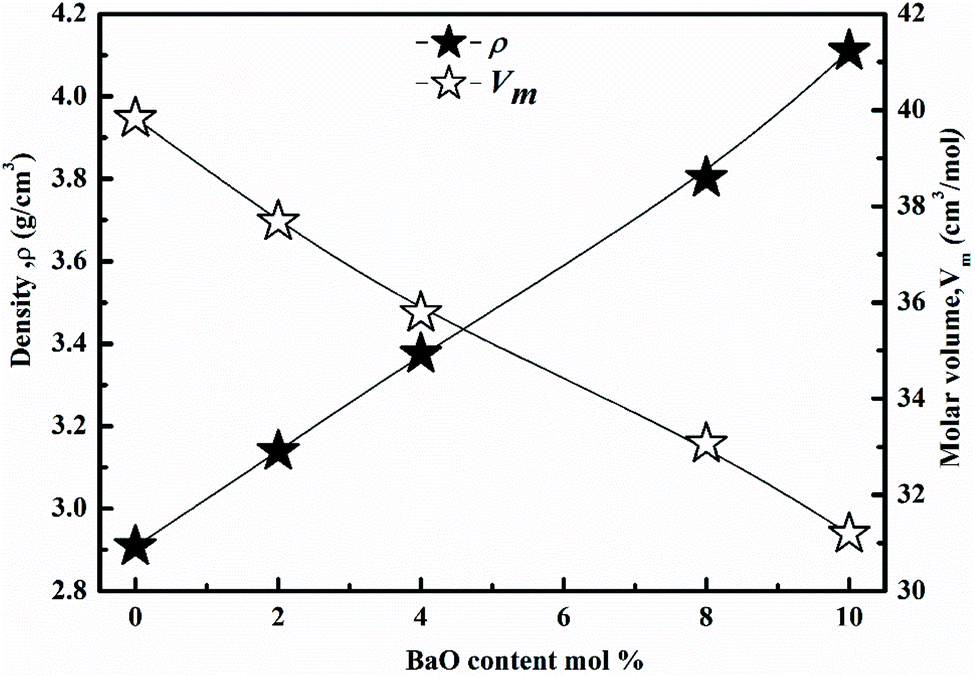
As a function of BaO content, the density (ρ) and molar volume (Vm) are shown in Fig. 2. As the BaO content rises, (ρ) increment, but (Vm) decline. (ρ) values are affected by molecular weights and the density of oxide. Li2O and BaO have densities (2.013 and 5.72 g cm−3), as well as molecular weights (29.881 and 153.326).22–25 A change in molar volume was shown to be the inverse of the density. Consequently, as packing density (Vi) rises, molar volume values decrease. The packing density (Vi) values are obtained in Table 2. As BaO replaces Li2O, (Vm) decreases and (ρ) rises, resulting in a more compact glass structure.
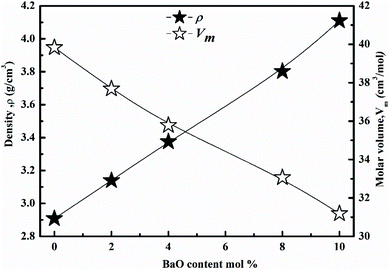 |
| | Fig. 2 Density & molar volume of glass system. | |
Table 2 Optical explanations of 15TiO2-70P2O5-(15 − x) Li2O-x BaO, glasses
| Samples |
G 1 |
G 2 |
G 3 |
G 4 |
G 5 |
| NO |
3.95 |
3.95 |
3.95 |
3.95 |
3.95 |
| Bai × 1021 |
— |
0.64 |
1.35 |
2.92 |
3.87 |
| (Ri) |
— |
11.79 |
9.20 |
7.11 |
6.48 |
| (ri) |
— |
13.61 |
10.64 |
8.25 |
7.52 |
| (rp) |
— |
3.91 |
3.06 |
2.37 |
2.16 |
| dBa−Ba |
0.58 |
0.56 |
0.55 |
0.53 |
0.51 |
| Rm (cm3 mol−1) |
25.19 |
23.63 |
22.13 |
20.26 |
18.97 |
| ∝m (A3) |
9.99 |
9.37 |
8.78 |
8.03 |
7.52 |
| (RL) |
0.63 |
0.63 |
0.62 |
0.61 |
0.61 |
| (M) |
0.367 |
0.373 |
0.381 |
0.387 |
0.392 |
| (χ) |
0.73 |
0.75 |
0.78 |
0.81 |
0.83 |
| (α°) |
2.85 |
2.83 |
2.80 |
2.77 |
2.76 |
| (∧) |
1.34 |
1.33 |
1.31 |
1.30 |
1.29 |
| Eindiropt. (eV) |
2.7 |
2.78 |
2.91 |
3 |
3.07 |
| Ediropt., (eV) |
2.79 |
2.99 |
3.09 |
3.19 |
3.31 |
| Eu (eV) |
0.368 |
0.338 |
0.323 |
0.308 |
0.295 |
| Kth |
61.4 |
77.4 |
103.4 |
121.5 |
135.5 |
| Tg(thero.) |
387 |
419 |
472 |
508 |
536 |
| Vi |
0.7 |
0.74 |
0.778 |
0.847 |
0.9 |
The Ba2+ ion concentration increment as the (Vm decline. The, (Ri), (ri), & (rp) were predictable. These values decrease as Ba2+ increments. This trend was associated with a decrease in the (Vm).25–27 Separation of Ba–Ba declines with Ba2+ increment, because of decrement in (Vm). The data values are obtained in Table 2.
3.2 Optical investigations
Fig. 3 shows the optical absorption data of glass samples at various BaO. (α), Eindiropt., Ediropt., (EU), & (nD) have been estimated. (α) calculated as: ∝ = (2.303|d) × A. (α) of these samples are displayed in Fig. 4. Increase ∝ to the increase in BaO concentration and light energy.28–35
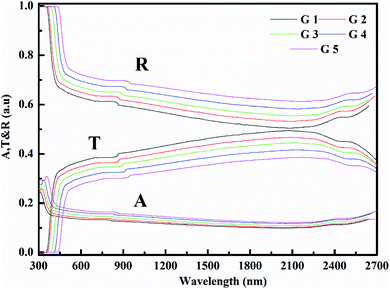 |
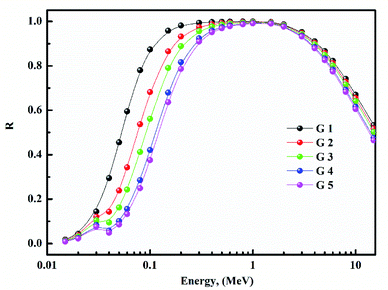
| | Fig. 3 Absorbance (A), transmittance (T), & reflectance (R) of glass system. | |
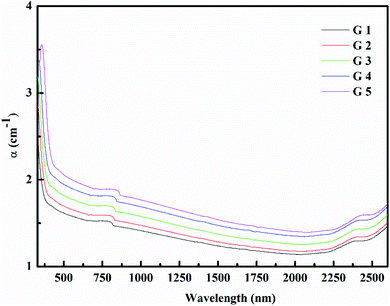 |
| | Fig. 4 Absorption coefficient of glass system. | |
Using the Tauc plot, Eindiropt. & Ediropt. was determined as αhν = C(hν − Eopt)s. Fig. 5 and 6 depict the correlation among both (αhν)1/2, (αhν)2, and (hν). The intercepts were used to estimate Eindiropt. & Ediropt. for the surveyed samples. Eindiropt. & Ediropt. both increased in value as the BaO content raised. An increase in the bond length of the Ba (0.4347 nm) and Li (0.4347 nm) could explain this (0.3039 nm). The logarithm (α) is used to calculate (Eu) as a function of energy from the curve slope in Fig. 7. Eu decreases as BaO concentrations rise. As a function of BaO, the values of Eindiropt. n Ediropt. & Eu are included in Table 1. Bulk module (K) and glass transition temperature (Tg(thero.)) are predictable in comparison to the optical bandgap Kth = −478.93 + 200.13Eopt., Tg(thero.) = −701.87 + 403.33Eopt.Kth & Tg(thero.) are increment as BaO, this is thought to be caused by an increase in the bandgap. The data values obtained are shown in Table 2.
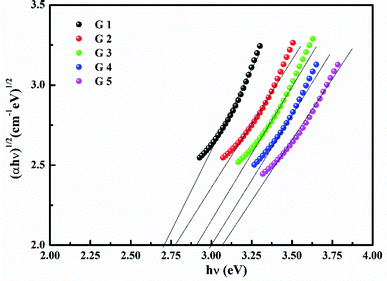 |
| | Fig. 5 (αhν)1/2 against (hν) to calculate Eindiropt.. | |
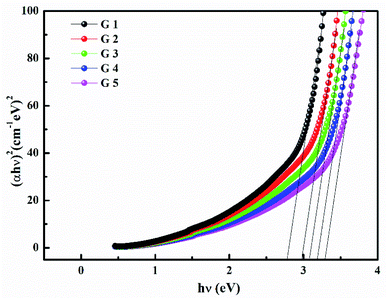 |
| | Fig. 6 (αhν)2 against (hν) to calculate Ediropt.. | |
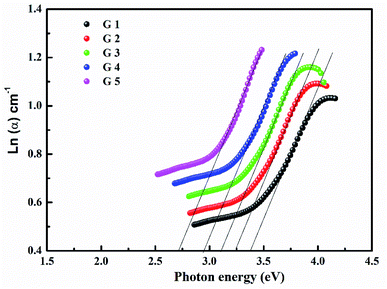 |
| | Fig. 7 ln(α) against (hν) to calculate Eu. | |
(nD) was determined as 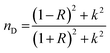 . As Fig. 8, the nD of the investigated samples increment. nD is increment as BaO, this is thought to be caused by an increase in density. nD & ρ have a similar relationship.
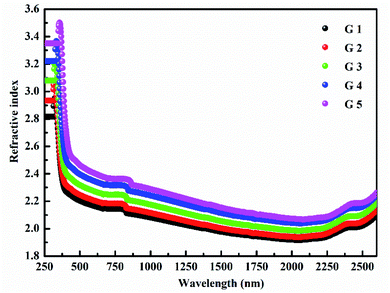 |
| | Fig. 8 Refractive index of manufactured samples. | |
Rm, ∝02− and (Λ) was estimated as nD & exemplified in Fig. 9, 10, and 11. As the amount of BaO increases, these constructs deteriorate. This observation has been reduced due to the decrease in Vm.
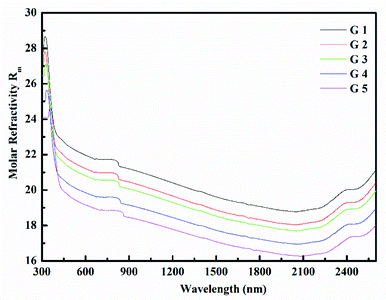 |
| | Fig. 9 Molar refractivity of manufactured samples. | |
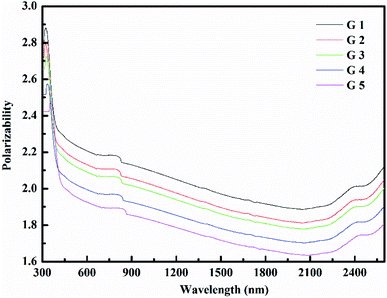 |
| | Fig. 10 polarizability of manufactured samples. | |
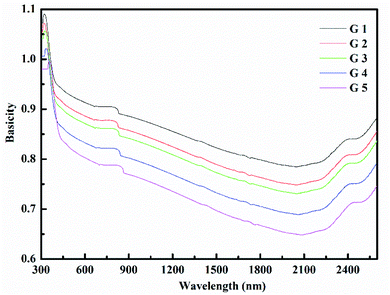 |
| | Fig. 11 Basicity of manufactured samples. | |
According to Eindiropt., the values of (Rm), (∝m), and (RL) decrease, although (χ), M increment. This observation has been reduced due to the decrease in Vm. ∝ and ∧ have different values of (χ), so they both decline. The data values obtained are shown in Table 2.
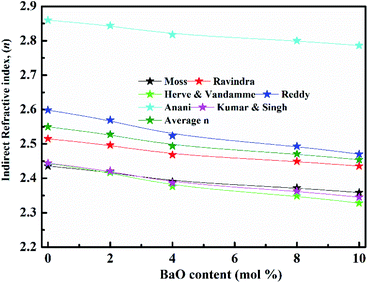
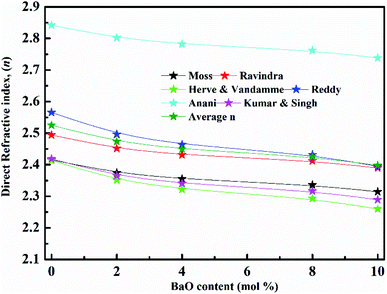
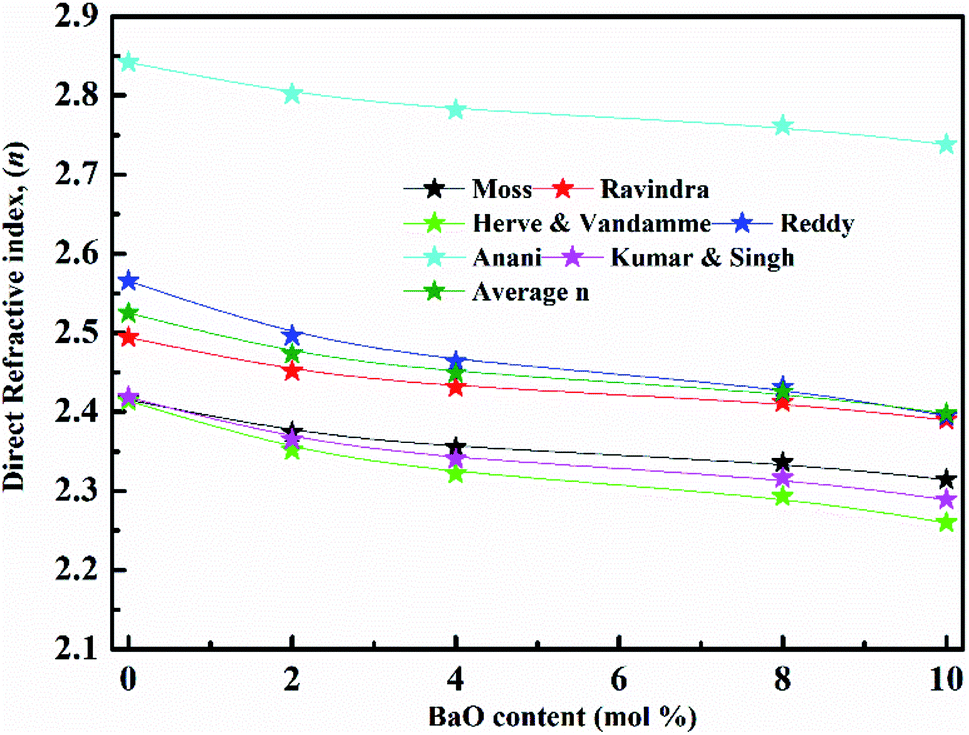
Ediropt., and Eindiropt. are used to calculate the refractive index in Fig. 12 and 13. As an outcome, there is a minimal difference in the (nD). The dielectric and static dielectric constants (εo, & ε∞) were estimated: εo = −33.26876 + 78.61805Eg − 45.70795Eg2 + 8.32449Eg3, ε∞ = nAV2. Table 3 shows the effects of Ediropt., and Eindiropt. on various optical constrictions.
 |
| | Fig. 12 Non-linear refractive index for glasses. | |
 |
| | Fig. 13 Linear refractive index for glasses. | |
Table 3 The dielectric and static dielectric (ε∞), (εo), Nonlinear parameter χ(1), (χ(3)) and average refractive index (n2) value as a function of Eindiropt.
| Sample name |
ε∞ |
ε0 |
χ(1) |
(χ(3)) 10−12 (esu) |
(n2) 10−11 (esu) |
| G 1 |
6.45 |
9.64 |
0.438 |
6.25 |
9.24 |
| G 2 |
6.39 |
10.89 |
0.4297 |
5.76 |
8.59 |
| G 3 |
6.22 |
13.58 |
0.4155 |
5.07 |
7.66 |
| G 4 |
6.11 |
15.97 |
0.4059 |
4.64 |
7.08 |
| G 5 |
6.02 |
18.16 |
0.4 |
4.34 |
6.6 |
![[thin space (1/6-em)]](https://www.rsc.org/images/entities/char_2009.gif) |
| Value as a function of Ediropt. |
| G 1 |
6.376 |
11.1 |
0.428 |
5.71 |
8.5 |
| G 2 |
6.12 |
15.68 |
0.407 |
4.69 |
7.14 |
| G 3 |
5.998 |
18.84 |
0.398 |
4.26 |
6.56 |
| G 4 |
5.88 |
22.62 |
0.389 |
3.88 |
6.03 |
| G 5 |
5.75 |
28.06 |
0.378 |
3.47 |
5.46 |
Dispersion Eo and Ed were calculated as 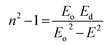 . Eo and Ed are calculated from the slope and intercept, as shown in Fig. 14 & Table 3. Eopt is the optical energy that represents
  . Refractive static index (no), oscillator's wavelength (λo), static dielectric ε∞ and strength (So) was expected as
  , ε∞ = n02, (λo) & (So) &
  . The items available are listed in Table 4.
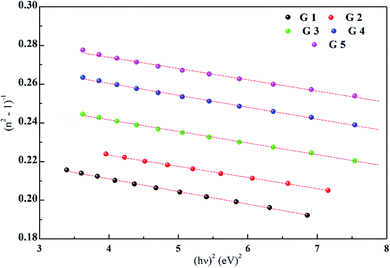 |
| | Fig. 14 (n2 − 1)−1 with (hν)−2 to calculate dispersion parameters. | |
Table 4 4Values of the dispersion parameters for the glass system
| Code |
G1 |
G2 |
G3 |
G4 |
G5 |
| Eo |
25.37 |
26.58 |
25.03 |
23.89 |
24.05 |
| Ed |
6.020 |
6.540 |
6.65 |
6.81 |
7.150 |
| Eopt |
3.01 |
3.27 |
3.324 |
3.400 |
3.573 |
| no |
1.10 |
1.12 |
1.125 |
1.13 |
1 |
| ε∞ |
1.24 |
1.25 |
1.27 |
1.285 |
1.297 |
| So |
1.952 |
2.064 |
2.078 |
2.079 |
2.084 |
| λ |
415 |
477 |
498 |
522 |
558 |
3.3 Radiation attenuation capacities
Fig. 15 depicts the Zeq results graphically. When the incident photon energy was increased and Li2O was replaced with BaO, the (Zeq) enhanced then decreased. Due to the photoelectric process, the Zeq is smallest at low energy, then suddenly increases in the middle energy region due to Compton scattering, and finally, the Zeq is reduced due to the pair production process. Because of the pair creation interaction, the (Zeq) value decreases at energies higher than 1 MeV.36–45 As a result, glass with a higher BaO content has a higher Zeq than others. In all photon energy, it was discovered that G 5 has the maximum values, while G 1 has the smallest.
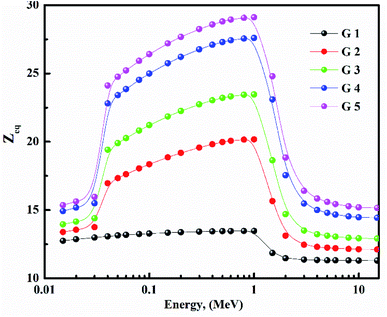 |
| | Fig. 15 Equivalent atomic number for glasses. | |
Using the (G-P) fitting method, the (EBF) and (EABF) were calculated. Fig. 16 show EBF and EABF. The pattern of variation for both EAF & EABF is similar. Because of the different dominant interaction processes, the EBF and EABF rise, and decline. One common feature of the EAF & EABF spectra is that the Compton scattering (CS) dominated areas have relatively higher values when compared to both photoelectric effect (PE) and pair production (PP). This also confirms that a material's EAF & EABF is determined by its photon energy and chemical structure. In addition, as BaO content increases, the EAF & EABF decrease. As a result, the EBF and EABF variance behaviors are primarily impacted by the three main interaction mechanisms discussed previously.38–45
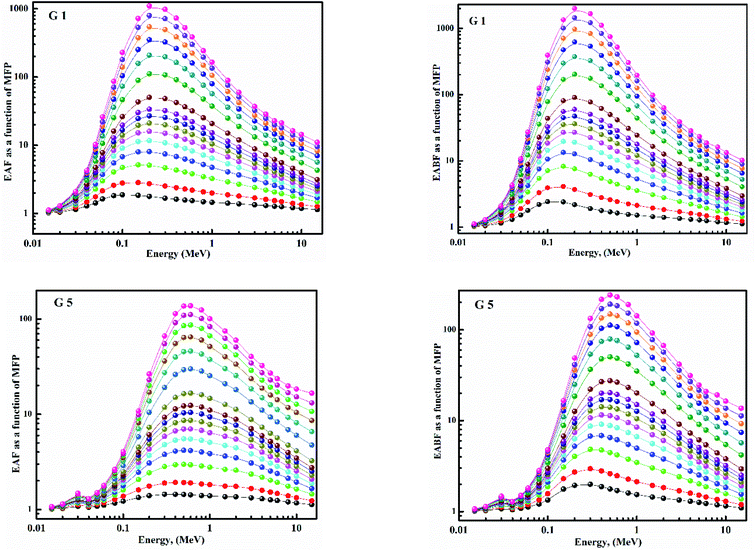 |
| | Fig. 16 EAF & EABF for 70P2O5–15TiO2–15Li2O & 70P2O5–15TiO2–5Li2O–10BaO glasses. | |
Finally, we investigate the neutron shielding behavior of glasses using effective removal cross-sections ∑R. ∑R of synthesized samples is shown in Fig. 17. ∑R is a density-dependent is shown in Fig. 18a and b. Clearly, as the BaO content of the glasses increases, ∑R increases. When the FNRC of glass samples is compared, G 5 is a better fast neutron absorber. As a result, the highest value is given to G 5. The glass sample G 5 is the best choice for neutron attenuation applications.38–45
 |
| | Fig. 17 Effective removal cross-sections for fabricated glasses. | |
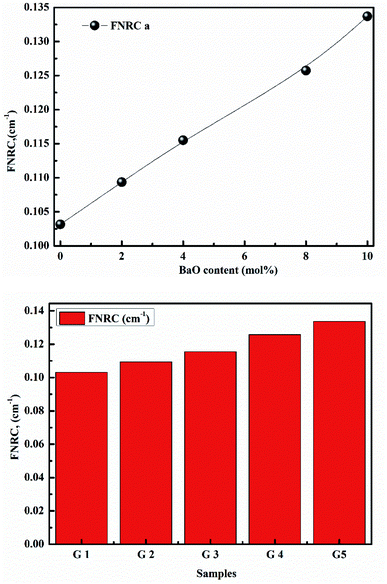 |
| | Fig. 18 (a) Fast neutron removal cross-sections with BaO. (b) Fast neutron removal cross-sections with samples. | |
4. Conclusions
Melt quenching performance was utilized to manufacture lithium titanophosphate glasses doped with different amounts of BaO for optics and radiation applications. The XRD analysis confirmed the amorphous state. The molar volume is the decline within 39.8–31.2 cm3 mol−1, the density was increment from 2.908 to 4.11 g cm−3 with an increase of BaO. With increment BaO, the studied glasses' linear and nonlinear optical properties improve significantly. Eindiropt. & Ediropt. both increased from 2.7to 3.07 eV, 2.79 to 3.31 eV, while Eu decline from 0.368 to 0.295 eV. For all glasses, the metallization ranged from 0.367 to 0.392, and electronegativity ranged from 0.73 to 0.83. The (EBF and EABF) values reduced slightly as the BaO increased. Overall, excellent material properties were detected, which could be useful for future optical applications. Consequently, these glasses can be suggested and improved as shielding material for gamma-ray & neutrons.
Conflicts of interest
There are no conflicts to declare.
Acknowledgements
We would like to thank Taif University Research Supporting Project number (TURSP-2020/24), Taif University, Taif, Saudi Arabia. Moreover, the authors express their gratitude to the Deanship of Scientific Research at King Khalid University for funding this work through the research groups program under grant number R.G.P. 1/298/42.
References
- J. Šubčík, L. Koudelka, P. Mošner, L. Montagne, B. Revel and I. Gregora, J. Non-Cryst. Solids, 2009, 355, 970–975 CrossRef.
- A. A. El-Maaref, R. M. El-Agmy, K. S. Shaaban and E. A. Abdel Wahab, Eur. Phys. J. Plus, 2021, 136, 804 CrossRef CAS.
- M. A. Sayed, A. M. Ali, A. F. Abd El-Rehim, E. A. Abdel Wahab and K. S. Shaaban, J. Elec. Mat., 2021, 50, 3116–3128 CrossRef CAS.
- K. S. Shaaban, E. A. Abdel Wahab, A. A. El-Maaref, M. Abdelawwad, E. R. Shaaban, E. S. Yousef, H. Wilke, H. Hillmer and J. Börcsök, J. Electron. Mater., 2020, 31, 4986–4996 CrossRef CAS.
- A. A. El-Maaref, S. Badr, K. S. Shaaban, E. A. Abdel Wahab and M. M. Elokr, J. Rare Earths, 2019, 37, 253–259 CrossRef CAS.
- E. A. Abdel Wahab, A. A. El-Maaref, K. S. Shaaban, J. Börcsök and M. Abdelawwad, Opt. Mat., 2021, 111, 110638 CrossRef CAS.
- K. S. Shaaban, E. S. Yousef, S. A. Mahmoud, E. A. A. Wahab and E. R. Shaaban, J. Inorg. Organomet. Polym. Mater., 2020, 30, 4655–4663 CrossRef CAS.
- K. S. Shaaban, H. Y. Zahran, I. S. Yahia, H. I. Elsaeedy, E. R. Shaaban, S. A. Makhlouf, E. A. A. Wahab and E. S. Yousef, Appl. Phys. A: Solids Surf., 2020, 126 Search PubMed.
- Y. S. Rammah, F. I. El-Agawany, E. A. A. Wahab, M. M. Hessien and K. Shaaban, Radiat. Phys. Chem., 2022, 109956, DOI:10.1016/j.radphyschem.2021.109956.
- Z. A. Alrowaili, A. M. Ali, A. M. Al-Baradi, M. S. Al-Buriahi, E. A. A. Wahab and K. S. Shaaban, Opt. Quantum Electron., 2022, 54, 88–106 CrossRef CAS.
- A. F. A. El-Rehim and K. S. Shaaban, J. Mater. Sci.: Mater. Electron., 2021, 32, 4651–4671 CrossRef CAS.
- K. S. Shaaban, S. Alomairy and M. S. Al-Buriahi, J. Mater. Sci.: Mater. Electron., 2021, 32, 26034–26048 CrossRef CAS.
- E. Şakar, Ö. F. Özpolat, B. Alım, M. I. Sayyed and M. Kurudirek, Radiat. Phys. Chem., 2020, 166, 108496 CrossRef.
- K. H. Mahmoud, A. S. Alsubaie, E. A. A. Wahab, F. M. Abdel-Rahim and K. S. Shaaban, Silicon, 2021 DOI:10.1007/s12633-021-01125-0.
- K. S. Shaaban and E. S. Yousef, Optik, 2020, 203, 163976 CrossRef CAS.
- K. S. Shaaban, I. Boukhris, I. Kebaili and M. S. Al-Buriahi, Silicon, 2021 DOI:10.1007/s12633-021-01080-w.
- A. F. A. El-Rehim, H. Y. Zahran, I. S. Yahia, A. M. Ali and K. S. Shaaban, Silicon, 2020 DOI:10.1007/s12633-020-00827-1.
- A. F. A. El-Rehim, A. M. Ali, H. Y. Zahran, I. S. Yahia and K. S. Shaaban, J. Inorg. Organomet. Polym. Mater., 2021, 31, 1774–1786 CrossRef CAS.
- K. S. Shaaban and Y. B. Saddeek, Silicon, 2017, 9, 785–793 CrossRef CAS.
- A. F. A. El-Rehim, K. S. Shaaban, H. Y. Zahran, I. S. Yahia, A. M. Ali, M. M. A. Halaka, S. A. Makhlouf, E. A. A. Wahab and E. R. Shaaban, J. Inorg. Organomet. Polym. Mater., 2021, 31, 1057–1065 CrossRef CAS.
- B. Albarzan, A. H. Almuqrin, M. S. Koubisy, E. A. Abdel Wahab, K. A. Mahmoud, Kh. S. Shaaban and M. I. Sayyed, Prog. Nucl. Energy, 2021, 141, 103931 CrossRef CAS.
- A. F. A. El-Rehim, K. S. Shaaban, H. Y. Zahran, E. A. A. Wahab and E. R. J. Shaaban, Mat. Sci. Mat. In Elec., 2021, 31(3), 1057–1065 CAS . https://www.scopus.com/sourceid/4700152855?origin=resultslist.
- K. S. Shaaban, A. M. Al-Baradi and E. A. A. Wahab, Silicon, 2021 DOI:10.1007/s12633-021-01309-8; E. A. A. Wahab, A. M. Al-Baradi, M. A. Sayed, A. M. Ali, S. A. Makhlouf and K. S. Shaaban, Silicon, 2022 DOI:10.1007/s12633-021-01652-w.
- E. A. Abdel Wahab, A. A. El-Maaref, K. S. Shaaban, J. Börcsök and M. Abdelawwad, Opt. Mat., 2021, 111, 110638 CrossRef CAS.
- A. A. El-Maaref, E. A. A. Wahab, K. S. Shaaban and R. M. El-Agmy, Solid State Sci., 2021, 113, 106539 CrossRef CAS.
- A. M. Al-Baradi, E. A. A. Wahab and K. S. Shaaban, Silicon, 2021 DOI:10.1007/s12633-021-01286-y.
- A. M. Al-Baradi, A. F. A. El-Rehim, Z. A. Alrowaili, M. S. Al-Buriahi and K. S. Shaaban, Silicon, 2021 DOI:10.1007/s12633-021-01481-x.
- M. S. I. Koubisy, K. S. Shaaban, E. A. A. Wahab, M. I. Sayyed and K. A. Mahmoud, Eur. Phys. J. Plus, 2021, 136(2), 156 CrossRef CAS.
- E. A. A. Wahab, A. M. Aboraia, A. M. E. Shafey, K. S. Shaaban and A. V. Soldatov, Opt. Quantum Electron., 2021, 53, 504 CrossRef CAS.
- E. A. Abdel Wahab, K. S. Shaaban, S. Alomairy and M. S. Al-Buriahi, Eur. Phys. J. Plus, 2021, 136, 636 CrossRef CAS.
- E. A. Abdel Wahab, K. S. Shaaban and E. S. Yousef, Opt. Quantum Electron., 2020, 458, 52 Search PubMed.
- S. Alomairy, A. M. Aboraia, E. R. Shaaban and K. S. Shaaban, Braz. J. Phys., 2021, 51, 1237–1248 CrossRef CAS.
- E. A. A. Wahab, K. S. Shaaban and A. M. Al-Baradi, Silicon, 2021 DOI:10.1007/s12633-021-01236-8.
- A. M. Fayad, K. S. Shaaban, W. M. Abd-Allah and M. Ouis, J. Inorg. Organomet. Polym. Mater., 2020, 30, 5042–5052 CrossRef CAS.
- Z. A. Alrowaili, A. M. Al-Baradi, M. A. Sayed, A. Mossad Ali, E. A. Abdel Wahab, M. S. Al-Buriahi and K. S. Shaaban, Optik, 2022, 249, 168259 CrossRef.
- A. M. Ali, Z. A. Alrowaili, A. M. Al-Baradi, M. S. Al-Buriahi, E. A. A. Wahab and K. S. Shaaban, Silicon, 2021 DOI:10.1007/s12633-021-01440-6.
- E. A. Abdel Wahab and K. S. Shaaban, Appl. Phys. A, 2021, 127(12), 956 CrossRef CAS.
- K. S. Shaaban, H. Y. Zahran, I. S. Yahia, H. I. Elsaeedy, E. R. Shaaban, S. A. Makhlouf, E. A. A. Wahab and E. S. Yousef, Appl. Phys. A, 2020, 126(10), 804 CrossRef CAS.
- M. A. Alothman, Z. A. Alrowaili, J. S. Alzahrani, E. A. A. Wahab, I. O. Olarinoye, C. Sriwunkum, K. S. Shaaban and M. S. Al-Buriahi, J. Alloys Compd., 2021, 882, 160625 CrossRef CAS.
- A. F. A. El-Rehim, H. Y. Zahran, I. S. Yahia, E. A. A. Wahab and K. S. Shaaban, J. Mater. Eng. Perform., 2021, 30, 1872–1884 CrossRef CAS.
- A. F. A. El-Rehim, H. Y. Zahran, I. S. Yahia, S. A. Makhlouf and K. S. Shaaban, Silicon, 2021, 13, 2289–2307 CrossRef CAS.
- Y. B. Saddeek, K. H. S. Shaaban, R. Elsaman, A. El-Taher and T. Z. Amer, Radiat. Phys. Chem., 2018, 150, 182–188 CrossRef CAS.
- S. Alomairy, Z. A. Alrowaili, I. Kebaili, E. A. A. Wahab, C. Mutuwong, M. S. Al-Buriahi and K. S. Shaaban, Silicon, 2021 DOI:10.1007/s12633-021-01347-2.
- S. Alomairy, M. S. Al-Buriahi, E. A. Abdel Wahab, C. Sriwunkum and K. Shaaban, Ceram. Interfaces, 2021, 47(12), 17322–17330 CrossRef CAS.
- M. H. A. Mhareb, M. I. Sayyed, Y. S. M. Alajerami, M. Alqahtani, N. Dwaikat, A. M. Alsagry, M. Al-Yatimi and M. Zakariah, Eur. Phys. J. Plus, 2021, 136, 26–41 CrossRef CAS.
|
| This journal is © The Royal Society of Chemistry 2022 |
Click here to see how this site uses Cookies. View our privacy policy here. 
 Open Access Article
 This Open Access Article is licensed under a Creative Commons Attribution-Non Commercial 3.0 Unported Licence
 *a,
Ateyyah M. Al-Baradib and
Atif Mossad Alicd
*a,
Ateyyah M. Al-Baradib and
Atif Mossad Alicd
 .
. 
 , χ = 0.2688Eopt. ∝ = −0.9χ + 3.5 and ∧ = −0.5χ + 1.7. Rm, ∝m, ∝02−, and Λ were calculated as physical parameters related to the refractive index nD: Rm = n2 − 1|n2 + 2Vm,
 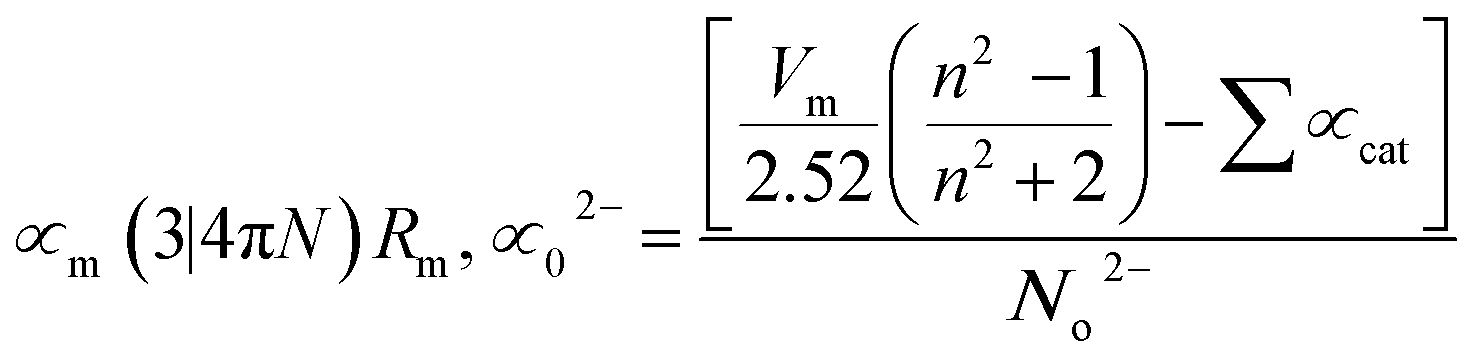 , and
, and  .
.
 . The inter-ionic, polaron, and internuclear distances were calculated as follows:
  ,
,  , and
, and  . Ba–Ba separation is calculated using
  and
and  .
. , the parameters for G–P fitting were calculated as follows:
  P1 and P2 are G–P fitting variables that correlate to the atomic numbers Z1 and Z2. G–P fitting was used to estimate EABF and EBF.
  (Kx − 1) for K ≠ 1, B(E,X) = 1 + (b − 1)x K = 1 where
  for x ≤ 40.


 . As Fig. 8, the nD of the investigated samples increment. nD is increment as BaO, this is thought to be caused by an increase in density. nD & ρ have a similar relationship.
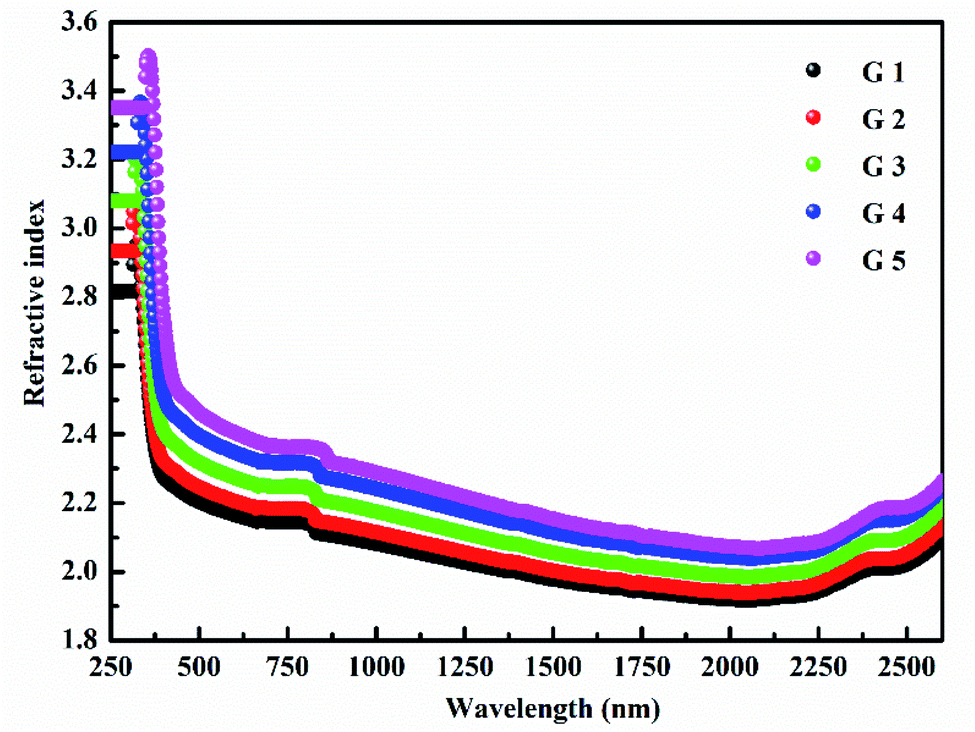


 . Eo and Ed are calculated from the slope and intercept, as shown in Fig. 14 & Table 3. Eopt is the optical energy that represents
  . Refractive static index (no), oscillator's wavelength (λo), static dielectric ε∞ and strength (So) was expected as
  , ε∞ = n02, (λo) & (So) &
  . The items available are listed in Table 4.


