
 Open Access Article
 This Open Access Article is licensed under a Creative Commons Attribution-Non Commercial 3.0 Unported Licence
The effect of mutation in the stem of the MicroROSE thermometer on its thermosensing ability: insights from molecular dynamics simulation studies†
Swagata Halder and
Manju Bansal *
*
Molecular Biophysics Unit, Indian Institute of Science, Bangalore-560012, India. E-mail: mb@iisc.ac.in
First published on 19th April 2022
Abstract
A large number of bacteria have been found to govern virulence and heat shock responses using temperature sensing RNAs known as RNA thermometers (RNATs). They repress translation initiation by base pairing to the Shine–Dalgarno (SD) sequence at low temperature. Increasing the temperature induces the RNA duplex to unfold and expose the SD sequence for translation. A prime example is the ROSE thermometer module known to regulate the production of the ROSE heat shock protein in Bradyrhizobium japonicum. The unfolding of a 29-nucleotide long MicroROSE RNA element which forms a critical component encompassing the SD sequence, and three mutants that differ from it by deletion of a guanine nucleotide or mutations near the SD and stem regions have been studied using high temperature molecular dynamics simulations. The simulations reveal the progressive manner in which a biologically functional RNA thermometer unfolds. Our simulations reveal that deletion of the highly conserved G10 residue, opposite to the SD region leads to the formation of a stable RNA helix that has lost its thermosensing ability. Mutations of bases A5 → U5 and U25 → A25 near the stem increase the thermosensing ability due to the allosteric effect which leads to a global destabilization effect on the structure. The temperature-dependant regulation of this thermometer has been investigated by estimation of differences in the unfolding paths by calculating individual residue fluctuation, stacking energy, the contact map plot and the lifetime dynamics plot of non-Watson–Crick hydrogen bonds at three different temperatures. Results reveal that partial unfolding at higher temperature starts from the hairpin tetra loop end and terminates at the stem region through the SD associated region. Two canonical hydrogen bonds between U9–A22 and four non-canonical hydrogen bonds between G10–G21 and U6–U24 around the internal loop play an important role in partial melting of the RNA helix. These results demonstrate how small alterations in RNA structure can regulate gene expression and illuminate the molecular basis of the function of an important bacterial regulatory motif.
1. Introduction
Bacteria use complex strategies and respond to temperatures in several different ways, as the efficiency of all cellular process is temperature dependent1 and the expression of any given gene is influenced by the ambient temperature. The genes that are particularly prone to the thermoregulation are virulence genes, cold shock and heat shock genes. Its effect on virulence gene expression in bacteria infecting warm-blooded hosts is well documented. Transcription of virulence genes in these bacteria is induced upon a shift from low environmental to a higher host temperature (37 °C).2 Interestingly, host temperatures usually correspond to the optimum for growth of these pathogenic bacteria.3 Heat shock proteins are involved in protein chaperoning, transport and in protein homoeostasis.4 Cold shock proteins are the multifunctional DNA/RNA binding proteins involved in slowing down metabolic and enzyme activity.5A large number of bacteria have been found to regulate virulence and heat shock responses using temperature-sensing RNA structural modules known as RNA thermometers. RNA thermometers are the temperature-sensitive biosensors that regulate gene expression by changing their 3D structure. An RNA thermometer forms a complex structure that includes the 5′ untranslated region (5′ UTR) of an mRNA. Typical RNA thermometers control the translation initiation by forming a secondary structure involving the SD sequence. An increase in temperature destabilizes the structure by its partial melting6 and exposes the SD sequence, leading to translation initiation.7–9
In the past decade, a series of in vivo and in vitro experiments have been carried out to explain how the RNA thermometer performs its function as a sensitive cellular thermometer. Previous structure probing experiments on the fourU thermometer demonstrate a temperature-controlled opening of the SD region.10 Numerous excellent reviews have been published recently on this fascinating subject.11–18 A recent article hypothesized that an RNAT (RNA thermometer) also regulates a bacterial gene encoding a member of a cation diffusion facilitator family. Regulation of temperature thus provides a mechanism to overcome innate immune system mediated Zn(II) toxicity.19
Many groups have worked on how RNA folds or unfolds in vivo in the presence of high temperatures, mechanical force and denaturants. One of the potential method to unfold RNA is higher temperature. Garcia group has done molecular dynamics simulations of the equilibrium folding/unfolding thermodynamics of the RNA tetraloop in explicit solvent and proposed oligomer is destabilized due to increased hydrostatic pressure.20 Thirumalai group uses coarse-grained Go-like models for RNA hairpins to explore forced unfolding over a broad range of temperatures.21 Most important observation of the group is that thermal unfolding is stochastic, whereas mechanical unfolding occurs in “quantized steps” with great variations in the step lengths. Another molecular dynamics study has been done by the Cieplak group on the free energy profile of two different RNA hairpins.22 They have used CHARMM27 and AMBERff99 two force fields on RNA hairpins by umbrella sampling method. The study demonstrates the unfolding mechanism for the RNA hairpin and reveals a problem in the CHARMM27 force field description for describe a particular hairpin conformation. Pande group carried out simulations of an RNA hairpin containing a GNRA tetraloop. Main finding of their study is that stem is the stable part of the molecule whereas multiple loop conformations and transitions between them are observed.23 Recent studies on high temperature unfolding of RNA hairpins have also shown that construction of folding pathways, including transition state ensembles of structures.24 Csaszar et al. reveal early unfolding events of RNA using all-atom molecular dynamics simulation on elevated temperature 400 K.25 Zhang et al. found the multiple unfolding pathways, diverse transition states, and various intermediate structures in the unfolding simulation of a pseudoknot within gene 32 mRNA of bacteriophage T2.26 Xiao et al. have reported a series of unfolding simulations on high-temperature to investigate the folding/unfolding pathways and mechanisms of preQ1 riboswitch.27
The expression of multiple small heat shock proteins in Bradyrhizobium japonicum and other rhizobia is controlled by the ROSE element (repressor of heat-shock gene expression),28,29 which are 70–120 nucleotide-long regulatory elements located at 5′ UTR of the mRNA. They form extended secondary structures with a highly conserved hairpin encompassing the SD sequence and AUG start codon at physiological temperatures, termed as MiniROSE.30–33 MicroROSE constitutes a portion of MiniROSE element containing only the SD sequence. Base pairing in this region is imperfect due to the presence of an internal loop and a conserved bulged residue (Fig. 1). Some non-canonical base pairs adjacent to SD play an important role in regulating the melting of secondary structure.6
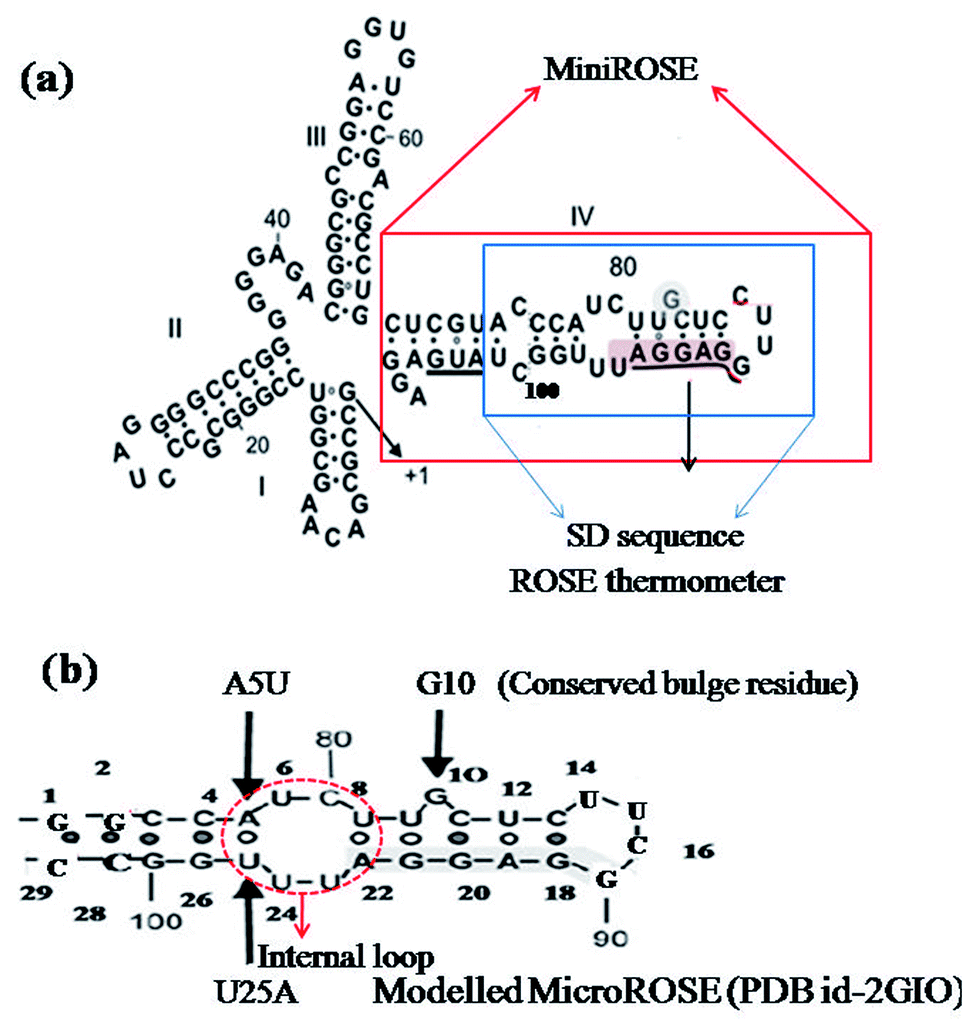 | ||
| Fig. 1 (a) Schematic representation the entire ROSE thermometer structure with the Shine–Dalgarno sequence underlined. Solid red line box indicates MiniROSE and solid blue line boundary encompasses the MicroROSE part (our working system). (b) Represents the modelled system MicroROSE corresponding to PDB ID 2GIO. Black arrows indicate conserved bulge residue G10 and mutation sites A5 and U25. Red dotted lines encircle the internal loop involved in important non canonical hydrogen bonds within MicroROSE. | ||
Several NMR studies have been carried out to understand the structural basis of ROSE thermometer activity.6 However, the molecular mechanism relating the thermometer activity with temperatures has not been fully explored. One of the great challenges of molecular modeling is to provide an atomistic-level insight into this biologically significant complex phenomenon, which is difficult to obtain from the usual experimental techniques. In the present work, we have performed detailed all atom molecular dynamics simulations, at three different temperatures (315 K, 350 K and 400 K), of four different MicroROSE model systems. The segment studied comprises of the 29 nucleotides long stem loop IV of ROSE element (described as MicroROSE), which has the SD sequence embedded in it and is located at the 3′-end of the ROSE sequence (Fig. 1). It constitutes the functional domain of the highly conserved bacterial RNA ROSE thermometer.34 Several NMR studies have been reported for an engineered construct of this 29 nt long MicroROSE fragment, with deletion and substitution mutations introduced (Fig. 1b) to understand the activity of the ROSE thermometer.35 The most important observation from the NMR studies is that the secondary structure of the temperature-responsive hairpin undergoes large fluctuation. The conserved guanine nucleotide which appeared bulged adopts a syn conformation and is actually engaged in base pairing with a guanine in the opposite strand.35 NMR results also indicated presence of a small internal loop (C7, U8, U23) with a transient hydrogen bonding network which along with two non-canonical base pairs U6–U24 and G10–G21 render the structure vulnerable to destabilization at higher temperatures, but the exact molecular mechanism is not fully understood yet. Therefore, the main focus of our in silico study is to analyse the role of canonical and non-canonical base-pairs around SD in unfolding of the MicroROSE module, as well as find out the exact mechanistic pathway of its thermo-sensing activity by carrying out molecular dynamics simulations at three different temperatures: 42 °C (315 K), 77 °C (350 K) and a much higher temperature of 127 °C (400 K). At lower temperatures, our simulation results support the experimental observations that the local structural change is insufficient to act as a thermometer, as only the regulatory hairpin is loosened up and not the whole stem loop RNA helix. However, the mechanism (zipper-like) is clearly not compatible with responses that activate the gene expression at lower temperature.
Narberhaus et al.6 identified a region adjacent to the Shine–Dalgarno sequence that has a network of weak hydrogen bonds within the RNA helix in vitro. With the onset of heat shock at 42 °C (315 K), destabilisation of the RNA structure initiates at this region and favours the release of the ribosome binding site and of the start codon. Here high temperature (400 K) unfolding simulation of RNA is carried out as it accelerates the unfolding process, by providing additional kinetic energy to individual atoms, as it would for a traditionally activated process without affecting the pathway itself. In the present study we are interested in observing the temperature response mechanism of RNA thermometer using an in silico approach. At 315 K, only subtle changes are observed near the hair-pin region but no significant conformational change is observed. Therefore, we have carried out simulations at two higher temperatures (350 K and 400 K). Interestingly, at the higher temperature our atomistic simulations are able to describe the partial unfolding mechanism that incorporates hair pin as well internal loop together. Local single mutations in stem region adjacent to the internal loop show a drastic long-range effect and make the structure susceptible to unfolding at a higher rate.
2. Materials and methods
2.1 Starting structures
The starting structure of 29 nucleotides long (A74 to U102) segment of the 5′ UTR of mRNA of Bradyrhizobium japonicum (MicroROSE) was taken from the reported 3D NMR structure of an engineered construct (PDB ID 2GIO).6 In this study, the natural wildtype tetra loop CUUG sequence had been mutated to a more stable UUCG tetra loop. In addition the A74, U102 and C75 were replaced by G74, C102 and G75 base pair at the bottom of the stem which facilitated RNA transcription. This system is defined as the modelled system in our simulations (Fig. 1), with G74 and C102 being the first (5′-end) and last (3′-end) nucleotides respectively. Therefore, the 29 nucleotides from G74 and C102 are henceforth referred to as corresponding to a numbering scheme starting with G1 and ending with C29 in our simulation analysis (Fig. 1b). The structure of ΔG10 system where bulged residue (G10) opposite to the SD region is deleted was taken from high resolution 3D NMR structure (PDB ID 2GIP). Since no experimentally determined structures are available in the PDB database, the A5 and U25 residues of model system were mutated to U5 and A25 in the third and fourth systems respectively by using the base module of the 3DNA SW program.36 This SW module introduces base mutations such that the base reference frame (position and orientation) is maintained, and the mutated structure shares the same base-pair/step geometry as that of the native or reference structure. Moreover, the mutate_base module does not disrupt the backbone orientation. These mutations had been introduced at different positions in the stem just adjacent to the internal loop, to study the effect of such mutations on RNA thermometer activity (Fig. 2).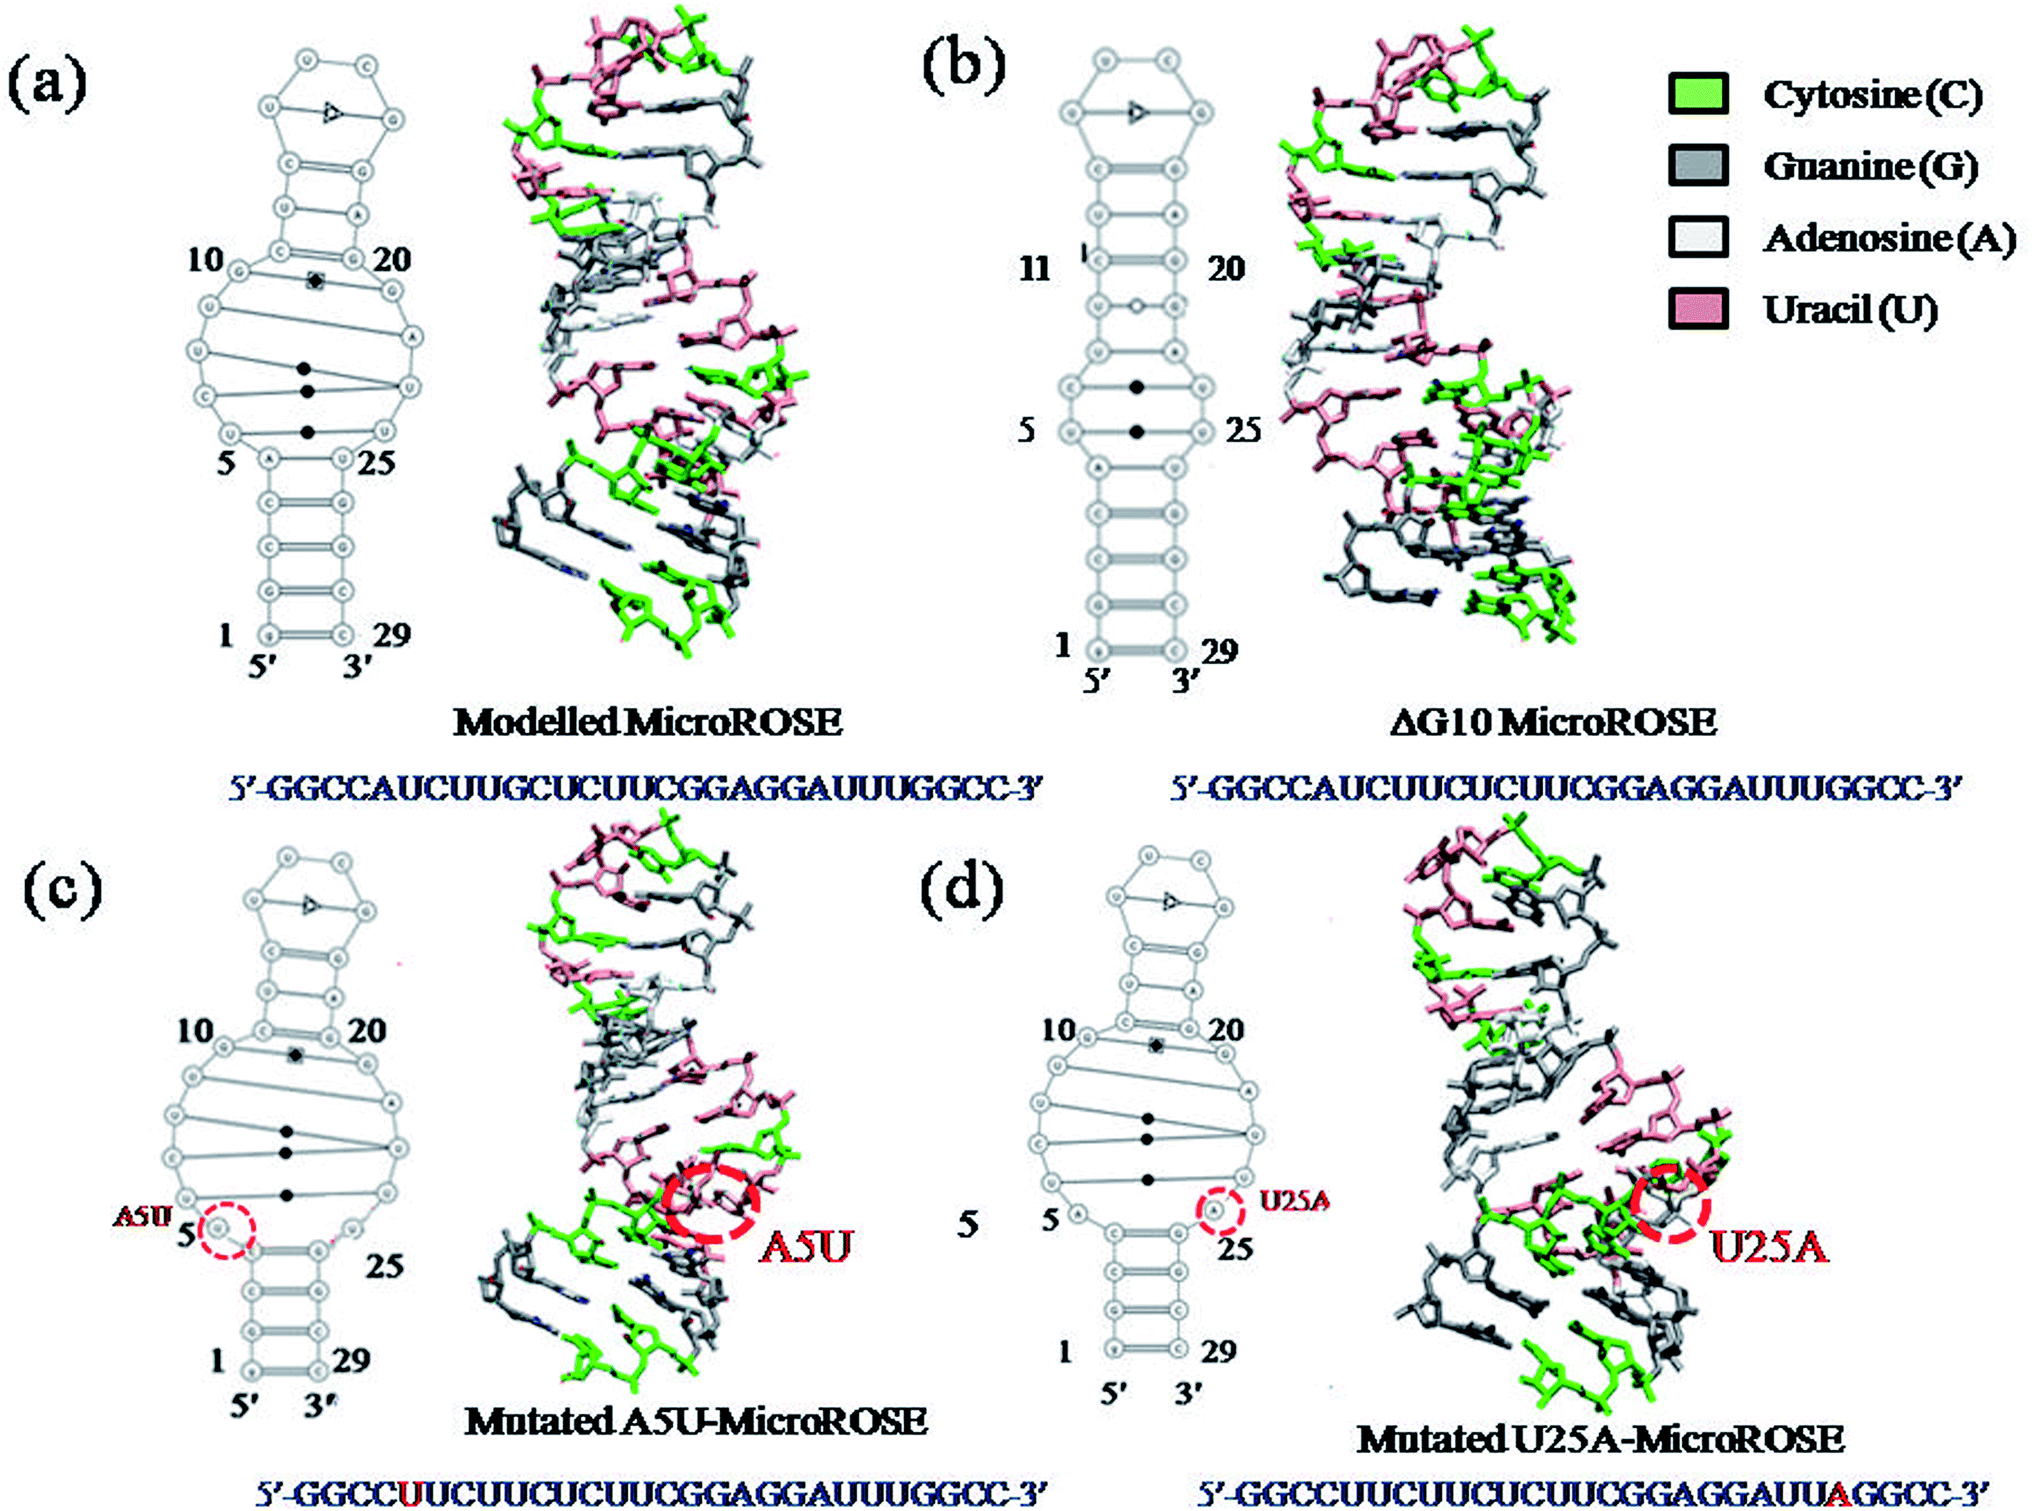 | ||
| Fig. 2 Dynamic bonds representation of four simulated systems with sequences (a) modelled MicroROSE, (b) ΔG10 MicroROSE, (c) mutated A5U and (d) U25A MicroROSE. Schematic secondary structure representation of four systems (left hand side) as determined by the RNA pdbee 2.0 programme. | ||
2.2 Methodology and AMBER simulation protocol
We performed all atom classical MD simulations using the pmemd module of AMBER37 suite of programs with established and modified glycosidic angles and non-bonded terms,38–41 using the ff99bsc0χOL3 force field for all our simulations. Missing hydrogen atoms were added by the leap module of the AMBER package on the basis of the standard residue templates. Each system was neutralized by Na+ counter ions (radius = 1.868 Å). The Joung–Cheatham parameters for monovalent sodium ions were employed.42 Each system solvated in a rectangular water box (TIP3P)43 with a 10 Å thick water layer.44 The four RNA-solvent systems were minimized prior to the AMBER simulation.A set of minimization and equilibration runs were performed to remove the initial bad contacts. Following equilibrium, an unrestrained production run of 200 ns was performed for each RNA thermometer system by maintaining the periodic boundary minimization of the solute hydrogen was followed by the minimization of counter ions and water molecules. Initial minimization was performed for 3000 steps by keeping a large restraint of 300 kcal (mol A2)−1 on RNA heavy atoms and ions followed by a second minimization of 3000 steps with a reduced restraint of 100 kcal (mol A2)−1, applied only on RNA heavy atoms. A constant volume 40 ps long MD with restraint of 100 kcal (mol A2)−1 on RNA heavy atoms was used for solvent relaxation. A full system minimization of 2000 steps with no restraints was carried out subsequently, followed by multiple 10 ps long MD where progressively restraints on solute heavy atoms were decreased from 50 to 5 kcal (mol A2)−1, except for water and ions. A final minimization of 1000 steps was carried out to ensure the removal of any remaining steric clashes. Then the systems were slowly heated stepwise to each of the three desired temperature ranges (315 K, 350 K and 400 K) under NVT condition. Finally, the system was equilibrated for 100 ps under the isobaric–isothermal (NPT) ensemble using the Berendsen thermostat and a time step of 2 fs. The temperatures were maintained for the simulations, while the pressure was kept constant at 1 bar using Berendsen barostat.45 The final production run was carried out for 200 ns of each system at the three temperatures. We have also carried out second set of simulations for all four systems at each of the three temperatures, with different starting velocities (Fig. S1†) to strengthen the reliability of our results. The two sets of simulations with two different starting velocities are defined as S1 and S2 respectively.
A set of minimization and equilibration runs were performed to remove the initial bad contacts. Following equilibration, an unrestrained production run of 200 ns was performed for each RNA thermometer system, while maintaining the periodic boundary condition. The particle-mesh Ewald (PME)46 method was used to calculate electrostatic interactions and 10 Å cutoff was applied for the Lennard-Jones interactions. The SHAKE algorithm was used to fix all hydrogen atom bonds. We used SANDER module of AMBER 18 which incorporates modified dihedral angles. Each of the simulations of four systems at three temperatures were repeated two times, using different random number seeds for assigning different starting velocities. The two sets of simulations have been called S1 and S2 respectively.
2.3 Analysis of trajectories
All the trajectories were analyzed using the CPPTRAJ module of AMBER. Nastruct and in-house codes were used for analysis of the trajectories. Molecular visualization and snapshots were generated using VMD.47 The distance cut off between heavy atoms for calculating WC and NWC hydrogen bonds was 3.5 Å and 4.0 Å respectively and 135° (D–H⋯A) angle cut off was used. Calculated matrices of native contacts (distance cut off 3 Å) were normalized by the total number of frames. We used a combination of three criteria for calculating stacking energy between base pairs: (1) a minimum distance between any pair of heavy atoms in the two bases < 4 Å, (2) a distance between the center of mass of each base of <5 Å, and (3) a vector angle between the normals to the planes of the two bases between 0 and 45° or between 135 and 180°. The first two of these properties were measured throughout the trajectory by using the standard AMBER CPPTRAJ module; the third was measured using a script written in-house. Base pairs satisfying all three criteria were considered to be stacked. Then the stacking energy value for particular base pair was averaged for last 25 ns of the simulation using AMBER CPPTRAJ pairwise command. Calculated stacking energies were expressed as a summation of electrostatic and van der Waals energies.3. Results and discussion
3.1 Dynamics of partial unfolding of modelled, deleted and mutated ROSE thermometers
The relative variability of the four different MicroROSE thermometer systems are illustrated by the root-mean-square deviations (RMSD) of phosphodiester backbone from the corresponding initial structures as a function of time. The RMSD plots of the four ROSE systems at three different temperatures for simulation S1 are shown in Fig. 3. No major change was observed in the backbone of the four ROSE systems at 315 K, with RMSD remaining within a range of 2 to 5 Å for all four systems (Fig. 3a). On increasing the temperature to 350 K (Fig. 3b), the RMSD of mutated U25A MicroROSE system deviated marginally from the other three systems, with the RNA backbone RMSD increasing from 2 Å to 7 Å in 50 ns and then remaining stable till 200 ns. It is only at the very elevated 400 K temperature (Fig. 3c), that considerable differences were observed between the four systems. The mutated MicroROSE system U25A again, showed the largest difference in its RMSD profile, when compared to the modelled MicroROSE system. The RMSD of U25A MicroROSE system increased to 10 Å within 50 ns of the simulation and thereafter remained unchanged till 200 ns, indicating a large change during the early stage of simulation for this structure. However mutated A5U MicroROSE system showed comparatively smaller increase in the RMSD value and stabilized at 7 Å after 50 ns, almost similar to the RMSD observed for the modelled system after 100 ns. The smallest RMSD was observed in case of ΔG10 MicroROSE system. There was no sudden increase in RMSD even at 400 K and the RMSD value was constrained within 4 Å during the entire simulation run time. The small RMSD for ΔG10 clearly indicated that deleting the bulge opposite to the SD region stabilized the backbone, while base mutations in the stem region near the internal loop destabilized the overall global conformation that could facilitate partial unfolding at higher temperature. For simulation S2 (Fig. S1†), at 315 K, backbone RMSDs for all systems were within 4.5 Å, except for the ΔG10 system, which showed an RMSD of 2 Å throughout the simulation. Noticeable RMSD change was observed at 350 K for mutated U25A MicroROSE system, where RMSD was about 5 Å during initial 100 ns and then gradually increased to 6.5 Å at the end of the simulation, whereas for all other three systems RMSD values remain within 5 Å during the entire simulation. At higher temperature (400 K) RMSD for mutated A5U and U25A MicroROSE systems attained 8 Å and 11 Å respectively. In case of modelled MicroROSE RMSD increased to 7 Å after 50 ns of the simulation but RMSD for ΔG10 system remained small at about 2.5 Å throughout the simulation. Thus structural dynamics observed for the four systems during S2 simulations are very similar to the results from S1 simulations at all three temperatures. We also calculated the RMSD of the WT MicroROSE structure with CUUG tetraloop, at the three temperatures (Fig. S2†) to see the effect of tetraloop on overall MicroROSE structure RNA helix. We observed the RMSD of WT MicroROSE was significantly higher than modelled MicroROSE at three temperatures. At 315 K, RMSD was 4 Å but when temperature was increased to 350 K, RMSD shows a sudden jump to 8 Å. At 400 K, RMSD increased to 10 Å within initial 50 ns from the starting simulation and then increased to 12 Å towards the end of the simulation time. The higher backbone RMSD of WT MicroROSE indicated less stable RNA helix than modelled MicroROSE due to thermodynamically less stable CUUG tetraloop containing structure. To further explore the role of individual residues, root mean square fluctuation (RMSF) was calculated.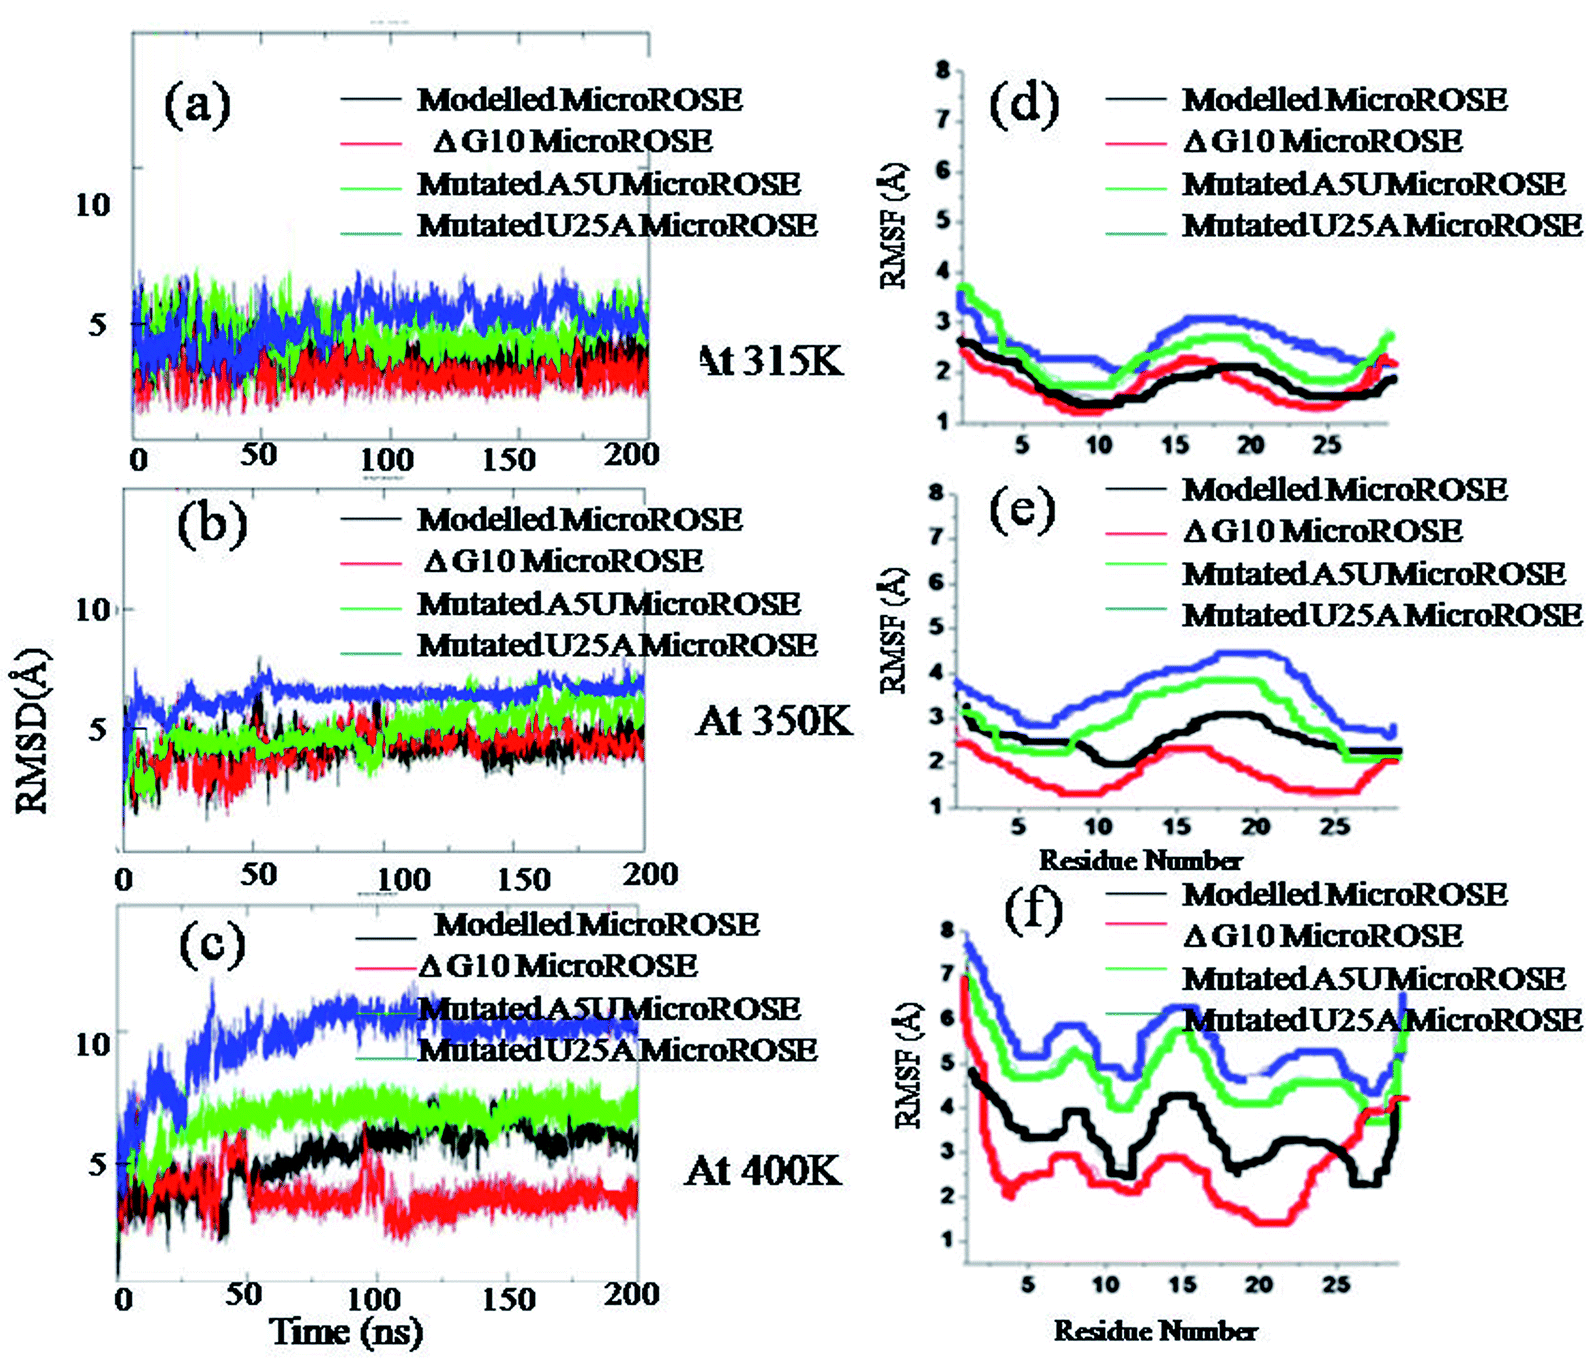 | ||
| Fig. 3 Root mean square deviation (RMSD) and root mean square fluctuation (RMSF) of four simulated systems. Backbone RMSD of four systems during the 200 ns simulation are calculated with respect to their equilibrated structures, plotted against time (a) at 315 K, (b) at 350 K and (c) at 400 K. Mean backbone RMSF of each residue for four systems are plotted corresponding to (d) 315 K, (e) 350 K and (f) 400 K (S1 simulations). | ||
3.2 RMSF: analysis of residue-wise contribution toward structural fluctuations
Root mean square fluctuation (RMSF) of each residue in the four ROSE systems were plotted to identify the less stable regions of the MicroROSE modules. These values were averaged for each residue over the entire trajectory, for each of the three different temperatures (Fig. 3d–f). For S1 simulations, in all the simulated systems apart from the 5′ and 3′ terminal residues, nucleotides 11–20 that constitute the hairpin loop region displayed the highest fluctuations compared to the other parts at 315 K as well as 400 K, with adjacent stem residues also showed large fluctuation at higher temperature. However, the ΔG10 MicroROSE system exhibited RMSF fluctuation of less than 3 Å, even at 400 K for all residues, except those at the termini. Similar features were observed for the S2 simulations (Fig. S1a–c†). RMSF values for 11–20 residues of all for systems were within 3 Å at 315 K. At 350 K, higher RMSF was observed only for mutated U25A MicroROSE system, hair pin residues of mutated U25A system showed RMSF near to 4 Å. The most interesting observation was at 400 K, where sudden jumps in RMSFs were observed for three systems, with the exception of the ΔG10 system, which showed average RMSF of about 3 Å. The modelled MicroROSE showed slightly higher RMSF of 4.5 Å for the hairpin residues, while both A5U and U25A mutated systems showed the highest RMSF values 6.5 Å and 7 Å respectively. To compare how WT loop (CUUG) effects over modelled loop (UUCG) we calculated the RMSF of all residues for WT MicroROSE system (Fig. S1d–f†). We observed that the hairpin n constituting 11–20 nucleotides showed higher RMSF fluctuations at all three temperatures, as compared to the modelled MicroROSE. Notably the CUUG tetraloop within WT MicroROSE showed higher RMSF fluctuations of 7 Å and 8 Å at 350 K and 400 K respectively, as compared to UUCG tetraloop within modelled MicroROSE which showed RMSF of 2.5 Å and 4 Å at 350 K and 400 K respectively. Our simulation results thus clearly confirm that the modelled UUCG tetraloop is thermodynamically more stable than the wildtype CUUG tetraloop.3.3 Overall delocalized motion analysis of MicroROSE thermometer
To identify the most significant conformational degrees of freedom of a system, trajectories of all four systems were analyzed using principal component analysis. PCA describes the overall dynamics of the systems and highlight the essential motion at the three temperatures (Fig. 4). The least squares method was used to fit the average structure to its initial configuration as a reference structure. Each eigenvector defined the direction of motion of N atoms as an oscillation about the average structure. The normalized magnitude of the corresponding eigenvalue is a measure of the amplitudes of motion along the eigenvector. PCA1, PCA2 and PCA3 describe the global rotational motions of the system. PCA1 and PCA3 describe the highest and lowest rotational dynamics of the system respectively. We calculated the principal components at 350 K as well as for 400 K. Comparing results of both temperatures revealed that, residues 11–20 involved in forming hairpin and terminal bases showed higher dynamic fluctuations relative to the stem during simulation at both temperatures. Mutated MicroROSE systems showed larger Å2 fluctuations, increasing to more than 16 Å at 350 K and 18 Å at 400 K respectively. An exception was observed for ΔG10 MicroROSE where square fluctuation values were even less than 4 Å2 at both temperatures, indicating that removal of the bulge stabilized the structure and reduced its ability to unfold. To find out the atomistic basis of such exceptional stability we next monitored the dynamics of the structural glues of the RNA helix, the canonical Watson–Crick as well as non-canonical hydrogen bonded base-pairs around the SD region.35 Further, we calculated the residue-wise native contact map for all four systems at three different temperatures to make PCA analysis more stringent (Fig. S3–S5†). Calculated matrices of native contacts (with distance cut off 3 Å) were normalized by the total number of frames. The contact map analysis revealed that the residues 15–25 opposite to the conserved stretch were not in native contacts (≤12–14 Å) to each other at higher temperature due to its partial unfolding, except for the ΔG10 system. To analyze this correlated and non-correlated motion more carefully, we calculated total delocalized motion over each residue of the MicroROSE molecule with the help of principle component analysis.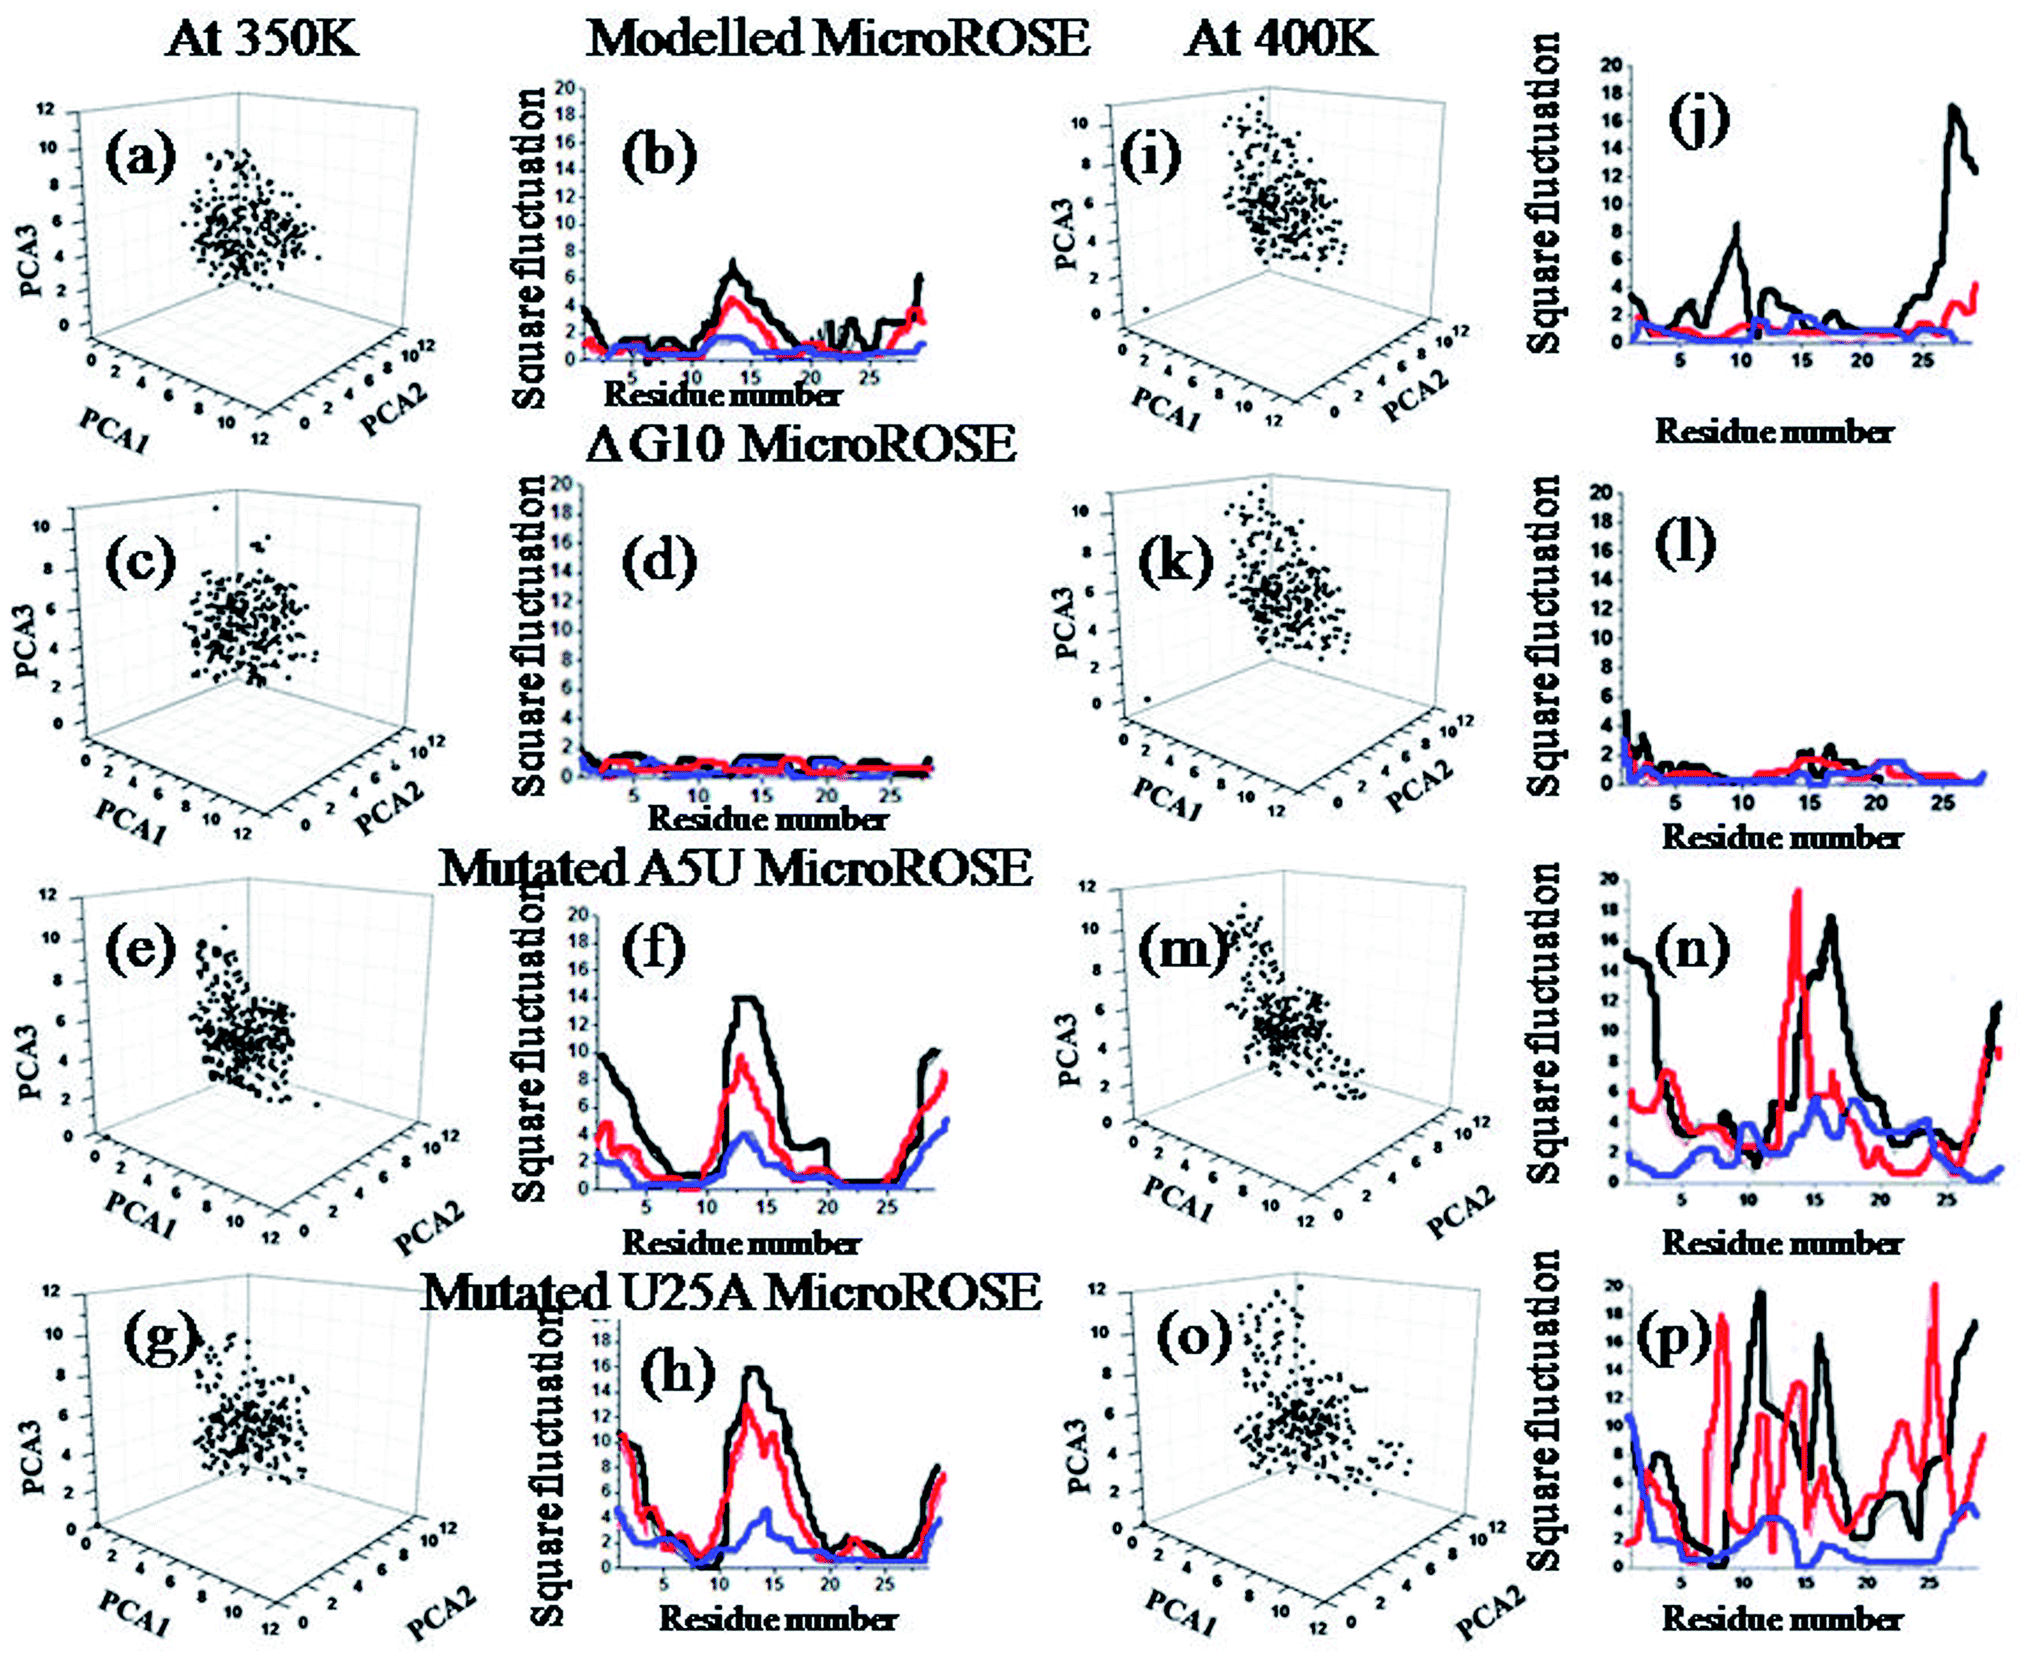 | ||
| Fig. 4 Principal component analysis for the four systems (a) modelled MicroROSE at 350 K (b) three modes of PC1 for the same system at 350 K (c) modelled MicroROSE at 400 K (d) three modes of PC1 for the same system at 400 K (e) ΔG10 MicroROSE at 350 K, (f) three modes of PC1 for the same system 350 K, (g) ΔG10 MicroROSE at 400 K, (h) three modes of PC1 for the same system 400 K, (i) mutated A5U MicroROSE at 350 K, (j) three modes of PC1 for the same system at 350 K, (k) mutated A5U MicroROSE at 400 K, (l) three modes of PC1 for the same system at 400 K, (m) mutated U25A MicroROSE at 350 K (n) three modes of PC1 for the same system at 350 K (o) mutated U25A MicroROSE at 400 K and (p) three modes of PC1 for the same system at 400 K. | ||
3.4 Dynamics of canonical and non-canonical hydrogen bonds adjacent to SD and internal loop which are affected by mutations and temperatures
In this study, we first explored the lifetime dynamics of canonical and non-canonical hydrogen bonds (Fig. 5–7) that have been suggested by earlier NMR studies as integral to RNA thermometer activity. In the modelled MicroROSE, two canonical hydrogen bonds U9:O4–A22:H61 and U9:H3–A22:N1 were stable up to 200 ns at 315 K but at 350 K, these hydrogen bonds were disrupted after 150 ns and fully broken before 100 ns at 400 K. Four non-canonical hydrogen bonds between G10–G21 and U6–U24 (viz. G10:O6–G21:H1, G10:N7–G21:H21, U6:H3–U24:O4 and U6:O2–U24:H3) remained stable up to 150 and 100 ns respectively, during simulation at 315 K. At higher temperatures, there was a decrease in lifetime existence of non-canonical hydrogen bonds U6:H3–U24:O4 and U6:O2–U24:H3, which were disrupted during the initial 50 ns, indicating destabilization of the central part at these temperatures. On the other hand, most of the canonical and non-canonical hydrogen bonds stabilizing the ΔG10 system persisted beyond 100 ns at all temperatures except for C7:H41–U22:O4 and C7:H3–U22:H3. Two canonical hydrogen bonds around SD region U8:O4–A22:H6 and U8:H3–A22:N1 were stable up to 200 ns for both 315 K and 350 K temperatures. At higher temperature of 400 K, both canonical bonds were destroyed just before 150 ns. Longer persistence of structurally important hydrogen bonds within the ΔG10 system indicated a stable helical structure, therefore preventing access of the translation machinery to the SD region at all three temperatures. The presence of G10–G21 H-bond pair in the modelled system introduced an asymmetry that relatively decreased the strength of the hydrogen-bond network in the neighbouring stem. The four structurally crucial hydrogen bonds showed very transient lifetime in both mutated systems. Most of them were broken within 50 ns, with only two hydrogen bonds between U6:H3–U24:O4 and U6:O2–U24:H3 being retained for more than 100 ns at 315 K. In both mutated systems two canonical hydrogen bonds U8:O4–A21:H6 and U8:H3–A21:N1 were present up to 200 ns at 315 K but at 350 K were disrupted at 150 ns. At 400 K, it was broken at 50 ns and before 50 ns for A5U and U25A mutated systems respectively. Thus, even single mutations in the stem, far from the SD region, destabilized the RNA helix due to mismatched base pairs. Another important structural feature is the small internal loop involving C7, U8 and U23, where C7 and U8 stack on each other and both interacted with U23. This played an important role in maintaining long-range tertiary contacts in the three-dimensional folded structure of RNA. The internal loop was stabilized by weak and transient hydrogen bonds between C7:H41–U23:O4, U8:H3–U23:O2 and U8:O4–U23:H3. Initially at 315 K, it was more than 150 ns for modelled and mutated A5U systems and less than 150 ns for mutated U25A system. But at higher temperature hydrogen bonds were retained up to 50 ns for modelled and mutated A5U systems and retained up to 25 ns for mutated U25A system.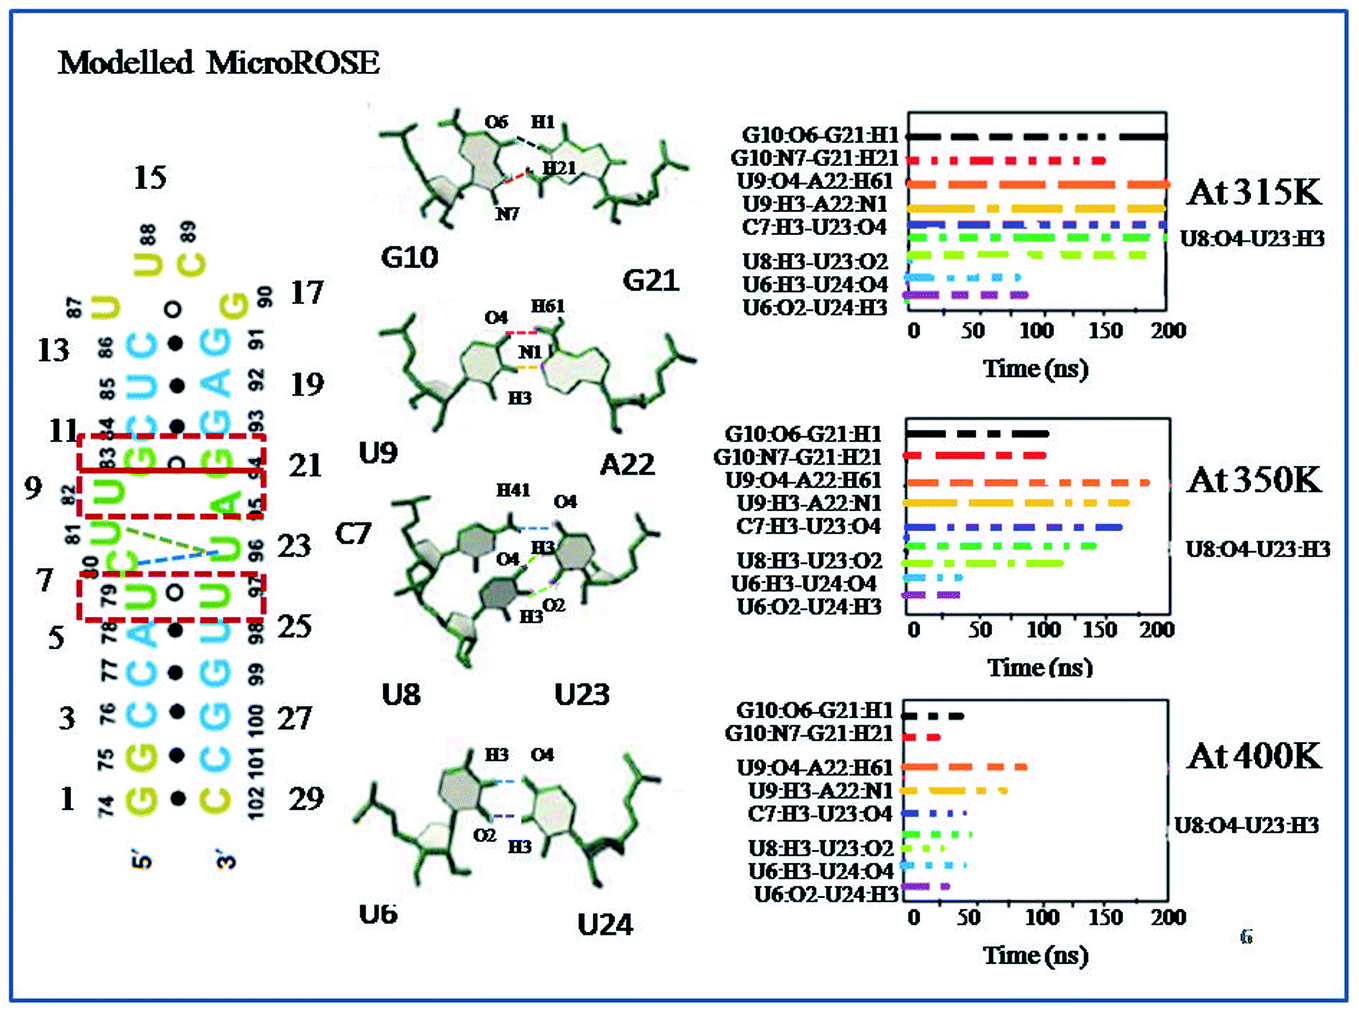 | ||
| Fig. 5 Lifetime occurrence of canonical (U9–A22) and non-canonical hydrogen bonds (G10–G21, C7, C8–U23 and U6–U24) around SD region for modelled MicroROSE system are plotted against time at three different temperatures (315 K, 350 K and 400 K). The colored dotted lines in the left-hand side schematic representation are indicated the corresponding hydrogen bonds between G10–G21, U9–A22, C7, C8–U23 and U6–U24. | ||
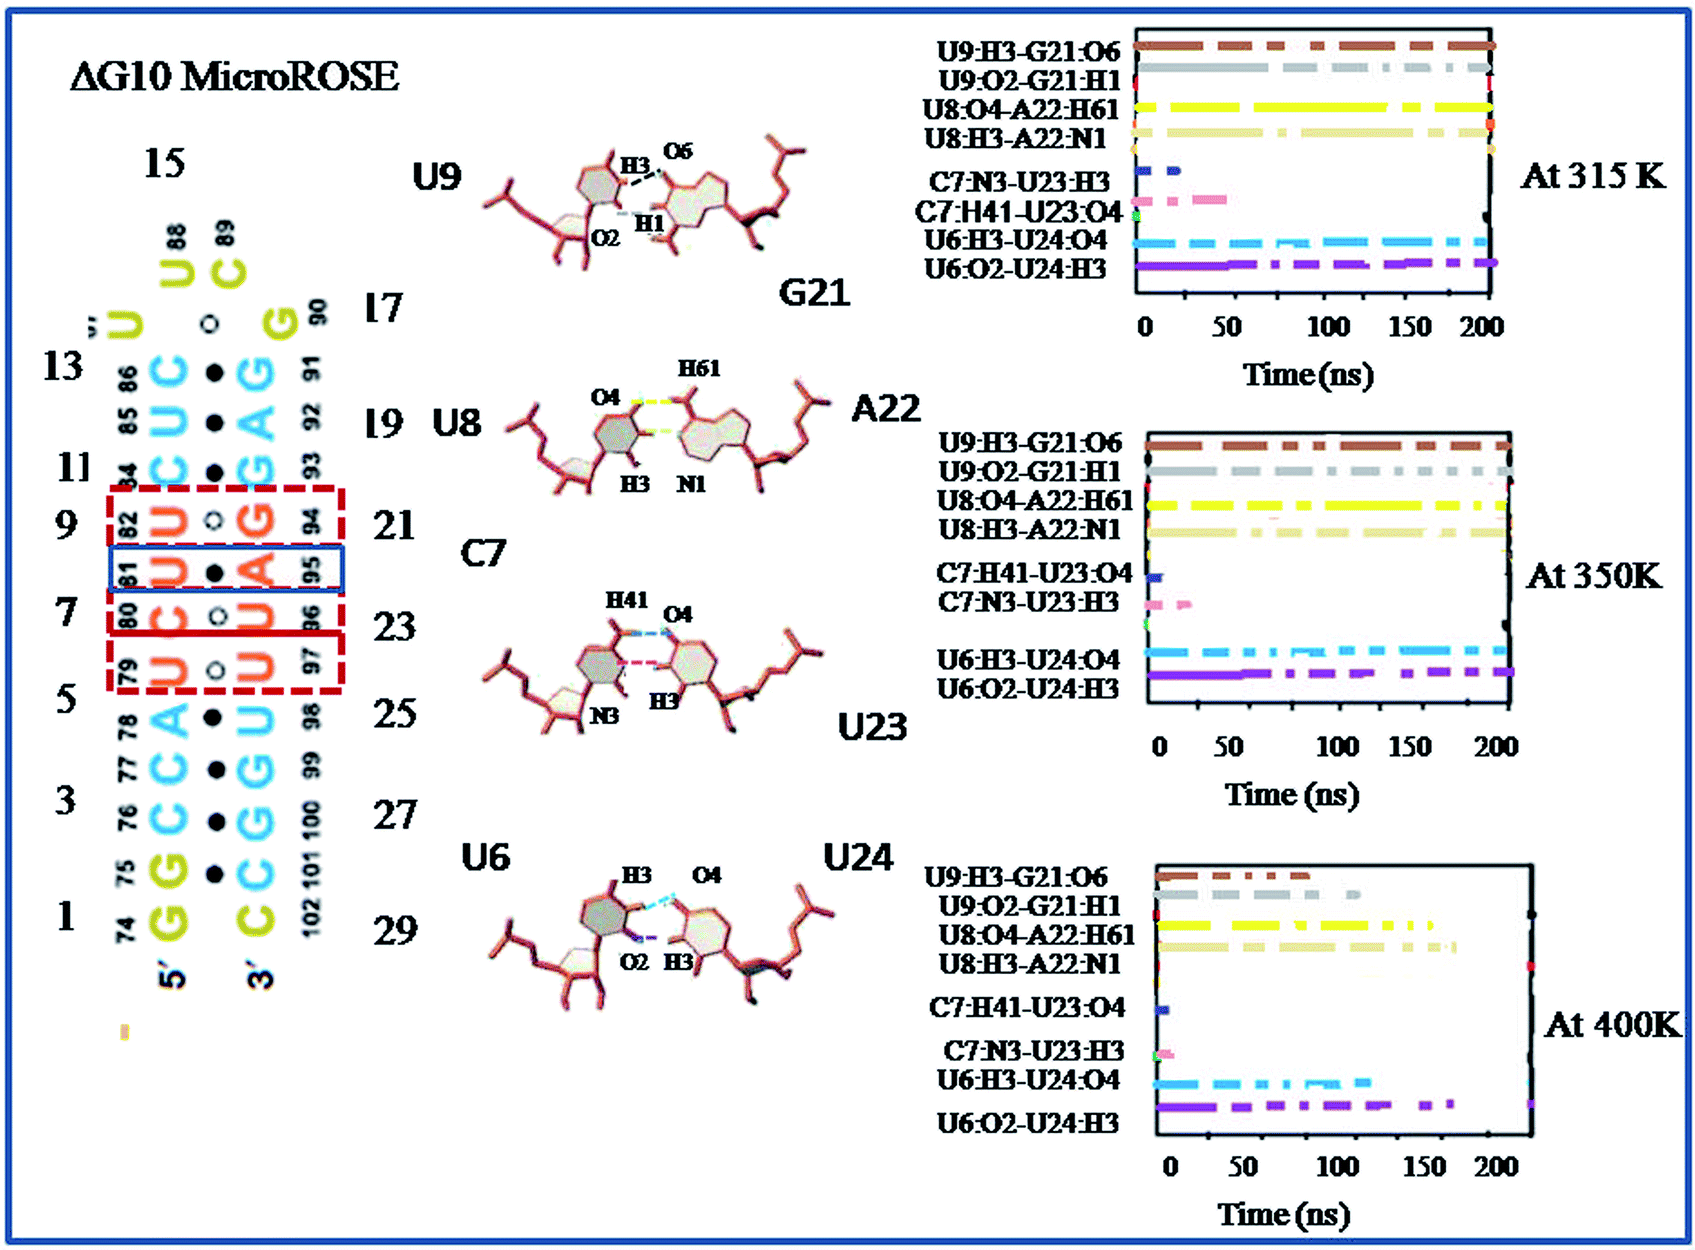 | ||
| Fig. 6 Lifetime occurrence of canonical (U8–A21) and non-canonical hydrogen bonds (U9–G20, C7–U22 and U6–U23) around SD region for ΔG10 MicroROSE system are plotted with time at three different temperatures (315 K, 350 K and 400 K). The colored dotted lines in the left-hand side schematic representation are indicated the corresponding hydrogen bonds between U9–G20, U8–A21, C7–U22 and U6–U23. | ||
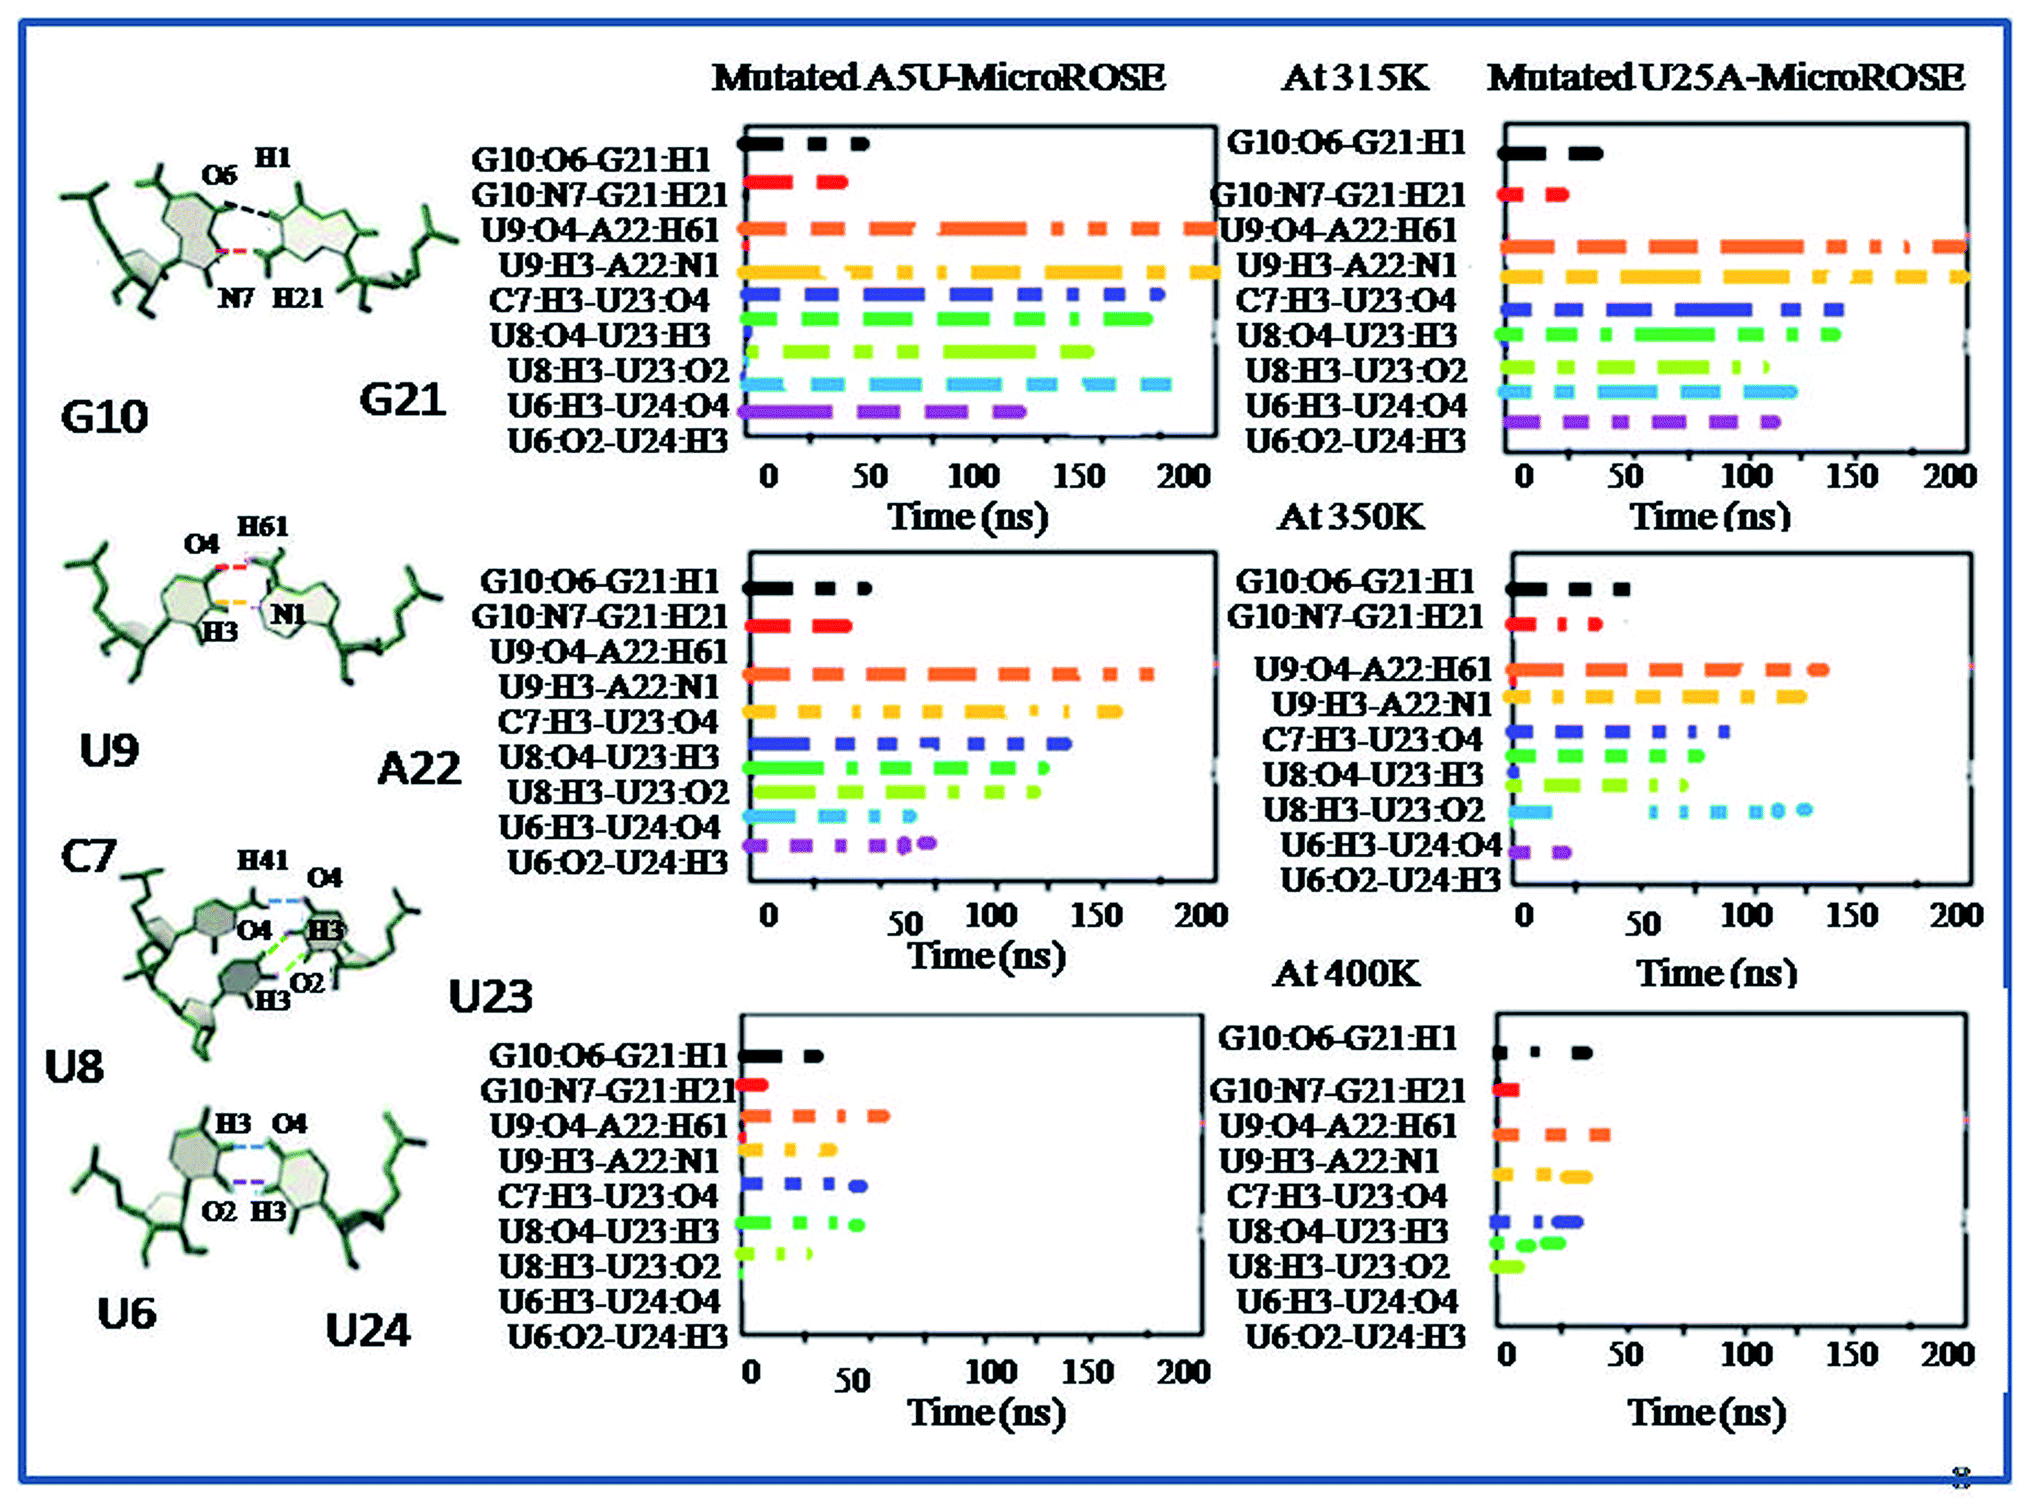 | ||
| Fig. 7 Lifetime occurrence of canonical (U9–A22) and non-canonical hydrogen bonds (G10–G21, C7, C8–U23 and U6–U24) around SD region for mutated A5U and U25A MicroROSE system are plotted with time at three different temperatures (315 K, 350 K and 400 K). The colored dotted lines in the left-hand side schematic representation are indicated the corresponding hydrogen bonds between G10–G21, U9–A22, C7, C8–U23 and U6–U24. | ||
3.5 Comparison of base-stacking energy within stacked base pairs of different MicroROSE thermometer systems
The architecture of nucleic acids (NA) depends upon on several important factors.48 (i) Hydrogen bonding between the nucleic acid bases and (ii) the stacking interactions between the nucleic acid bases and (iii) interactions between charged phosphate groups and the neutralizing cations and the water molecules. The effect of mismatch in base pairs was accompanied by changes in stacking energy within the RNA helix.It was seen that higher temperature induced partial unfolding of RNA helix started opposite to the Shine–Dalgarno (SD) sequences. Therefore, we calculated and compared the stacking energies of the helical stem and SD embedded region of RNA helix for the last 25 ns of simulation (Fig. 8). First four base pair steps constitute the stem part of the RNA helix (ESI Table ST1†) and next three/four base pair steps represented for the SD associated part stacking energy. Details in ESI Tables T2–T5.† The GC/GC base pair step within the RNA stem showed the highest stacking energy at 315 K temperature due to effect of van der Waals (overlap) stabilization energy while UA/UG, CG/UA and UA/CG within SD embedded region showed lowest stacking energy due to less overlap. Thus, the results indicated that discrepancy arises very likely from differences in structure within each RNA helix system at the different temperatures. For the modelled system, there was a noticeable change in the stacking energy with the temperature change (lower to higher). Stacking energies within SD embedded region were highly affected and changed from −12.15 kcal mol−1 to −8.16 kcal mol−1. For the ΔG10 system stacking energy did not change very much upon increase in temperature from 350 K to 400 K, as compared to the other three systems. It was observed that the average stacking energies changed from −12.33 kcal mol−1 to −9.88 kcal mol−1 for SD associated region. These small differences in stacking energy once again confirmed that the deleted bulge opposite to the SD region provided the RNA helix more symmetry and stabilized it by higher overlap of bases.
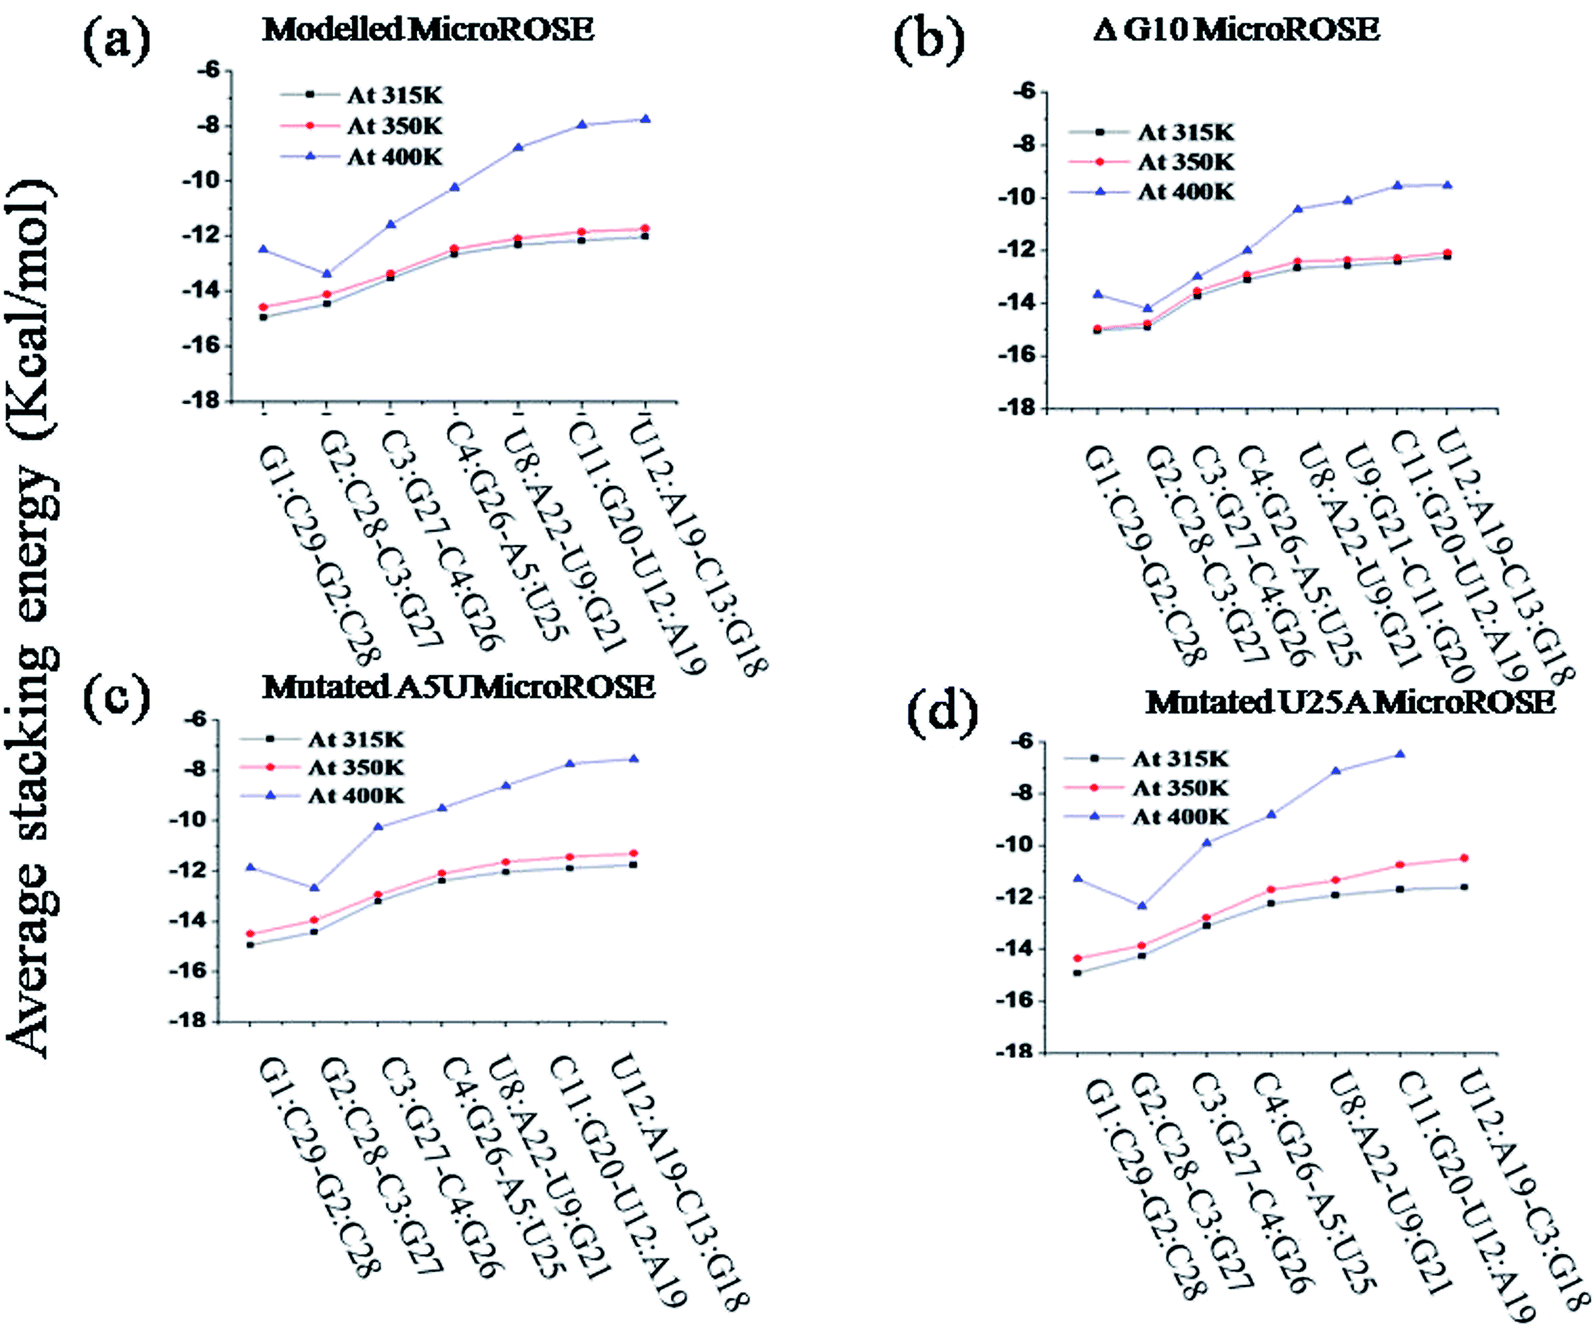 | ||
| Fig. 8 Calculation of average stacking energy of the consecutive stacked base pairs for the four simulated systems at three temperatures (315 K, 350 K and 400 K) for last 50 ns of simulation (a) modelled MicroROSE (b) ΔG10 MicroROSE (c) mutated A5U MicroROSE and (d) mutated U25A MicroROSE. | ||
Interestingly, for both mutated systems, stacking energies near SD changed significantly with temperature. For the mutated A5U system, average stacking energies for SD associated region was −11.88 kcal mol−1 initially (at 315 K) but with an increase in temperature (at 400 K), the average stacking energies dramatically reduced to −7.96 kcal mol−1. The mutated system U25A showed lowest stacking energies at higher temperatures, −6.57 kcal mol−1 for the SD region. Again, these findings raised an open question that why single mutated U25A system showed relatively less stacking energy compared to another single mutated (just opposite site on stem) A5U system, though the proper reason behind it still not understood clearly. Results from stacking energy of mutated systems indicated A to U single mutation on the stem part of the RNA helix induced a long-range effect. Mutation affected the difference in stacking energy in SD associated region which is quite distant from the mutation site.
3.6 Analysis of the fluctuations in the ‘dinucleotide step parameters’-shift, slide, rise, tilt, roll and twist adjacent to the mutations sites to understand the difference in stability: how significant are they?
The shift, slide, rise, tilt, roll and twist have recently been described as ‘Fundamental Parameters’ which determine the double helical structure of nucleic acids.49 To investigate the proper reason that why U to A single mutation provided lesser stability to the RNA helix, we calculated the six base pair step parameters (shift, slide, rise, tilt, roll and twist) adjacent to the mutation sites between the two mutated systems and compared with the modelled MicroROSE system. We further calculated the six intra base pair parameters for bases constituting the C4:G26–A5:U25, C4:G26–U5:U25 and C4:G26–A5:A25 base pairs step for modelled MicroROSE and both mutated MicroROSE systems respectively throughout the trajectory. The trajectories have been plotted across the full 200 ns of simulations, for all three temperatures and data analyzed using NASTRUCT module of Amber. Trajectory of the six inter-base pair step parameters and the six intra base pair parameters shown in (Fig. S6–S8†) clearly indicate that mutated A5U MicroROSE system has almost similar base pair step parameters as the modelled MicroROSE system at 315 K and 350 K. On the other hand, slide, tilt, and roll parameters for mutated U25A MicroROSE show larger deviations from the other two systems for the corresponding base pair step. Previously discussed stacking energy also supported the same result as the stacking energy differences for the corresponding base-pair steps are −0.82 kcal mol−1 between the modelled and mutated A5U systems and −0.97 kcal mol−1 between mutated A5U and U25A MicroROSE at 315 K. Similar results were found at 350 K temperature. ESI Tables ST3–ST5† indicate that both van der Waals and electrostatic energy components are responsible for the stacking energy differences at that temperature. At 400 K, all base pair step parameters as well as intra base pair parameters for the three systems deviated significantly from the standard values as base pair stacking within stem part was lost within 25 ns of starting simulation. The stem base pairs opening also confirmed the zipper-like mechanism of RNA thermometer at higher temperature.6 Significantly larger values of rise (5 to 9 Å), stagger (−30 to 30 Å) and opening angle (40° to 60°) clearly point towards unstacking phenomenon at 400 K. U or A single mutation on RNA stem also induced significant long-range stacking energy differences in SD embedded stacked base pairs. Inter base pair step parameters of each stacked base pair in SD region for mutated MicroROSEs showed significantly higher deviations in slide, rise and twist parameters than modelled and ΔG10 system at higher temperature. Stacked base pairs (U8:A21–U9:G20) in SD region started to unpair within 25 ns of starting simulation whereas for ΔG10 system (U8:A21–U9:G20) they are retained till about was 175 ns (Fig. S9†). Fluctuations with higher standard deviations in roll, rise and twist parameters indicate that these are the major movements for initiating partial unfolding. Main origin of stacking energy difference in both mutated systems was due to differences in van der Waals interactions between adjacent base pairs. U5:U25 and U6:U24 within the A5U MicroROSE, whereas A5:A25 base pairs interacted with adjacent U6:U24 within the U25A MicroROSE system. van der Waals interaction energy between two adjacent U5:U25–U6:U24 base pairs was more negative in mutated A5U system than A5:A25–U6:U24 base pairs in mutated U25A.3.7 Partial unfolding mechanism of MicroROSE thermometer
At lower temperatures, local structural change seems sufficient to act as thermometer as only the regulatory hairpin is loosened up, not the whole RNA, which is in good agreement with available data from 2D NOESY NMR.35 Interestingly, at the higher temperature our atomistic simulations capture the dynamical aspects of RNA helix reasonably well, showing that it undergoes partial unfolding of hairpin as well as SD associated region and stem part. The largest discrepancy between the simulation results and experimental report is seen at the higher temperature. Here the three important Watson–Crick hydrogen bonds within hairpin C13–G18, U12–19A and C11–G20 were broken within first 25 ns of the simulation, leading to a less compact structure that then proceeded to partial unfold. However, the Watson–Crick hydrogen bonds were retained up to 150 ns for the ΔG10 system (Fig. S10†). We further investigated the dynamics of non-canonical base pairs adjacent to SD as approximately 32.7% base pairs in the functional RNA structures are non-canonical50 and often play a prominent role in maintaining their structural and functional diversity. During the high temperature simulation, just after destabilization of the Watson–Crick hydrogen bonds, two structurally important non-canonical hydrogen bonds, U6–U24 and G10–G21 adjacent to SD, become weaker after 25 ns of the simulation (Fig. 6). These results indicated that destabilization of the modelled MicroROSE at higher temperature was initiated at the U6 to U10 and G21 to U24 regions. Exception was observed for the ΔG10 system, where same non-canonical base pairs were broken after 50 ns (Fig. S8†). For the mutated systems, there was transient existence of G10:O6–G21:H1 and G10:N7–G21:H21 non-Watson–Crick hydrogen bonds up to 20 ns. On the other hand, the U6:H3–U24:O4 and U6:O2–U24:H3 hydrogen bonds were completely absent after 5 ns of the 400 K simulation (Fig. 7). Inspite of the presence of G21–G10 base pair, helical stacking was observed for the entire stem. U6 and U24 formed a base-pair as seen in the ΔG10 MicroROSE RNA; while A22 formed a canonical base pair with U9, although previously no imino protons were observed experimentally in NMR studies.4. Conclusion
The results from our silico studies reveal several important factors. The most important observation from our silico study is that there are no distinct conformational changes at the physiologically relevant temperature window, but subtle changes of MicroROSE are sufficient for thermo-sensing activity while at higher temperature partial unfolding is observed from hairpin (UUCG tetraloop) to SD embedded small internal loop region.It is also seen that, the central part of the MicroROSE RNA (U6–G10 and G21–U24) is more thermo labile than the rest of the molecule. Most interesting observation from our simulation is that the structural basis of the thermo sensing lies in a network of weak hydrogen bonds in the internal loop created by the presence of the non-canonical hydrogen bonded G10–G21 and U6–U24 base pairs. Bulged portion (G10 residue), opposite to the SD region contributes significantly role towards unfolding. Deletion of G10 imparts stability to the RNA helix that loses its thermosensing ability even at 400 K. Our in silico results support the earlier NMR study done by Narberhaus group on MicroROSE.6,35 The temperature profiles of the previous experimental study on MicroROSE RNA had showed that the U6, U24 and G21 imino protons were present at 315 K in the ΔG10 RNA, whereas in the modelled RNA, all the imino protons of the internal loop (U6, U24 and G21) were absent at the same temperature. These NMR results indicated that destabilization of the modelled MicroROSE upon temperature increase initiates in the region composing U6–G10 and G21–U24, and that this takes place at lower temperature than in the ΔG10 RNA. In order to validate the above experimental results, we have first calculated the lifetime of all canonical and non-canonical hydrogen bonds which play significant roles towards unfolding. In case of modelled MicroROSE hydrogen bonds between G10 and G21 remain stay more than 150 ns and another hydrogen bonds between U6 and U24 stay up to 100 ns. But one important observation is that for ΔG10 system this four non-canonical hydrogen bonds retain throughout the simulation time (200 ns).
Another finding of this study is that the presence of a region containing a small internal loop (C7, U8, U23) with a transient hydrogen bonding network along with two noncanonical closing base pairs such as U6–U24 and G10–G21.
In conclusion, MicroROSE has a stable helical structure at low temperature that prevents access of the translation machinery to the SD, but upon increase in temperature the conserved region opposite to SD as well as weak non-canonical hydrogen bonds network adjacent SD and internal loop have started to break. As a result, partial unfolding of RNA helix is observed from that region. Absence of G10–G21 base pair in ΔG10 MicroROSE system possibly introduce less asymmetry in the SD and exhibit higher stability towards temperature. Thus, our novel atomistic simulations are possibly able to explain the mechanism of action of RNA thermometer towards temperature sensitivity. This helps us to gain insights into the extent of their structural variation and thus assists in understanding specific role towards structural and functional diversity.
Though the mechanism of long-range mutation effect is not understood clearly, it is apparent that mutations in the RNA stem destabilize the structure leading to partial unfolding of the functional hairpin of the RNA thermometer at higher temperature. Irregular base stacking coupled with a network of weak hydrogen bonds facilitates liberation of the SD sequence in the physiological temperature range. It has been observed that the SD sequence is important for translation initiation to meet the conformational demands required by the mRNA site interaction. Thus, bacterial RNA thermometers detect temperature changes by a simple and efficient mechanism that appears sufficient to control the gene expression of several heat-shock genes. It will also be interesting to discover whether the regulatory capacity of RNA thermometers extends beyond translational control. Overall, the results of the present study help to elucidate structural details regarding the concept of temperature dependent gene regulation by RNA sensors.
Conflicts of interest
Authors declare no conflict of interests.Acknowledgements
M. B. is grateful to Indian National Science Academy for Senior Scientist fellowship and support from MEITY under National Super Computing Mission programme (CORP: DG: 3191). S. H. acknowledges University Grant Commission, Dr D. S. Kothari Postdoctoral Fellowship, Government of India, for fellowship. The work was carried out at DBT funded computational facility at MBU.References
- M. M. Meyer, Wiley Interdiscip. Rev.: RNA, 2017, 8, e1370 Search PubMed.
- S. Narayan, M. H. Kombrabail, S. Das and H. Singh, Nucleic Acids Res., 2015, 43, 493–503 CrossRef CAS PubMed.
- J. A. Guijarro, D. Cascales, A. I. García-Torrico, M. García-Domínguez and J. Méndez, Front. Microbiol., 2015, 6, 700 Search PubMed.
- P. Kaur and A. A. A. Asea, Chaperokine Activity of Heat Shock Proteins, Springer, 2019, vol. 16, pp. 3–22 Search PubMed.
- S. Phadtare and K. Severinov, RNA Biol., 2010, 7, 788–795 CrossRef CAS PubMed.
- S. Chowdhury, C. Maris, F. Allain and F. Narberhaus, EMBO J., 2006, 25, 2487–2497 CrossRef CAS PubMed.
- X. Nou and R. J. Kadner, Proc. Natl. Acad. Sci. U. S. A., 2000, 97, 7190–7195 CrossRef CAS PubMed.
- A. Nahvi, N. Sudarsan, M. S. Ebert, X. Zou, K. L. Brown and R. Breaker, Chem. Biol., 2002, 9, 1043–1049 CrossRef CAS PubMed.
- W. C. Winkler, S. Cohen-Chalamish and R. R. Breaker, Proc. Natl. Acad. Sci. U. S. A., 2002, 99, 1590–15913 Search PubMed.
- J. Rinnenthal, B. Klinkert, F. Narberhaus and H. Schwalbe, Nucleic Acids Res., 2011, 39, 8258–8270 CrossRef CAS PubMed.
- P. Johansson, P. Mandin, A. Renzoni, C. Chiaruttini, M. Springer and P. Cossart, Cell, 2002, 110, 551–556 CrossRef PubMed.
- F. Narberhaus, Microbiol. Mol. Biol. Rev., 2002, 66, 64–93 CrossRef CAS PubMed.
- W. Winkler, A. Nahvi and R. R. Breaker, Nature, 2002, 419, 952–956 CrossRef CAS PubMed.
- F. J. Grundy and T. M. Henkin, Curr. Opin. Microbiol., 2004, 7, 126–131 CrossRef CAS PubMed.
- M. Mandal, M. Lee, J. E. Barrick, Z. Weinberg, G. M. Emilsson, W. L. Ruzzo and R. R. Breaker, Science, 2004, 306, 275–279 CrossRef CAS PubMed.
- E. Nudler and A. S. Mironov, Trends Biochem. Sci., 2004, 29, 11–17 CrossRef CAS PubMed.
- J. K. Soukup and G. A. Soukup, Curr. Opin. Struct. Biol., 2004, 14, 344–349 CrossRef CAS PubMed.
- A. G. Vitreschak, D. A. Rodionov, A. A. Mironov and M. S. Gelfand, Trends Genet., 2004, 20, 44–50 CrossRef CAS PubMed.
- H. Barnawi, N. Marri, B. AI-Lawati, N. Hussain, B. Lawati, E. Mayasari, A. Gulbicka, A. J. Jervis, M.-H. Huang, J. S. Carvet and D. Linton, PLoS Pathog., 2020, 16, e1009008 CrossRef CAS PubMed.
- A. E. Garcia and D. Paschek, J. Am. Chem. Soc., 2008, 130, 815–817 CrossRef CAS PubMed.
- C. Hyeon and D. Thirumalai, Proc. Natl. Acad. Sci. U. S. A., 2005, 102, 6789–6794 CrossRef CAS PubMed.
- N. J. Deng and P. Cieplak, Biophys. J., 2010, 98, 627–636 CrossRef CAS PubMed.
- E. J. Sorin, M. A. Engelhardt, D. Herschlag and V. S. Pande, J. Mol. Biol., 2002, 317, 493–505 CrossRef CAS PubMed.
- K. Sarkar, D. A. Nguyen and M. Gruebele, RNA, 2010, 16, 2427–2434 CrossRef CAS PubMed.
- K. Csaszar, N. Spackova, R. Stefl, J. Sponer and N. B. Leontis, J. Mol. Biol., 2001, 313, 1073–1091 CrossRef CAS PubMed.
- Y. Zhang, J. Zhang and W. Wang, J. Am. Chem. Soc., 2011, 133, 6882–6885 CrossRef CAS PubMed.
- Z. Gong, Y. Zhao, C. Chen and Y. Xiao, PLoS One, 2012, 7, e45239 CrossRef CAS PubMed.
- T. Waldminghaus, N. Heidrich, S. Brantl and F. Narberhaus, Mol. Microbiol., 2007, 65, 413–424 CrossRef CAS PubMed.
- S. Altuvia, D. Kornitzer, D. Teff and A. B. Oppenheim, J. Mol. Biol., 1989, 210, 265–280 CrossRef CAS PubMed.
- M. T. Morita, Y. Tanaka, T. S. Kodama, Y. Kyogoku, H. Yanagi and T. Yura, Genes Dev., 1999, 13, 655–665 CrossRef CAS PubMed.
- K. Yamanaka, M. Mitta and M. Inouye, J. Bacteriol., 1999, 181, 6284–6291 CrossRef CAS PubMed.
- A. Nocker, T. Hausherr, S. Balsiger, N. P. Krstulovic, H. Hennecke and F. Narberhaus, Nucleic Acids Res., 2001, 29, 4800–4807 CrossRef CAS PubMed.
- J. Johansson, P. Mandin, A. Renzoni, C. Chiaruttini, M. Springer and P. Cossart, Cell, 2002, 110, 551–561 CrossRef PubMed.
- J. Kortmann and F. Narberhaus, Nat. Rev. Microbiol., 2012, 10, 255–265 CrossRef CAS PubMed.
- S. Chowdhury, C. Ragaz, E. Kreuger and F. Narberhaus, J. Biol. Chem., 2003, 278, 47915–47921 CrossRef CAS PubMed.
- X.-J. Lu and W. K. Olson, Nat. Protoc., 2008, 3, 1213–1227 CrossRef CAS PubMed.
- D. A. Pearlman, D. A. Case, J. W. Caldwell, W. S. Ross, T. E. Cheatham III, S. DeBolt, D. Ferguson, G. Seibel and P. Kollman, Comput. Phys. Commun., 1995, 91, 1–41 CrossRef CAS.
- I. Beššeová, M. Otyepka, K. Réblová and J. Šponer, Phys. Chem. Chem. Phys., 2009, 11, 10701–10711 RSC.
- I. Yildirim, H. A. Stern, S. D. Kennedy, J. D. Tubbs and D. H. Turner, J. Chem. Theory Comput., 2010, 6, 1520–1531 CrossRef CAS PubMed.
- A. A. Chen and A. E. García, Proc. Natl. Acad. Sci. U. S. A., 2013, 110, 16820–16825 CrossRef CAS PubMed.
- M. Zgarbova, M. S. Otyepka, J. Poner, A. Mladek, P. Banáš, T. E. Cheatham and P. Jurecka, J. Chem. Theory Comput., 2011, 7, 2886–2902 CrossRef CAS PubMed.
- I. S. Joung and T. E. Cheatham, J. Phys. Chem. B, 2008, 112, 9020 CrossRef CAS PubMed.
- P. Mark and L. Nilsson, J. Phys. Chem. A, 2001, 105, 9954–9960 CrossRef CAS.
- Y. Hashem and P. Auffinger, Method, 2009, 47, 187–197 CrossRef CAS PubMed.
- H. J. C. Berendsen, J. P. M. Postma, W. F. van Gunsteren, A. DiNola and J. R. Haak, J. Chem. Phys., 1984, 81, 3684–3690 CrossRef CAS.
- T. Darden, D. York and L. G. Pedersen, J. Chem. Phys., 1993, 98, 10089–10092 CrossRef CAS.
- W. Humphrey, A. Dalke and K. Schulten, J. Mol. Graph., 1996, 14, 33–38 CrossRef CAS PubMed.
- J. Sponer, J. Leszczynski and P. Hobza, Biopolymers, 2002, 61, 3–31 CrossRef CAS.
- A. Gorin, V. B. Zhurkin and W. K. Olson, J. Mol. Biol., 1995, 247, 34–48 CrossRef CAS PubMed.
- S. Mukherjee, M. Bansal and D. Bhattacharyya, J. Comput. Aided Mol. Des., 2006, 20, 629–645 CrossRef CAS PubMed.
Footnote |
| † Electronic supplementary information (ESI) available. See https://doi.org/10.1039/d2ra00169a |
| This journal is © The Royal Society of Chemistry 2022 |