
 Open Access Article
 This Open Access Article is licensed under a Creative Commons Attribution-Non Commercial 3.0 Unported Licence
Pairing nanoarchitectonics of oligodeoxyribonucleotides with complex diversity: concatemers and self-limited complexes†
Anastasia A. Zamoskovtseva‡
*ab,
Victor M. Golyshev‡ a,
Valeria A. Kizilova‡a,
Georgiy Yu. Sheveleva,
Dmitrii V. Pyshnyia and
Alexander A. Lomzova
a,
Valeria A. Kizilova‡a,
Georgiy Yu. Sheveleva,
Dmitrii V. Pyshnyia and
Alexander A. Lomzova
aInstitute of Chemical Biology and Fundamental Medicine, SB RAS, 8 Lavrentiev Avenue, Novosibirsk 630090, Russia. E-mail: lomzov@niboch.nsc.ru
bMoscow Institute of Physics and Technology, 9 Institutskiy per., Dolgoprudny, 141701, Russia
First published on 23rd February 2022
Abstract
The development of approaches to the design of two- and three-dimensional self-assembled DNA-based nanostructures with a controlled shape and size is an essential task for applied nanotechnology, therapy, biosensing, and bioimaging. We conducted a comprehensive study on the formation of various complexes from a pair of oligonucleotides with two transposed complementary blocks that can be linked through a nucleotide or non-nucleotide linker. A methodology is proposed to prove the formation of a self-limited complex and to determine its molecularity. It is based on the “opening” of a self-limited complex with an oligonucleotide that effectively binds to a duplex-forming block. The complexes assembled from a pair of oligonucleotides with different block length and different linker sizes and types were investigated by theoretical analysis, several experimental methods (a gel shift assay, atomic force microscopy, and ultraviolet melting analysis), and molecular dynamics simulations. The results showed a variety of complexes formed by only a pair of oligonucleotides. Self-limited associates, concatemer complexes, or mixtures thereof can arise if we change the length of a duplex and loop-forming blocks in oligonucleotides or via introduction of overhangs and chemical modifications. We postulated basic principles of rational design of native self-limited DNA complexes of desired structure, shape, and molecularity. Our foundation makes self-limited complexes useful tools for nanotechnology, biological studies, and therapeutics.
Oligonucleotides are an essential tool for a variety of applications. They can be used in applied nanotechnology, biomedicine (including therapy), biosensors, and bioimaging.1–7 To date, a number of approaches have been devised for the design of two- and three-dimensional DNA-based nanostructures with a controllable shape, size, surface chemistry, and functionality.8–13 Complementary Watson–Crick base pairing is the basis for the development of such structures. A combination of complementary blocks of DNA allows researchers to build nano- and microstructures of diverse geometries and sizes.14–19 There are several approaches to constructing DNA-based self-assembled nanostructures. The most widely used methods are DNA tile, DNA brick, and DNA origami.9,14,16,20
The development of a new methods for the construction of self-associated complexes of predetermined shape is currently the focus of researchers in this field.4–19 It has been found that pairs of oligonucleotides with complementary blocks 1 or 2 form a duplex with complementary overhangs (Fig. 1a). In this way, a number of different complexes can be assembled (Fig. 1a–f).21–23 Native oligonucleotides (M and N) without linkers (Lm or Ln) form long linear concatemer complexes (Fig. 1a and b).24–27 The introduction of nucleotide or non-nucleotide linkers (Lm or Ln) between 22,23,25 or inside28 complementary blocks leads to the formation of bent complexes,29 including self-limited complexes of varied molecularity (Fig. 1b–d). Using three or more oligomers or branched oligonucleotides results in dendrimer complexes employed in hybridization chain reaction.6,30–32
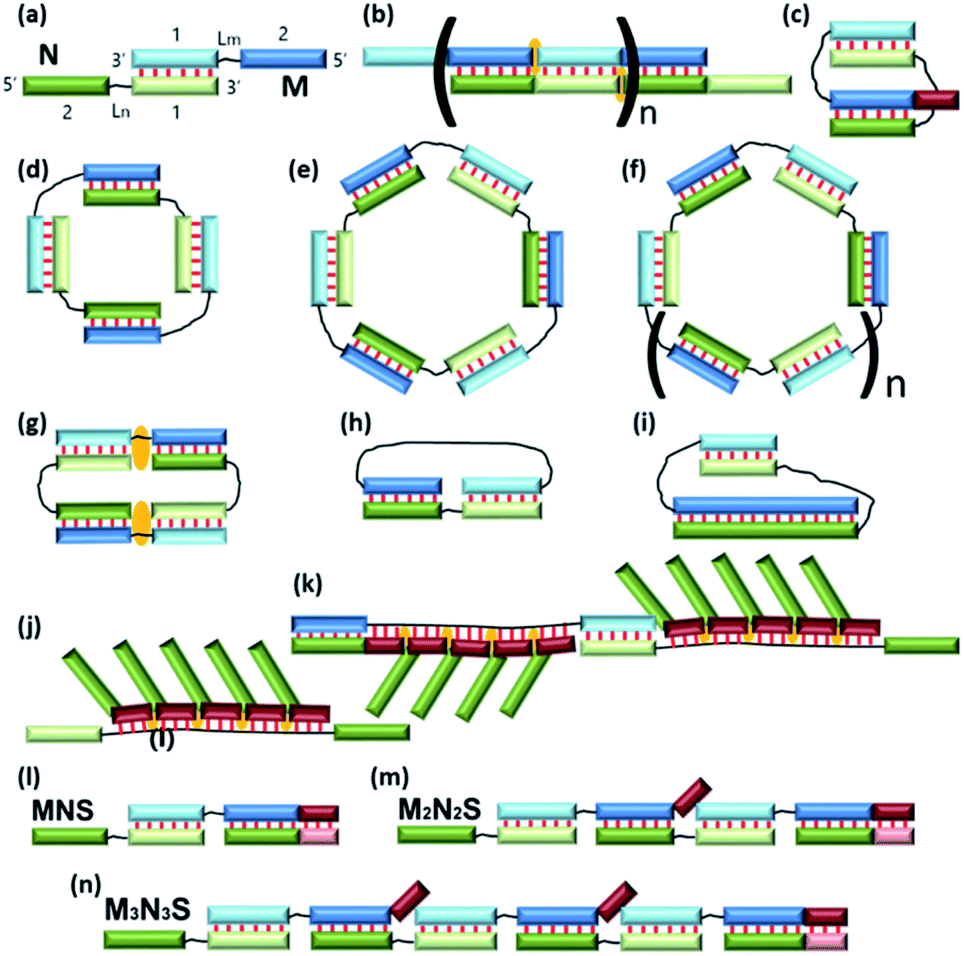 | ||
| Fig. 1 Schematic representation of the complexes presented in the literature (a)–(f) and identified in this work (g)–(n). The block scheme of a complex is shown in panel (a). Oligonucleotides M (blue) and N (green) have complementary blocks 1 and 2 connected via likers (black thin lines) Lm and Ln, respectively. Elongated fragments of oligonucleotides are shown in brown. The orange marks denote coaxial stacking in nicks or gaps. Base pairing is represented as red lines. | ||
Small discrete DNA nanostructures with non-nucleotide modifications have become essential tools of nanotechnology. Various chemical modifications have been devised to build complexes of predetermined sizes and shapes.21,22,28,33,34 It has been demonstrated that DNA complexes free of chemical modifications and containing oligothymidylate linkers between complementary blocks can assemble into self-limited complexes.22 On the one hand, such native complexes of one, two, or more oligonucleotides can be used for building nanoconstructs; on the other hand, an unsuitable type of complex can arise, for example, via hybridization chain reaction.22,35
The size and geometry of a complex formed by a pair of oligonucleotides with two complementary blocks (see Fig. 1a, designated as 1 or 2) depend on a number of structural parameters of the oligonucleotides: the length of each complementary fragment, the length of the linker, its flexibility, and physicochemical properties (e.g., hydrophobicity, the charge, and the ability to coordinate ions). The size and geometry are also influenced by buffering conditions, concentrations of the oligonucleotides, and temperature. All of the above can be consolidated into steric and thermodynamic factors. In addition, kinetics can have a substantial impact on large complexes.
Typically, in an examination of complexes formed by a pair of oligonucleotides, the structure with the highest mobility in a gel shift assay corresponds to dimer formation, i.e., V-shaped structure (Fig. 1c).21,23 The same principle is usually applied to tetra-, hexa-, and higher-order complexes. Molecularity of higher-order structures can be determined by enzymatic ligation/digestion assays.27,36 These techniques can be utilized if proteins can effectively interact with DNA complexes and process them. An obstacle to this approach is the shift of a thermodynamic equilibrium during ligation/digestion and the need for additional confirmation of the results. Methods for the preparation of complexes having defined molecularity and based on native oligonucleotides have not been devised yet.
We analysed the formation of various types of complexes from a pair of oligonucleotides with two transposed complementary blocks (1 and 2) that can be linked through a nucleotide or non-nucleotide linker (Lm and Ln; Fig. 1a). We propose an approach to studying the type and molecularity of the complexes forming. The method is based on the “opening” of self-limited complexes by an oligonucleotide that forms a duplex with block 1 or 2 highly efficiently. We formulated a theoretical model that helps to choose the length and nucleotide sequence of the oligomer-opener. Using the proposed methodology, we confirmed putative molecularity of a number of complexes. We researched the complexes assembled from a pair of oligonucleotides with different block sizes and with different linker sizes and types by gel shift assays, atomic force microscopy (AFM), ultraviolet (UV) melting analysis, and molecular dynamics (MD) simulations. The results revealed a variety of secondary and tertiary DNA structures that can result from two or three oligonucleotides and should lay the foundation for designing self-associating complexes of various sizes and shapes.
Experimental
Oligonucleotide synthesis and purification
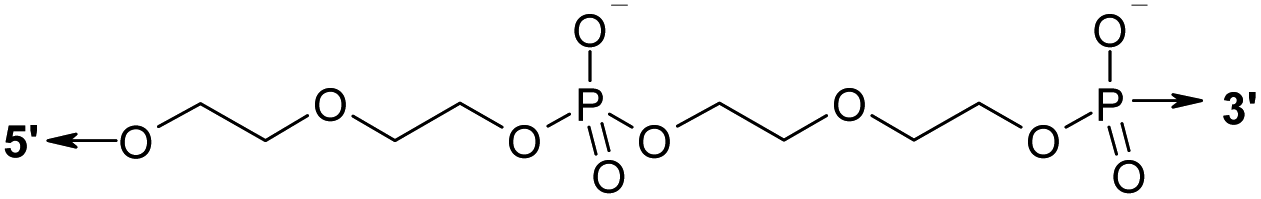
Oligonucleotides were synthesized by the standard β-cyanoethyl phosphoramidite method on an ASM-800 DNA Synthesizer (Biosset, Novosibirsk, Russia) using commercially available phosphoramidite monomers (Glen Research, USA), and phosphoramidites of mono-dimethoxytritylated diethylene glycol obtained as described in ref. 37 and prepared by means of a standard chemical phosphorylation reagent (Glen Research, USA). Oligomers were purified by preparative reversed-phase high-performance liquid chromatography on an Agilent 1100 series chromatograph (Agilent, USA). We used a chromatographic column Eclipse XDB-C18 (4.6 × 150 mm, particle size 5 μm) (Agilent, USA) and elution in a linear gradient of acetonitrile concentration (0–50%) in a solution containing 0.02 mol L−1 triethylammonium acetate for 30 min. The flow rate was 1.5 mL min−1. To increase range of detection the wavelength was selected λ = 280 nm, which is close to the maximum absorption point of DNA. Oligonucleotides were precipitated from an aqueous solution with a 10-fold volume of a 2% LiClO4 solution in acetone. The supernatant was separated by centrifugation (14![[thin space (1/6-em)]](https://www.rsc.org/images/entities/char_2009.gif) 000g), and the precipitate was washed twice with 1 mL of acetone and air-dried. Sequences of the studied oligonucleotides are given in Table 1.
000g), and the precipitate was washed twice with 1 mL of acetone and air-dried. Sequences of the studied oligonucleotides are given in Table 1.
| Code | 1 | 2 | L | Sequence |
|---|---|---|---|---|
| a Table header 1, 2 are lengths (in nt) of duplex forming blocks of oligonucleotides. Column L represents the type and length of linker Lm or Ln. Underlined nucleotides indicate an elongated block.b Symbol D denotes a linker of two covalently bound bis-(diethylene glycol)phosphates.39c T-Fluo is a thymine residue labeled with fluorescein at position C5. Underlined text indicates an s block in lengthened oligonucleotides. | ||||
| M20 | 10 | 10 | — | 5′-CTAACTAACGCCATCATATG-3′ |
| M20D | 10 | 10 | Db | 5′-CTAACTAACG(D)CCATCATATG-3′ |
| M20Tn | 10 | 10 | (dT)n | 5′-CTAACTAACG(T)nCCATCATATG-3′, n = 1, 2, 3, 5, 7, 10, 15, 25 |
| M30 | 15 | 15 | — | 5′-GATATGATGTGTTAGTTAGAGGTCGGTAGC-3′ |
| M30D | 15 | 15 | D | 5′-GATATGATGTGTTAG(D)TTAGAGGTCGGTAGC-3′ |
| M30l | 20 | 15 | — | 5′-![[C with combining low line]](https://www.rsc.org/images/entities/char_0043_0332.gif) ![[A with combining low line]](https://www.rsc.org/images/entities/char_0041_0332.gif) ![[G with combining low line]](https://www.rsc.org/images/entities/char_0047_0332.gif) GATATGATGTGTTAGTTAGAGGTCGGT AGC-3′ GATATGATGTGTTAGTTAGAGGTCGGT AGC-3′ |
| M30Dl | 20 | 15 | D | 5′-GATATGATGTGTTAG(D)TTAGAGG TCGGTAGC-3′ |
| M40 | 15 | 25 | — | 5′-GAGTCTTAGATCGCCCAGTTGACACGT(T-Fluo)GCCCAGTATGCA-3′c |
| N20 | 10 | 10 | — | 5′-CGTTAGTTAGCATATGATGG-3′ |
| N20D | 10 | 10 | D | 5′-CGTTAGTTAG(D)CATATGATGG-3′ |
| N20Tn | 10 | 10 | (dT)n | 5′-CGTTAGTTAG(T)nCATATGATGG-3′, n = 1, 2, 3, 5, 7, 10, 15, 25 |
| N20l | 14 | 10 | — | 5′-![[T with combining low line]](https://www.rsc.org/images/entities/char_0054_0332.gif) CGTTAGTTAGCATATGATGG-3′ CGTTAGTTAGCATATGATGG-3′ |
| N20Dl | 14 | 10 | D | 5′-CGTTAGTTAG(D)CATATGATGG-3′ |
| N30 | 15 | 15 | — | 5′-CTAACACATCATATCGCTACCGACCTCTAA-3′ |
| N30D | 15 | 15 | D | 5′-CTAACACATCATATC(D)GCTACCGACCTCTAA-3′ |
| N40 | 25 | 15 | — | 5′-GGCGATCTAAGACTCTGCATACTGGGCAACG TGTCAACTG-3′ |
| S10 | 10 | — | 5′-CTAACTAACG-3′ | |
| S10A5 | 15 | — | 5′-CTAACTAACG-3′ |
|
| S10l | 14 | — | 5′-CTAACTAACG-3′ |
|
| S15 | 15 | — | 5′-CTAACACATCATATC-3′ | |
| S15-2 | 15 | — | 5′-GCTACCGACCTCTAA-3′ | |
| S15l | 20 | — | 5′-CTAACACATCATATC-3′ |
|
| SX15 | 15 | — | 5′-GGCGATCTAAGACTC-3′ | |
| S25 | 25 | — | 5′-TGCATACTGGGCAACGTGTCAACTG-3′ | |
 |
||||
Oligonucleotide concentration was measured on a UV-2100 UV-Vis spectrophotometer (Shimadzu, Japan) with molar extinction coefficient ε260 for mono- and dinucleotides.38 Extinction coefficients of the D-modified oligonucleotides were calculated as a sum of the respective values of the 3′- and 5′-flanking regions separated by a non-nucleotide linker.37
Gel shift assays
Each assay was run in a 15% polyacrylamide gel (acrylamide with N,N′-methylenebisacrylamide in a 39:1 ratio) in Tris–borate buffer 89 mM tris(hydroxymethyl)aminomethane, 89 mM boric acid, and 15 mM MgCl2 or Mg(CH3COO)2, pH 8.3 at ∼17 V cm−1. Gels were thermostated at 5 °C by a water bath using LKB Bromma 2219 Multitemp II (Sweden). A DNA Ladder of 50–1000 bp (SibEnzyme, Russia) was used to determine the mobility of complexes. Bromophenol blue and xylene cyanol were utilized for visual tracking of DNA migration during the electrophoresis. Stains-all (Sigma, USA) was used to stain the gel.
UV melting analysis
Thermal denaturation experiments were carried out in quartz cells (0.2 cm path length) using a Cary 300-Bio Melt spectrophotometer (Varian, Australia) equipped with a Peltier thermostabilized 6 × 6 holder. Melting curves were registered at wavelengths 260, 270, and 300 nm in the 5–95 °C range at a temperature change rate of 0.5 °C min−1. Absorbance at 300 nm (baseline) was subtracted from the values at 260 and 270 nm at each temperature. The maximum of the derivative of a melting curve with respect to temperature was defined as melting temperature, Tm. All oligonucleotide samples were prepared in a buffer composed of 100 mM NaCl, 10 mM sodium cacodylate (CH3)2AsO2, and 10 mM MgCl2, pH 7.2. An equimolar mixture of components M and N at 10 μM in the absence or presence of the S-type oligomer was studied.AFM imaging
AFM images were captured in ambient air. Sample preparation for AFM was as follows: (1) dilution of the annealed-oligonucleotide mixture in 5 mM MgCl2 to a final concentration of 5 × 10⁻⁷ M; (2) deposition of 6 μL of a sample onto a freshly prepared mica slide (1 × 1 cm) for adsorption for 15 s to 1 min (depending on the sample); the slide was pre-chilled on a cold substrate (4 °C); (3) rinsing with 100–1000 μL of MilliQ water; and (4) drying the specimen with a gentle argon stream. Images were acquired on a Multimode 8 atomic force microscope in “ScanAsyst in Air” mode using ScanAsyst-Air probes (Bruker) or in tapping mode with a diamond like carbon NSG-10 series AFM cantilever (NT-MDT, Zelenograd, Russia) with a tip curvature radius of 1–3 nm. Images were processed and prepared in the Gwyddion software.40MD simulations and data analysis
Structures of oligonucleotide complexes were constructed as a B-form DNA double helix and afterwards were manually changed to desired structures by means of the UCSF Chimera software.41 The non-nucleotide linker diethylene glycol phosphodiester was built in the XLEaP software (AmberTools 17).42 Its geometry was optimized by the Hartree–Fock method with the 6-31G++ basis set in the Gaussian'09 software.43 Partial charges were calculated by the RESP algorithm.44 AMBER force field parmbsc1 (ref. 45) for DNA and general AMBER force field (gaff) parameters for the missing parameters of diethylene glycol phosphodiester were used.46 The force field parameters for the non-nucleoside residue were generated using the parmchk module of AmberTools 15. The simulations were performed in the explicit TIP3P water model using ionsjc_tip3p parameters.47MD simulations were carried out via the pmemd.CUDA module of AMBER 16.42 Simulation parameters were similar to the described in ref. 48. The structures were solvated with TIP3P water in a cuboid box (12 Å). The systems were neutralized by the addition of sodium or both sodium and magnesium ions. An equilibrium trajectory of 100–1000 ns was obtained for all complexes. Trajectory analysis was performed using the cpptraj tool of AmberTools 17.42 To determine the most represented structure in a productive MD trajectory, a hierarchical cluster analysis with a random sieve of 100 was performed.
Solution of the theoretical model
To solve the system of algebraic equations, we applied Newton's method of numerical solving. A homemade script was written in Python3 with its libraries. The values of thermodynamic parameters of duplex formation (ΔH0 and ΔS0) for the calculation of K and Kh were determined using nearest-neighbour model parameters from 49 and salt correction from ref. 50. Values for duplex formation via block 1 and 2 were averaged for further analysis. The enthalpy impact of Kh was assumed to be equal to K. Given that the formation of intramolecular complexes with linkers of various lengths is driven entropically, we used an additional entropy impact on the thermodynamic parameters of duplex formation for simplification. The impact of −14 cal (mol−1 K−1) was selected based on a scan of a wide range of entropy values to prevent a significant increase in a complex's Tm at higher values or disruption of a V-shaped complex in the opposite case.Results
In accordance with the aim of the study, this project consists of three parts. In the first, we analyzed the formation of self-limited complexes using a theoretical thermodynamic model. We proposed an approach to confirming the formation of a self-limited complex and to determining its molecularity. On the basis of these data, in the second part, we tested the proposed methodology on a set of complexes having different duplex block lengths and containing or lacking flexible linkers. In the third part of the study, we analyzed the influence of oligothymidylate linkers on the type and molecularity of complexes formed by a pair of oligonucleotides.Theoretical analysis
At the first stage, a theoretical concept for confirming the formation of self-limited V-shaped complexes was formulated (Fig. 1c). There are two tasks in the analysis of the self-associated structures: determining the nascent complexes' geometry (a circular self-limited complex or linear concatemer) and identifying the molecularity of the structures. We analyzed the thermodynamic scheme of self-limited complex formation and proposed to “open” it to solve these issues. This is analogous to toehold-mediated strand displacement.51,52 A change in the concentrations of different complexes and oligomers can be easily detected by a gel shift assay at various concentrations of S.The simplest thermodynamic scheme of the circular dimeric complex (MN*) opening is depicted in Fig. 2. Oligonucleotides M and N contain complementary blocks designated by symbol 1 or 2 and have a linker between them (shown as thin black lines, Lm and Ln). The oligomers can assemble into complexes MN11 and MN22 with two dangling ends of type 2 or 1, respectively. These complexes can undergo intramolecular transition giving rise to circular V-shaped structures MN*. When oligonucleotide S (which complements the N fragment or can be constructed as any other M or N duplex-forming block) is added to a solution of M and N, it will bind N, MN11, MN22, and MN*, resulting in complexes NS and MNS. The equilibrium binding constants of blocks 1 and 2 (K1 and K2) for simplicity were assumed to be identical and designed as K.
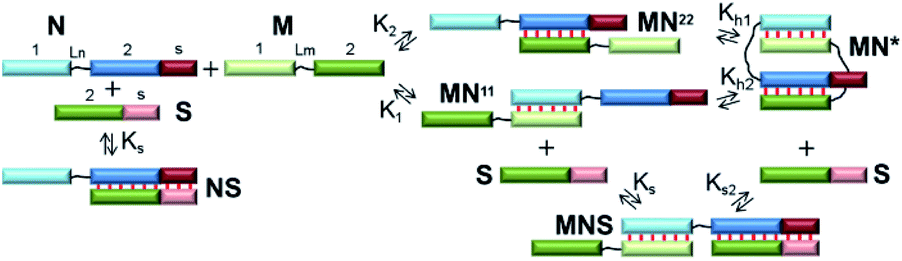 | ||
| Fig. 2 The scheme of self-limited bimolecular complex formation and of the proposed approach to proving this process. Blocks with complementary sequences have the different colour and are assigned a symbol: 1, 2 or s. Linkers are denoted as thin black lines. Watson–Crick base pairing is shown as thin red lines between blocks. | ||
The emergence of self-limited complexes can be proved by the addition of an oligomer (S) that is complementary to N2 block (or another one of the complementary fragments 1 or 2, Fig. 2). If equilibrium binding constant Ks is lower than K1, K2 and K × Kh, then the formation of NS and MNS will be thermodynamically unfavorable. In addition, the concentration of S must be low to prevent competition between the formation of intramolecular complex MN* and that of trimolecular complex MNS thus making MN* more favorable. In this case, addition of the S component should not lead to a redistribution of the various complexes' concentrations in the mixture of oligomers M and N.
To determine the molecularity of the self-limited complexes, the S component and the complementary block of N should be lengthened to increase affinity and accelerate binding kinetics. In this context, a gradual increase in S concentration will decrease MN* concentration. If the molecularity of a self-limited complex is greater than 2 ((MN)m, m > 1, Fig. 1f), then stepwise addition of S will decrease the concentration of the circular structure while giving rise to open complexes of different molecularity (MN)zS, z = 1 … m. Similar observations were made when the S component was added to a linear concatemer complex.28,53,54
Alternatively, the S component can be lengthened to interact with the nucleotide linker (Ln) of N. This approach is similar to the destruction of a hairpin structure owing to an interaction of an additional oligonucleotide with the loop.55 When a non-nucleotide linker is used, oligomers S and N should be both lengthened by block S (Fig. 2). The disadvantage of this method is a possible influence of overhangs in complexes of M with N; this influence can affect the efficiency and molecularity of the self-limited complexes by creating steric hindrances.
We performed analysis via the proposed scheme to select the size and nucleotide sequence of S. As a research object for the following experiments, we chose complex M20D/N20D with 10-nucleotide (10 nt) blocks 1 and 2 (Table 1). These blocks are connected by a flexible long linker based on ethylene glycol phosphodiesters (Table 1). Oligonucleotides form a complex of one length with high efficiency (Fig. 6). By contrast, oligonucleotides without a flexible non-nucleotide linker give rise to long concatemer complexes in accordance with our previous data.25 The duplexes afforded by blocks 1 and 2 were designed to have similar thermodynamic stability to simplify the theoretical analysis (Table S1†).
Using the numerical solver of the system of equations for mass balance and equilibrium binding constants for the thermodynamic scheme shown in Fig. 2, we calculated the concentration of each component of the model (Fig. 3 and S1†). The detailed theoretical analysis of the self-limited bimolecular complex formation presented in ESI.† For quantitative analysis, we employed averaged values of enthalpy and entropy changes for blocks 1 and 2 of M20D and N20D. We stepwise increased the length of the dangling s block by one nucleotide thereby preventing the emergence of hairpins and self-complementary complexes in N or S.56 The lengthening of the s block increases Ks and causes redistribution of various components at different temperatures (Fig. 3). The shortest S oligomer (without the s block) interacts with the other components very weakly, i.e., there are small amounts of S-containing complexes in the presence of a 10-fold excess of S0 in the tested temperature range (0–100 °C; Fig. 3a). In contrast, the use of the s block of ≥4 nt always results in a low concentration of circular complex MN* even at [S]0 = [M]0 ([MN*]/[M]0 < 20%, Fig. 3b). Adding a 10-fold excess of S will fully eliminate the circular complex (Fig. 3c).
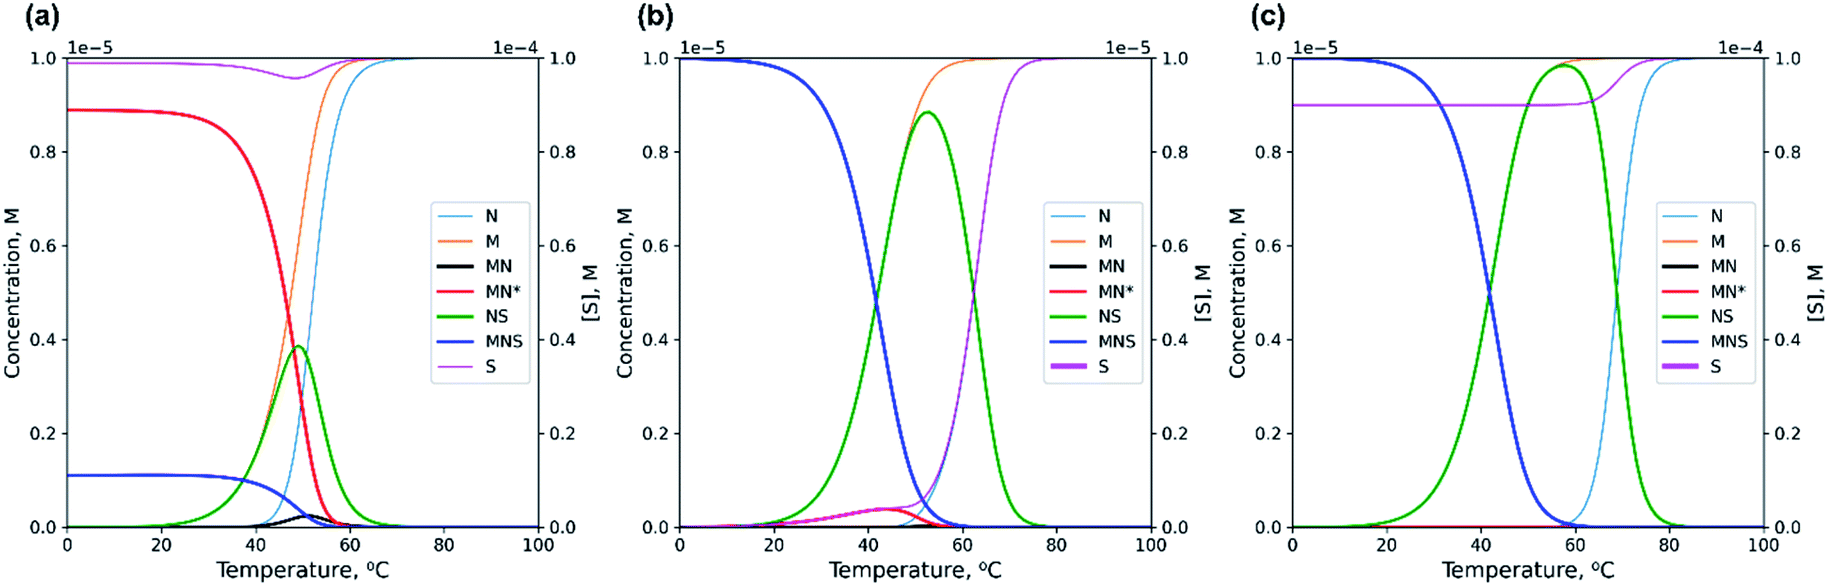 | ||
| Fig. 3 Theoretical prediction of changes in various components' concentrations with a temperature increase calculated by numerical solving of the system of eqn (S1) and (S2) (see ESI†). (a) Non-lengthened complex M20D/N20D with the 10-fold excess of S10; (b) lengthened complex M20D/N20Dl with equimolar concentration of S10l; (c) lengthened complex M20D/N20Dl with the 10-fold excess of S10l. | ||
The long s block in oligonucleotide N or S could give rise to undesirable hairpins or self-complementary complexes. Accordingly, it is advisable to use complexes of minimal length that bind highly efficiently to the circular MN* conformation, and the presence of MN* should not exceed 10–20% across the entire temperature range at [M]0 = [S]0.
Thermodynamic characterization of the complexes' formation can be performed by thermal denaturation method, for example, by registration of optical density changes (UV melting experiments). We calculated data points for melting curves as changes in concentration of all single-stranded blocks during a temperature increase. If [S]0 is increased, then the observed thermodynamic stability will rise as a result of most probable intermolecular interaction of oligonucleotides at higher concentrations of solutes (concentration mechanism). Typical melting curves for non-lengthened S oligomers and those lengthened by 4 nt are shown in Fig. S1.†
Denaturation transition at high [S]0 has a slightly higher melting temperature (Tm, maximum of the first derivative of the melting curve with respect to temperature). In the case of a long S component, two transitions can be easily identified. A clear-cut high-temperature transition with a 10-fold excess of S corresponds to the dissociation of the NS complex (Fig. 3). Its position changes according to the concentration mechanism of formation/dissociation of intermolecular complexes.
On the basis of the theoretical results, to prove the emergence of the bimolecular complex, we propose the following technique. Self-limited complex formation can be confirmed by the addition of a short S component whose binding constant is close to K. In this case, at a low temperature, there should not be any changes in the concentration of various components in solution even in the presence of a 10-fold excess of S (Fig. 3a). Adding a long S component with Ks ≫ K will cause the “opening” of self-limited complexes resulting in a decrease of M and MN concentrations and an increase in MNS and NS concentrations. By analyzing the redistribution of existing complexes and by identifying nascent ones, with a gradual increase in the concentration of the S components, an investigator can draw conclusions about the molecularity of the self-limited complex. Under equilibrium conditions when circular complex MnNn is formed (at a temperature significantly lower than the melting temperature), the addition of S carrying the s block (at a small or equimolar concentration) to oligomer N (or M) will cause the opening of the self-limited complex and formation of noncircular MzNzS. A gradual increase in S concentration should give rise to MzNzS with a set of z values in the range from 1 to n (Fig. 1l, m and n). Registration of additional component(s) (as compared to those presented in Fig. 2) by a gel-shift assay will be an indicator of formation of higher-order complexes.
Experimental results. Design of model complexes
To prove the molecularity of self-limited complexes' formation, we designed two model complexes. A flexible linker based on phosphodiesters of diethylene glycol was chosen (Table 1). For efficient assembly of bimolecular self-limited complexes, the lengths of the duplexes should be identical. Two variants of duplex blocks – 10 bp (M20D and N20D) or 15 bp (M30D and N30D) – were chosen to analyze the effect of spatial withdrawal of the duplex ends because of DNA helical structure. It should have a significant impact on complex formation efficiency in accordance with previous data.25,57 On the basis of the proposed thermodynamic models, we designed nucleotide sequences of lengthened oligomers as described in section Theoretical analysis. The latter do not form stable hairpins or self-dimers and can efficiently interact with circular complexes. Lengthened toehold-binding oligonucleotides (S10l or S15l) efficiently open circular complexes, whereas short fragments (S10 or S15) do not interact with circular complexes. As a control, we used complexes without flexible linkers; these complexes should form concatemer complexes (M20 and N20, M30 and N30). Additional analysis was performed on oligonucleotides without linkers but having complementary 25 and 15 nt blocks (M40 and N40), which should yield a concatemer complex.To assess the effect of nucleotide linker length, we introduced dTn (oligothymidylate) in the middle of oligomers M20Tn and N20Tn, where n = 0, 1, 2, 3, 5, 7, 10, 15, 20, or 25. It is easy to show that at ∼10 μM oligonucleotides, an average distance between them in solution is ∼10 nm. This phenomenon corresponds to a linker length of 30 nt. Using a linker longer than 10 nm or a higher concentration of S results in completion of the formation of intramolecular (MN*) and intermolecular (concatemer) complexes. Taking into account the complementary block size of 10 nt, we chose the maximum linker length of 25 nt.
Determination of complexes' molecularity
The designed complexes were studied by the method of gel electrophoresis. Oligonucleotides 20 and 30 nt long with pairs of complementary blocks without flexible linkers yield concatemeric complexes (Fig. 4). Addition of short toehold-binding oligomers (S10 or S15) into the solution decreased polymeric chain length proportionately with their concentration (Fig. 4, lanes 1–3) in agreement with our previous results.54 Similar findings were made about the complexes of a lengthened N and M chain (M20/N20l and M30l/N30; Fig. 4a and b, lanes 3–6, Fig. S2c†). In this case, a long additional single-stranded block does not allow efficient coaxial stacking in the nicks. As a consequence, chain size of the complexes decreases, consistently with the thermodynamic analysis performed previously.25 Adding an equimolar or 10-fold excess of a lengthened toehold-binding oligomer (S10l, S15l) gives rise predominantly to MNS complexes in both model systems (Fig. 4a and b, lanes 7 and 8, Fig. S2c†).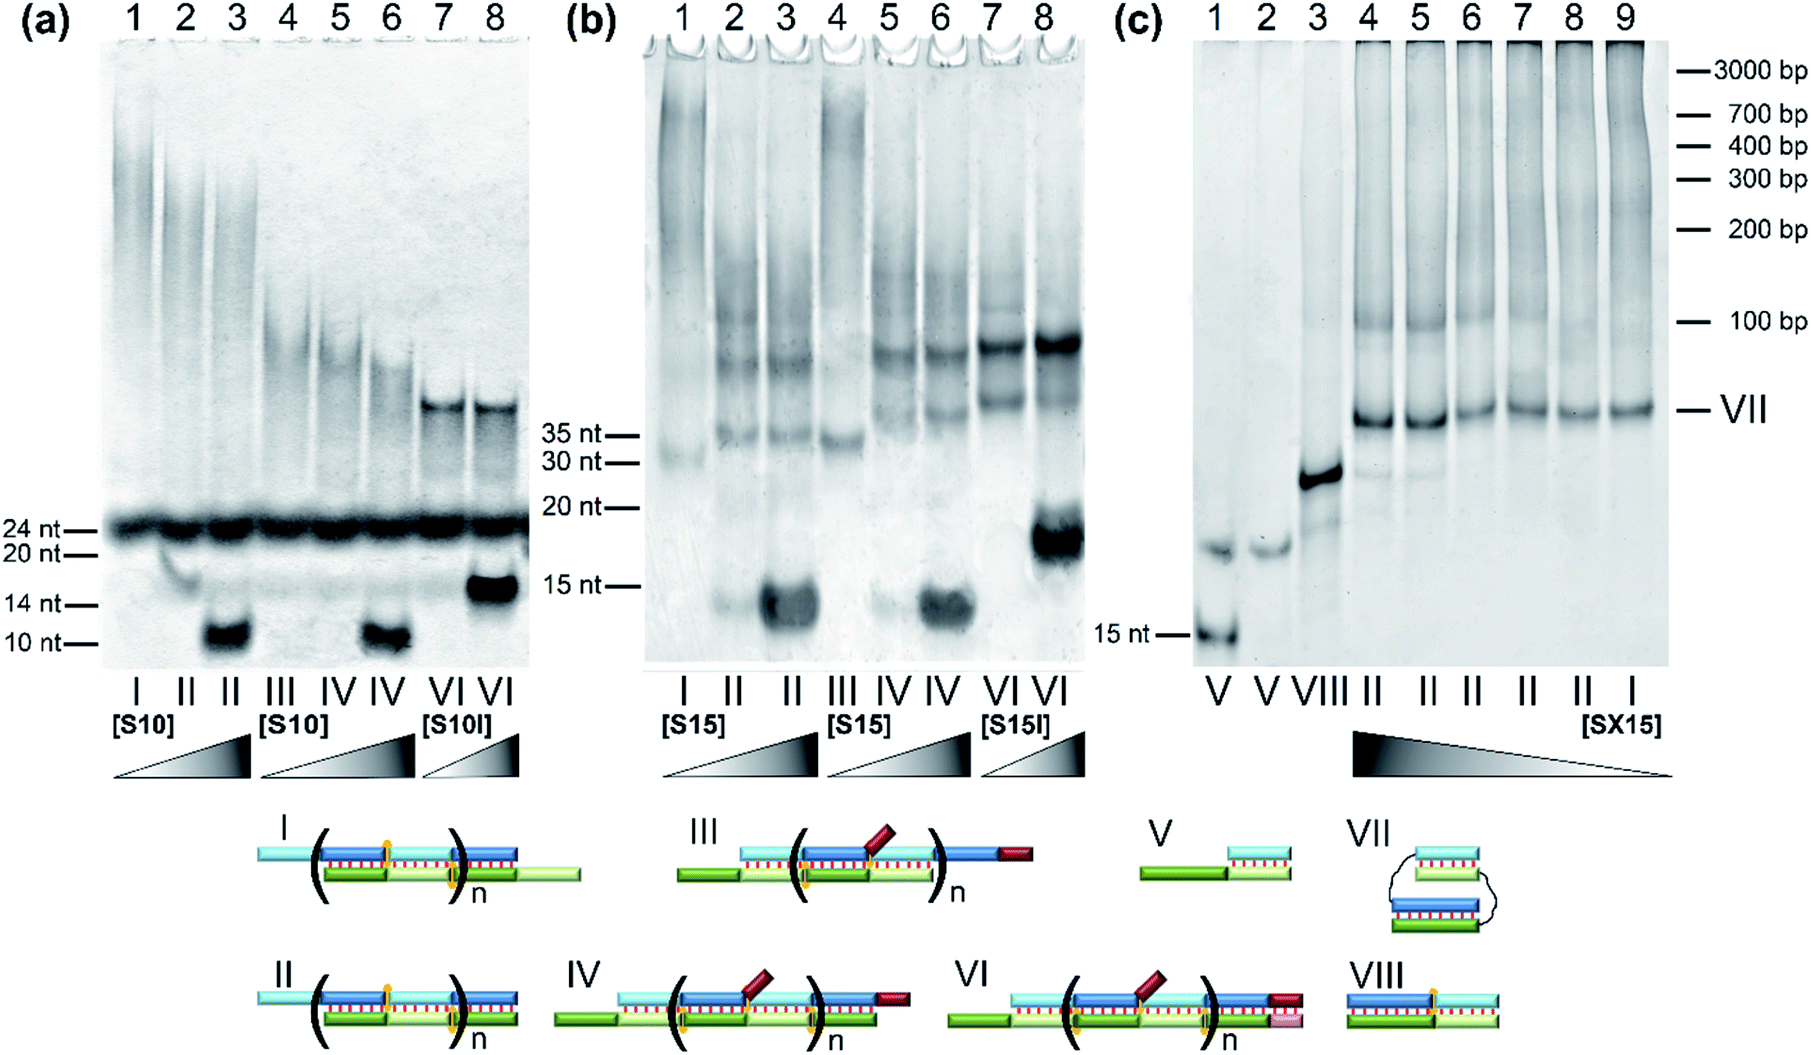 | ||
| Fig. 4 The gel shift assay of oligonucleotides' complexes of various lengths without linkers. (a) Lanes: 1, M20/N20 (1:1); 2, M20/N20/S10 (1:1:1); 3, M20/N20/S10 (1:1:10); 4, M20/N20l (1:1); 5, M20/N20l/S10 (1:1:1); 6, M20/N20l/S10 (1:1:10); 7, M20/N20l/S10l (1:1:1); 8, M20/N20l/S10l (1:1:10). (b) Lanes: 1, M30/N30 (1:1); 2, M30/N30/S15 (1:1:1); 3, M30/N30/S15 (1:1:10); 4, M30l/N30 (1:1); 5, M30l/N30/S15 (1:1:1); 6, M30l/N30/S15 (1:1:10); 7, M30l/N30/S15l (1:1:1); 8, M30l/N30/S15l (1:1:10). (c) Lanes: 1, M40/SX15 (2:1); 2, M40/SX15 (1:1); 3, M40/SX15/S25 (1:1:1); 4, M40/N40/SX15 (1:1:10); 5, M40/N40/SX15 (1:1:5); 6, M40/N40/SX15 (1:1:1); 7, M40/N40/SX15 (1:1:0.5); 8, M40/N40/SX15 (1:1:0.1); 9, M40/N40 (experiment at 15 °C). (d) Different types of complexes in the lanes are shown below the electropherogram. Full-size scans of gels are presented in Fig. S2.† | ||
In contrast to this result, native DNA duplexes with pairs of complementary blocks of 15 and 25 bp can produce both concatemeric and self-limited complexes (Fig. 4c). The presence of a well-pronounced M40/N40 band with high mobility in combination with the absence of its intensity decrease even with a 10-fold excess of component S (SX15) indicates the emergence of self-limited complexes. Thus, oligonucleotides with 15 and 25 nt duplex-forming blocks can assemble into self-limited and concatemeric complexes.
The effect of flexible linkers in both chains on the complex type was evaluated next. The predominant formation of self-limited structures was noted for complexes M20D/N20D (Fig. 5a, lane 1) and M30Dl/N30D (Fig. S2c†) and lengthened complexes M20D/N20Dl and M30Dl/N30D (Fig. 5a, lane 4 and Fig. 5b, lane 1). Adding a short component S10 or S15 in an equimolar amount or 10-fold excess confirmed the assembly of self-limited complexes. We found no changes in complexes' distribution with the introduction of the oligonucleotide into the system (Fig. 5a, lane 2 and Fig. 5b, lane 3). The mobility of the larger M20D/N20Dl complex was expectedly slightly lower than that of M20D/N20D in the gel shift assay. Lengthened toehold-interacting oligomers S10l and S15l bound to the complex tightly according to the model design (Fig. 5a, lanes 7–12 and Fig. 5b, lanes 4–9). This phenomenon leads to different effects. In the case of M30Dl/N30D, adding any amount of S15l yields a product with lower mobility without any other bands.
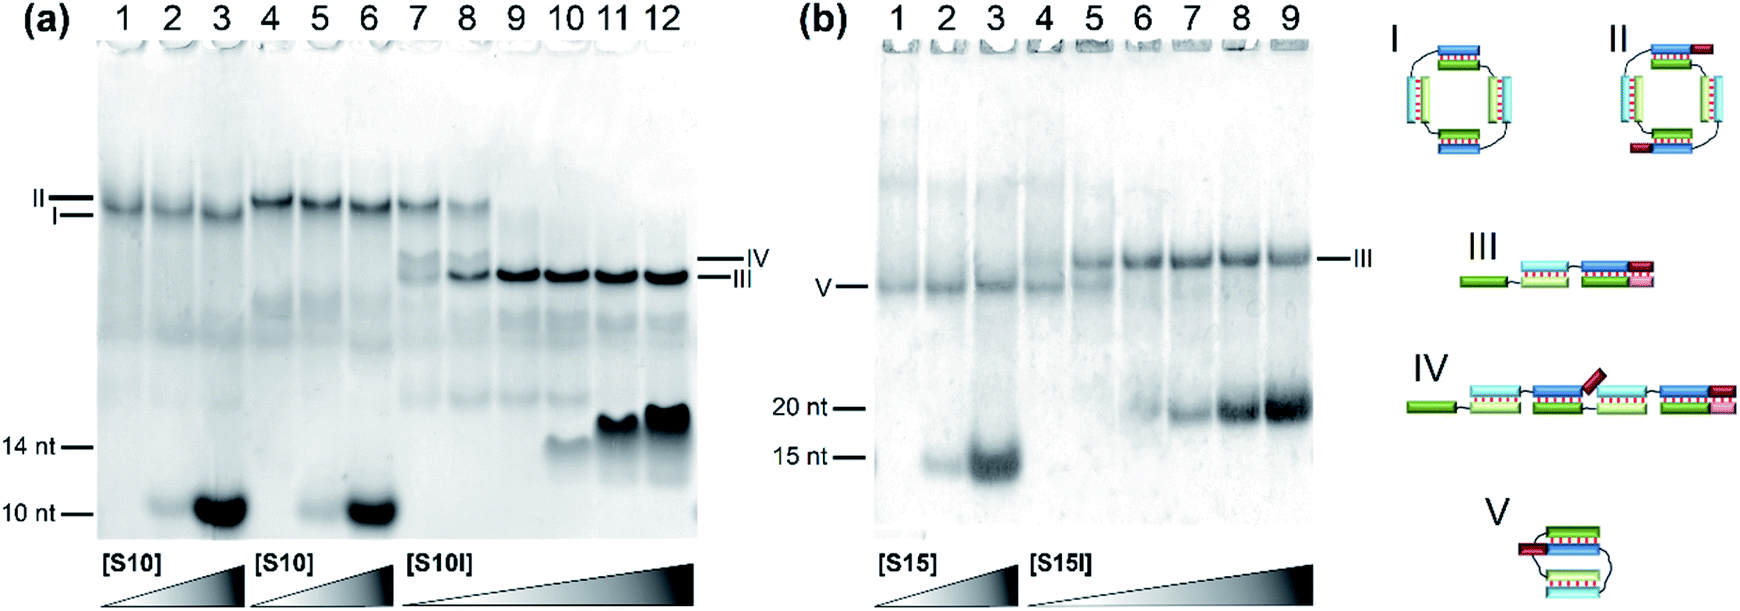 | ||
| Fig. 5 Determination of complex molecularity. Gel shift assays of complexes of oligonucleotides of various lengths carrying non-nucleotide linkers at different concentrations of the S component: (a) lanes: 1, M20D/N20D (1:1); 2, M20D/N20D/S10 (1:1:1); 3, M20D/N20D/S10 (1:1:10); 4, M20D/N20Dl (1:1); 5, M20D/N20Dl/S10 (1:1:1); 6, M20D/N20Dl/S10 (1:1:10); 7, M20D/N20Dl/S10l (1:1:0.25); 8, M20D/N20Dl/S10l (1:1:0.5); 9, M20D/N20Dl/S10l (1:1:1); 10, M20D/N20Dl/S10l (1:1:2); 11, M20D/N20Dl/S10l (1:1:5); 12, M20D/N20Dl/S10l (1:1:10). (b) Lanes: 1, M30Dl/N30D (1:1); 2, M30Dl/N30D/S15 (1:1:1); 3, M30Dl/N30D/S15 (1:1:10); 4, M30Dl/N30D/S15l (1:1:0.25); 5, M30Dl/N30D/S15l (1:1:0.5); 6, M30Dl/N30D/S15l (1:1:1); 7, M30Dl/N30D/S15l (1:1:2); 8, M30Dl/N30D/S15l (1:1:5); 9, M30Dl/N30D/S15l (1:1:10). Types of complexes in the lanes are shown below the electropherogram. Full-size scans of gels are presented in Fig. S2.† | ||
In the case of M20D/N20Dl, adding a small (0.25× or 0.5×) amount of S10l resulted in two bands with mobility higher than that of the self-limited complex. A further increase in S10l concentration up to a 10-fold excess yielded only a single band with the highest mobility (Fig. 5a, lanes 9–12). This band corresponds to a complex of three molecules: M20D/N20Dl/S10l. At a lower S10l concentration, two new bands correspond to a mixture of M20D/N20Dl/S10l and (M20D/N20Dl)2/S10l. Thus, the slowest band matches the formation of self-limited tetrameric complex (M20D)2/(N20Dl)2. Additionally, this finding was confirmed by a comparison of the mobility of self-limited and opened linear molecular complexes of various lengths: circular complexes with 10 bp duplex blocks are slower than linear ones in contrast to the complexes of 15 bp building blocks featuring an inverted mobility pattern.
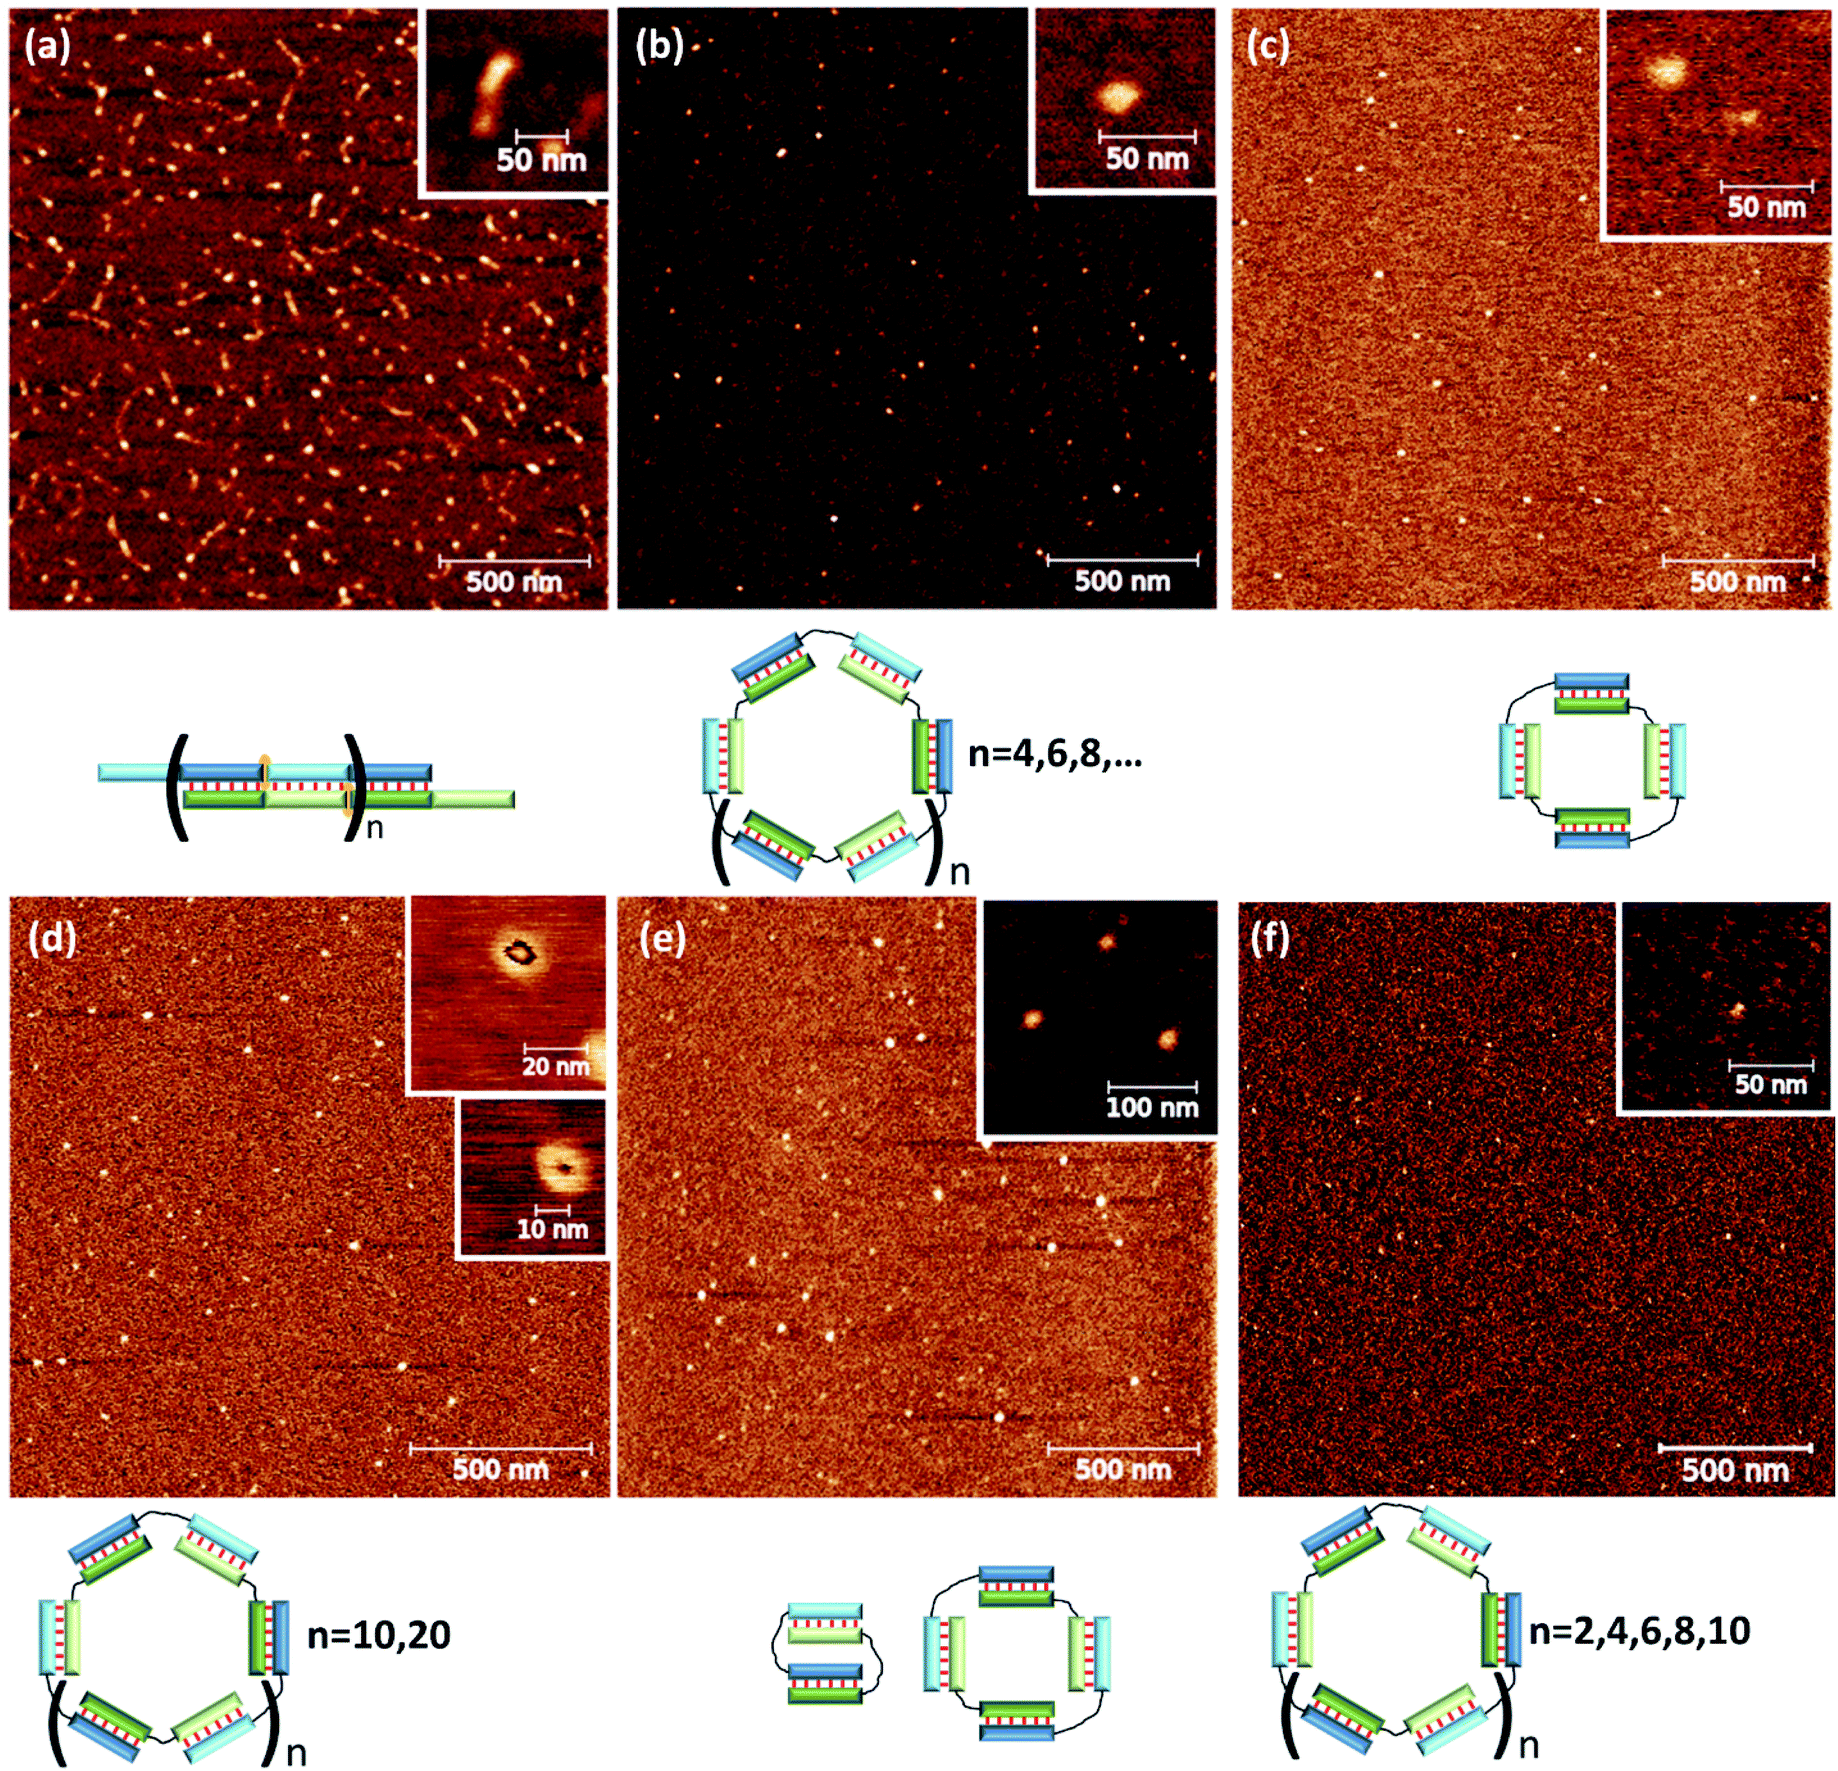
The complex type and molecularity were confirmed by AFM. A comparison of concatemer M20/N20D, circular complexes M20D/N20Dl and three molecular complexes M20D/N20Dl/S10l is shown in Fig. 6 and S10.† A long linear wire with length up to several hundred nanometers corresponding to concatemeric structure was registered for M20/N20 complexes. In the case of complexes with flexible linkers, M20D/N20Dl and M20D/N20Dl/S10l (1:1:1), small complexes with a diameter 10 to 30 nm were found. Similar results were obtained for the complexes of 15 bp building blocks (Fig. S12†). The heights of the complexes in all cases were in the range 0.7–1.2 nm (Fig. S14†). This is typical for double-stranded DNA on mica surface in the air and measurements in the tapping mode, for example, see ref. 58. Additional control of DNA detection was performed by scanning the mica surface washed with buffer, as well as with different concentrations of DNA in the loading solution. In the first case, we did not observe any objects on the surface. In the second case, the number of objects on the mica surface was proportional to the concentration of oligonucleotides (data not shown). We performed statistical analysis of geometrical parameters (diameter, aspect ratio, roundness, and z-range) of the last two complexes. In all cases, we detected significant changes in parameters' distributions after adding S10l. A quantitative comparison of the determined values for various complexes is not appropriate because the cantilever's shape, diameter, and sizes of the studied objects are not exactly the same. Thus, the determined size includes the cantilever diameter, which was different for different tips and blunted during the measurements. Nevertheless, the presence of various geometric shapes of complexes described above can be discovered by analyzing the aspect ratio (Fig. S13†). These parameters are related to thermal motion of the complexes resulting in an equilibrium between flattened and circular geometry for a self-limited complex (Fig. 1d, g and h). This was confirmed by a diffuse band of self-limited complexes in contrast to clear-cut bands of trimolecular linear complexes (Fig. 5a).
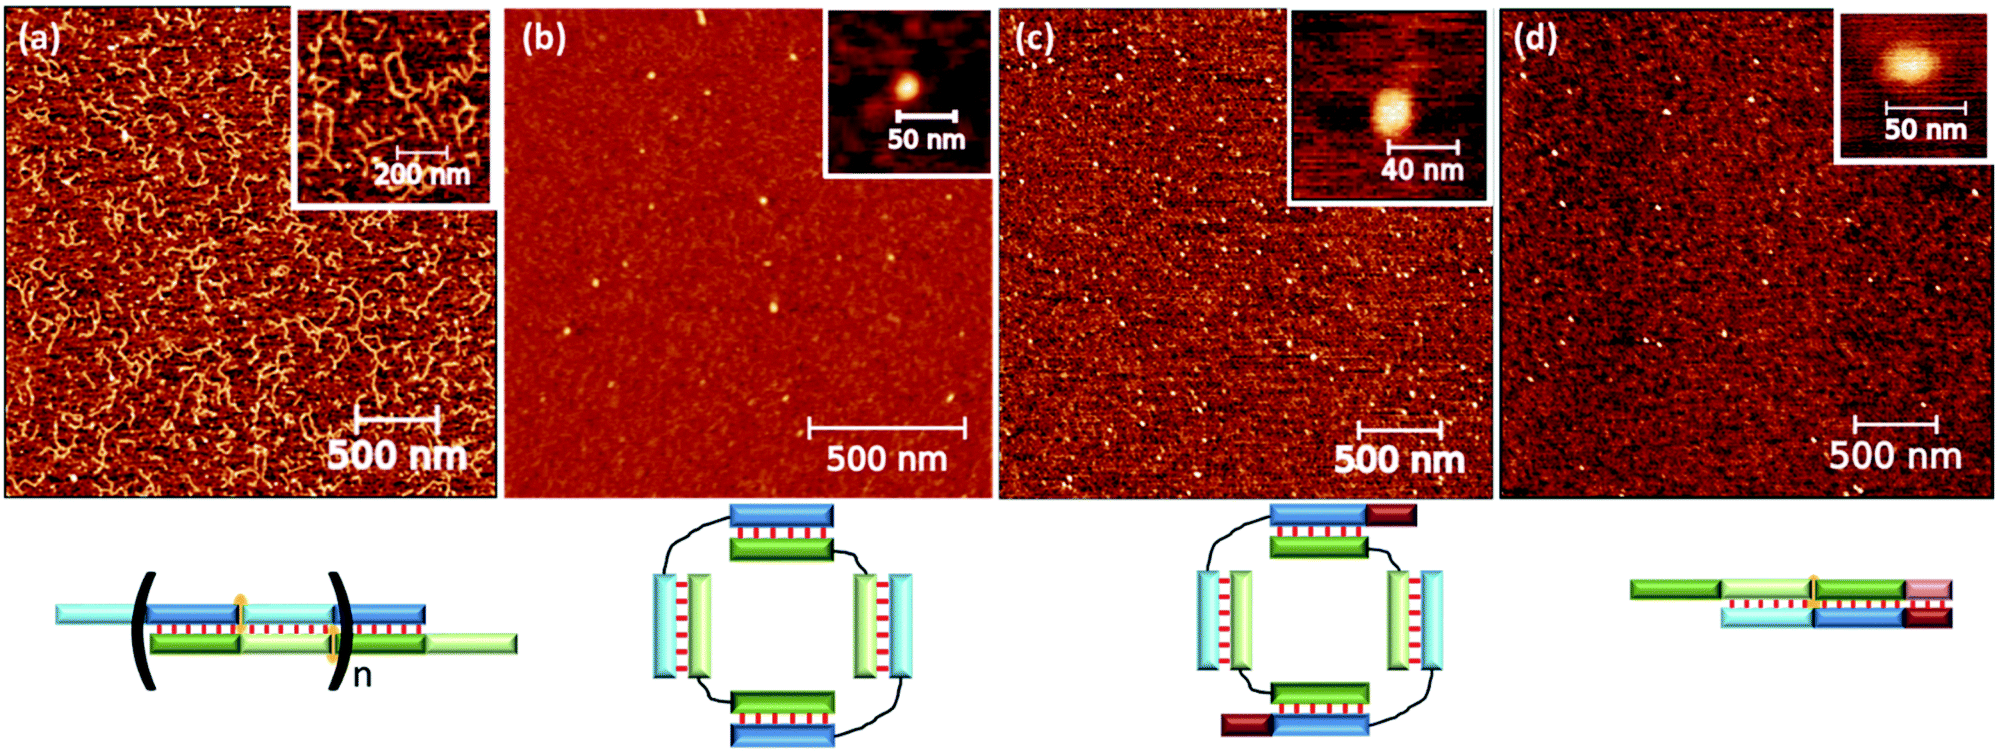 | ||
| Fig. 6 AFM analysis of various complexes: (a) concatemeric complex M20/N20; (b) self-limited complex M20D/N20D; (c) self-limited complex M20D/N20Dl; (d) trimolecular complex M20D/N20Dl/S10l. Schematic representation of the complex type is shown below AFM images. | ||
The theoretical analysis indicates changes in melting profiles of self-limited complexes after the addition of short or long toehold-binding oligomers. We examined thermal stability of complexes formed by 20 nt oligomers in the absence and presence of a toehold-binding oligonucleotide. For this purpose, optical melting experiments were performed. Unfortunately, it was impossible to determine thermodynamic parameters (interaction enthalpies and entropies) in series of experiments conducted here. Therefore, a melting temperature defined as a maximum of the first derivative of a melting curve with respect to temperature was determined. Noticeable changes in thermal stability could be found at 10-fold excess concentration of the S component (Tables 2 and S2†).
| No. | M20 | N20 | M20D | N20D | N20Dl | S10 | S10l | T (°C) |
|---|---|---|---|---|---|---|---|---|
| 1. | 1 | 1 | 48.6 | |||||
| 2. | 1 | 1 | 10 | 49.5 | ||||
| 3. | 1 | 1 | 10 | 50 | ||||
| 4. | 1 | 1 | 42 | |||||
| 5. | 1 | 1 | 10 | 42.5 | ||||
| 6. | 1 | 1 | 10 | 42.5 | ||||
| 7. | 1 | 1 | 40 | |||||
| 8. | 1 | 1 | 10 | 44 | ||||
| 9. | 1 | 1 | 10 | 64/39 | ||||
| 10. | 1 | 10 | 47 | |||||
| 11. | 1 | 10 | 45 | |||||
| 12. | 1 | 10 | 46 | |||||
| 13. | 1 | 10 | 47 | |||||
| 14. | 1 | 10 | 44 | |||||
| 15. | 1 | 10 | 64 |
Melting curves' shapes are almost the same for self-limited complexes alone (M20D/N20Dl) and in the presence of the S component (M20D/N20D/S10, M20D/N20Dl/S10, or M20D/N20D/S10l) and for bimolecular complexes (N20D/S10l). Melting temperature (Tm) of the aforementioned self-limited complexes in the presence of the S component was 1–2 °C higher (Table 2 and Fig. S8†). The observed changes can be explained by higher thermal stability of complexes of M20D with the S component with an excess of the latter, in agreement with the theoretical model (Fig. 3). The melting curve of the M20D/N20Dl/S10l complex contains two well-pronounced transitions (peaks in differential melting curves, Fig. S8†). The low-temperature transition (Tm = 39 °C) is dissociation of N20D from the trimolecular complex (M20D/N20Dl/S10l). At a high temperature, denaturation of N20Dl/S10l was observed (Tm = 64 °C). Concatemer complexes are stabler than the self-limited ones because highly efficient stacking in the nicks stabilizes them. We evaluated this effect in detail for concatemeric25 and tandem57 complexes. It is most pronounced for M20/N20 because the lengthened block in M20/N20l disrupts a cooperative interaction in the nick thereby decreasing melting temperature by 6 °C. Asymmetric melting transition in differential melting curves was observed for concatemers. A slow rise before Tm and a sharp drop after the maximum during a temperature increase were observed (Fig. S8†). At lower temperatures, the long polymer chain breaks to form smaller complexes. At temperatures above Tm, cooperative units melt with simultaneous disintegration of oligomeric complexes. Thus, the shape of the melting curve and melting temperature could be indicators of the formation of either a concatemer or self-limited complex. Nonetheless, both of these factors do not determine the molecularity and shape of a complex.
The same results were obtained for complexes of the “30” series. Melting temperatures of the studied complexes at different “opener” concentrations are presented in Table S3.† Therefore, the proposed theoretical approach to proving the emergence of self-limited complexes and to determining molecularity was confirmed by experimental results.
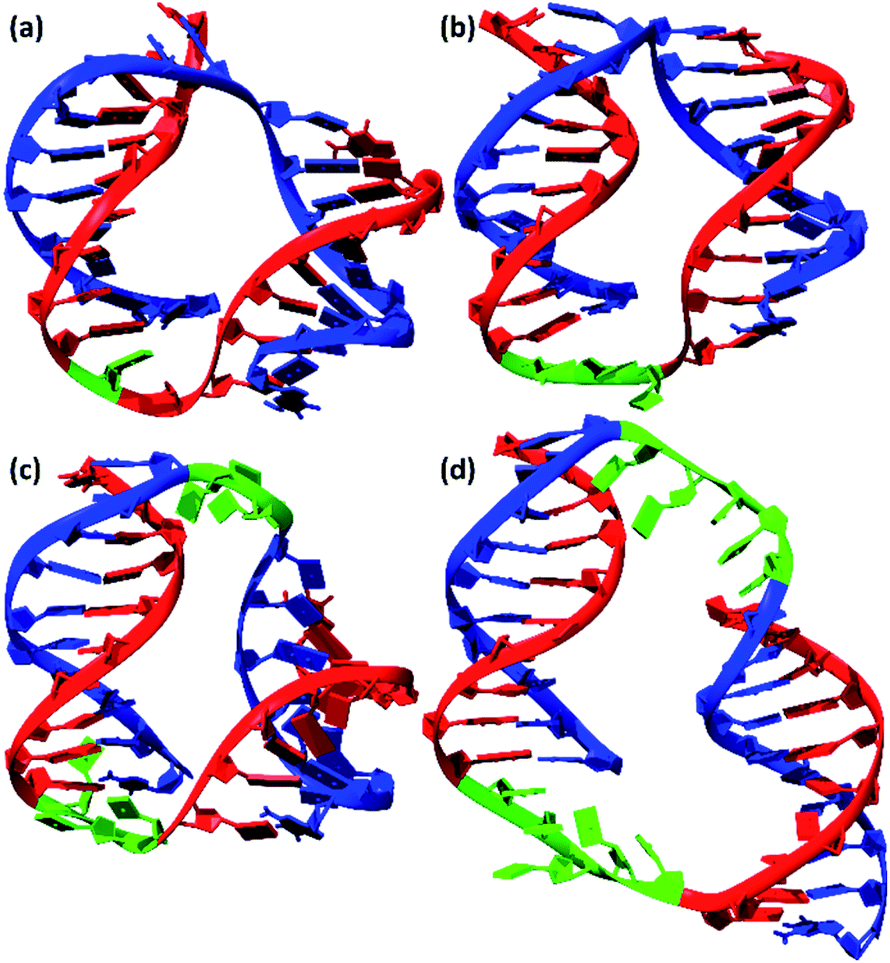
We also conducted MD simulations of bimolecular complexes M20D/N20D and M30D/N30D in an explicit water shell to assess the possibility of assembly of these complexes. Both complexes are stable along the 1000 ns trajectories (Fig. S16a†). The most representative structures obtained by cluster analysis are shown in Fig. 7. Summary of cluster analysis of MD trajectories presented in Table S14.† The M30D/N30D complex has two parallel duplexes with B-form DNA double helices. The structure of M20D/N20D is slightly perturbed. Fraying of a terminal base pair of one of the duplexes makes convergence of the ends in the bimolecular complex possible. This finding indicates the necessity of additional energetic penalties for the formation of bimolecular complexes in comparison to higher order structures. The structure of the complexes in the presence of magnesium cations was also stable along the 1000 ns trajectories, and the structure of duplex blocks did not change significantly (Fig. S17†). On the other hand, duplexes were closer to each other due to more efficient shielding of phosphate charges by bivalent cations (Fig. S18†). Consequently, these data confirm the assembly of a bimolecular complex for M30D/N30D and a complex of higher molecularity (tetramolecular) for M20D/N20D.
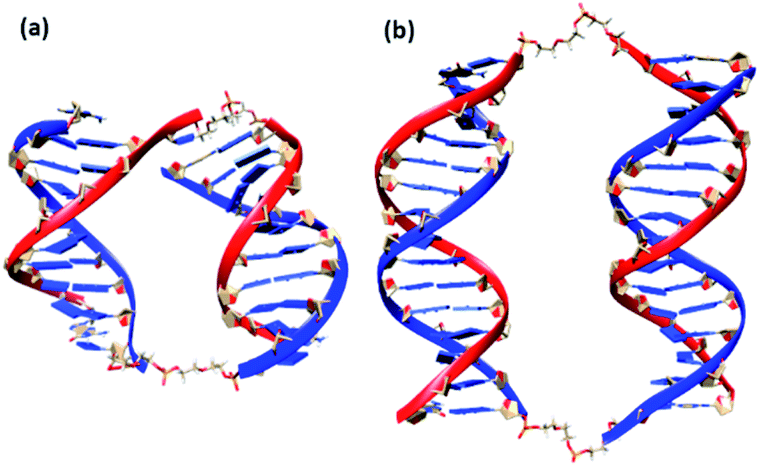 | ||
| Fig. 7 Molecular structures of bimolecular complexes M20D/N20D (a) and M30D/N30D (b) most represented in 200 ns MD trajectories. Linkers shown as stick model, ribbon of M series oligonucleotides in blue colour, N series in red. | ||
The influence of linker length and nature on complex type and its molecularity
We analyzed the effects of non-nucleotide (D) and dTn (n = 0, 1, 2, 3, 5, 7, 10, 15, 20, or 25) linkers introduced in the middle of oligomers M20 and N20 on the type, molecularity, and efficiency of formation of complexes. We determined the mobility of all studied complexes and compared them to each other and with the data described above. Complex types and molecularity were determined by simultaneous analysis of all gel shift assays (Fig. S3–S6†) and are summarized in Table 3.| Lma | Lnb | Mobility (bp)/molecularity | Lm | Ln | Mobility (bp)/molecularity |
|---|---|---|---|---|---|
| a A linker in the oligomer of M20, for example, 5 for M20T5, or D for M20D.b A linker in the oligomer of N20.c Concatemer complex.d Bands of minor intensity are presented in parentheses.e In a lane, the presence of complexes of higher molecularity is indicated by “…”.f {2 bands} denotes two bands of similar mobility.g Values obtained from the AFM data. | |||||
| 0 | 0 | >50/conc.c | D | D | 220/4 |
| 0 | 1 | >50/conc. | 0 | D | 200/4 |
| 0 | 2 | 70, conc. >70/2, conc. | D | 0 | 220/4 |
| 0 | 3 | 220, 400, 550, …/4, 6, 8, …e,f | D | 1 | 300/4 |
| 0 | 5 | 35, 220, 400/2, 4, 6 | D | 2 | 220/4 |
| 0 | 25 | 40, 110, 250, 450, 550/2, 4, 6, 8, 10 | D | 3 | (40), 220/(2), 4 |
| 25 | 15 | 60, 220/2, 4 | D | 5 | 40, 220/2, 4 |
| 1 | 0 | <700/conc. | 1 | 1 | <800/conc. |
| 2 | 0 | 220/4 | 2 | 1 | 250/4 |
| 3 | 0 | 250/4 | 3 | 1 | 220/4 |
| 5 | 0 | 180/4 | 5 | 1 | 30, 190/2, 4 |
| 7 | 0 | (30)d, 120, (280, 400, …)/(2), 4, (6, 8, …) | 7 | 1 | 30, (140, 200)/2, (4, 6) |
| 10 | 0 | (30), 120, (280, 400, …)/(2), 4, (6, 8, …) | 10 | 1 | 30, 180, (220, …)/2, 4, (6, …) |
| 15 | 0 | 40 {2 bands}, 200, 250, 300, 450, …/2, 4, 6, 8, … | 15 | 1 | 40 {2 bands}, 200, 250, …/2, 4, 6 |
| 25 | 0 | 40, 110, 250, 420, 500, …/2, 4, 6, 8, … | 25 | 1 | (40), 110/(2), 4 |
| 1 | 5 | 180, <450/2, 4 | 1 | 25 | 100/4 |
| 2 | 5 | 30, <200/2, 4 | 2 | 25 | 110/4 |
| 3 | 5 | 30, <200/2, 4 | 3 | 25 | 110/4 |
| 5 | 5 | 30, (<200)/2, (4) | 5 | 25 | 115/4 |
| 7 | 5 | 35 {2 bands}/2 | 7 | 25 | 45, 120/2, 4 |
| 10 | 5 | 30, 35/2 | 10 | 25 | 50, 130/2, 4 |
| 15 | 5 | 30, 40/2 | 15 | 25 | 60, 200/2, 4 |
| 25 | 5 | 45, 110/2, 4 | 25 | 25 | 80, 280/2, 4 |
Detailed examination of the electropherograms revealed that oligomers with the same duplex block length yield self-limited complexes if at least one of the loops contains a flexible non-nucleotide linker or two or more nucleotides. This is necessary to disrupt the stacking in the nicks between duplex blocks. A single nucleotide linker is not enough for this purpose because there are two variants of an effective stacking interaction. In the first case, one nucleotide is still stacked on two neighbouring duplex regions. In the second case, it turns out that a double helix and a stacking interaction arise between terminal pairs of duplexes, similarly to a single-nucleotide bulge loop.59
It should be noted that the size and type of a complex depends on the base pairs adjacent to the site of the single-strand break. Complexes M20Tn/N20Tm and M20Tm/N20Tn could have different structures. For example, the M20T3/N20 complex gave a predominant band with mobility at ∼220 bp (Fig. S3a and S4a,† lanes 4), whereas for M20/N20T3, a set of complexes of various molecularity levels was detected (Fig. S4a, lane 18; Fig. S5,† lane 17). It is noteworthy that complexes M20Tn/N20Tm for m = 2–5 and n = 0, 1 and m = 1, n = 2, or 2 have substantially lower mobility than does the fastest band, M20T1/N20T3 (Fig. S5,† lane2). They have a sharp upper limit of complex size and showed diffuse traces of higher-mobility bands. This result could be caused by high molecularity of self-limited complexes. On the one hand, the circularization does not permit the formation of bigger complexes. On the other hand, large noncovalent complexes can assume various conformations and dissociate during gel electrophoresis. A single band was detectable for a linker up to 7 nt and a linker in the second chain from 2 up to 7 nt (Fig. S4b and S6a†). For a linker of ≥10 nt in one of the chains and longer than 2 nt in the second chain, there were two clear-cut bands of similar intensity (Fig. S4b and S6†).
We analysed the molecularity of the complexes for the most representative complex types: (1) M20Tm/N20T2 (n = 0–5), complexes of varied molecularity; (2) complexes with a restricted faint upper band, M20T1/N20T2: (3) M20/N20T25, a complex with a number of well-defined bands; (4) M20T5/N20T25, a complex with a single diffuse band of ∼100 bp; and (5) M20T7/N20T25, a complex with two bands of mobility at ∼50 and 100 bp. The addition of short 10-mer oligomer S10 to M20Tm/N20T2 (n = 0–5) complexes in the equimolar amount relative to concentrations of other oligonucleotides lowered the complexes' molecularity (Fig. S4†). In the case of M20/N20T2, the slowest band does not undergo any changes. This indicates the emergence of self-limited complexes. In contrast, concatemeric complexes decrease the length.
The S-type oligomer can be lengthened at the 3′ end by an oligoadenine block (dAn). An interaction with dTm linkers in oligomers will increase binding constant Ks as described in the theoretical-analysis subsection. Oligomer S10A5 interacts efficiently with and binds to the M20T1/N20T2 complex (Fig. S7b†). A stepwise increase in S component concentration decreased the sizes of complexes. Trimolecular complex M20T1/N20T2/S10A5 arises at the equimolar or higher concentration of S10A5. It is impossible to identify complexes' molecularity because of the absence of clear-cut intermediate bands after an increase in S10A5 concentration. At least four well-discernible bands can be found below 300 bp. In the assay of M20Tm/N20T25 (m = 0, 5, 7), adding a lengthened S10A5 oligomer gave unexpected results. At S10A5 concentration lower than that of other oligonucleotides, we noted the formation of a small fraction with lower mobility. A double or higher excess resulted in a number of bands of extremely low mobility. Typically, most of the complexes are represented by mobility equivalent to 120–150 bp and a series of bands of 350–800 bp. We expected a decrease in complexes' molecularity and mobility, but we got the opposite result. To identify the reason for these findings, we performed some additional analyses. Our recent studies showed the possibility of efficient formation of complexes between dA5 and a dTn oligomer (n = 10 or higher) or poly(dT).57 Cooperative interactions in the nicks (coaxial stacking) significantly stabilize tandem complexes. We expect that the presence of a 10 nt dangling end of S10A5 in a probable complex with the dTn linker of N20T25 or M20Tn should not allow it to engage in stacking interactions efficiently in tandem complexes. Thermal denaturation analysis of S10A5 with dT10, dT20, and noncomplementary N20Tn (n = 5, 25) was performed to test the possibility of tandem complex formation (Fig. S9†). For dT20 and M20T25, a stable complex with Tm of 17 and 23 °C and cooperative melting (narrow denaturation transition) were registered. Thus, S10A5 can form tandem complexes with the same oligomer, resulting in brushlike complexes (Fig. 1j and k).
To confirm the types of complexes, AFM experiments were conducted. The data obtained by this technique yielded the same conclusions as did the results of gel shift assays. The M20/N20T1 complex is a concatemer with a typical length of ∼50–200 nm (Fig. 8a). In contrast, M20/N20T3, M20T5/N20, M20T5/N20T5, M20T1/N20T2, and M20T15/N20T25 are relatively small round particles. Their typical sizes are shown in Fig. 8 and S11.† Detailed examination uncovered two types of circles with an outer diameter of 17 and 30 nm that correspond to 100 and 200 bp duplexes.
 | ||
| Fig. 8 Typical results of AFM of complexes (a) M20T1/N20, (b) M20/N20T3, (c) M20T5/N20, (d) M20T1/N20T2, (e) M20T5/N20T5, and (f) M20/N20T25. Schematic representation of the complex type is shown below AFM images. | ||
The M20T15/N20T25 complex has two substructures of toroidal shape of 10 and 13 nm in diameter. For smaller complexes, the hole in the torus could not be identified because the typical diameter of the cantilever is greater than 3 nm. Determining the molecularity of the complexes by AFM was problematic because the accuracy of size determination is not very high. It is limited by tip curvature, which does not exceed 2–3 nm here.
A thermal denaturation assay was performed on a number of typical M20Tm/N20Tn complexes. Complexes with a non-nucleotide linker have a melting temperature and shape of transition that are close to those of a similar tandem complex (data not shown).22 The assembly of multimolecular M20T1/N20T2 and M20T5/N20T2 complexes is the most thermodynamically unfavorable. It involves the widest and slightly asymmetric denaturation/renaturation transition with a sharp start of complex melting at low temperatures (Fig. 9). Complex M20T5/N20T2 melting is almost the same, with slightly higher melting temperature. Complexes M20/N20T2 have Tm close to that of self-limited tetramolecular complex M20D/N20D. As for M20T25/N20, the melting profile is similar to that of concatemers, and melting temperature is slightly lower because this is a mixture of self-limited complexes and a concatemer with one of stacking interactions disrupted in the nick.
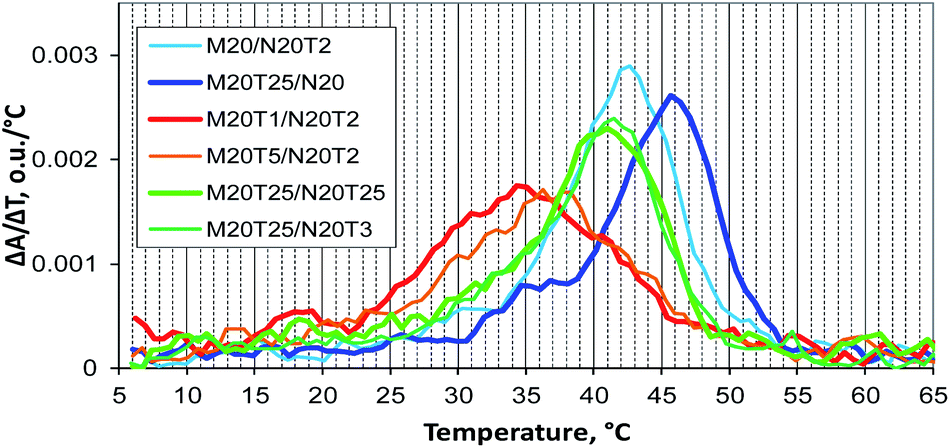 | ||
| Fig. 9 Differential UV melting curves of the studied DNA complexes obtained during the cooling of samples: concatemeric M20/N20T2 and M20T25/N20 complexes, multimolecular M20T1/N20T2 and M20T5/N20T2 complexes, and self-limited complexes M20T25/N20T3 and M20T25/N20T25. | ||
MD simulations of bimolecular complexes M20T1/N20, M20/N20T3, M20T3/N20T3, and M20T5/N20T5 in an explicit water shell were performed next. We did not observe a disruption of the duplexes. All complexes were stable along 100 ns trajectories (see root mean square deviations RMSDs in Fig. S16b†). The large scatter of RMSDs for M20T3/N20T3 and M20T5/N20T5 is caused by relative movements of duplex components connected by the long linkers. The structures most represented in the MD trajectories obtained by cluster analysis are depicted in Fig. 10. Summary of cluster analysis of MD trajectories presented in Table S4.†
 | ||
| Fig. 10 Molecular structures of bimolecular complexes (a) M20/N20T3, (b) M20T3/N20T3, (c) M20T5/N20T5, and (d) M20T1/N20 most represented in 100 ns MD trajectories. Linkers are shown as green, oligonucleotides of M20 series – blue, N20 series – red. | ||
Terminal base pair disruption was identified only for M20T1/N20 with one single-nucleotide linker. The B-form DNA double helix is perturbed only in this complex. Nevertheless, the analysis of MD simulations showed steric possibility of the formation of self-limited dimeric complexes. The likelihood of the assembly of structures with different molecular sizes is determined by thermodynamic factors. Concatemers are substantially stabilized by stacking in the nicks, thus making the formation of long linear polymers more favorable for M20T1/N20. On the other hand, the disruption of the regular DNA double helix of complex M20T1/N20 indicates a limitation of dimerization. This result indicates that the formation of bimolecular complexes is unfavorable. The gel shift assay and AFM experiments confirmed the assembly of a concatemeric complex by M20T1/N20.
The experimental results indicated the formation of tetra- and higher-order molecular complexes for M20/N20T3 and M20T3/N20T3, and of predominantly bimolecular complexes for M20T5/N20T5 (Table 2). The stability of these complexes along the MD trajectories in combination with theoretical and UV-melting analyses indicates that an entropy effect of intramolecular-complex formation makes a significant contribution to the Gibbs free energy of complexation. All these factors – steric hindrances and enthalpic and entropic contributions to the Gibbs free energy of complex formation – must be taken into account in the rational design of complexes. Thus, the MD simulations suggested the formation of bimolecular complexes, but thermodynamically driven forces could lead to the emergence of complexes of different molecularity levels.
Discussion
Rational design of nucleic acid constructs is based on the knowledge obtained from model complexes. The formation of self-limited complexes has been known for over 30 years.23,60 The principles of formation of such complexes are commonly employed to build various DNA nanoconstructs.1–20 Bimolecular V-shape complexes and complexes of other molecularity can be created by means of various non-nucleotide linkers of different lengths, rigidity levels, charges, and hydrophobicity values.21,23 Moreover, potentially, triplex formation by linkers, non-canonical base pairing, duplex blocks' interactions (for example, similar to those reported for DNA crossovers61), introduction of a chemical modification into oligonucleotides, the formation of catenanes,62 and other DNA structural factors could affect the efficiency of the self-association of DNA oligomers' and complexes' types formed at thermodynamic equilibrium. In addition, cations significantly stabilize self-limited complexes by shielding electrostatic repulsion and/or via coordination of phosphate residues. This is illustrated by maps of the distribution of ion density, which is higher between the two double-stranded chains (Fig. S18†). Similar findings have been published previously about closely located DNA chains, for example, crossovers.61In our study, we found that native oligodeoxyribonucleotides based on Watson–Crick base pairing can self-organize into a variety of shapes. Long linear concatemeric complexes easily come into being if stacking interactions in the nicks are effective. In this context, a set of complexes of various lengths is observed. The width of length distribution and the most probable length are determined by equilibrium binding and cooperative-interaction constants and by concentrations of components of the complex.25 Furthermore, addition of short oligomers that can bind only to one of the oligomer's blocks can additionally shrink the complexes' length and its distribution.54
Self-limited complexes of various molecularity levels can be obtained by varying duplex block length, linker length, and nucleotide content and terminal nucleotides in the duplex blocks and by bending the duplex block.21,22,28,33,34 Efficient assembly of a self-limited complex can be realized if lengths of the blocks are the same. For example, we found that oligonucleotides with duplex-forming blocks of 20 nt can give rise to self-limited complexes without any linkers (Fig. 4). When the duplex block lengths are very different (for example, 7 and 20 bp) and total linker length does not exceed their difference, then assembly of concatemers will be observed.25 On the other hand, introduction of long enough linker(s) whose length is greater than the difference between duplexes may result in self-limited complexes (Fig. 1i). The effect of linker length studied here sometimes gave unexpected results. The absence or single-nucleotide dT linker(s) resulted in concatemer complexes. In other cases, one or more self-limited complexes were obtained (Table 1). Complex molecularity varies even with identical linkers and among various duplex sizes resulting from the 3′- to 5′-end distance. This phenomenon was demonstrated with 10 and 15 bp blocks and flexible non-nucleotide linkers for M20D/N20D and M30D/N30D. The presence of a dTn linker 1–2 nt long most probably does not disrupt the stacking in the nicks fully.63 In this case, linkers may form bulges. As a consequence, terminal base pairs engage in a stacking interaction even less efficiently than without linkers (concatemer complexes). This state of affairs causes bending of the complex, similar to that in a bulge loop, thereby leading to circularization of the complex.29 Large circular noncovalent complexes are very flexible and change geometry easily. This property yielded diffuse bands on the gel electrophoresis image. Determination of these complexes' molecularity is problematic. An increase in the length of the linker yields a set of complexes of various sizes or a single type of associate. The most important points for the design of complexes of a defined type were formulated after simultaneous analysis of gel shift assays summarized in Table 2 and illustrated in Fig. 11. We can say that the assembly of a concatemer or self-limited complexes may be based on one or more oligonucleotides according to the same principles as those of oligomer architecture.
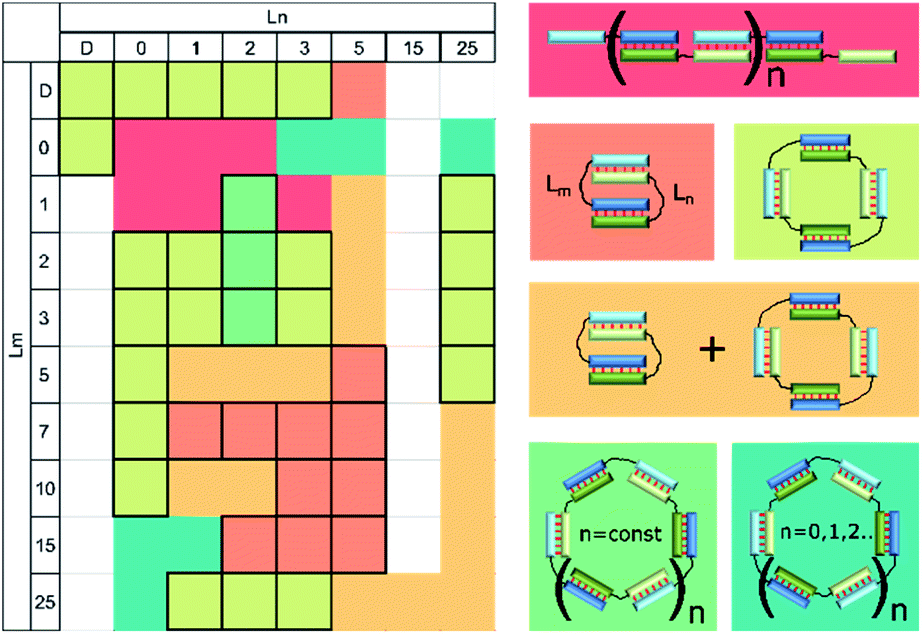 | ||
| Fig. 11 Heat map showing the types of complexes formed by a pair of oligodeoxyribonucleotides with 10 nucleotide duplex blocks and various linkers: concatemer (red); bimolecular complex (salmon); tetramolecular (light green); a mixture of a bimolecular and tetramolecular (orange); oligomeric single type (green); a mixture of a set of different type oligomeric (dark green). Unstudied complexes shown in white. Ln and Lm are linkers according to the designations in Fig. 1 and Table 1. Cells with all boundaries indicate complexes of a single type. | ||
The proposed approach to the determination of circular-complex molecularity involves three stages: (1) identification of self-limited complex(es) (by a gel shift assay) that have distinct shapes of band(s), (2) confirmation of the absence of overhangs in the nucleic acids' complexes via the addition of short overhang-binding oligonucleotide(s) of S-type, and (3) the stepwise increase of the elongated toehold-binding oligonucleotide that opens the self-limited complex(es) and results in one or several complexes of different molecularity with a single overhang. The number of these complexes multiplied by two is the molecularity of the self-limited complex. The proposed method for the confirmation of complex molecularity is suitable for complexes of 2–8 blocks. It involves identification of linearized complexes with stepwise addition of toehold-binding oligomers. The development of a method for accurate determination of the molecularity of self-limited noncovalent oligonucleotide complexes is still a challenge. Formation of covalent complexes by enzymatic or chemical ligation/digestion, introduction of interchain cross-links, or the lengthening proposed here have a major drawback. Any changes in primary or chemical structure of oligonucleotides or in the concentration of oligonucleotides or complexes in an equilibrium solution induce alterations in the molecularity of complexes. This concept was taken into consideration in the proposed approach involving oligonucleotide lengthening with an analysis of redistribution of complexes to determine molecularity. Nevertheless, using loops of a self-limited complex for “opening” it can give some unexpected results. For example, as stated herein, brushlike complexes can assemble from an oligonucleotide with a short homonucleotide block (dA5) and a long complementary block (dTn, n > 10) of another oligonucleotide.
Conclusions
Here we present a comprehensive study on the formation of various types of complexes from a pair of oligonucleotides with two transposed complementary blocks, which can be connected through a nucleotide or non-nucleotide linker. The proposed methodology for proving self-limited complex formation and for determining its molecularity is based on the “opening” of self-limited complexes by means of an oligonucleotide that effectively binds to one of duplex-forming blocks. The thermodynamic model of self-limited complex opening was analyzed theoretically to choose the length and nucleotide sequence of the oligomer-opener. The proposed approach was applied to experimental confirmation of putative molecularity of a number of complexes. The complexes afforded by a pair of oligonucleotides with different block lengths and linker sizes and types were investigated theoretically and by several experimental techniques (a gel shift assay, AFM, and UV melting analysis) as well as via MD simulations. The results uncovered wide diversity of complexes that can assemble from only a pair of oligonucleotides. The design of self-limited associates, concatemeric complexes, or their mixture can be performed by varying the size of a duplex and loop-forming blocks in oligonucleotides or by introduction of overhangs and chemical modifications. Moreover, terminal base pairs of the duplexes and the nature, length, and sequence of the linkers or overhangs substantially influence the type and molecularity of the resultant complex. In addition, the thermodynamics of oligomer binding, including buffering conditions (solution temperature, cation concentration, and equilibration), are an important factor for complexation. The influence of all these factors should be taken into account during the development of nucleic-acid-based constructs. Their analysis is necessary for rational design of oligonucleotide complexes of a given structure, geometry, and molecularity. Our study sheds light on the principles of rational design of self-limited oligonucleotide complexes of desired structure, shape, and molecularity.The data obtained are useful for various fields of biology, biotechnology, bionanotechnology18,19 and biomedicine.64 Probably, constructs like a bimolecular self-limiting complex can be realized in biological processes, such as interactions in chromatin between two parts of DNA, during NA processing associated with the formation of loops in nucleic acids, or similar structures can be formed by RNA, or DNA and RNA, for example, associated with the topologically associated domains (TAD),65 slipped loop structures (SLS) or inverted repeats.66 The results of the study will help designing small circular synthetic nucleic acids for studying their biological role and applications in biotechnology and synthetic biology. Moreover, self-limited complexes can be used in therapy for improved delivery of nucleic acids.
Author contributions
A. A. Z., V. M. G. and V. A. K. contributed equally to this work, A. A. L. and D. V. P. conceptualization; A. A. L. and G. Y. S. methodology; A. A. L., D. V. P. and V. M. G. formal analysis; A. A. Z. and V. A. K. PAGE investigation; V. M. G., A. A. L., G. Y. S. and V. A. K. AFM investigation; V. A. K. and A. A. Z. UV melting; A. A. L. and V. A. K. theoretical analysis; V. M. G. MD simulation; A. A. L. and D. V. P. resources. All authors discussed the results and provided constructive comments to the final manuscript.Conflicts of interest
There are no conflicts to declare.Acknowledgements
The reported study was supported by RFBR, project number 20-04-00719 in part of study of linkers properties on complex formation and general analysis. The conception of the study, part of theoretical analysis and identification of complexes molecularity supported Russian State basic budgetary funding 121031300042-1. We acknowledge the Siberian Supercomputer Center of the Siberian Branch of the Russian Academy of Sciences for the computational facility. We thank our colleague Tatyana Bushueva for the synthesis and purification of oligonucleotides.Notes and references
- T.-H. Wu, C.-C. Chang, C.-H. Yang, W.-Y. Lin, T. J. Ee and C.-W. Lin, Int. J. Mol. Sci., 2020, 21, 3216 CrossRef CAS PubMed.
- J. Liu, Z. Wang, S. Zhao and B. Ding, Nano Res., 2018, 11, 5017–5027 CrossRef CAS.
- A. Lacroix, E. Vengut-Climent, D. De Rochambeau and H. F. Sleiman, ACS Cent. Sci, 2019, 5, 882–891 CrossRef CAS PubMed.
- E. Sameiyan, E. Bagheri, M. Ramezani, M. Alibolandi, K. Abnous and S. M. Taghdisi, Biosens. Bioelectron., 2019, 143, 111662 CrossRef CAS PubMed.
- A. Jaekel, P. Stegemann and B. Saccà, Molecules, 2019, 24, 3694 CrossRef CAS PubMed.
- D. Yang, Y. Tang and P. Miao, Trends Anal. Chem., 2017, 94, 1–13 CrossRef CAS.
- X. Wu, T. Wu, J. Liu and B. Ding, Adv. Healthcare Mater., 2020, 9 Search PubMed.
- K. E. Bujold, A. Lacroix and H. F. Sleiman, Chem, 2018, 4, 495–521 CAS.
- G. Yao, F. Zhang, F. Wang, T. Peng, H. Liu, E. Poppleton, P. Šulc, S. Jiang, L. Liu, C. Gong, X. Jing, X. Liu, L. Wang, Y. Liu, C. Fan and H. Yan, Nat. Chem., 2020, 12, 1067–1075 CrossRef CAS PubMed.
- H. Yu, D. T. L. Alexander, U. Aschauer and R. Häner, Angew. Chem., 2017, 129, 5122–5126 CrossRef.
- M. J. Campolongo, S. J. Tan, J. Xu and D. Luo, Adv. Drug Delivery Rev., 2010, 62, 606–616 CrossRef CAS PubMed.
- H. H. Fakih, J. J. Fakhoury, D. Bousmail and H. F. Sleiman, ACS Appl. Mater. Interfaces, 2019, 11, 13912–13920 CrossRef CAS PubMed.
- N. Seeman, Nat. Biotechnol., 1999, 17, 11 CrossRef.
- P. Wang, T. A. Meyer, V. Pan, P. K. Dutta and Y. Ke, Chem, 2017, 2, 359–382 CAS.
- J. F. Berengut, C. K. Wong, J. C. Berengut, J. P. K. Doye, T. E. Ouldridge and L. K. Lee, ACS Nano, 2020, 14, 17428–17441 CrossRef CAS PubMed.
- K. Tapio and I. Bald, Multifunct. Mater., 2020, 3, 032001 CrossRef CAS.
- C. M. Platnich, F. J. Rizzuto, G. Cosa and H. F. Sleiman, Chem. Soc. Rev., 2020, 49, 4220–4233 RSC.
- X. Liang, L. Li, J. Tang, M. Komiyama and K. Ariga, Bull. Chem. Soc. Jpn., 2020, 93, 581–603 CrossRef CAS.
- Y. Chen, F. Wang, J. Feng and C. Fan, Matter, 2021, 4, 3121–3145 CrossRef CAS.
- X. Yan, S. Huang, Y. Wang, Y. Tang and Y. Tian, Nanomaterials, 2020, 10, 2047 CrossRef CAS PubMed.
- V. A. Brylev, A. V. Ustinov, V. B. Tsvetkov, N. A. Barinov, I. O. Aparin, K. A. Sapozhnikova, Y. Y. Berlina, E. A. Kokin, D. V. Klinov, T. S. Zatsepin and V. A. Korshun, Langmuir, 2020, 36, 15119–15127 CrossRef CAS PubMed.
- I. Yildirim, I. Eryazici, S. T. Nguyen and G. C. Schatz, J. Phys. Chem. B, 2014, 118, 2366–2376 CrossRef CAS PubMed.
- J. Shi and D. E. Bergstrom, Angew. Chem., Int. Ed. Engl., 1997, 36, 111–113 CrossRef CAS.
- N. G. Dolinnaya and Z. A. Shabarova, Russ. Chem. Bull., 1996, 45, 1787–1809 CrossRef.
- N. S. Filippov, A. A. Lomzov and D. V. Pyshnyi, Biophysics, 2009, 54, 280–290 CrossRef.
- F. Quadrifoglio, G. Manzini, K. Dinkelspiel and R. Crea, Nucleic Acids Res., 1982, 10, 3759–3768 CrossRef CAS PubMed.
- G. D. Hamblin, J. F. Rahbani and H. F. Sleiman, Nat. Commun., 2015, 6, 7065 CrossRef CAS PubMed.
- D. V. Pyshnyi, G. Y. Shevelev, D. V. Sheglov, D. A. Stetsenko, A. V. Latyshev, O. A. Vinogradova and A. A. Lomzov, J. Nanosci. Nanotechnol., 2014, 15, 4170–4177 Search PubMed.
- A. A. Lomzov, E. V. Eremeeva, D. V. Pyshnyi, I. A. Pyshnaya and O. A. Vinogradova, Russ. J. Bioorg. Chem., 2009, 35, 349–359 CrossRef PubMed.
- L. Song, Y. Zhang, J. Li, Q. Gao, H. Qi and C. Zhang, Appl. Spectrosc., 2016, 70, 688–694 CrossRef CAS PubMed.
- C. Zhang, J. Chen, R. Sun, Z. Huang, Z. Luo, C. Zhou, M. Wu, Y. Duan and Y. Li, ACS Sens., 2020, 5, 2977–3000 CrossRef CAS PubMed.
- F. Xuan and I. M. Hsing, J. Am. Chem. Soc., 2014, 136, 9810–9813 CrossRef CAS PubMed.
- C. K. McLaughlin, G. D. Hamblin, K. D. Hänni, J. W. Conway, M. K. Nayak, K. M. M. Carneiro, H. S. Bazzi and H. F. Sleiman, J. Am. Chem. Soc., 2012, 134, 4280–4286 CrossRef CAS PubMed.
- T. Trinh, D. Saliba, C. Liao, D. de Rochambeau, A. L. Prinzen, J. Li and H. F. Sleiman, Angew. Chem., 2019, 131, 3074–3079 CrossRef.
- I. Eryazici, T. R. Prytkova, G. C. Schatz and S. T. Nguyen, J. Am. Chem. Soc., 2010, 132, 17068–17070 CrossRef CAS PubMed.
- A. A. Yolov, E. S. Gromova and Z. A. Shabarova, Mol. Biol. Rep., 1985, 10, 173–176 CrossRef CAS PubMed.
- D. V. Pyshnyi, A. A. Lomzov, I. A. Pyshnaya and E. M. Ivanova, J. Biomol. Struct. Dyn., 2006, 23, 567–579 CrossRef CAS PubMed.
- E. G. Richards, Use of tables in calculation of absorption, optical rotatory dispersion and circular dichroism of polyribonucleotides, 1975, vol. 1 Search PubMed.
- A. A. Lomzov, E. M. Ivanova, V. F. Zarytova, I. A. Pyshnaya and D. V. Pyshnyi, Nucleosides, Nucleotides Nucleic Acids, 2004, 23, 1065–1071 CrossRef PubMed.
- D. Nečas and P. Klapetek, Cent. Eur. J. Phys., 2012, 10 Search PubMed.
- E. F. Pettersen, T. D. Goddard, C. C. Huang, G. S. Couch, D. M. Greenblatt, E. C. Meng and T. E. Ferrin, J. Comput. Chem., 2004, 25, 1605–1612 CrossRef CAS PubMed.
- G. D. A. Case, D. S. Cerutti, T. A. Darden, R. E. Duke, T. J. Giese, H. Gohlke, A. W. Goetz, D. Greene, N. Homeyer, S. Izadi, A. Kovalenko, T. S. Lee, S. LeGrand, P. Li, C. Lin, J. Liu, T. Luchko, R. Luo, D. Mermelstein, K. M. Merz, G. Monard, H. Monard, I. Nguyen, A. Omelyan, F. Onufriev, R. Pan, D. R. Qi, A. Roe, C. Roitberg, C. L. Sagui, W. M. Simmerling, J. Botello-Smith, R. C. Swails, J. Walker, R. M. Wang, X. Wolf, L. Wu, D. M. Xiao and P. A. Kollman, AMBER 14, University of California, San Francisco Search PubMed.
- M. J. Frisch, G. W. Trucks, H. B. Schlegel, G. E. Scuseria, M. A. Robb, J. R. Cheeseman, G. Scalmani, V. Barone, B. Mennucci, G. A. Petersson, et al, Gaussian 09, revision E.1, Gaussian, Inc., Wallingford, CT, 2009 Search PubMed.
- F. Y. Dupradeau, C. Cézard, R. Lelong, É. Stanislawiak, J. Pêcher, J. C. Delepine and P. Cieplak, Nucleic Acids Res., 2008, 36, 360–367 CrossRef PubMed.
- I. Ivani, P. D. Dans, A. Noy, A. Pérez, I. Faustino, A. Hospital, J. Walther, P. Andrio, R. Goñi, A. Balaceanu, G. Portella, F. Battistini, J. L. Gelpí, C. González, M. Vendruscolo, C. A. Laughton, S. A. Harris, D. A. Case and M. Orozco, Nat. Methods, 2015, 13, 55–58 CrossRef PubMed.
- J. Wang, R. M. Wolf, J. W. Caldwell, P. A. Kollman and D. A. Case, J. Comput. Chem., 2004, 25, 1157–1174 CrossRef CAS PubMed.
- I. S. Joung and T. E. Cheatham, J. Phys. Chem. B, 2008, 112, 9020–9041 CrossRef CAS PubMed.
- A. A. Lomzov, Y. N. Vorobjev and D. V. Pyshnyi, J. Phys. Chem. B, 2015, 119, 15221–15234 CrossRef CAS PubMed.
- A. A. Lomzov, I. A. Pyshnaya, E. M. Ivanova and D. V. Pyshnyi, Dokl. Biochem. Biophys., 2006, 409, 211–215 CrossRef CAS PubMed.
- J. SantaLucia and D. Hicks, Annu. Rev. Biophys. Biomol. Struct., 2004, 33, 415–440 CrossRef CAS PubMed.
- J. M. Schaeffer, N. Srinivas, T. E. Ouldridge, S. Petr, B. Yurke, A. A. Louis, J. P. K. Doye and E. Winfree, Nucleic Acids Res., 2013, 41, 10641–10658 CrossRef PubMed.
- S. Badelt, C. Grun, K. V. Sarma, B. Wolfe, S. W. Shin and E. Winfree, J. R. Soc., Interface, 2020, 17, 20190866 CrossRef CAS PubMed.
- S. Shah, J. Wee, T. Song, L. Ceze, K. Strauss, Y. Chen and J. Reif, J. Am. Chem. Soc., 2020, 142, 9587–9593 CAS.
- D. V. Pyshnyi, N. S. Filippov and A. A. Lomzov, Vestnik Novosibirsk State University. Series: Physics, 2011, 4, 115–124 Search PubMed.
- A. Tsourkas, M. A. Behlke, S. D. Rose and G. Bao, Nucleic Acids Res., 2003, 31, 1319–1330 CrossRef CAS PubMed.
- S. Bellaousov, J. S. Reuter, M. G. Seetin and D. H. Mathews, Nucleic Acids Res., 2013, 41, W471–W474 CrossRef PubMed.
- V. M. Golyshev, T. V. Abramova, D. V. Pyshnyi and A. A. Lomzov, Biophys. Chem., 2018, 234, 24–33 CrossRef CAS PubMed.
- A. Aliano, G. Cicero, H. Nili, N. G. Green, P. García-Sánchez, A. Ramos, A. Lenshof, T. Laurell, A. Qi, P. Chan, L. Yeo, J. Friend, M. Evander, T. Laurell, A. Lenshof, T. Laurell, J. Chen, J. C. Lacroix, P. Martin, H. Randriamahazaka, W. J. P. Barnes, B. W. Hoogenboom, K. Fukuzawa, H. Hölscher, H. Hölscher, A. Bottos, E. Astanina, L. Primo, F. Bussolino, X. Gao, V.-N. Phan, N.-T. Nguyen, C. Yang, P. Abgrall, F. G. Barth, P. Gurman, Y. Rosen, O. Auciello, C. J. Kähler, C. Cierpka, M. Rossi, B. Bhushan, M. L. B. Palacio and C. L. Dezelah, in Encyclopedia of Nanotechnology, Springer Netherlands, Dordrecht, 2012, pp. 99–99 Search PubMed.
- O. A. Krumkacheva, G. Y. Shevelev, A. A. Lomzov, N. S. Dyrkheeva, A. A. Kuzhelev, V. V. Koval, V. M. Tormyshev, Y. F. Polienko, M. V. Fedin, D. V. Pyshnyi, O. I. Lavrik and E. G. Bagryanskaya, Nucleic Acids Res., 2019, 47, 7767–7780 CrossRef CAS PubMed.
- J. H. Chen, N. R. Kallenbach and N. C. Seeman, J. Am. Chem. Soc., 1989, 111, 6402–6407 CrossRef CAS.
- P. Várnai and Y. Timsit, Nucleic Acids Res., 2010, 38, 4163–4172 CrossRef PubMed.
- A. Vologodskii and V. V. Rybenkov, Phys. Chem. Chem. Phys., 2009, 11, 10543 RSC.
- J. Becaud, I. Pompizi and C. J. Leumann, J. Am. Chem. Soc., 2003, 125, 15338–15342 CrossRef CAS PubMed.
- R. Helma, P. Bažantová, M. Petr, M. Adámik, D. Renčiuk, V. Tichý, A. Pastuchová, Z. Soldánová, P. Pečinka, R. P. Bowater, M. Fojta and M. Brázdová, Molecules, 2019, 24, 2078 CrossRef CAS PubMed.
- J. A. Beagan and J. E. Phillips-Cremins, Nat. Genet., 2020, 52, 8–16 CrossRef CAS PubMed.
- W. M. Guiblet, M. A. Cremona, R. S. Harris, D. Chen, K. A. Eckert, F. Chiaromonte, Y.-F. Huang and K. D. Makova, Nucleic Acids Res., 2021, 49, 1497–1516 CrossRef CAS PubMed.
Footnotes |
| † Electronic supplementary information (ESI) available. See DOI: 10.1039/d2ra00155a |
| ‡ Authors contributed equally to this work. |
| This journal is © The Royal Society of Chemistry 2022 |