
 Open Access Article
 This Open Access Article is licensed under a Creative Commons Attribution-Non Commercial 3.0 Unported Licence
Cinnamaldehyde–cucurbituril complex: investigation of loading efficiency and its role in enhancing cinnamaldehyde in vitro anti-tumor activity
Bayan Al Tbakhia,
Hamdi Nsairat b,
Walhan Alshaerc,
Abdulfattah Al-Kadashd,
Wissam Helala,
Lubna Alrawashdehe,
Anthony Dayf,
Khaleel I. Assafg,
Rola Hassouneha,
Fadwa Odeh*a and
Abeer Al Bawab*ah
b,
Walhan Alshaerc,
Abdulfattah Al-Kadashd,
Wissam Helala,
Lubna Alrawashdehe,
Anthony Dayf,
Khaleel I. Assafg,
Rola Hassouneha,
Fadwa Odeh*a and
Abeer Al Bawab*ah
aDepartment of Chemistry, School of Science, The University of Jordan, Amman 11942, Jordan. E-mail: f.odeh@ju.edu.jo; Tel: +962-979250409
bPharmacological and Diagnostic Research Centre, Faculty of Pharmacy, Al-Ahliyya Amman University, Amman 19328, Jordan
cCell Therapy Center, The University of Jordan, Amman 11942, Jordan
dSchool of Medicine, The University of Jordan, Amman 11942, Jordan
eDepartment of Chemistry, Faculty of Science, The Hashemite University, P. O. Box 330127, Zarqa 13133, Jordan
fSchool of Science, The University of New South Wales, Canberra, ACT 2600, Australia
gDepartment of Chemistry, Al-Balqa Applied University, Al-Salt 19117, Jordan
hHamdi Mango Center for Scientific Research, The University of Jordan, Amman 11942, Jordan. E-mail: drabeer@ju.edu.jo; Tel: +962-796661601
First published on 8th March 2022
Abstract
This study aimed to clarify the physico-chemical properties of cucurbit[7]uril (CB[7]) and cinnamaldehyde (Cinn) inclusion complexes (CB[7]–Cinn) and their resulting antitumor activity. CB[7]–Cinn inclusion complexes were prepared by a simple experimental approach and fully characterized for their stoichiometry, formation constant, particle size and morphology. Quantum chemical calculations were performed to elucidate the stable molecular structures of the inclusion complexes and their precursors and to investigate the probable stoichiometry and direction of interaction using three different DFT functionals at the 6-31G(d,p) basis set. The UV-vis spectrophotometric titrations as well as the Job plot, based on 1H NMR spectroscopy, suggested 1![[thin space (1/6-em)]](https://www.rsc.org/images/entities/char_2009.gif) :1 and 1:2 stoichiometries of CB[7]:Cinn. The formation constants of the complexes were calculated using Benesi–Hildebrand equations and non-linear fittings. Moreover, the theoretical calculations confirmed the potential formation of 1:1 and 1:2 stoichiometries and clarify the orientation of binding from the Cinn phenyl moiety. The nanoparticles' TEM images showed a crystal-like spherical shape, smooth surface, with a small tendency to agglomerate. CB[7]–Cinn inclusion complexes were analyzed for their antitumor activity against MDA-MB-231 breast cancer and U-87 glioblastoma cell lines. The IC50 values were calculated after 72 hours of incubation with different concentrations of CB[7]–Cinn inclusion complexes and compared to free Cinn and free CB[7]. The IC50 values for free Cinn and CB[7]–Cinn inclusion complexes were 240.17 ± 32.46 μM and 260.47 ± 20.83 μM against U-87 cells and 85.93 ± 3.35 μM and 176.3 ± 7.79 μM against MDA-MB-231 cells, respectively, despite the enhanced aqueous solubility. No significant cytotoxicity was noticed for the free CB[7].
:1 and 1:2 stoichiometries of CB[7]:Cinn. The formation constants of the complexes were calculated using Benesi–Hildebrand equations and non-linear fittings. Moreover, the theoretical calculations confirmed the potential formation of 1:1 and 1:2 stoichiometries and clarify the orientation of binding from the Cinn phenyl moiety. The nanoparticles' TEM images showed a crystal-like spherical shape, smooth surface, with a small tendency to agglomerate. CB[7]–Cinn inclusion complexes were analyzed for their antitumor activity against MDA-MB-231 breast cancer and U-87 glioblastoma cell lines. The IC50 values were calculated after 72 hours of incubation with different concentrations of CB[7]–Cinn inclusion complexes and compared to free Cinn and free CB[7]. The IC50 values for free Cinn and CB[7]–Cinn inclusion complexes were 240.17 ± 32.46 μM and 260.47 ± 20.83 μM against U-87 cells and 85.93 ± 3.35 μM and 176.3 ± 7.79 μM against MDA-MB-231 cells, respectively, despite the enhanced aqueous solubility. No significant cytotoxicity was noticed for the free CB[7].
1. Introduction
Most cytotoxic anticancer drugs are organic compounds with low aqueous solubility, are unstable, and have poor bioavailability.1 To overcome these drawbacks, nanomedicine offers solutions to enhance water solubility and minimize drug toxicity.2 Cinnamaldehyde (Cinn, (2E)-3-phenylprop-2-enal, Fig. 1a), the main active component of cinnamon oil, is a viscous liquid effective as an antibacterial, anti-inflammation, antivirus, and anticancer agent.3–8 However, Cinn has low aqueous solubility and is easily oxidized by air,9 thus limiting its pharmacological usage and bioavailability. To improve the pharmaceutical properties and enhance the aqueous solubility and stability and/or reduce drugs' toxicity of lipophilic potential drugs, synthetic or naturally occurring complexing hosts, such as cyclodextrins (CDs), crown ethers, and calixarenes, have been extensively investigated and used as drug carriers.10,11 Most drug delivery systems depended on the ability of certain hydrophilic macrocyclic compounds to act as a molecular carrier for lipophilic drugs.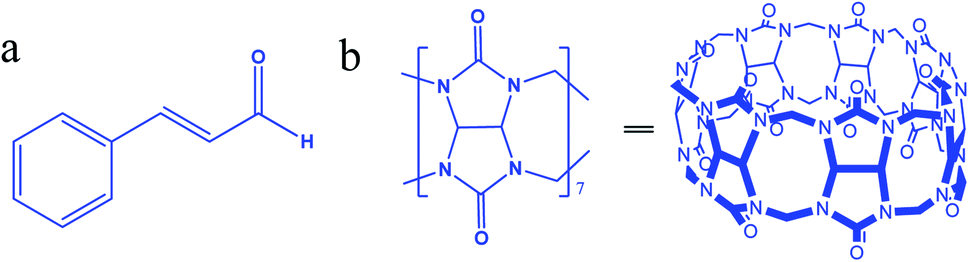 | ||
| Fig. 1 Chemical structure of (a) cinnamaldehyde and (b) cucurbit[7]uril. | ||
Cinn complexes with cyclodextrins and their derivatives were synthesized and investigated.12–17 However, other macrocyclic compound, such as cucurbit[7]uril (Fig. 1b), may act as drug carriers.
Cucurbit[n]urils (CB[n]), a new family of synthetic macrocyclic hosting agents composed of glycoluril (Fig. 1b) repeated units to form a molecular container.18 The CB[n] family members have common characteristics, such as a hydrophobic cavity and two identical opening hydrophilic entrances. In addition, the varying cavity and portal sizes lead to the formation of inclusion complexes with different molecules through a combination of ion-dipole, hydrogen bonding, and hydrophobic interactions.19 Toxicity studies proved that CB[n]s are biocompatible with low toxicity in the intravenous and oral administration routes.20 The host–guest features of CB[n] have a wide range of applications in nanomachines, self-assembly, drug delivery, the removal of wastes, and in chromatography.19 Moreover, the reversibility of the host–guest complexation process allows full or partial binding of the biological or medicinal activity of the complexed pharmaceutical agents.8
Among CB[n]s, CB[6] and CB[8] are almost insoluble in water, whereas CB[7] has a moderate solubility (2 × 10⁻² mol L−1), which is similar to the commonly used complexing host, β-cyclodextrin (with a solubility of 1.6 × 10⁻² mol L−1 in water). Moreover, the suitable size of cavity (7.3 Å diameter),21 symmetrical portals (5.4 Å diameter) and the 9.1 Å height of CB[7] make it suitable for binding certain drug molecules, such as Cinn which has a length of 8.3 Å and a height of 4.9 Å.10
Cinn is a planar molecule consisting of one aromatic ring (phenyl) connected with an aliphatic arm of three carbon atoms ending with an aldehyde. The encapsulation of Cinn into host molecules (such as β-cyclodextrin) is usually through the non-polar part of the molecules (the phenyl and aryl),14 which would enhance its water solubility, protect it from oxidation, increase its stability and may-as a potential drug-improve its activity.
In this study, we prepared and characterized CB[7]–Cinn inclusion complex using optical and spectroscopic techniques in addition to electron microscopic imaging. Moreover, a theoretical evaluation of the CB[7]–Cinn inclusion complex stoichiometry and energy measurements was performed. The anti-tumor activity of CB[7]–Cinn inclusion complex against MDA-231 and U87 cancer cell lines was also investigated.
2. Materials and methods
2.1. Chemicals
trans-Cinn (99%) was purchased from Sigma-Aldrich (USA). Cucurbit[7]uril (CB[7]) was prepared according to literature.22 D2O (99 atom% D) was purchased from Sigma-Aldrich (USA), and deionized water was prepared using Osmo Aries device (USA). Uranyl acetate reagent was obtained from Electron Microscopy Science, USA. All reagents and chemicals were used without further treatment.2.2. The formation of CB[7]–Cinn inclusion complexes
2.3. CB[7]–Cinn complexation stoichiometry and formation constants
The stoichiometry and the formation constants of CB[7]–Cinn inclusion complex were determined using the Benesi–Hildebrand equations24 based on the data from UV-vis spectrophotometry. Eqn (1) was used for 1:1 complexation and eqn (2) for 1:2 complexation.25–28
 | (1) |
 | (2) |
According to the design of Benesi–Hildebrand experiment, Z is the increasing concentration of either the host or the guest, Yo is absorbance (Ao) of Cinn. Y is absorbance (A) with a particular concentration of either the host or the guest, Y′ is absorbance (A′) at the maximum concentration of either the host or the guest. The formation constant (K) is calculated from the Benesi–Hildebrand equation,26 after plotting (1/Y − Yo) against (1/[Z]) or (1/[Z]2):
 | (3) |
The continuous variation method (Job's method) was also used to determine the complexation stoichiometry24,29 using 1H NMR spectroscopy. The experiments were performed using solutions of equimolar concentrations of the Cinn and CB[7]. The samples were prepared by mixing different volumes of these two solutions so that the total concentration remains constant and the molar fraction of Cinn or CB[7], χ varies in the range 0–1. The chemical shift differences in the presence of CB[7] in respect to the value for the free Cinn, was determined. The variation of the chemical shifts (Δδ) multiplied by Cinn or CB[7] molar ratio, is plotted versus Cinn or CB[7] mole fraction (χ). The value of χ for which the plot presents the maximum deviation gives the stoichiometry of the inclusion complex (χ = 0.5 for 1:1 or 2:2 ratio complexes; χ = 0.33 for 1:2 ratio complexes).30
2.4. Dynamic light scattering (DLS)
Nanoparticles size of the CB[7]:Cinn inclusion complex of 1:1 ratio (1 mM) was determined by dynamic light scattering (DLS) (NICOMP, USA). All samples were diluted at room temperature (25 °C) with deionized water in order to yield an appropriate counting rate.31 The stability of the nanoparticles was determined by measuring the sizes at different time points.
2.5. Electron microscopy (EM)
An aqueous solution of the optimum ratio (1:1) of CB[7]–Cinn inclusion complexes was examined for the structure and morphology using a MORGAGNI 268-FEI Transmission Electron Microscope (TEM), (Netherlands).
TEM analysis was accomplished by placing 7 μL of the diluted aqueous suspensions (1% v/v) on 300-mesh formvar copper grids (SPI supplies, USA) and left to dry overnight. The loaded grids were then stained using 2% uranyl acetate dye solution. Excess liquid on the grid was removed with filter paper and the grid was allowed to dry before being observed under Versa 3D (FEI, Netherlands) operated at 30 kV.
2.6. Computational methodology
All quantum mechanical calculations were performed using the Gaussian 09 program package.32 The molecular structures and geometries of free CB[7] and Cinn were optimized at the DFT level of theory using the Becke, 3-parameter, Lee–Yang–Parr (B3LYP) functional with 6-31G(d,p) basis set.The solvent effects were taken into account by using the conductor-like polarizable continuum model (CPCM) method with water as a solvent. Frequency calculations were performed on the optimized geometries at the same level of theory. All computed vibrational transitions have no imaginary frequency implying that each optimized geometry is located at the global minimum point on the potential energy surface. In the second step, an optimization procedure was performed in order to elucidate the stability of the 1:1 complex as a function of the direction of the aldehyde arm toward the macrocycle cavity at constant distances between both compounds. Subsequently, the 1:1 complex potential energy surface was modeled by freezing all geometry parameters, while scanning the single point energy of the complex as a function of the distance between Cinn and the center of the CB[7] macrocycle cavity, with intervals of 0.250 Å. For this step, three different hybrid functionals were used, namely: B3LYP, PBE0, and M06-2X. Finally, a second Cinn molecule was incorporated into the 1:1 complex and a new potential energy curve was computed by freezing all geometry parameters, while scanning the single point energy of the complex as a function of the distance between the second Cinn and the center of the CB[7] cavity, with intervals of 0.250 (Å). All DFT calculations were applied to both sides of Cinn compound, i.e. sides of inclusion in CB[7] host (phenyl side and aldehyde side).
2.7. In vitro cytotoxicity assay
Cytotoxic activity tests were performed against human breast adenocarcinoma (MDA-MB-231, ATCC number: HTB26) and human primary glioblastoma (U87, ATCC number: HTB-14) for CB[7]–Cinn inclusion complexes and their free precursors, Cinn and CB[7]. Cells were cultured in Dulbecco's Modified Eagle's Medium (DMEM) growth medium (Euroclone®, Italy) supplemented with 10% (v/v) fetal bovine serum (FBS), 1% (v/v) 200 mM L-glutamine, (100 IU mL−1–100 μg mL−1) penicillin–streptomycin. Cells were maintained in a humidified 5% CO2 incubator at 37 °C and used at a confluence of 75–95%.A total of 5 × 10³ cells per well were seeded in 96-well plates (TPP, Switzerland) at 37 °C and 5% CO2.33 After 24 hours, cells were treated with different concentrations of CB[7]–Cinn inclusion complexes and their free precursors, Cinn and CB[7] up to 900 μM. The cell growth was analyzed using tetrazolium dye (MTT; 3[4,5-dimethylthiazol-2-yl]-2,5-diphenyltetrazolium bromide) assay33,34 after 72 hours. Untreated cells were considered as a negative control and were used as blank to calibrate the spectrophotometer, then the absorbance was read at 570 nm using a using Glomax plate reader (Promega, USA). IC50 values were calculated using GraphPad Prism 6 (GraphPad Software Inc., USA). All experiments were performed in triplicate.
3. Results and discussion
3.1. Formation of CB[7]–Cinn inclusion complex
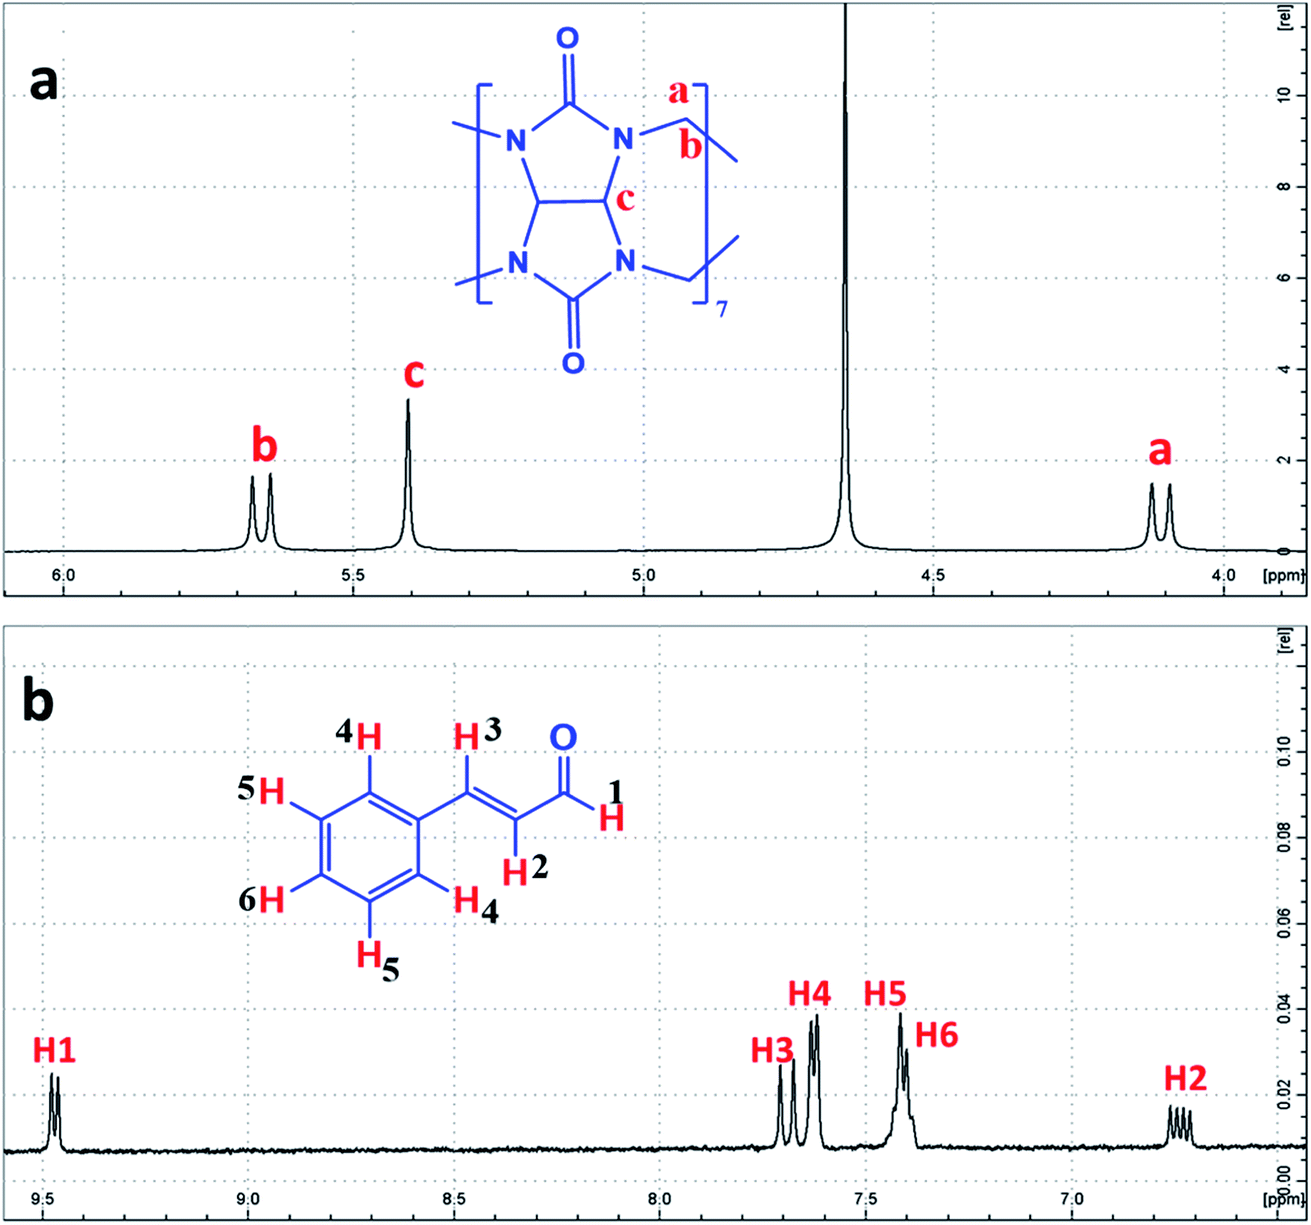 | ||
| Fig. 2 1H-NMR spectrum of (a) CB[7] and (b) Cinn, in D2O at room temperature, with the protons assigned. | ||
The formation of the CB[7]–Cinn inclusion complex was clearly evidenced by the chemical shift changes experienced by Cinn protons upon the addition of increasing amounts of CB[7] as shown in Fig. 3. The upfield shift of Cinn protons in the inclusion complex compared to the free Cinn is an indication of a more shielded and restricted microenvironment of the Cinn molecules due to complexation.35 It is clear that the phenyl protons experienced a dramatic change both in shape and chemical shift (Fig. 3) indicating a full inclusion of Cinn in CB[7] from the benzene ring as expected. Both H2 and H3 protons underwent a considerable shift, even though it was less than the shift of the phenyl protons, whereas H1 (the aldehyde proton) witnessed no shift at all.
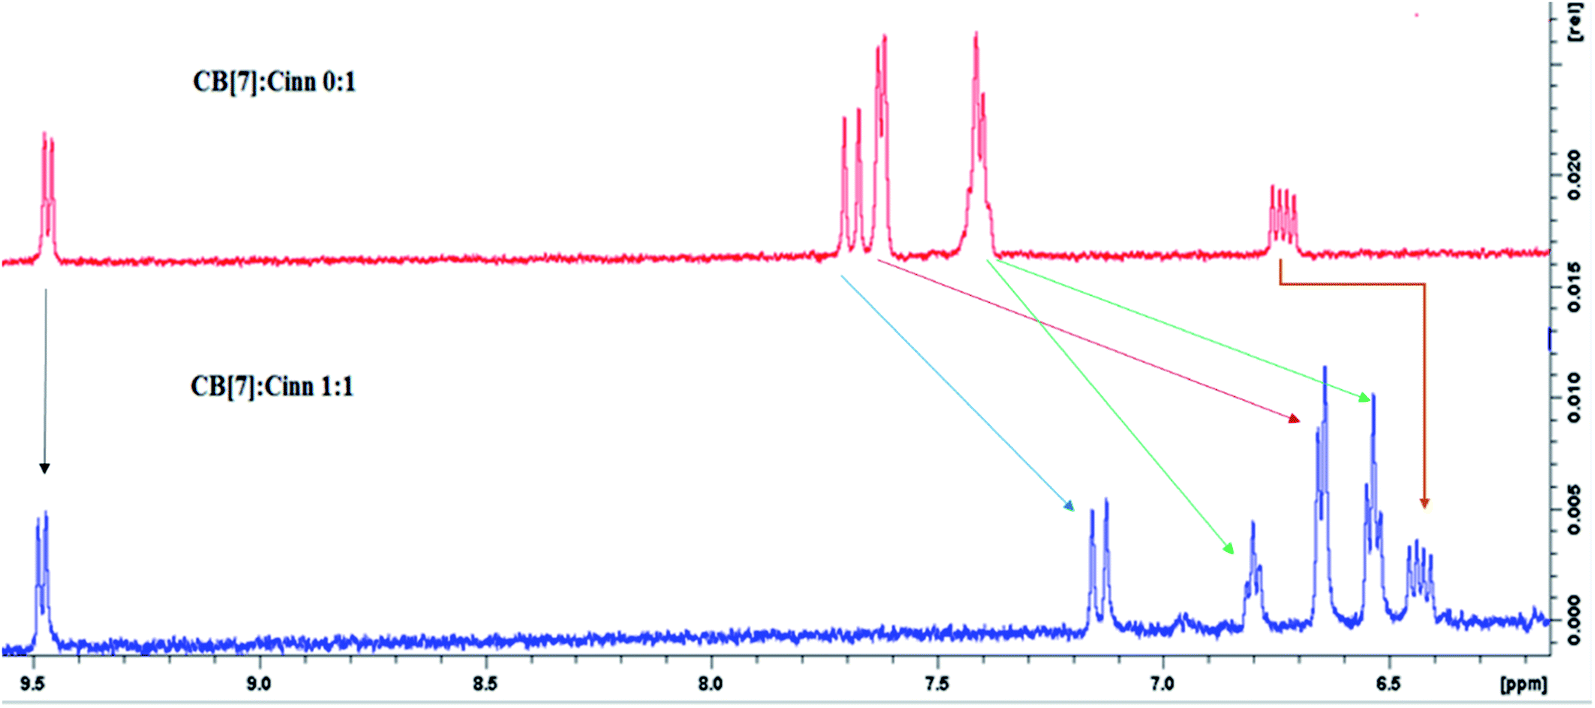 | ||
| Fig. 3 1H NMR spectra of 1:1 CB[7]–Cinn inclusion complex in D2O compared to the free Cinn in D2O. | ||
From the 1H-NMR spectra, it is obvious that the guest (Cinn) enters the CB[7] cavity from the phenyl side. These results are in good agreement with previous studies dealing with aromatic compound having the methylene side chain as reported by Sindelar and coworkers.36 They confirmed, using 1H-NMR titration, that all anthraquinone unit protons are located inside the CB[7] cavity while the methylene protons positioned outside CB[7].36
3.2. CB[7]–Cinn complexation stoichiometry and formation constants
:1 or 1:2 stoichiometry of CB[7]:Cinn, respectively.25 Fig. 4a and b represent the Benesi–Hildebrand plots for CB[7]–Cinn inclusion complex using UV-vis spectrophotometric titration for both stoichiometries. A good linear correlation was obtained for n = 1 (Fig. 4a), indicating a 1:1 stoichiometry with a formation constant (Kf) of 15.13 ± 1.99 × 10³ M−1. However, another good linear correlation with the possibility of a 1:2 stoichiometry appears from Fig. 4b, with a Kf of 620.05 ± 75.45 × 10³ M−2. The formation of inclusion complexes with 1:2 (host:guest) stoichiometry is also possible. The presence of these two stoichiometric possibilities may be attributed to solvent effects, but either ratios will not affect the spectrophotometric investigations of the inclusion complex.37
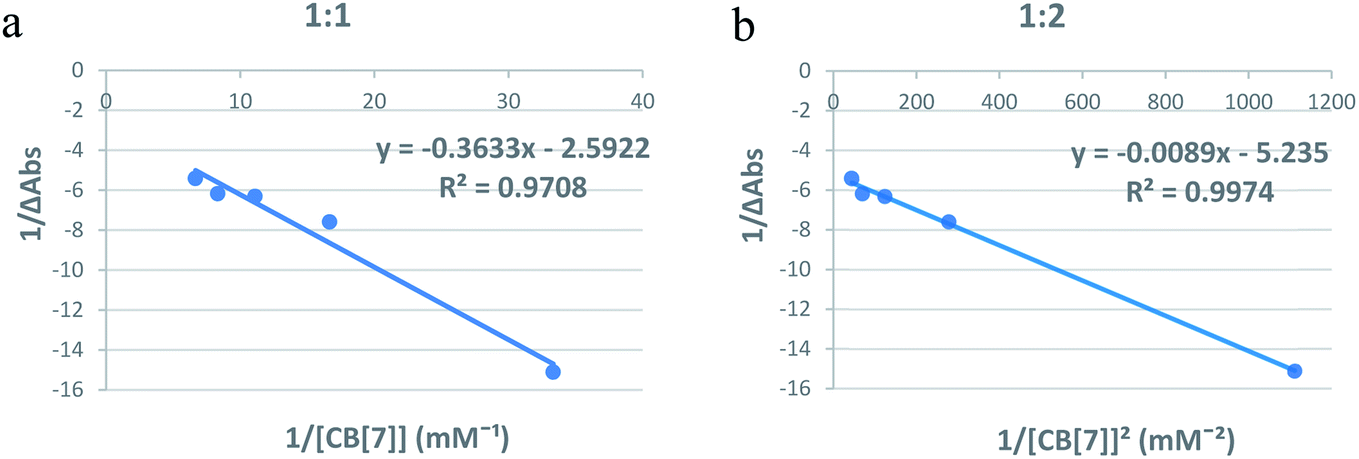 | ||
| Fig. 4 Benesi–Hildebrand plots of (a) 1/ΔA versus 1/[CB[7]] and (b) 1/ΔA versus 1/[CB[7]]2 for CB[7]–Cinn inclusion complex using UV-vis spectrophotometric titration. | ||
The Benesi–Hildebrand plots from UV-vis spectrophotometric spectroscopic data indicate the two possibilities of the formation of complexes with different stoichiometries (1:1 and 1:2 and/or 2:1 of the CB[7]–Cinn inclusion complex). Furthermore, our results are in good consistency with previous studies. For example, Koner et al. reported a binding constant values for the neutral form of albendazole into CB[7] to be 6.5 × 10⁴ M−1 in the UV titrations with CB[7].38
Continuous variation method (Job's method) using 1H-NMR titration data was also employed to determine the complexation stoichiometry. Job's plots are shown in Fig. 5a and b with respect to Cinn and CB[7], respectively, where the mole fraction of either the host or guest (χ) was varied from 0.0 to 1.0 and plotted against χ multiplied by the chemical shift difference of H3 proton of CB[7] (Fig. 6). As shown in Job's plot, two maximum peaks were obtained around χ = 0.5. These two parabola sections may point to the probability of a 1:1 and 1:2 inclusion complex between Cinn and CB[7] as evidenced in Benesi–Hildebrand plots.39,40 This may be attributed to the symmetrical portal sides of CB[7] and the small size of Cinn that led to fast equilibrium of the physical interaction between the complex precursors. The same observation was reported by Romano et al. with Cinn–α-cyclodextrin inclusion complex.41
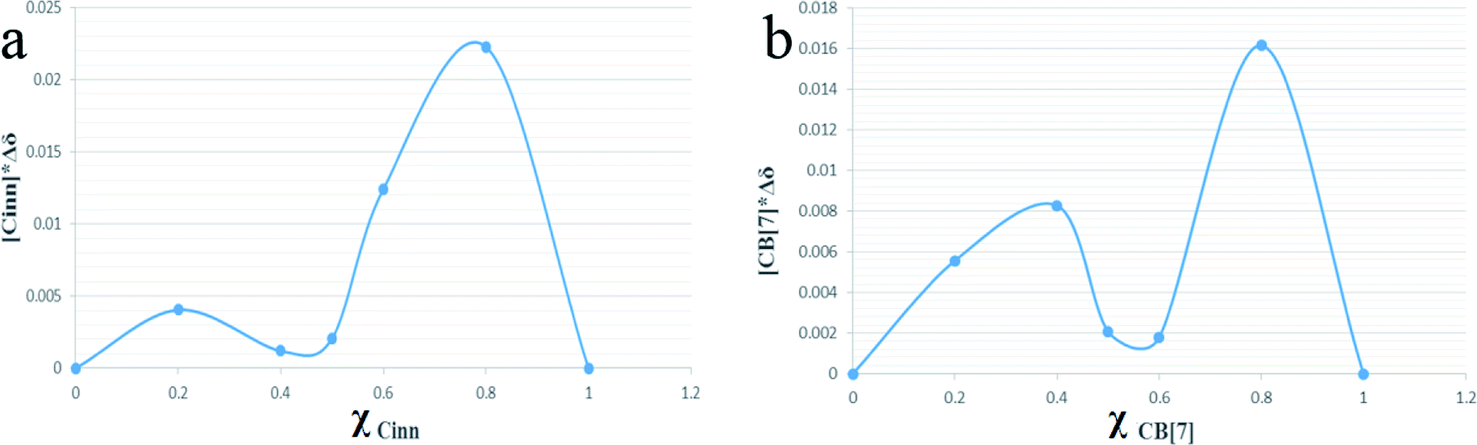 | ||
| Fig. 5 Job's plot of CB[7]–Cinn inclusion complex with respect to (a) Cinn and (b) CB[7], where χ is the mole fraction. | ||
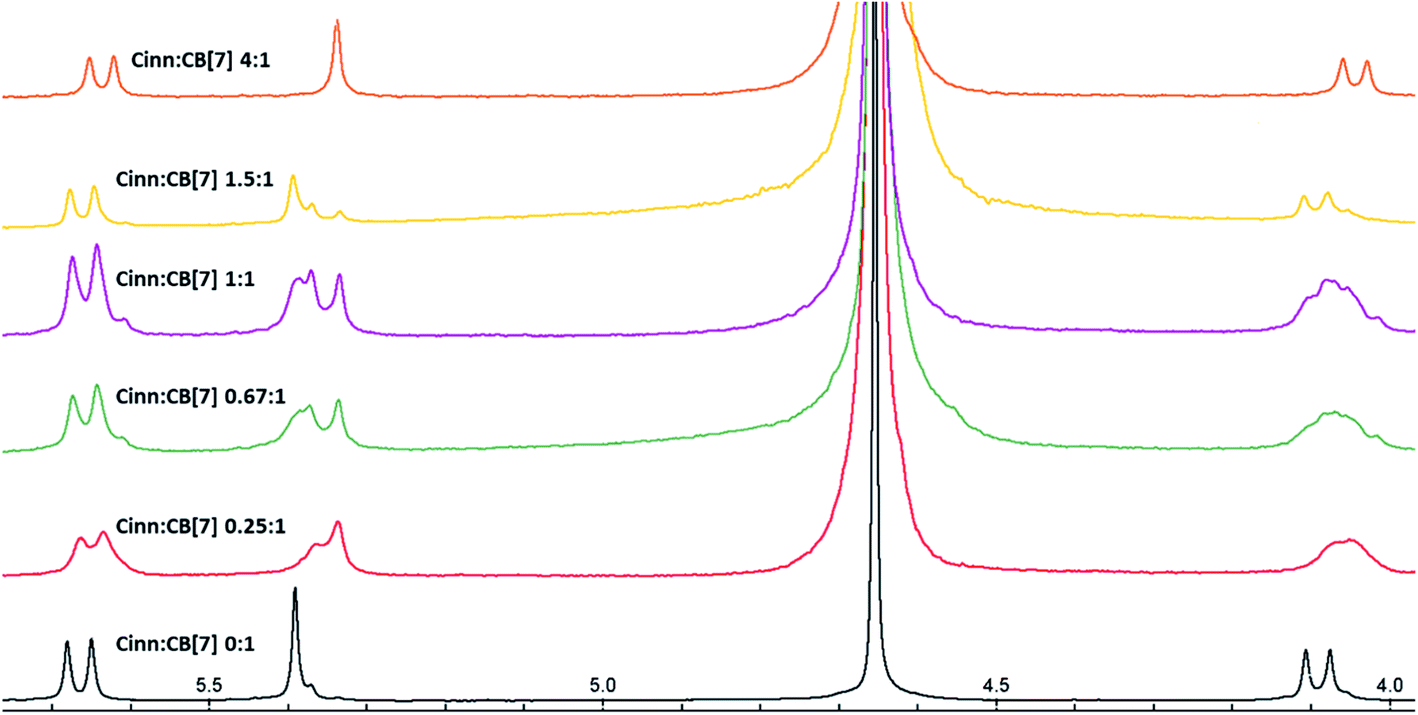 | ||
| Fig. 6 1H NMR stacked spectra in D2O solvent of Cinn with CB[7] at different mole fractions according to Job's plot method. | ||
The possibility of the formation of different inclusion complexes is clearly suggested by 1H NMR data. Fig. 6 shows the 1H NMR spectrum of CB[7] in the presence of different concentrations of Cinn. As the Cinn concentration increases, the ‘a’ protons of CB[7] start to broaden with an upfield shift suggesting the presence of different species including empty CB[7], 1:1 and 2:1 Cinn:CB[7] complexes. At a ratio of Cinn:CB[7] of 4:1, a shifted doublet exists suggesting a predominant 2:1 complex. The same trend is observed with ‘c’ protons of CB[7], a singlet at 5.39 ppm (no Cinn present). Upon the addition of Cinn, the signal starts to split in the Cinn:CB[7] ratio from 0.25:1 to 1.5:1, suggesting the presence of different species. However, when the concentration of Cinn is increased to reach 4:1 ratio, a singlet at 5.34 ppm, suggesting a predominant 2:1 complex. These results suggest that an equilibrium is present between free CB[7], a 1:1 complex (I) and 2:1 complex with two possibilities (II and III) as shown in Fig. 7. At a large excess of Cinn, a 2:1 complex is dominant.
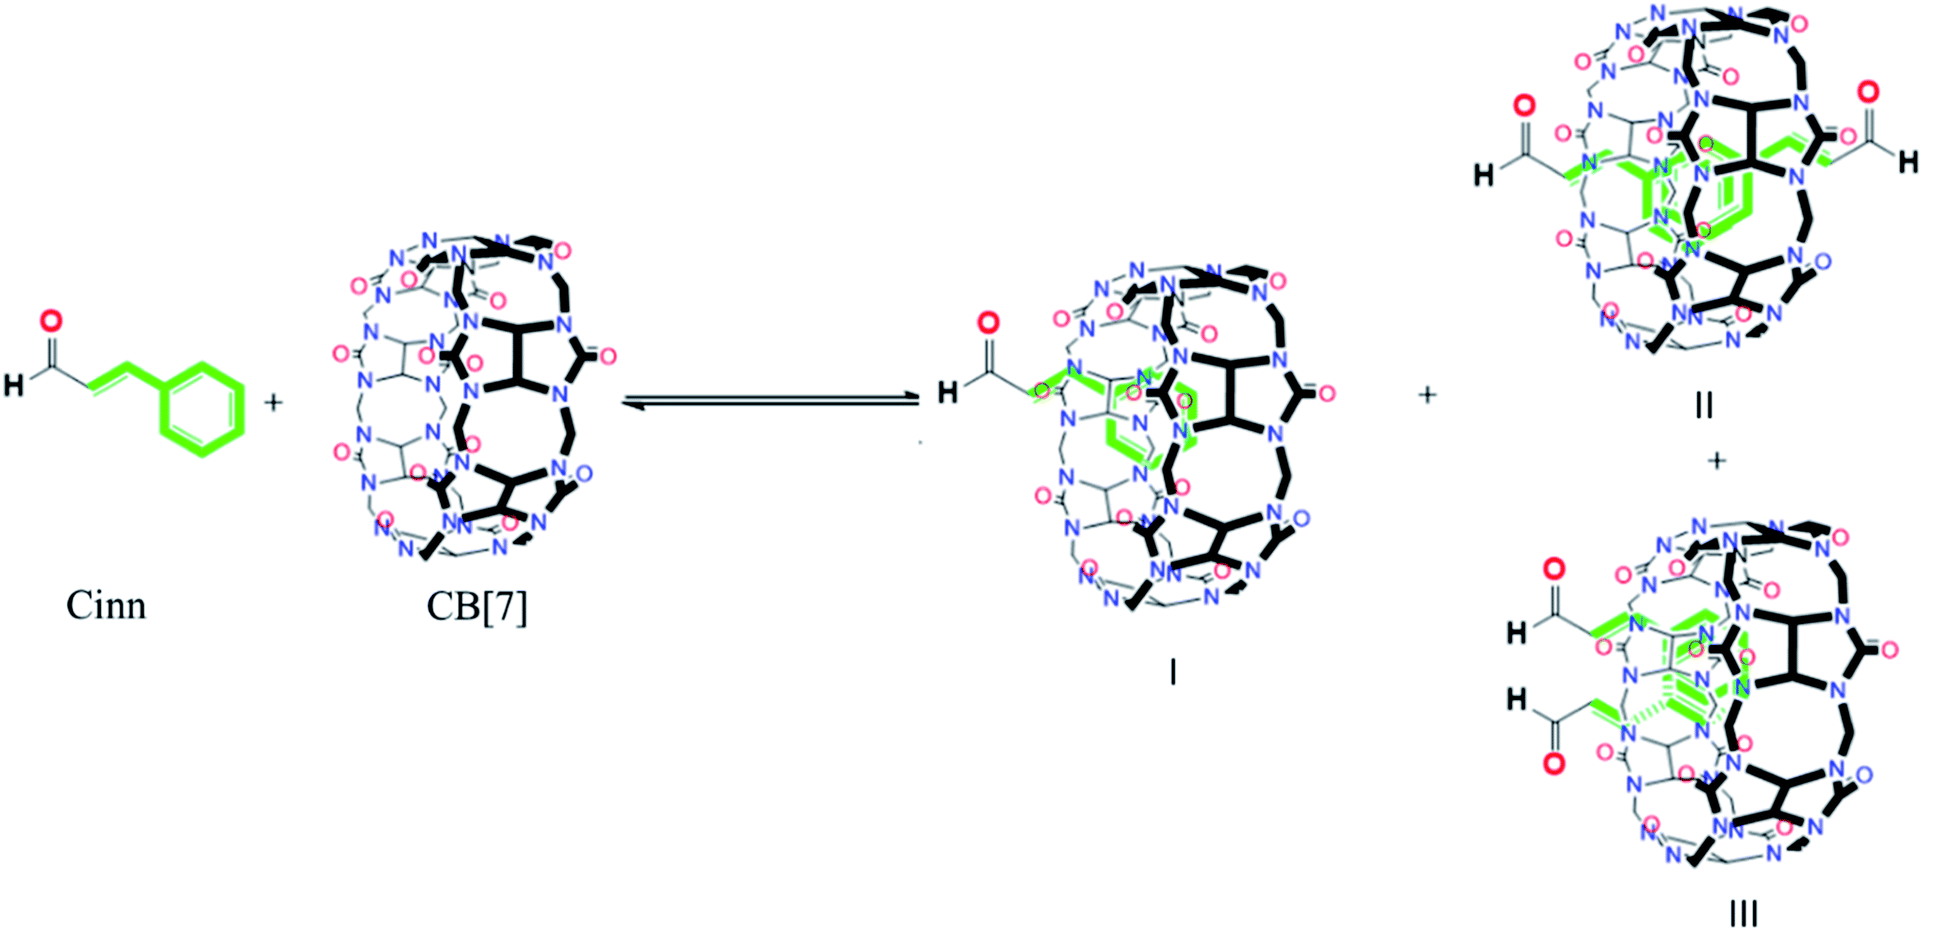 | ||
| Fig. 7 The different possible complexes present at equilibrium. | ||
3.3. Nanoparticle size measurements
The dynamic light scattering (DLS) of CB[7]–Cinn inclusion complex with 1:1 stoichiometry was determined at different time intervals to assess the stability of the inclusion complexes (Fig. 8). The results showed that CB[7]–Cinn nanoparticles' size range from 11–30 nm with good stability and maintained their size stability up to 50 hours.
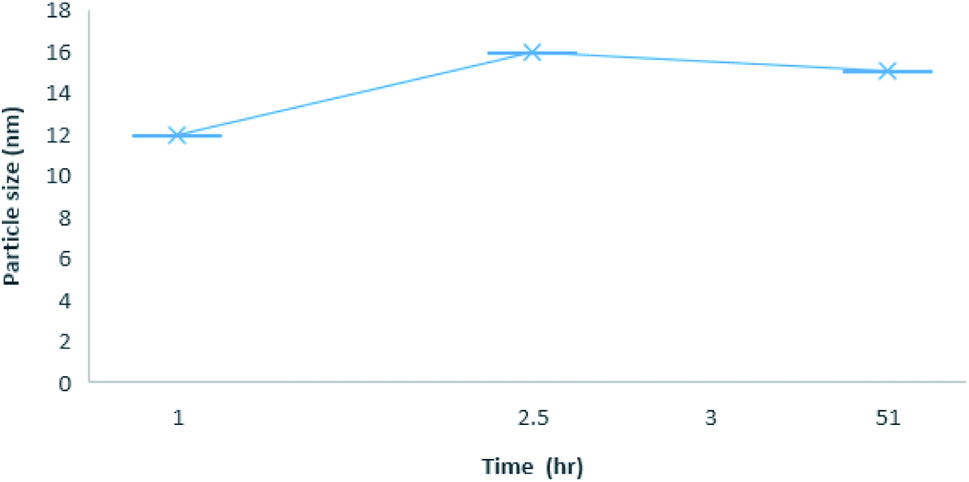 | ||
| Fig. 8 Average size distribution by intensity with different time point for 1:1 inclusion complex nanoparticles of CB[7]–Cinn. | ||
3.4. Electron microscopy (EM)
Transmission electron microscopy (TEM) image showed a highly dispersed dry CB[7]–Cinn nanoparticles in the range of 10–20 nm size (Fig. 9). This size range is considerably smaller than hydrodynamic sizes obtained by the dynamic light scattering (DLS) experiments.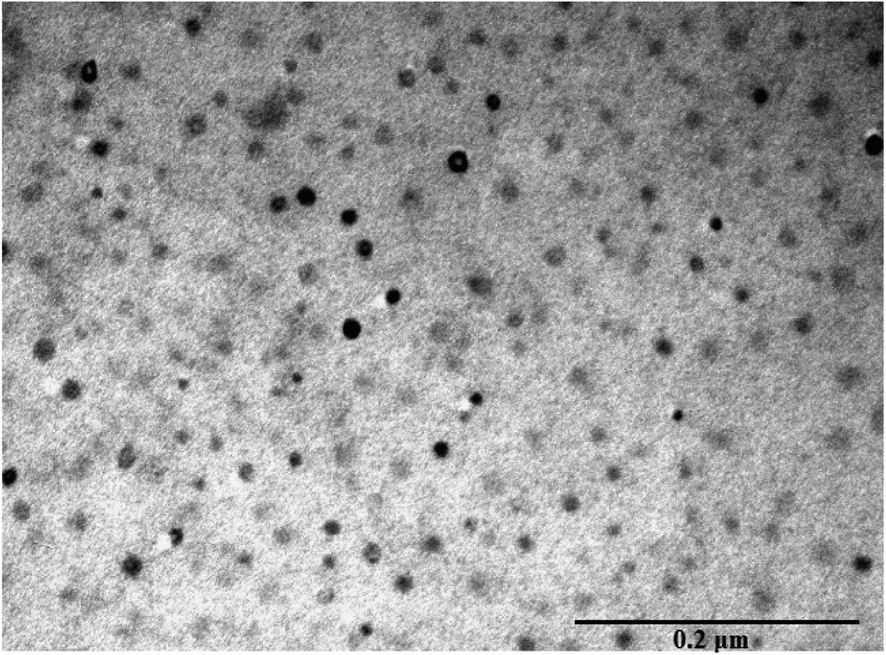 | ||
| Fig. 9 Transmission electron microscope (TEM) images of CB[7]–Cinn. | ||
The charging the particles on the grid in TEM experiment to set and adhere to the sample separate the agglomerated particles into smaller one.42
3.5. Computational study
The 1H NMR and optical measurements have demonstrated the formation of 1:1 and 1:2 inclusion complexes between CB[7] and Cinn. To confirm that, we relied on a density DFT level of theory using B3LYP functional with 6-31G(d,p) basis set calculations to further assess the formation plausibility of both 1:1 and 1:2 CB[7]–Cinn host–guest complexes and propose a geometry of the inclusion complexes. Moreover, we investigated whether the inclusion complex occurs from the aldehyde or the phenyl side of Cinn (Fig. 10).
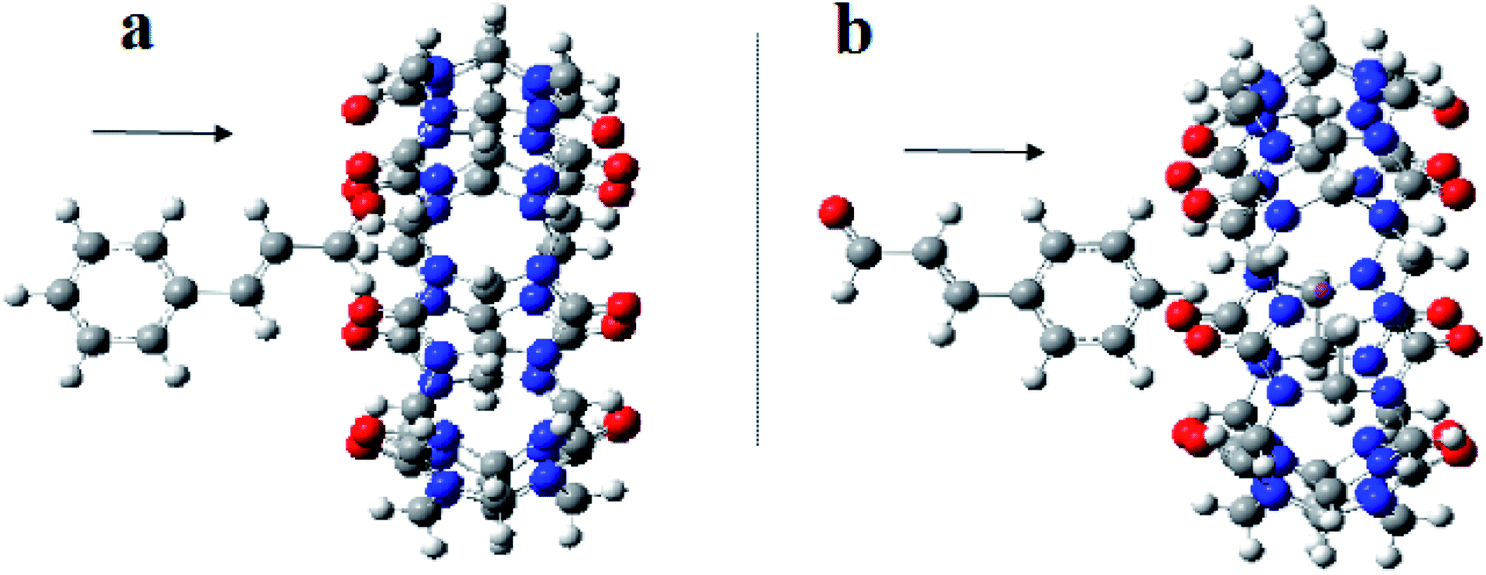 | ||
| Fig. 10 A proposed structure for inclusion of Cinn into CB[7] with different orientations (a) aldehyde side and (b) phenyl side (by Gaussian view 09). | ||
The analysis of the potential energy surfaces corresponding to aldehyde closing-up of the Cinn–CB[7] complex using the PBE0, M06-2X and B3LYP functional with 6-31G(d,p) basis set adapted similar energy behavior (Fig. 11). These energy diagrams showed unstable energy maxima at almost 3 Å before the 7 Å dissociation energy equilibrium distance. This result decreases the probability of formation of an inclusion complex from the aldehyde side of Cinn due to the repulsion interactions between CB[7] glycoluril carbonyl group with aldehyde side of Cinn which is in total agreement with 1H-NMR data that showed no alteration in shape or chemical shift of the aldehyde proton (Fig. 4a).
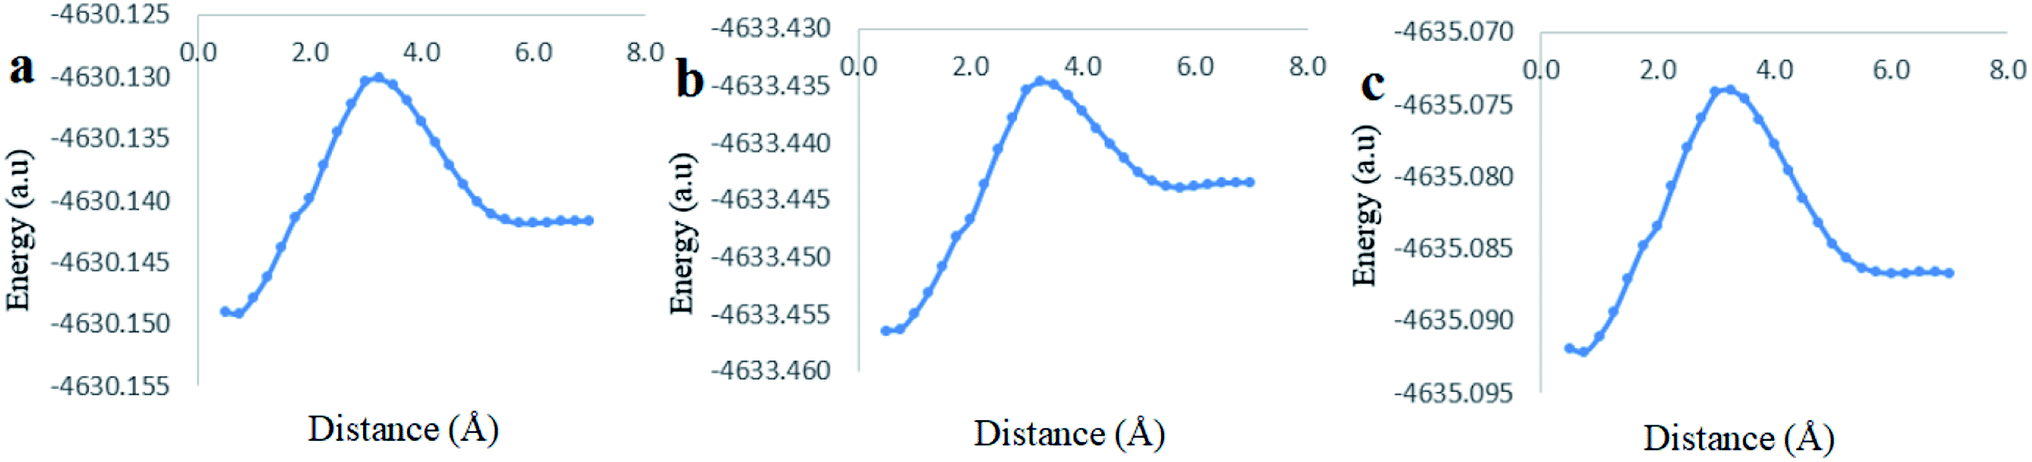 | ||
| Fig. 11 Stability energy diagrams of the inclusion complexation of the Cinn from the aldehyde side into CB[7] at different DFT level of theory using (a) PBE0, (b) M06-2X and (c) B3LYP functional with 6-31G(d,p) basis set and CPMC model with solvation. | ||
Clear stable energy minimums were observed at 3 Å before the 7 distance (Å) dissociation energy equilibrium distance obtained from the different DFT functional caculations when considering the phenyl side orientation (Fig. 12). Similar energy curves were produced by the three DFT functional with a small variation in the calculated stabilization energy. These results indicate a strong attraction energy between the Cinn phenyl side and the hydrophobic cavity of CB[7] which is again in total agreement with 1H-NMR data (Fig. 4a).
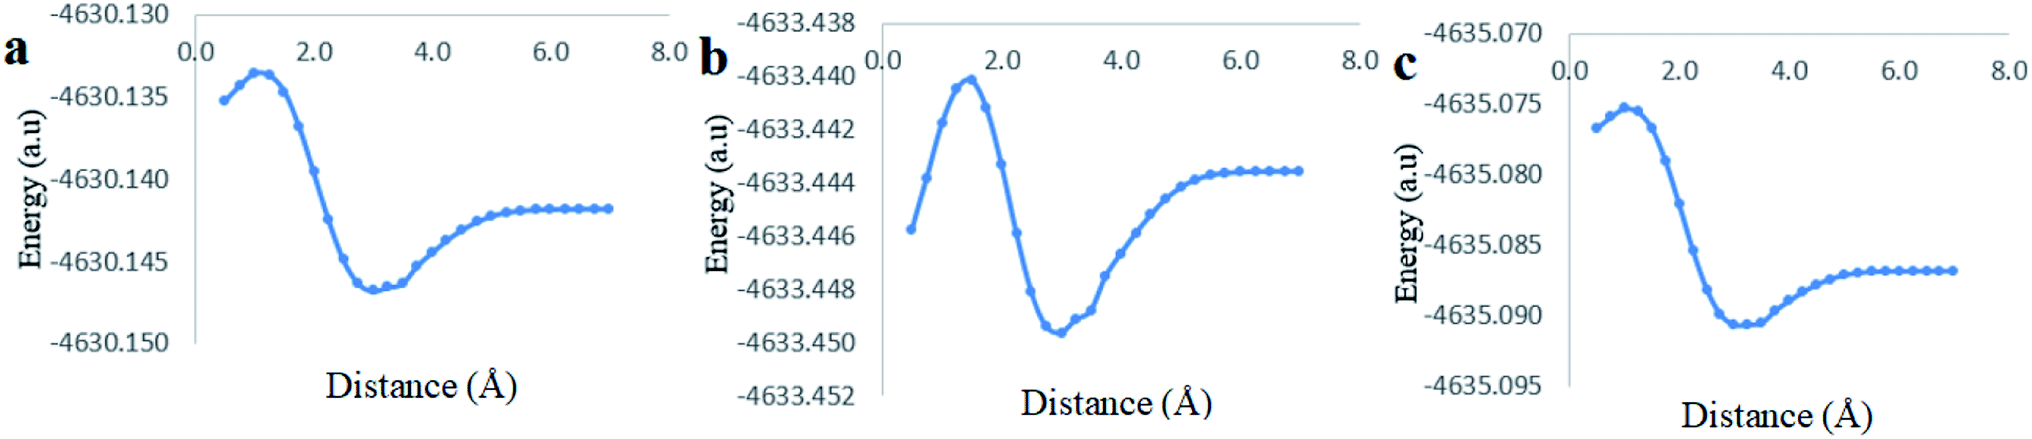 | ||
| Fig. 12 Stability energy diagrams of the inclusion complexation of the Cinn from the phenyl side into CB[7] at different DFT level of theory using (a) PBE0, (b) M06-2X and (c) B3LYP functional with 6-31G(d,p) basis set and CPMC model with solvation. | ||
A comparison of the theoretical calculations of minimum energy, r equilibrium and stabilization energy for inclusion of Cinn into CB[7] with different orientations, phenyl and aldehyde side, are summarize in Table 1. The inclusion complex formation is more favorable from the Cinn phenyl side at 3 Å due to the hydrophobic interaction, where it needs more close distance (0.5–0.75 Å) of Cinn to form inclusion complex from the aldehyde side by the hydrogen bonding of the phenyl group with the glycoluril carbonyl of CB[7].
| Method | Minimum energy (a.u) | r equilibrium (Å) | Dissociation energy (a.u) | r equilibrium (Å) | Stabilization energy (Diss-min) (a.u) |
|---|---|---|---|---|---|
| Phenyl side | |||||
| B3LYP | −4635.090656 | 3.00 Å | −4635.086844 | 7.00 Å | 0.003817 |
| PBEO | −4630.146811 | 3.00 Å | −4630.141837 | 7.00 Å | 0.004974 |
| M06-2X | −4633.449633 | 3.00 Å | −4633.443572 | 7.00 Å | 0.006061 |
|
|||||
| Aldehyde side | |||||
| B3LYP | −4635.092211 | 0.75 Å | −4635.086678 | 7.00 Å | 0.005533 |
| PBE0 | −4630.149158 | 0.75 Å | −4630.141671 | 7.00 Å | 0.007486 |
| M06-2X | −4633.456408 | 0.50 Å | −4633.443431 | 7.00 Å | 0.012977 |
The highest stabilization energy was theoretically achieved using M06-2X functionals in both Cinn orientations. This indicates that DFT M06-2X functional is the most suitable for Cinn and CB[7] interaction to build up the potential energy curve of the inclusion complex.
The last computational experiment was performed to investigate the theoretical ability of CB[7] to complex two molecules of Cinn from the phenyl side, a 1:2 stoichiometry, (Fig. 13a) using the DFT, B3LYP functional with 6-31G(d,p) basis set and CPMC/water solvent. The potential energy curve obtained from the CB[7]:Cinn, 1:2 stoichiometry, inclusion complex at the indicated level of theory and basis set showed more stable minima than observed for 1:1 stoichiometry (Fig. 13b). The stabilization energies for 1:1 and 1:2 stoichiometry were 10.02 kJ mol−1 and 11.32 kJ mol−1, respectively, at 3.00 Å distance, at the same level of theory and quantum parameters.
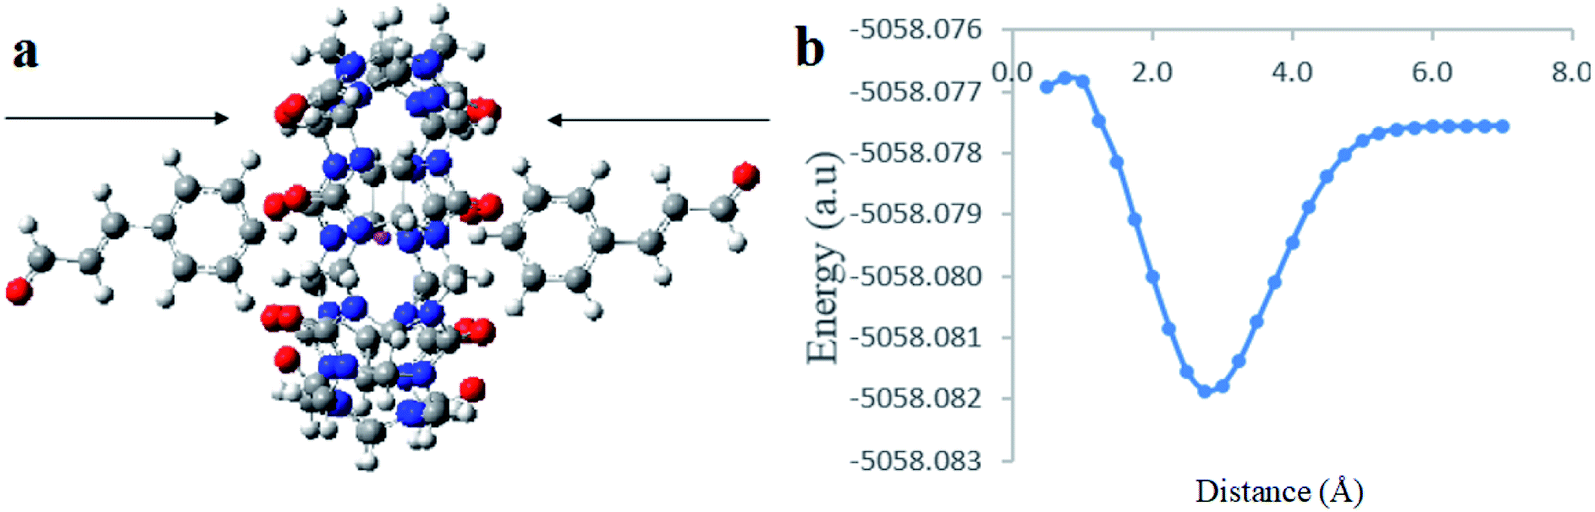 | ||
| Fig. 13 (a) A proposed molecular structure for inclusion of two molecules of Cinn into CB[7] from the phenyl side (by Gaussian view 09). (b) Stability energy diagrams of the inclusion complexation of the two Cinn from the phenyl side into CB[7] at DFT level of theory using B3LYP functional with 6-31G(d,p) basis set and CPMC model with solvation. | ||
3.6. In vitro cytotoxicity assay
The cytotoxic activity of free Cinn, free CB[7] and CB[7]–Cinn inclusion complex against U-87 and MDA-MB-231 cells were evaluated using cell viability assay (MTT). The IC50 values were calculated after 72 hours of incubation with different concentrations of free Cinn, free CB[7] and CB[7]–Cinn inclusion complex. The IC50 values for free Cinn, free CB[7] and CB[7]–Cinn inclusion complex were 240.17 ± 32.46 μM, 1000 μM and 260.47 ± 20.83 μM, respectively, against U-87 cells (Fig. 14a). The IC50 values for free Cinn, free CB[7] and CB[7]–Cinn inclusion complex were 85.93 ± 3.35 μM, 1000 μM and 176.3 ± 7.79 μM, respectively, against MDA-MB-231 cells (Fig. 14b).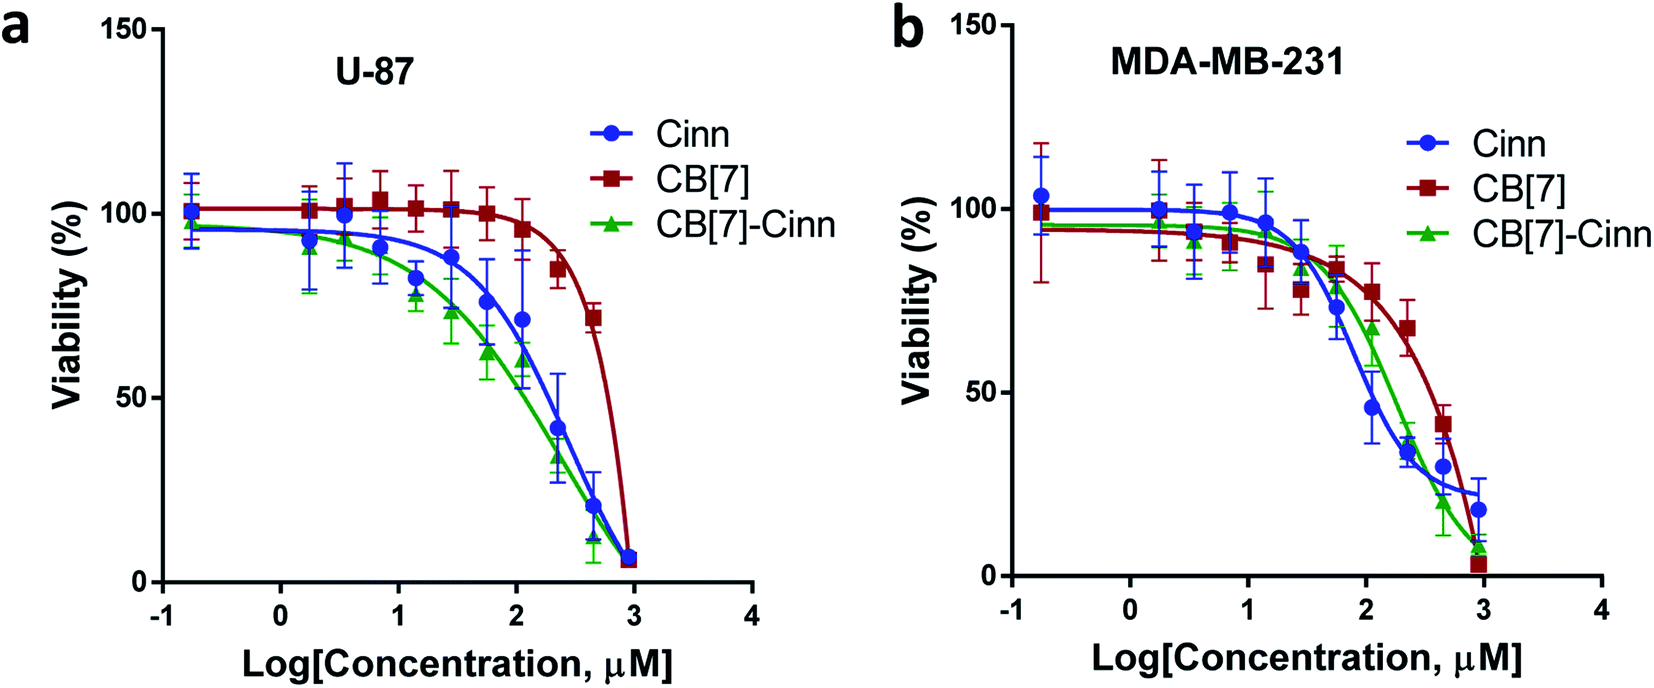 | ||
| Fig. 14 The dose–response curve for (a) U-87 and (b) MDA-MB-231 cells treated with free Cinn, free CB[7] and CB[7]–Cinn. All cytotoxicity values represent the average ± SD of three independent experiments. | ||
Our study confirmed that free CB[7] has no significant toxicity and CB[7]–Cinn inclusion complex and the free Cinn showed antiproliferative effect against both cell lines. Almost no change in IC50 between free Cinn and CB[7]–Cinn inclusion complex against U-87 cells, while the cytotoxicity was decreased by half with MDA-MB-231 cells. The slight variation in the cytotoxicity of CB[7]–Cinn inclusion complex in the two cell lines related to varied characteristics of different cell lines and may be due to the probability of the two types of stoichiometry that may increase or decrease the concentration of the complexed Cinn. In addition, the CB[7] new complex with hydrophobic Cinn increases the aqueous solubility of the drug and/or drug permeability which could enhance Cinn bioactivity.
The anti-tumor effect of Cinn has been widely investigated against different cancers both in vitro and in vivo.8 Lee et al., 1999 reported the antiproliferative effect of Cinn against 29 cancer cell lines in vitro.43 Several reports described that Cinn exerts the anti-tumor effect through induction apoptosis and cell cycle arrest.44–47 Moreover, the combination of Cinn with other chemotherapies showed a higher anti-tumor effect compared to single drug use.47,48 A further study to investigate the combination of CB[7]–Cinn inclusion complex with other chemotherapies in vitro and in vivo can be of great value.
4. Conclusions
The interactions between CB[7] and Cinn, to increased Cinn stability, have been studied in detail by 1H-NMR spectroscopy, UV-vis absorption spectroscopy and DFT quantum calculation. The 1H-NMR spectra and the spectrophotometric studies proved the 1:1 and 1:2 stoichiometries. Moreover, the DFT calculation analysis indicated that CB[7] selectively interacted with Cinn from the phenyl moiety.
Our study suggests that CB[7]–Cinn inclusion complex can be an effective as free Cinn against MDA-MB-231 and U-87 cancer cell lines that provide IC50 values 176.3 ± 7.79 μM, 260.47 ± 20.83 μM, respectively. This study suggests that CB[7]-based pharmaceutical formulation is a promising drug delivery system that may improve the stability and bioavailability of hydrophobic drugs in vitro and in vivo. Moreover, the investigation of the synergistic effect between Cinn and other chemotherapies can provide a valuable combination therapy through decreasing the required doses of the cytotoxic drugs and may reduce the unwanted side-effects.
Conflicts of interest
There are no conflicts to declare.Acknowledgements
The authors would like to thank the Deanship of Academic Research (DAR) at The University of Jordan (UJ) for their financial support.References
- Z. Liu, J. T. Robinson, X. Sun and H. Dai, J. Am. Chem. Soc., 2008, 130, 10876–10877 CrossRef CAS PubMed.
- M. Ferrari, Nat. Rev. Cancer, 2005, 5, 161–171 CrossRef CAS PubMed.
- P. Domadia, S. Swarup, A. Bhunia, J. Sivaraman and D. Dasgupta, Biochem. Pharmacol., 2007, 74, 831–840 CrossRef CAS PubMed.
- Y.-T. Tung, M.-T. Chua, S.-Y. Wang and S.-T. Chang, Bioresour. Technol., 2008, 99, 3908–3913 CrossRef CAS PubMed.
- S.-J. Wu and L.-T. Ng, Food Chem. Toxicol., 2007, 45, 2446–2453 CrossRef CAS PubMed.
- S. Jiang, J.-N. Li and Z.-T. Jiang, Eur. Food Res. Technol., 2010, 230, 543–550 CrossRef CAS.
- A. Dutta and A. Chakraborty, J. Toxicol., 2018, 2018, 8978731 Search PubMed.
- S. H. Hong, I. A. Ismail, S. M. Kang, D. C. Han and B. M. Kwon, Phytother. Res., 2016, 30, 754–767 CrossRef CAS PubMed.
- R. V. Olsen, H. H. Andersen, H. G. Moller, P. W. Eskelund and L. Arendt-Nielsen, Eur. J. Pain, 2014, 18, 1333–1342 CrossRef CAS PubMed.
- Y. Huang, S.-F. Xue, Q.-J. Zhu and T. Zhu, Supramol. Chem., 2008, 20, 279–287 CrossRef CAS.
- W. Alshaer, M. Zraikat, A. Amer, H. Nsairat, Z. Lafi, D. A. Alqudah, E. Al Qadi, T. Alsheleh, F. Odeh, A. Alkaraki, M. Zihlif, Y. Bustanji, E. Fattal and A. Awidi, RSC Adv., 2019, 9, 30976–30988 RSC.
- J.-H. Li, N. Zhang, X.-T. Li and J.-Y. Wang, J. Inclusion Phenom. Mol. Recognit. Chem., 1997, 28, 95–103 CrossRef CAS.
- M. E. Carlotti, S. Sapino, R. Cavalli, M. Trotta, F. Trotta and K. Martina, J. Inclusion Phenom. Macrocyclic Chem., 2007, 57, 445–450 CrossRef CAS.
- J. He and W. Li, J. Inclusion Phenom. Macrocyclic Chem., 2009, 63, 61–68 CrossRef CAS.
- L. E. Hill, C. Gomes and T. M. Taylor, LWT–Food Sci. Technol., 2013, 51, 86–93 CrossRef CAS.
- F. Zarei baygi, N. Farhadian, B. Malaekeh-Nikouei and Z. Maghsoud, RSC Adv., 2016, 6, 111517–111525 RSC.
- M. Y. Hur, I. Hwang and K. Kim, in Cucurbiturils and Related Macrocycles, The Royal Society of Chemistry, 2020, pp. 1–14, 10.1039/9781788015967-00001.
- A. I. Day, R. J. Blanch, A. P. Arnold, S. Lorenzo, G. R. Lewis and I. Dance, Angew. Chem., Int. Ed. Engl., 2002, 41, 275–277 CrossRef CAS PubMed.
- J. Lagona, P. Mukhopadhyay, S. Chakrabarti and L. Isaacs, Angew. Chem., Int. Ed. Engl., 2005, 44, 4844–4870 CrossRef CAS PubMed.
- V. D. Uzunova, C. Cullinane, K. Brix, W. M. Nau and A. I. Day, Org. Biomol. Chem., 2010, 8, 2037–2042 RSC.
- S. Karcher, A. Kornmüller and M. Jekel, Water Res., 2001, 35, 3309–3316 CrossRef CAS PubMed.
- A. Day, A. P. Arnold, R. J. Blanch and B. Snushall, J. Org. Chem., 2001, 66, 8094–8100 CrossRef CAS PubMed.
- A. L. Koner and W. M. Nau, Supramol. Chem., 2007, 19, 55–66 CrossRef CAS.
- J. S. Negi and S. Singh, Carbohydr. Polym., 2013, 92, 1835–1843 CrossRef CAS PubMed.
- C. Tablet, I. Matei and M. Hillebrand, The Determination of the Stoichiometry of Cyclodextrin Inclusion Complexes by Spectral Methods: Possibilities and Limitations, INTECH Open Access Publisher, 2012 Search PubMed.
- K. Srinivasan, T. Stalin and K. Sivakumar, Spectrochim. Acta, Part A, 2012, 94, 89–100 CrossRef CAS PubMed.
- V. A. Marcolino, G. M. Zanin, L. R. Durrant, T. Benassi Mde and G. Matioli, J. Agric. Food Chem., 2011, 59, 3348–3357 CrossRef CAS PubMed.
- F. Odeh, H. Nsairat, W. Alshaer, S. Alsotari, R. Buqaien, S. Ismail, A. Awidi and A. Al Bawab, RSC Adv., 2019, 9, 37148–37161 RSC.
- C. Nicolazzi, S. Abdou, J. Collomb, A. Marsura and C. Finance, Bioorg. Med. Chem., 2001, 9, 275–282 CrossRef CAS PubMed.
- R. Rajaram, K. N. Sundararajalu and S. Meenakshisundaram, J. Fluoresc., 2011, 21, 521–529 CrossRef CAS PubMed.
- S. G. M. Ong, L. C. Ming, K. S. Lee and K. H. Yuen, Pharmaceutics, 2016, 8, 25 CrossRef PubMed.
- M. Frisch, G. Trucks, H. Schlegel, G. Scuseria, M. Robb, J. Cheeseman, G. Scalmani, V. Barone, B. Mennucci, G. Petersson, H. Nakatsuji, M. Caricato, X. Li, H. Hratchian, A. Izmaylov, J. Bloino, G. Zheng, J. Sonnenberg, M. Hada and D. Fox, Gaussian Inc.Wallingford CT, 2009.
- T. Mosmann, J. Immunol. Methods, 1983, 65, 55–63 CrossRef CAS PubMed.
- N. Horiuchi, K. Nakagawa, Y. Sasaki, K. Minato, Y. Fujiwara, K. Nezu, Y. Ohe and N. Saijo, Cancer Chemother. Pharmacol., 1988, 22, 246–250 CrossRef CAS PubMed.
- Z. Hadian, M. Maleki, K. Abdi, F. Atyabi, A. Mohammadi and R. Khaksar, Iran. J. Pharm. Res., 2018, 17, 39–51 CAS.
- V. Sindelar, S. E. Parker and A. E. Kaifer, New J. Chem., 2007, 31, 725–728 RSC.
- A. B. Hegge, M. Masson, S. Kristensen and H. H. Tonnesen, Pharmazie, 2009, 64, 382–389 CAS.
- A. L. Koner, I. Ghosh, N. i. Saleh and W. M. Nau, Can. J. Chem., 2011, 89, 139–147 CrossRef CAS.
- E. Olson and P. Buhlmann, J. Org. Chem., 2011, 76, 8406–8412 CrossRef CAS PubMed.
- J. S. Renny, L. L. Tomasevich, E. H. Tallmadge and D. B. Collum, Angew. Chem., Int. Ed. Engl., 2013, 52, 11998–12013 CrossRef CAS PubMed.
- D. L. Romano, J. E. Marcy and R. C. Williams, Master thesis, Virginia Polytech Institute and State University, 2008.
- M.-J. Choi, U. Ruktanonchai, A. Soottitantawat and S.-G. Min, Food Res. Int., 2009, 42, 989–997 CrossRef CAS.
- C. W. Lee, D. H. Hong, S. B. Han, S. H. Park, H. K. Kim, B. M. Kwon and H. M. Kim, Planta Med., 1999, 65, 263–266 CrossRef CAS PubMed.
- S. K. Rad, M. S. Kanthimathi, S. N. Abd Malek, G. S. Lee, C. Y. Looi and W. F. Wong, PLoS One, 2015, 10, e0145216 CrossRef PubMed.
- P. Kubatka, M. Kello, K. Kajo, M. Samec, K. Jasek, D. Vybohova, S. Uramova, A. Liskova, V. Sadlonova, L. Koklesova, R. Murin, M. Adamkov, K. Smejkal, E. Svajdlenka, P. Solar, S. M. Samuel, M. Kassayova, T. K. Kwon, P. Zubor, M. Pec, J. Danko, D. Busselberg and J. Mojzis, Molecules, 2020, 25(6), 1399 CrossRef CAS PubMed.
- J. Li, Y. Teng, S. Liu, Z. Wang, Y. Chen, Y. Zhang, S. Xi, S. Xu, R. Wang and X. Zou, Oncol. Rep., 2016, 35, 1501–1510 CrossRef CAS PubMed.
- A. Abbasi, M. Hajialyani, L. Hosseinzadeh, F. Jalilian, P. Yaghmaei, S. Jamshidi Navid and H. Motamed, Results Pharma Sci., 2020, 15, 26–35 CrossRef PubMed.
- S. Y. Shin, H. Jung, S. Ahn, D. Hwang, H. Yoon, J. Hyun, Y. Yong, H. J. Cho, D. Koh, Y. H. Lee and Y. Lim, Bioorg. Med. Chem., 2014, 22, 1809–1820 CrossRef CAS PubMed.
| This journal is © The Royal Society of Chemistry 2022 |