
 Open Access Article
 This Open Access Article is licensed under a Creative Commons Attribution-Non Commercial 3.0 Unported Licence
Highly precise FIR thermometer based on the thermally enhanced upconversion luminescence for temperature feedback photothermal therapy
Haonan Shiab,
Fang Hana,
Xiuli Wangc,
Xiaotong Rena,
Ruoshan Leib,
Lihui Huangb,
Shilong Zhao *b and
Shiqing Xub
*b and
Shiqing Xub
aCollege of Materials and Chemistry, China Jiliang University, Hangzhou 310018, China
bInstitute of Optoelectronic Materials and Devices, China Jiliang University, Hangzhou 310018, China. E-mail: zhaosl75@cjlu.edu.cn
cCollege of Materials, Chemistry and Chemical Engineering, Hangzhou Normal University, Hangzhou 311121, China
First published on 16th March 2022
Abstract
A highly precise temperature-feedback photothermal therapy platform in deep tissue is proposed based on all-fiber fluorescence intensity ratio (FIR) thermometry, which provides a promising route to realize real-time temperature monitoring in the minimally invasive treatment of tumors. Highly disordered double perovskite Li2Zn2Mo3O12 (LZMO) phosphors doped with rare earth ions were prepared and intense green upconversion emissions were observed with an ultra-low excitation power. The thermal enhancement of the upconversion luminescence was achieved up to 423 K, which is very beneficial to achieve a good signal-to-noise performance during the temperature-rise period. Superior temperature sensing performance was demonstrated with the maximum absolute sensitivity of 89.9 × 10⁻⁴ at 423 K. The strong upconversion emissions and high temperature sensitivity result in a small temperature error (±0.4 K). The integrated bifunctional needle could simultaneously realize temperature measurement and laser heating, which was exhibited in the denaturation of egg white and laser ablation of the porcine liver in vitro.
1. Introduction
It is essential to achieve the real-time and accurate temperature measurement in industrial production, scientific research, and medical care.1,2 In recent years, luminescence thermometry based on FIR technology has received widespread attention.3–5 It combines the superiority of low cost and self-referencing, which can eliminate the influence of laser power fluctuation and achieve accurate and fast temperature readout.Great efforts and resources have been invested and devoted to advance the rapid development of fluorescence intensity ratio (FIR) technology. A great number of luminescent materials have been prepared and temperature sensing performance has been investigated to optimize the optical materials with good performance.6–9 According to Judd–Ofelt's theory, the influence of the local crystal field environment on thermal sensitivity was analyzed in the oxyfluoride glass and glass ceramics. The highly disordered local environment is conducive to the improvement of temperature sensitivity.10 According to the thermometric performance in YF3, YOF, and Y2O3, it is considered that phonon energy is proportional to the temperature sensing performance.11
Because of its strong green upconversion luminescence and appropriate energy gap (∼700 cm−1) of two upper energy levels (2H11/2/4S3/2), Er3+ ion is the first choice for active ion based on FIR technology. In order to achieve accurate temperature measurement, strong upconversion emission and large temperature sensitivity are required.12 Unfortunately, the thermal quenching of upconversion luminescence is universal,13 which results in the quick decrease of signal-to-noise ratio and temperature measurement accuracy. It is urgently needed to seek optical temperature sensing materials with excellent performance.
From the perspective of direct application, the current researches mainly focus on the application of nano-optical materials in the temperature measurement of intra- and inter-cellular levels.14–16 The construction of a practical and portable optical thermometer based on FIR technology is very limited.17,18 In fact, the building of an all-fiber optical thermometer may push forward the practical application of FIR type thermometer. Laser-assisted photothermal therapy have attracted increasing interests and demonstrated great advantages because of its effective, minimally invasive and low-cost characteristics.19 During the localized photothermal treatments process, temperature monitoring plays a crucial role in the final curative effect, in which the temperature should completely kill the tumor cells without thermal damage to the surrounding normal tissues.20,21 By now, the temperature monitoring is achieved mainly by thermocouples or fiber Bragg grating temperature sensor.22,23 There are few reports of all-fiber FIR thermometer on the photothermal therapy.24
Herein, the high temperature sintering method was used to fabricate rare earth doped LZMO phosphors. The doping of Eu3+ ions was used as a spectral probe to investigate the crystal field environment. Strong upconversion luminescence from Er3+ ions was observed when the excitation power was only 10 mW. The unusual thermal enhancement of upconversion emission in Er3+/Yb3+ codoped LZMO phosphor was observed. An all-fiber portable optical thermometer was established and used to monitor the laser induced photothermal therapy in real time.
2. Experimental section
2.1 Chemicals
The reagents used in this experiment include Li2CO3, ZnO, MoO3, Eu2O3, Er2O3 and Yb2O3 were used as raw materials. All chemical agents were analytical grade without further purification.2.2 Sample preparation
According to the molar stoichiometric of Li1.9Zn1.9Mo3O12:0.1Eu3+ and Li1.48Zn1.48Mo3O12:0.02Er3+, 0.5Yb3+, all raw materials were accurately weighed and put into the agate mortar. The mixed raw materials were ground for 20 minutes to ensure uniform mixing. The ground raw materials were poured into Al2O3 crucible and placed in a muffle furnace for sintering. The samples were first calcined at 600 °C for 2 hours, then ground again and calcined at 800 °C for 4 hours. After the sintering was completed, the final products were taken out and ground into the fine powder for further characterization.2.3 Experimental instrumentation
X-ray diffraction patterns of rare earth doped LZMO phosphors were measured on Bruker D2-Phaser X-ray diffractometer. The X-ray source was 0.154 nm Cu-Kα radiation and the scanning angle range was from 10° to 80°. The micro-morphology of LZMO phosphor was carried out on the Hitachi field emission scanning electron (SEM) microscope. The photoluminescence spectra of Eu3+ doped LZMO phosphor was measured on the Horiba Fluorolog-3 fluorescence spectrometer and a 450 W xenon lamp was used as the excitation light source. The upconversion luminescence of Er3+/Yb3+ codoped LZMO phosphor was performed on the above spectrometer and an external 980 nm laser was used.In order to construct a temperature-feedback photothermal therapy platform, as shown in Fig. 1a, two 980 nm semiconductor lasers (DS3-101, BWT Beijing Ltd) with single mode fiber (SMF, Corning HI1060) coupled output are used to produce the photothermal effect (red line) and achieve accurate temperature measurement (blue line) based on FIR technology, respectively. The temperature sensing probe was fabricated by a simple coating plus UV curing process. Briefly, a small amount of LZMO:Er3+/Yb3+ powder was homogeneously scattered in the UV optical curing glue NOA61. A thin layer was coated on the end face of SMF. A stable optical fiber probe was produced after the UV curing process. 980 nm excitation light passed successfully the optical isolator, wavelength division multiplexer (WDM, WDM-1-540980, Advanced Fiber Resources) and ultimately irradiated the end-faced LZMO:Er3+/Yb3+ phosphor. The green upconversion emission signal was transmitted inversely and monitored by an optical spectrum analyzer (OSA, JA2000, China Jiliang University). In order to obtain a uniform temperature field and avoid the direct contact between laser and deep tissue, the heating end was first encapsulated in a stainless steel tube with a diameter of 0.6 mm and was further packaged in a stainless needle with the above temperature probe, as shown in the Fig. 1b. The diameter of the outer needle was 0.9 mm, which can puncture deep tissue. This structure can ensure the overall mechanical strength, tightness, and temperature measurement accuracy of the probe.
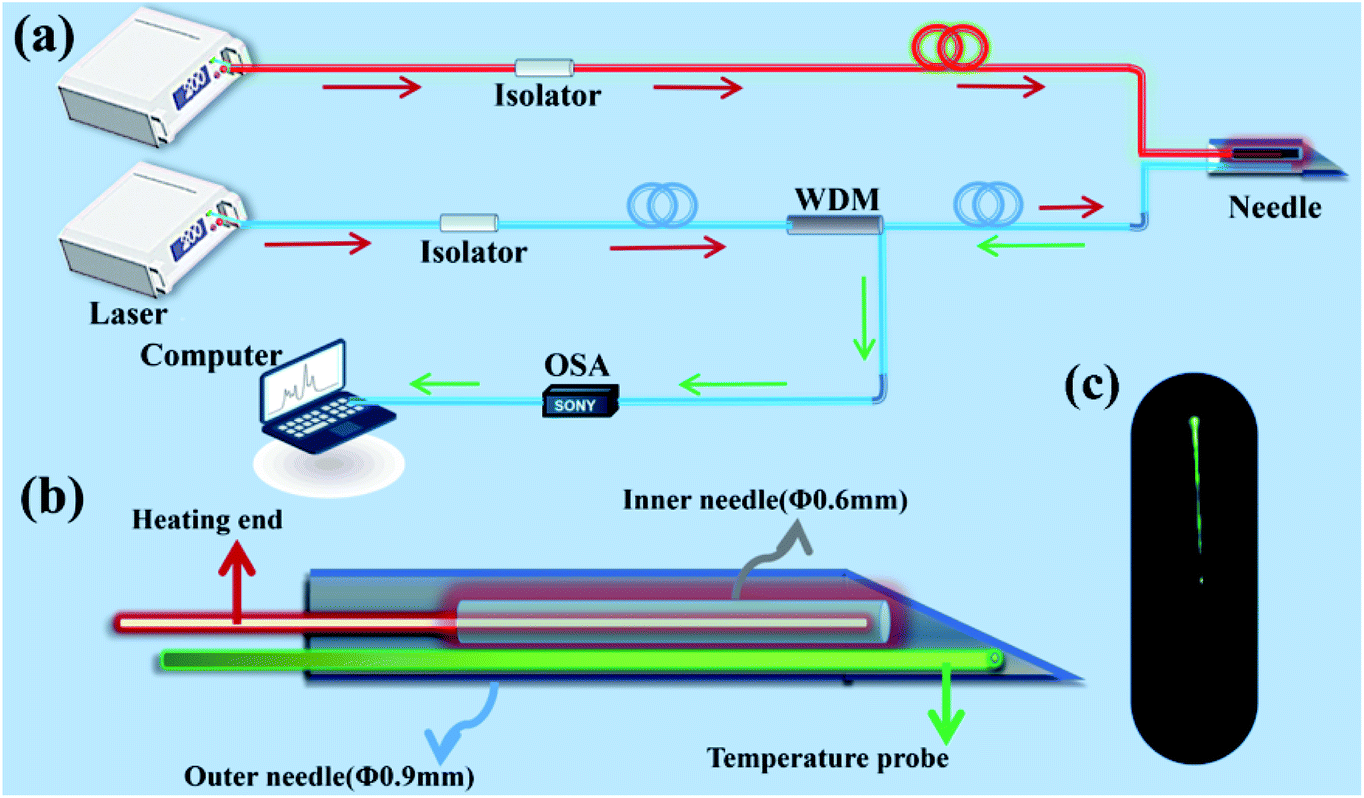 | ||
| Fig. 1 (a) The diagram of the integrated temperature-feedback photothermal therapy platform. (b) The interior structure of the integrated probe. (c) The photogram of the green upconversion luminescence at the end-face of optical fiber. | ||
Based on the above device, the feasibility of photothermal experiment was evaluated through the protein denaturation tests. 2 ml of egg white were added to a glass test tube with a diameter of 3 mm. The integrated probe can realize heating and temperature measurement at the same time. The laser power of temperature sensing end and heating end was 1 mW and 300 mW, respectively. The digital camera was used to record the changes of egg white over time. In order to observe the photothermal effect intuitively, a piece of pig liver with a size of 3 × 3 × 1 cm3 was further used for experimental research. The integrated probe was inserted into the middle of pig liver. The laser power of temperature sensing end was still 1 mW. The laser power of heating end was 300 and 800 mW.
3. Results and discussion
The phase structure of LZMO:0.1Eu3+ and LZMO:0.02Er3+/0.5Yb3+ were analyzed based on the XRD data (Fig. 2a). All the diffraction patterns could be indexed to orthodontic Li2Co2Mo3O12 (JCPDS# 85-0059)25 and none of the impurity diffraction patterns are observed, which suggests that pure phase isostructural rare earth doped LZMO have been synthesized. The Rietveld refinement (Fig. 2b) of LZMO:0.02Er3+/0.5Yb3+ phosphor was carried out using TOPAS software. The refinement parameters are Rexp = 1.78%, Rp = 6.06%, Rwp = 8.89% and x2 = 4.99, respectively. The reasonable results indicate that Er3+ and Yb3+ ions succeed in entering into the crystal structure. As shown in Fig. 2c, the crystal structure is composed of MoO4 tetrahedrons and distorted LiO6(ZnO6) octahedrons. Li and Zn ions randomly occupy the same cationic sites. The doping lanthanide ions occupy the Li/Zn sites and exhibit a local lattice disorder around them. The microscopic appearance of LZMO phosphors was explored. The typical SEM micrograph of LZMO:0.02Er3+/0.5Yb3+ phosphor is depicted in Fig. 2d. The microscopic appearance demonstrates that LZMO:0.02Er3+/0.5Yb3+ phosphor is not of uniform size and is irregularly short rod shape.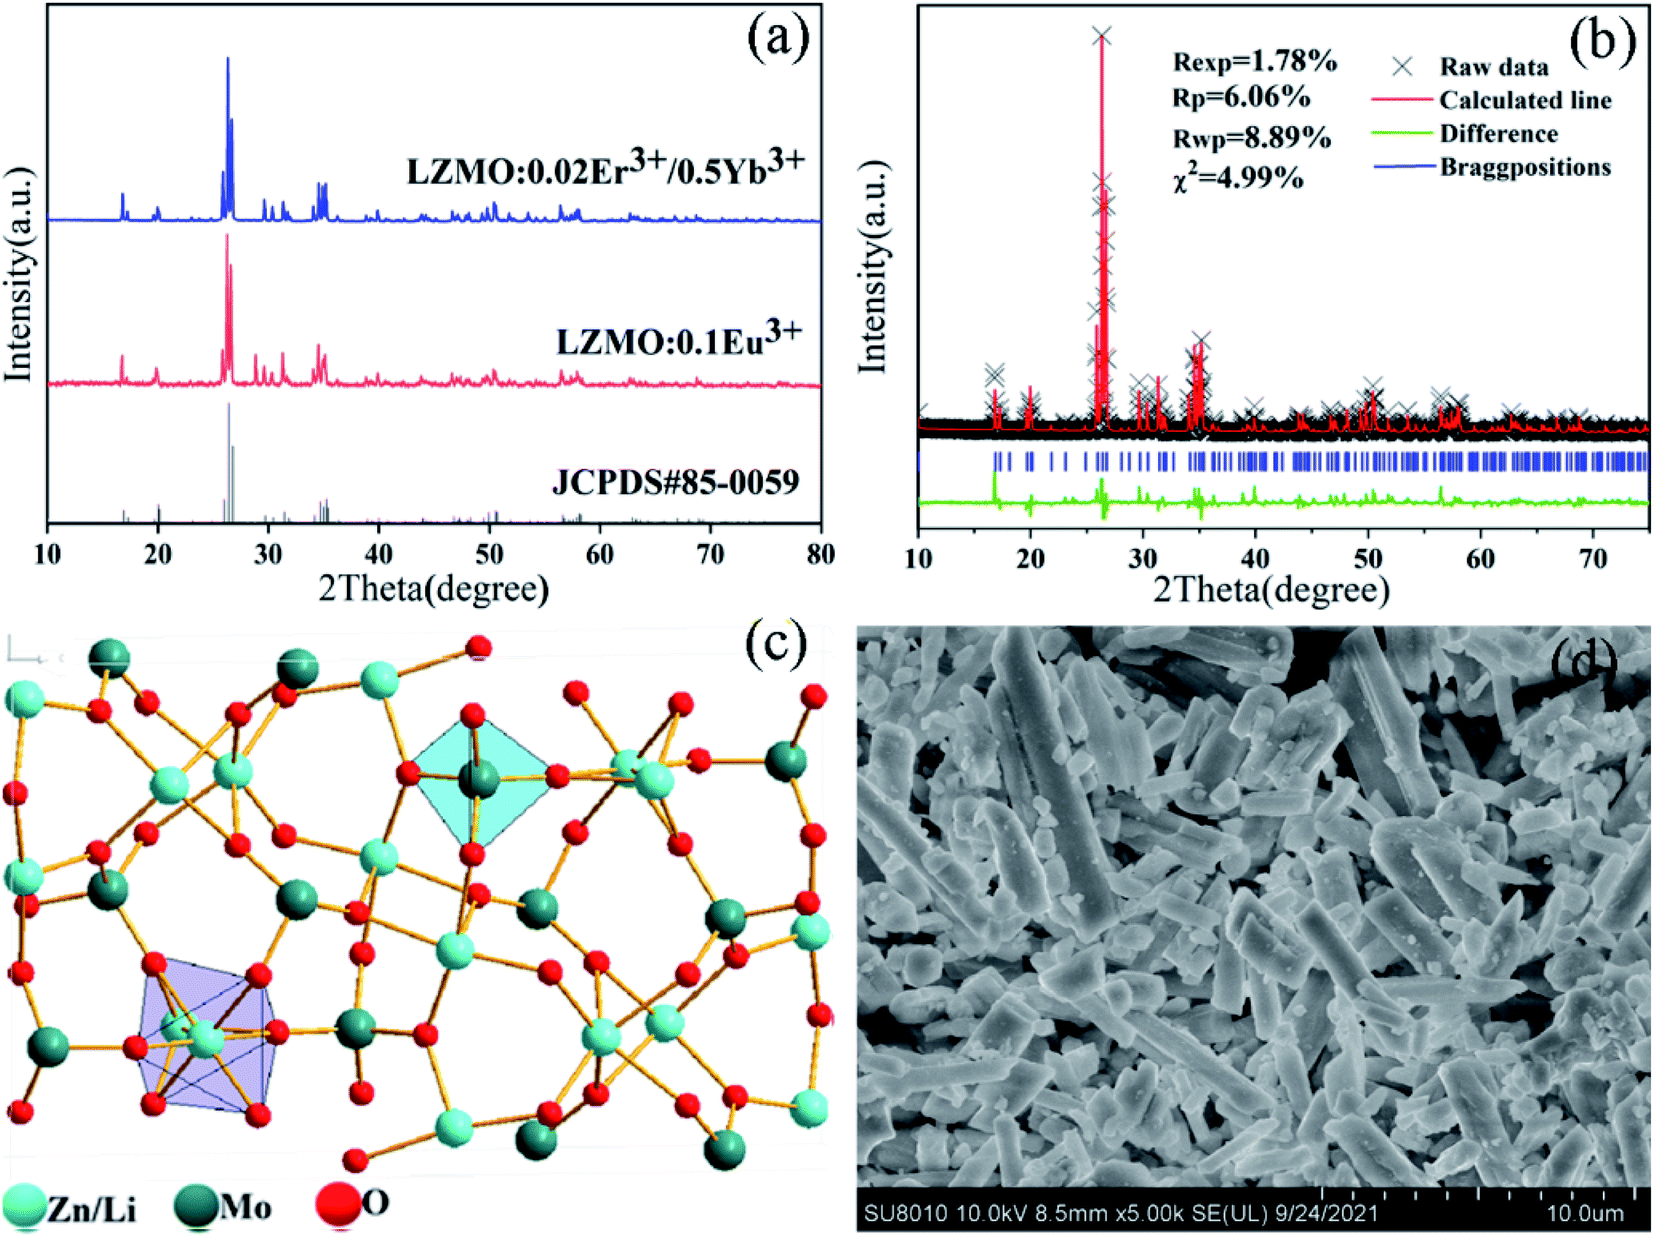 | ||
| Fig. 2 (a) XRD results of LZMO:0.1Eu3+ and LZMO:0.02Er3+/0.5Yb3+. (b) Rietveld refinement of XRD pattern for LZMO:0.02Er3+/0.5Yb3+ phosphor. (c) Crystal structure of LZMO phosphors. (d) SEM micrograph of LZMO:0.02Er3+/0.5Yb3+ phosphor. | ||
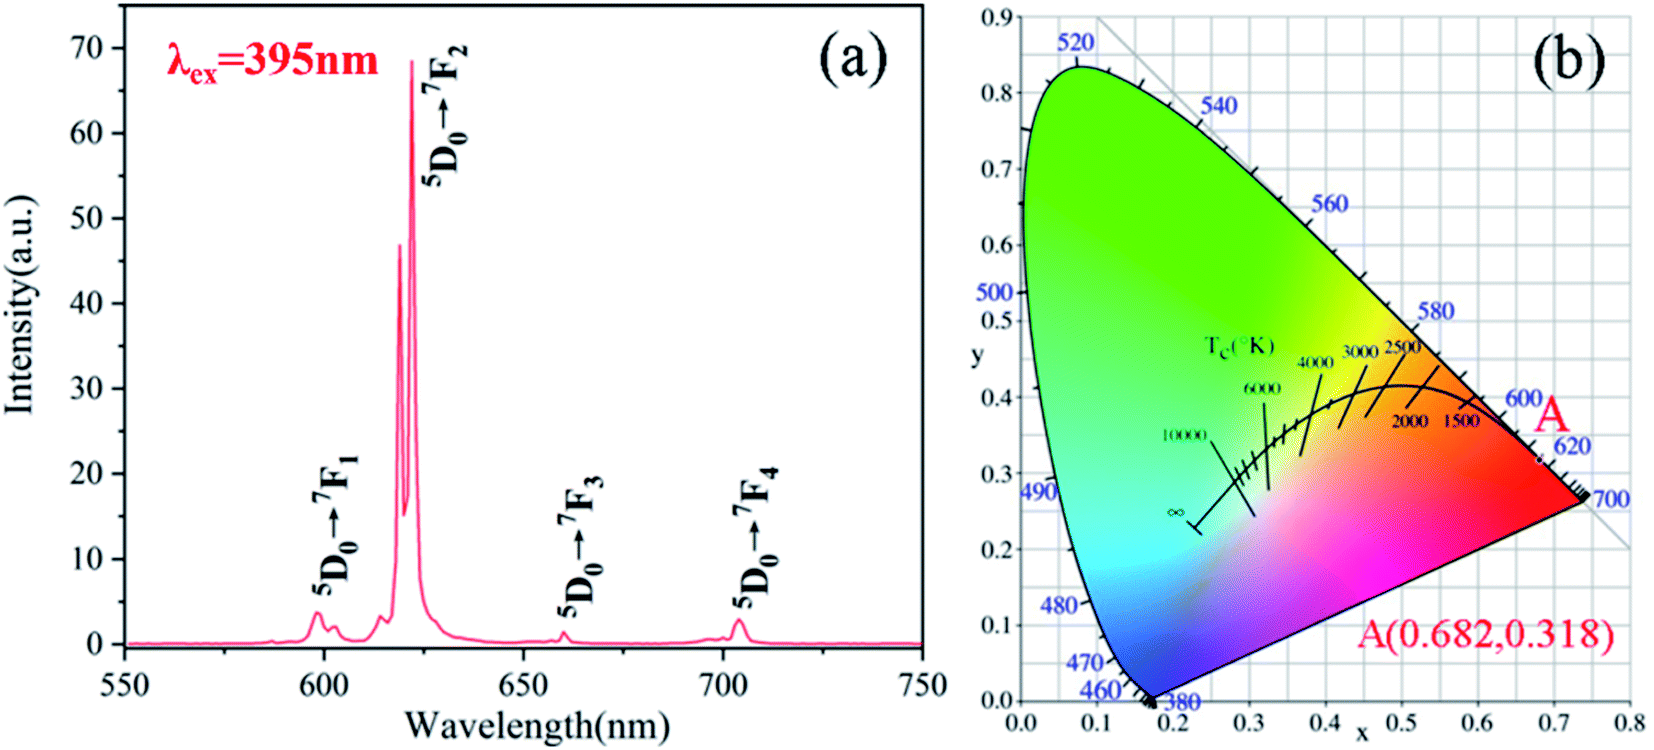
Eu3+ ions are commonly used as a spectral probe to investigate the local environment due to the hypersensitive 5D0 → 7F2 electric dipole transition, while the 5D0 → 7F1 magnetic dipole transition is insensitive to local environmental change.26 Therefore, the intensity ratio δ of 5D0 → 7F2 and 5D0 → 7F1 transitions are considered as a standard to evaluate the structural symmetry. The photoluminescence emission spectrum of LZMO:0.1Eu3+ phosphors is depicted in Fig. 3a. Obviously, the 5D0 → 7F2 electric dipole transition is dominant and the δ value is 18.5, which suggests that lanthanide ions locate in the noncentrosymmetric local site in LZMO phosphor. It was reported that the more disordered the local structure occupied by rare earth ions, the more conducive to obtain strong upconversion luminescence and high temperature sensitivity.10,27 Thus, Er3+/Yb3+ codoped LZMO phosphor may be an ideal candidate material for optical fiber temperature sensing. As shown in Fig. 3b, the CIE chromatic coordinates LZMO:0.1Eu3+ phosphor is (0.68, 0.32) and very close to the ideal value (0.67, 0.33) of red light, which demonstrates that LZMO:0.1Eu3+ phosphor exhibits great potential as red phosphors for white LEDs.
 | ||
| Fig. 3 (a) The photoluminescence emission spectrum of LZMO:0.1Eu3+ phosphor. (b) The chromaticity coordinates of LZMO:0.1Eu3+ phosphor. | ||
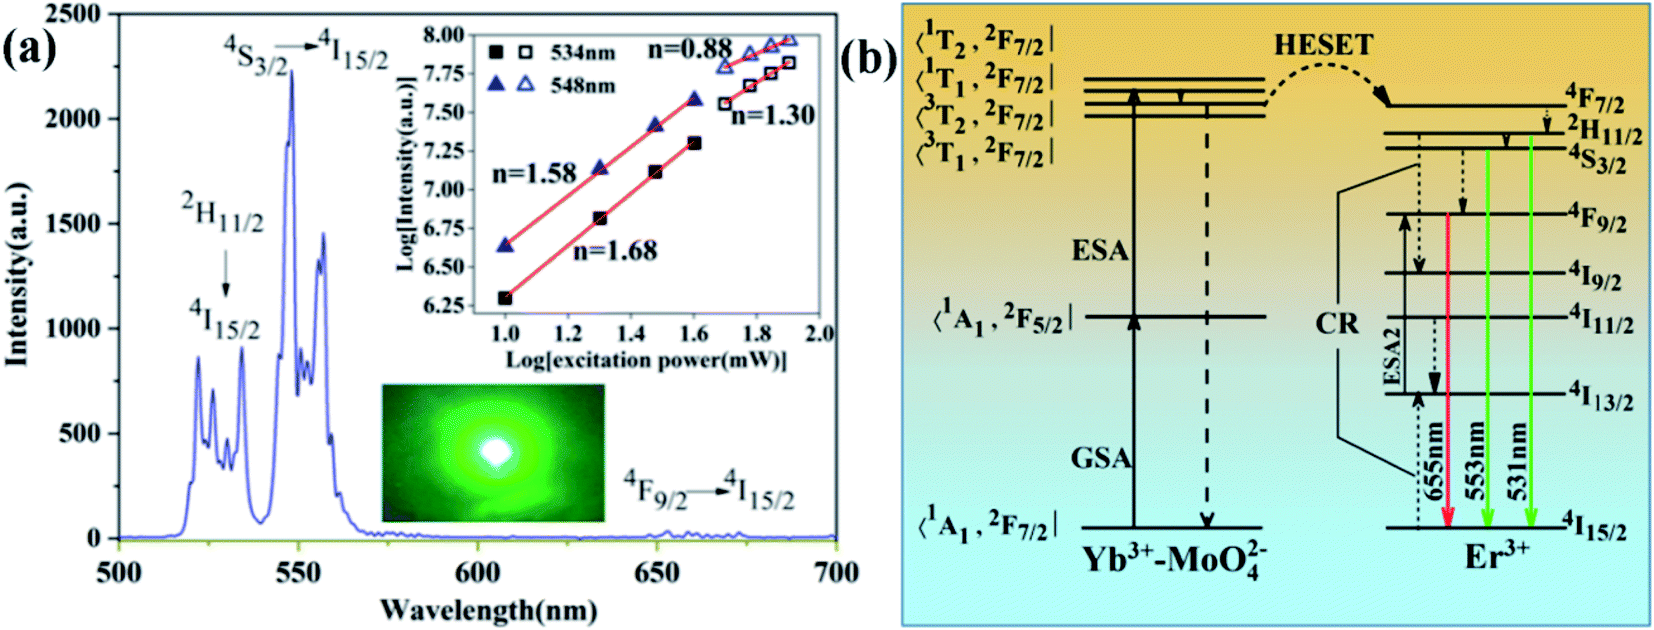
An efficient upconversion emission is essential under the low excitation power density, which can improve the accuracy of temperature measurement and avoid the thermal effect of 980 nm radiation. Dazzling green upconversion emission is observed at the low laser power density 0.083 W cm−2 in the LZMO:0.02Er3+/0.5Yb3+ phosphor. As shown in Fig. 4a, the upconversion emissions at 534 nm, 548 nm, and 655 nm are assigned to the transitions from 2H11/2, 4S3/2, 4F9/2 excited states to 4I15/2 ground state of Er3+ ions, respectively. The log–log plots of upconversion intensity at 534 nm and 548 nm as a function of laser power are shown in the inset of Fig. 4a. The laser power density increases from 0.083 W cm−2 to 0.83 W cm−2. The slope n values of piecewise linear fitting are obtained for 534 nm and 548 nm upconversion emission, respectively. As anyone knows, the slope value n stands for the number of long wavelength photons absorbed each short wavelength photon emitted. In a typical double photon absorption process, the slope value n is close to 2. However, the slope values of n drop rapidly and approach 1, when the laser power density exceeds 0.415 W cm−2. These observations suggest that a typical saturation phenomenon appears. The saturation phenomena take place at only 0.415 W cm−2. It proposes that the upconversion efficiency is very high in the as-fabricated LZMO:0.02Er3+/0.5Yb3+ phosphor.
 | ||
| Fig. 4 (a) Upconversion luminescence. (b) The energy-level diagram and possible upconversion mechanism in LZMO:Er3+/Yb3+ phosphor. | ||
The energy structure of MoO42− complex is composed of the ground state (1A1) and the excited states (3T1, 3T2, 1T1 and 1T2).28 MoO42− ions participate in the upconversion luminescence process and form Yb3+–MoO42− dimer complex.29 For the non-saturable upconversion procedure, new energy level structure of Yb3+–MoO42− dimer-complex and Er3+ ions and the possible upconversion luminescence mechanism are plotted in Fig. 4b. The doping concentration of Yb3+ ions is 25 times that of Er3+ ions. Most of 980 nm laser energy is absorbed by the Yb3+–MoO42− dimer complex through the ground state absorption (GSA) and excited state absorption (ESA) processes. The population of Er3+ ions at 4F7/2 energy level mainly originate from the high excited state energy transfer (HESET) from Yb3+–MoO42− dimer complex to Er3+ ions.30 Due to the small gap between 4F7/2 and 2H11/2/4S3/2 energy levels, Er3+ ions populated at 4F7/2 energy level undergo a non-radiative relaxation process to 2H11/2/4S3/2 energy levels. The subsequent radiative transitions 2H11/2/4S3/2 → 4I15/2 produce intense green upconversion luminescence centered at 531 nm and 553 nm. For the faint red upconversion luminescence, 4F9/2 energy level may be populated by the radiation-free relaxation of 4S3/2 energy level. Due to the large energy level gap (3000 cm−1) between 4S3/2 and 4F9/2, a few phonons are fired to bridge, which results in that few Er3+ ions relax to 4F9/2 energy level. Other channels to realize the population of Er3+ at 4F9/2 energy level are the second excited state absorption process (ESA2) and the cross-relaxation (CR) between (2H11/2 → 4I9/2) and (4I15/2 → 4I13/2) of Er3+ ions. However, the high doping concentration of Yb3+ ions will increase the distance between adjacent Er3+ ions, which reduce the CR process of Er3+ ions. Thus, strong green upconversion luminescence and weak red upconversion luminescence are observed in LZMO:0.02Er3+/0.5Yb3+ phosphor.
The real-time and precise temperature measurement is the reliable guarantee of controllable hyperthermia treatment. As shown in Fig. 1c, the observation of bright green light emission was realized with the power of 1 mW. Strong upconversion luminous signal and large temperature sensitivity are the key of the construction of an accurate FIR thermometer. Fig. 5a shows the upconversion luminescence spectra of the temperature probe at 10 K temperature intervals in the temperature range of 253–423 K. When the temperature increases continuously, the upconversion emission wavelength is basically unchanged. However, the upconversion luminescence integral intensity changes significantly, and the emission at 534 nm and 548 nm showed different trends (Fig. 5b). The integral intensity of 548 nm upconversion luminescence is basically unchanged, while the integral intensity of 534 nm upconversion luminescence continuously increases. Thus, as the temperature rises, the total green upconversion luminescence increases significantly (green points in Fig. 5b). The thermal enhancement of upconversion luminescence was found in nanomaterials and negative thermal expansion bulk materials.31 The lattice contraction at high temperature reduces the distance of active ions and their energy transfer efficiency is enhanced, which is responsible for the thermal enhancement of upconversion luminescence in negative thermal expansion bulk materials.32 In contrast, in the nanomaterials, the large surface-volume ratio (SVR) of nanomaterials leads to the water molecules being easily absorbed in the surface of nanomaterials. With the increase of temperature, the thermal enhancement of upconversion luminescence in nanomaterials is observed due to the desorption of water molecules.33 In order to investigate the possible reason of thermal enhancement in the temperature probe, the in situ XRD experiment results are shown in Fig. 5c. As the temperature rises, the diffraction peaks shift slightly to the left, which rules out the possibility of negative thermal expansion of LZMO:0.02Er3+/0.5Yb3+ phosphor, which is consistent with the previous report.34 As shown in Fig. 5d, when the temperature rises from room temperature to 423 K, the weight in the TGA curve is almost constant, which indicates that the absorbed water at the surface of LZMO:0.02Er3+/0.5Yb3+ phosphor is very limited35 and do not cause the quenching of upconversion luminescence. During the preparation of the temperature probe, the LZMO:0.02Er3+/0.5Yb3+ phosphor was homogeneously dispersed in the NOA61. The strong absorption peak appears at 2800–3300 cm−1 in NOA61, which is resonant with the 4I11/2–4I13/2 of Er3+ ions.32 Thus, the intermediate energy level 4I11/2 of Er3+ ions is easy to non-radiatively relax to 4I13/2 energy level. Accompanying with the increase of temperature, the quenching effect is weakened and the thermal enhancement phenomenon occurs.
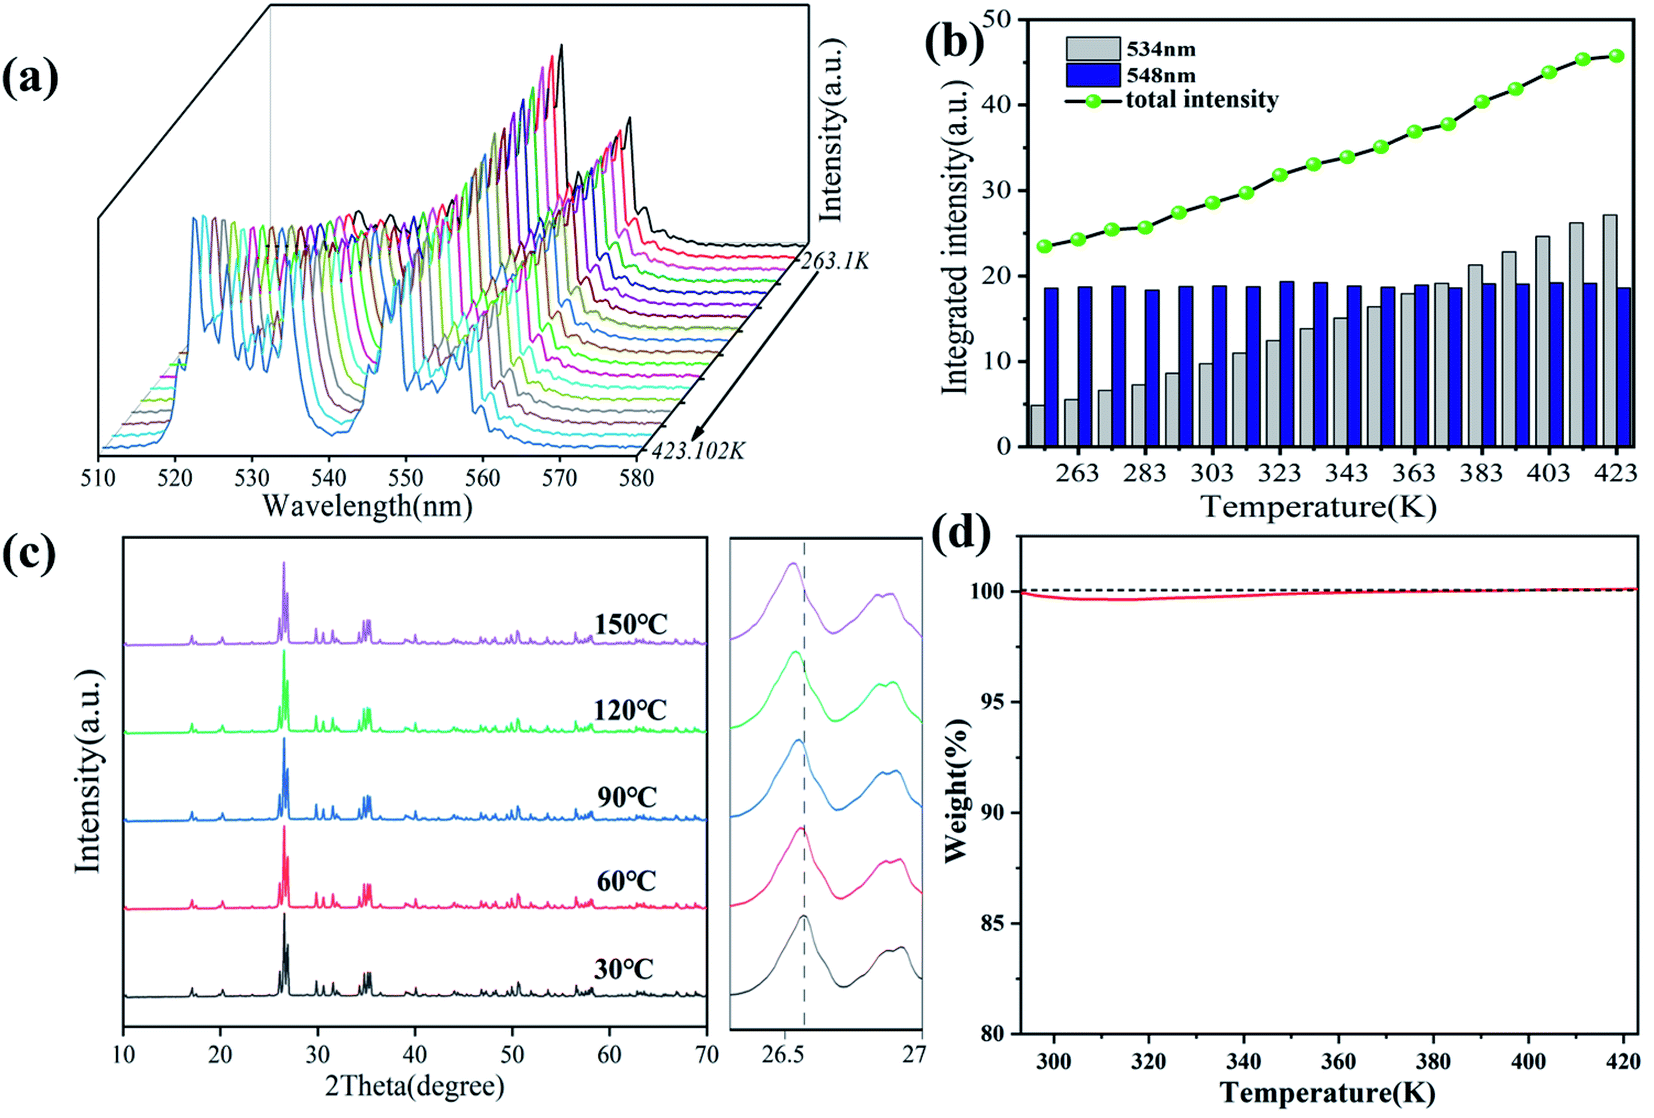 | ||
| Fig. 5 (a) Upconversion luminescence spectra versus temperature in LZMO:0.02Er3+/0.5Yb3+ phosphor. (b) Relationship between integral upconversion emission intensities and temperature. (c) XRD images of LZMO:0.02Er3+/0.5Yb3+ at different temperature. (d) Weight loss curve of LZMO:0.02Er3+/0.5Yb3+ phosphor. | ||
When the ambient temperature rises from 253 K to 423 K, although the 548 nm emission intensity fluctuates up and down, the FIR of the two peaks keeps increasing and increasing from 0.27 to 1.45. This exhibits the advantages of the FIR thermometer, which can eliminate the impact of signal fluctuations due to slight changes in external environment. The high dependence of FIR and temperature is attributed to the thermally-coupled 2H11/2 and 4S3/2 energy levels and the populations of them obey the Boltzmann equation:36
 | (1) |
 | (2) |
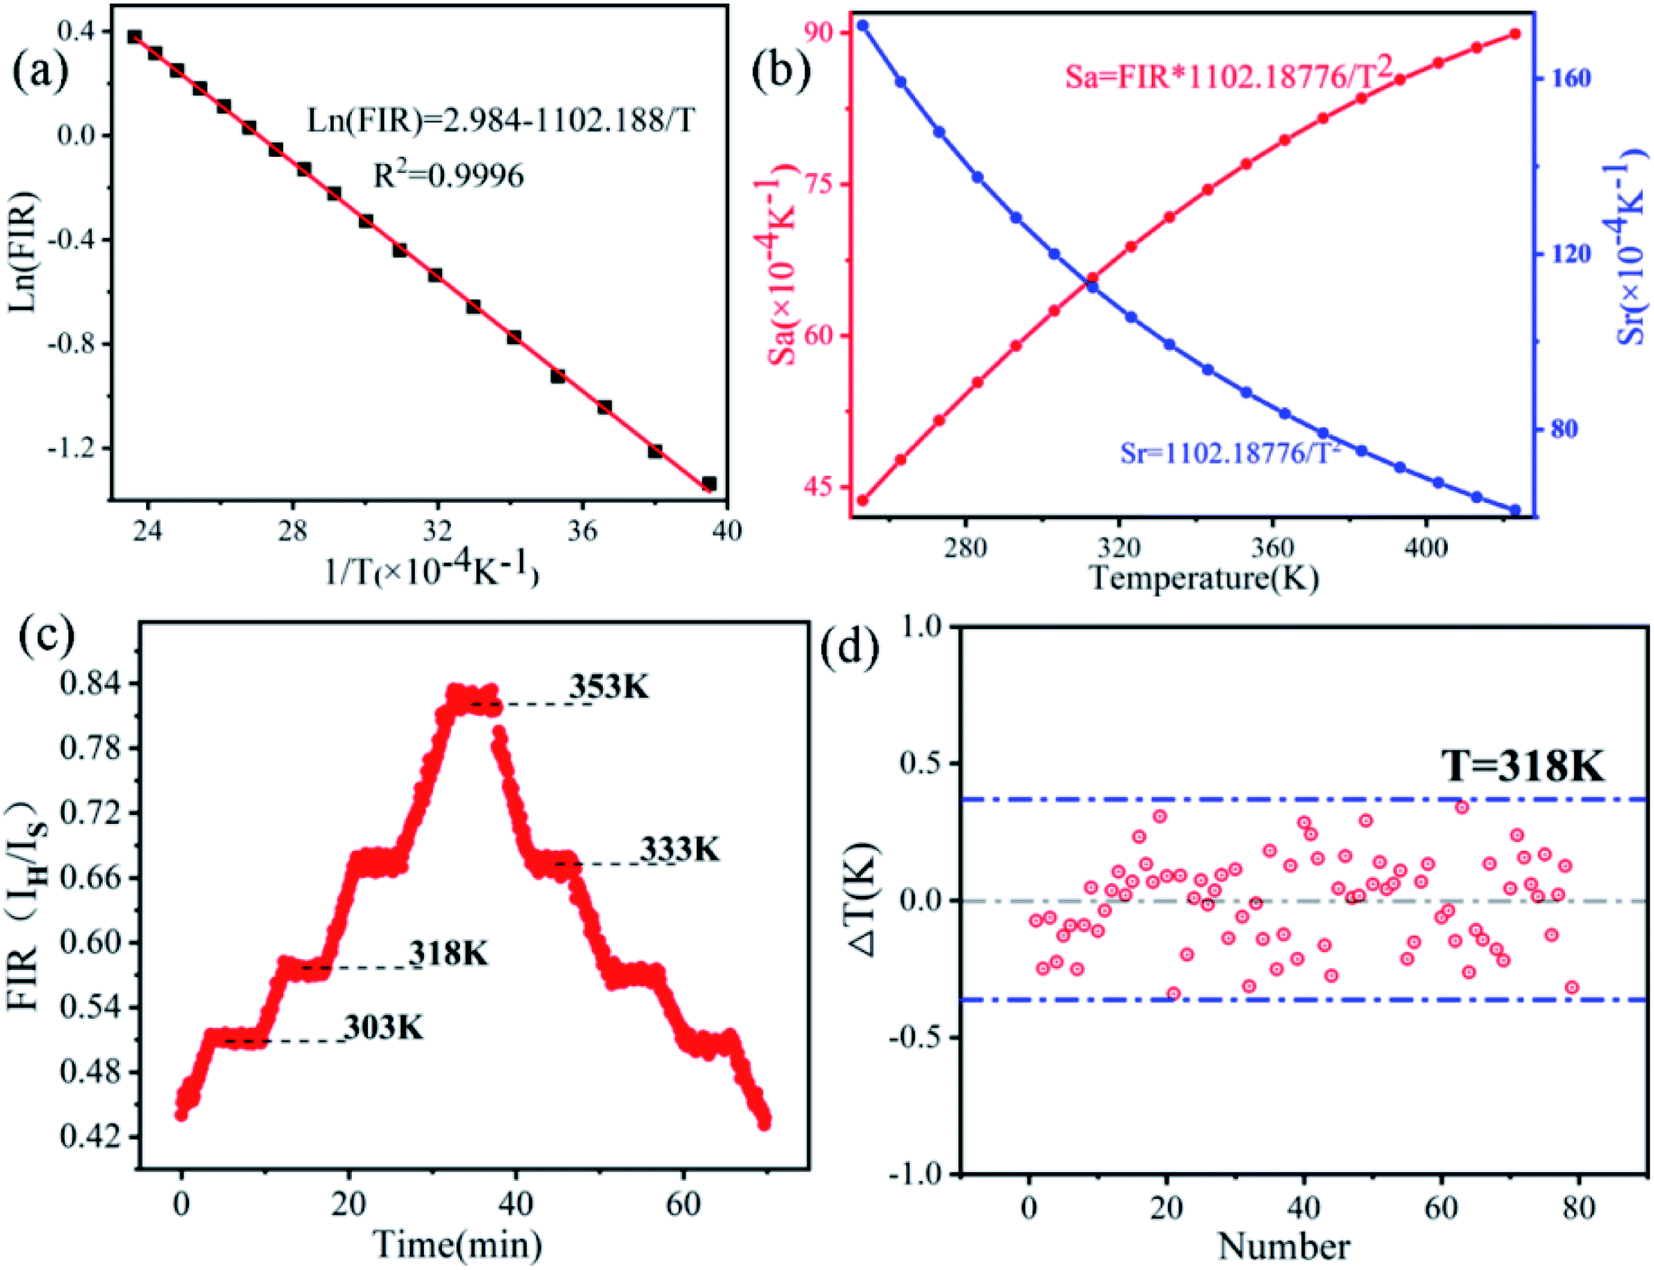 | ||
| Fig. 6 (a) The dependence of ln(FIR) on 1/T. (b) Temperature sensitivities Sa and Sr as a function of temperature. (c) Response of the sensor to step-tuned temperatures. (d) The difference ΔT at 318 K. | ||
Sr is a normalized Sa relative to FIR and expressed as:37
 | (3) |
Fig. 6b shows the temperature dependence of Sa and Sr in the range of 258–423 K. With the rising of temperature, the sensitivity Sa increases gradually and reaches the maximum result 89.9 × 10⁻⁴ K−1 at 423 K. In contrast, the sensitivity Sr reduces continuously and reaches the maximum value of 0.0172 at 253 K. A comparison of temperature sensing performance in different rare earth doped optical materials has been listed in the Table 1.38–41 The established all-fiber sensor demonstrates great advantage and may be used for practical applications.
| Matrix material | Temperature range/K | Sa/K−1 | Sr/K−1 | Ref. |
|---|---|---|---|---|
| Gd2MoO6:Yb3+/Er3+ | 303–703 | 0.0053 (350 K) | 0.0037 | 38 |
| NaY(MoO4)2:Yb3+/Er3+ | 303–523 | 0.0097 (493 K) | 0.00668 | 39 |
| LaF3:Yb3+/Er3 | 300–500 | — | 0.00157 (386 K) | 40 |
| NaYF4:Yb3+/Er3+ | 303–483 | — | 0.0045 (303 K) | 41 |
| LZMO:0.02Er3+/0.5Yb3+ | 258–423 | 0.00899 (423 K) | 0.0172 (253 K) | This work |
In order to estimate the stability of the temperature sensor, the temperature at each point record 80 points (interval 5 s) conversion spectral information shown in Fig. 6c. As the temperature gradually increases, the sensor feedback increases accordingly. After cooling to room temperature, the sensor output quickly returns to the original value. In order to intuitively judge the temperature accuracy of all-fiber temperature sensor, according to the calibration curve in Fig. 6a, the measured temperature values based on FIR values at 318 K are obtained. Thus, the difference ΔT between the measured and actual temperature is calculated and shown in Fig. 6d. All temperature falls in the error range of ±0.4 K. The relative standard deviation (RSD) of 80 temperature points is calculated and the RSD value at 318 K is only 0.20%, which is far less than the actual demand of 1%.17 The above preliminary experimental results show that the all-fiber FIR thermometer has the advantages of high accuracy and good stability, which can be used for actual temperature measurement.
High temperature laser photohyperthermia has shown a good effect in tumor treatment. Real time online temperature feedback is of great importance during the laser therapy.19 The integrated needle can simultaneously realize the dual functions of temperature measurement and photothermal therapy. The temperature-sensitive egg white was selected as the research object and the laser power of the heating end was fixed at 300 mW. As shown in Fig. 7a, the albumen was very transparent at the initial stage. With the extension of time, the temperature increased rapidly, and a small amount of chicken protein appeared in transparent egg white. The temperature rose from room temperature to 378 K in just 90 seconds and almost all the egg white turned white. The temperature probe can feedback the change of temperature in real time, which provides a good guarantee for the curative effect of laser hyperthermia.
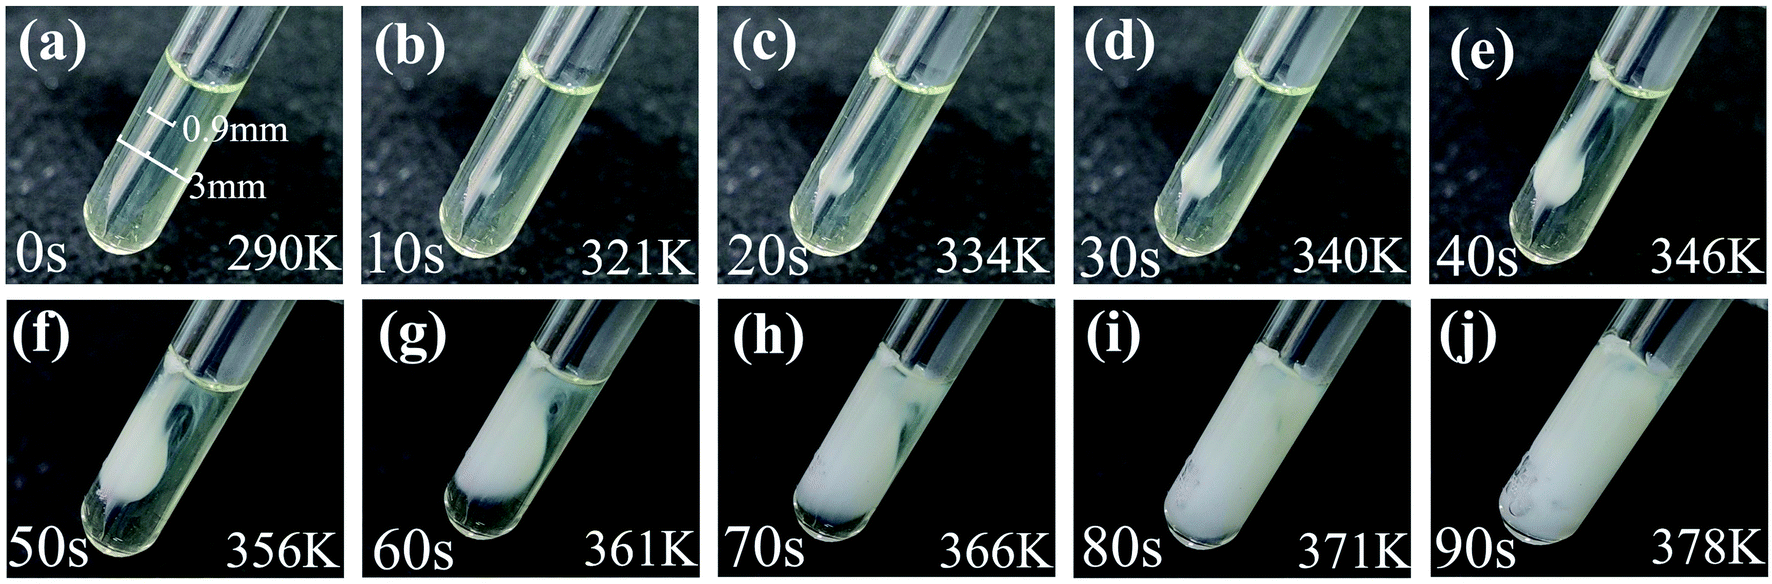 | ||
| Fig. 7 (a–j) The amplified integrated probe heating phenomenon in egg white. The diameters of glass tube and stainless steel needle are 3 mm and 0.9 mm, respectively. | ||
In order to further confirm the feasibility and real effect of the temperature-feedback photothermal therapy in deep tissue, the integrated needle pierced into the central position of the ex vivo pork liver with a width of 3 cm and a thickness of 1 cm. The heating ending with the laser power of 300 mW and 800 mW were used to realize laser thermotherapy. The real-time temperature was also measured by the all-fiber FIR thermometer and shown in Fig. 8a. The initial temperature was around 283.5 K. The temperature rose fast to 303.5 K within 10 seconds and the temperature curves are nearly coincident for 300 mW and 800 mW laser power. Subsequently, for 300 mW laser power, the temperature gradually rises and finally stabilizes at 322 K after 350 seconds. The temperature increased by 40 K at 300 mW. For 800 mW laser power, the temperature stabilized at 346 K after 570 seconds with a temperature rise of 67 K. The temperature is high enough to kill the cancer cells of the patients. Fig. 8b shows the cross-section image along the needle with a power of 800 mW and the healing time of 600 seconds. An ablation zone with the overall size of 1.6 × 0.8 × 0.6 cm3 is centered on the tip of the integrated needle. Therefore, it can be concluded that the device can control the temperature of the heating end by changing the output power within a certain range, and at the same time use the feedback section to detect the temperature of the probe in real time to implement the thermal treatment process of the tumor cells.
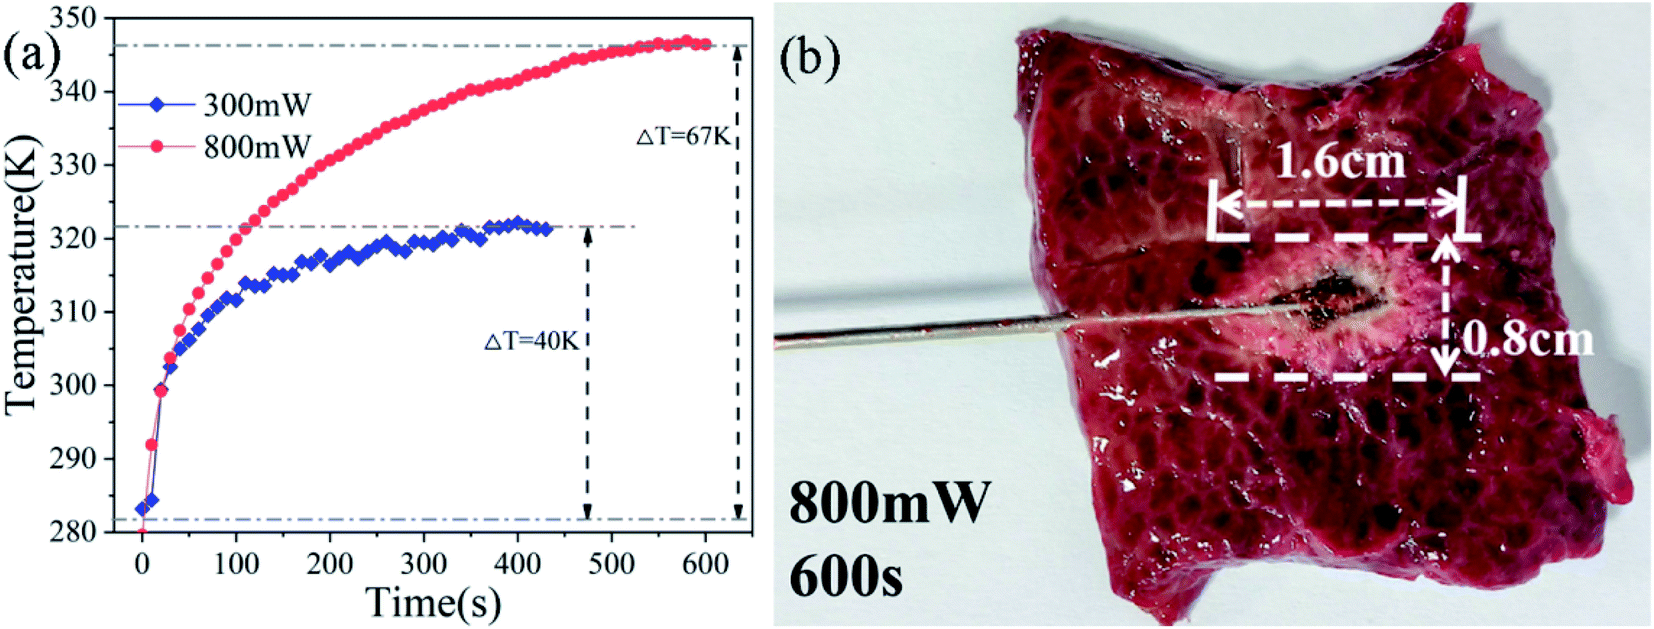 | ||
| Fig. 8 (a) The temperature of FIR thermometer in the pig liver tissue under irradiation with 980 nm laser at 300 mW and 800 mW. (b) Cross-section view of pig liver after heating. | ||
4. Conclusions
In summary, we demonstrated an accurate temperature-feedback photothermal therapy platform in deep tissue based on an all-fiber FIR thermometer. Rare earth doped LZMO phosphors have been prepared and their photoluminescence and temperature sensing characteristics have been investigated. Extremely strong green upconversion emissions were observed. The temperature-dependent upconversion emissions were investigated in detail. The thermal enhancement of upconversion emissions was achieved up to 423 K, which was very beneficial to improve the signal-to-noise ratio of upconversion luminescence at high temperatures. Excellent temperature sensing characteristics were exhibited and the maximum absolute sensitivity reaches 89.9 × 10⁻⁴ at 423 K. The strong upconversion emissions and high temperature sensitivity guarantee the accuracy of temperature measurement. The integrated bifunctional needle can simultaneously realize temperature measurement and laser heating by using different laser power, which was exhibited in the denaturation of egg white and laser ablation of the porcine liver in vitro. In special, the integrated platform may be further miniaturized by using the customized needles and applied in the minimally invasive treatment of tumors.Conflicts of interest
The author declares no competing financial interest.Acknowledgements
This work was supported by Zhejiang Provincial Natural Science Foundation of China (No. LZ21F050001), National Natural Science Foundation of China (No. 12174360) and Open Foundation of Key Laboratory of Rare Earth Optoelectronic Materials and Devices of Zhejiang.References
- X. Wang, O. S. Wolfbeis and R. J. Meier, Chem. Soc. Rev., 2013, 42, 7834–7869 RSC
.
- H. Zhang, S. Zhao, X. Wang, X. Ren, J. Ye, L. Huang and S. Xu, J. Mater. Chem. C, 2019, 7, 15007–15013 RSC
- F. Xu, B. Zheng, H. Xia, J. Wang, H. Song and B. Chen, J. Alloys Compd., 2021, 873, 159790 CrossRef CAS
- H. Suo, X. Zhao, Z. Zhang, Y. Wang, J. Sun, M. Jin and C. Guo, Laser Photonics Rev., 2021, 15, 2000319 CrossRef CAS
- A. S. Laia, D. A. Hora, M. V. d. S. Rezende, Y. Xing, J. J. Rodrigues Jr, G. S. Maciel and M. A. R. C. Alencar, Chem. Eng. J., 2020, 399, 125742 CrossRef CAS
- Q. Wang, M. Liao, Q. Lin, M. Xiong, Z. Mu and F. Wu, J. Alloys Compd., 2021, 850, 156744 CrossRef CAS
- A. A. Ansari, A. K. Parchur, M. K. Nazeeruddin and M. M. Tavakoli, Coord. Chem. Rev., 2021, 444, 214040 CrossRef CAS
- J. Zhong, D. Chen, Y. Peng, Y. Lu, X. Chen, X. Li and Z. Ji, J. Alloys Compd., 2018, 763, 34–48 CrossRef CAS
- X. Wang, Q. Liu, Y. Bu, C.-S. Liu, T. Liu and X. Yan, RSC Adv., 2015, 5, 86219–86236 RSC
- S. F. Leon-Luis, U. R. Rodriguez-Mendoza, P. Haro-Gonzalez, I. R. Martin and V. Lavin, Sens. Actuators, B, 2012, 174, 176–186 CrossRef CAS
- H. Suo, C. Guo, J. Zheng, B. Zhou, C. Ma, X. Zhao, T. Li, P. Guo and E. M. Goldys, ACS Appl. Mater. Interfaces, 2016, 8, 30312–30319 CrossRef CAS PubMed
- H. Zhang, J. Ye, X. Wang, S. Zhao, R. Lei, L. Huang and S. Xu, J. Mater. Chem., 2019, 7, 15269–15275 CAS
- Y. Zi, Z. Yang, Z. Xu, X. Bai, A. Ullah, I. Khan, A. A. Haider, J. Qiu, Z. Song, Y. Wang and Y. Cun, J. Alloys Compd., 2021, 880, 160156 CrossRef CAS
- F. Vetrone, R. Naccache, A. Zamarron, A. Juarranz de la Fuente, F. Sanz-Rodriguez, L. Martinez Maestro, E. Martin Rodriguez, D. Jaque, J. Garcia Sole and J. A. Capobianco, ACS Nano, 2010, 4, 3254–3258 CrossRef CAS PubMed
- C. Bradac, S. F. Lim, H.-C. Chang and I. Aharonovich, Adv. Opt. Mater., 2020, 8, 2000183 CrossRef CAS
- X. Qiu, Q. Zhou, X. Zhu, Z. Wu, W. Feng and F. Li, Nat. Commun., 2020, 11, 4 CrossRef CAS PubMed
- Y. Tu, S. Zhao, D. He, T. Wu, H. Zhang, R. Lei, L. Huang and S. Xu, J. Mater. Chem. C, 2018, 6, 7063–7069 RSC
- S. Musolino, E. P. Schartner, G. Tsiminis, A. Salem, T. M. Monro and M. R. Hutchinson, Biomed. Opt. Express, 2016, 7, 3069 CrossRef CAS PubMed
- P. Ngot Thi, S. L. Lee, S. Park, Y. W. Lee and H. W. Kang, J. Biomed. Opt., 2017, 22, 045008 CrossRef PubMed
- D. Jaque and C. Jacinto, J. Lumin., 2016, 169, 394–399 CrossRef CAS
- X. Zhu, W. Feng, J. Chang, Y. W. Tan, J. Li, M. Chen, Y. Sun and F. Li, Nat. Commun., 2016, 7, 10437 CrossRef CAS
- H. H. Abd Raziff, D. Tan, K. S. Lim, C. H. Yeong, Y. H. Wong, B. J. J. Abdullah, N. Sulaiman and H. Ahmad, IEEE Trans. Instrum. Meas., 2020, 69, 7119–7124 Search PubMed
- M. Jelbuldina, A. Korobeinyk, S. Korganbayev, D. Tosi, K. Dukenbayev and V. J. Inglezakis, IEEE Sens. J., 2018, 18, 8005–8011 CAS
- S. Musolino, A. Salem, T. M. Monro and M. R. Hutchinson, Biomed. Opt. Express, 2016, 7, 3069–3078 CrossRef CAS PubMed
- L. Xue, D. Chen, Z. Lin, P. Lv, F. Huang and J. Liang, J. Alloys Compd., 2007, 430, 67–70 CrossRef CAS
- A. C. Yanes, A. Santana-Alonso, J. Mendez-Ramos, J. Castillo and V. D. Rodriguez, Adv. Funct. Mater., 2011, 21, 3136–3142 CrossRef CAS
- Z. Zou, T. Wu, H. Lu, Y. Tu, S. Zhao, S. Xie, F. Han and S. Xu, RSC Adv., 2018, 8, 7679–7686 RSC
- C. F. Wu, W. P. Qin, G. S. Qin, S. H. Huang, J. S. Zhang, D. Zhao, S. Z. Lu and H. Q. Liu, Chem. Phys. Lett., 2002, 366, 205–210 CrossRef CAS
- D. Li, Z. Wang, X. Zhang, G. Shi, G. Liu and Y. Song, J. Alloys Compd., 2013, 550, 509–513 CrossRef CAS
- D. Li, Y. Z. Huang, Z. Nie, L. Zhang, Y. Bai, X. Zhang, Y. Song and Y. Wang, J. Alloys Compd., 2015, 650, 799–804 CrossRef CAS
- H. Zou, X. Yang, B. Chen, Y. Du, B. Ren, X. Sun, X. Qiao, Q. Zhang and F. Wang, Angew. Chem., Int. Ed., 2019, 58, 17255–17259 CrossRef CAS PubMed
- H. Zou, B. Chen, Y. Hu, Q. Zhang, X. Wang and F. Wang, J. Phys. Chem. Lett., 2020, 11, 3020–3024 CrossRef CAS PubMed
- J. Zhou, S. Wen, J. Liao, C. Clarke, S. A. Tawfik, W. Ren, C. Mi, F. Wang and D. Jin, Nat. Photonics, 2018, 12, 154–158 CrossRef CAS
- R. Shi, E. D. Martinez, C. D. S. Brites and L. D. Carlos, Phys. Chem. Chem. Phys., 2021, 23, 258–264 Search PubMed
- Y. G. Cheng, X. S. Liu, W. B. Song, B. H. Yuan, X. L. Wang, E. J. Liang and M. J. Chao, J. Light Scatt., 2014, 26, 258–264 Search PubMed
- K. Saidi, M. Dammak, K. Soler-Carracedo and I. R. Martin, J. Alloys Compd., 2022, 891, 161993 CrossRef CAS
- Y. Tian, B. N. Tian, C. E. Cui, P. Huang, L. Wang and B. J. Chen, RSC Adv., 2015, 5, 14123–14128 RSC
- P. Du, X. Y. Huang and J. S. Yu, Inorg. Chem. Front., 2017, 4, 1987–1995 RSC
- X. X. Yang, Z. L. Fu, Y. M. Yang, C. P. Zhang, Z. J. Wu and T. Q. Sheng, J. Am. Ceram. Soc., 2015, 98, 2595–2600 CrossRef CAS
- X. R. Cheng, X. C. Ma, H. J. Zhang, Y. F. Ren and K. K. Zhu, Phys. B, 2017, 521, 270–274 CrossRef CAS
- L. Li, F. Qin, Y. Zhou, Y. Zheng, H. Zhao and Z. Zhang, J. Lumin., 2019, 206, 335–341 CrossRef CAS
| This journal is © The Royal Society of Chemistry 2022 |