 Open Access Article
Experimental study of methane hydrate generation characteristics in the presence of GO and Re-GO
Ruirui Wang *a,
Hang Zhoua,
Baoya Yanga,
Weilong Zhaob,
Jun Songa,
Haikun Zhenga,
Xiaoru Haoa and
Wei Shengac
aSchool of Mechanical and Power Engineering, Henan Polytechnic University, Jiaozuo, P. R. China 454000. E-mail: wangrui2233@126.com
bSchool of Civil Engineering, Henan Polytechnic University, Jiaozuo, P. R. China 454000
cHami Yu-Xin Energy Industry Institute, Hami, P. R. China 839000
First published on 21st March 2022
Abstract
The industrial application of hydrate technology is greatly hindered by its slow generation rate, low gas storage rate, harsh generation conditions, and poor environmental friendliness of traditional additives. In this paper, the kinetic and thermodynamic promotion effects of graphene oxide (GO) and recovered graphene oxide (Re-GO) on methane hydrate in different systems were studied by the constant volume methods. The promotion mechanism was analyzed from the micro perspectives of molecular physical properties, interfacial reaction, and nucleation sites. It is found that GO has an excellent kinetic and thermodynamic promotion effect on CH4 hydrate generation. After the recovery process, the thermodynamic effect of Re-GO is basically unchanged, and the kinetic promotion effect is slightly reduced. Furthermore, it is verified that the GO material itself does not have a memory effect in hydrate formation. The results show that GO is an excellent accelerator of CH4 hydrate formation with high recovery value, which provides essential data and an experimental basis for the research and application of graphene oxide and hydrate technology in energy storage and cold storage.
1. Introduction
Natural gas is the fastest growing non-renewable energy source in the world, and its consumption is gradually increasing every year all over the world. The main component of natural gas is methane, which is considered as the cleanest energy source.1 It is stored in large quantities in the form of natural gas hydrate in the permafrost and the seabed of the outer edge of the continental shelf. It is estimated that the global natural gas hydrate reserves are about 2.1 × 10¹⁶ m3, containing about twice as much organic carbon as traditional fossil fuels.2 As a new kind of energy resource, hydrate has attracted much more attention because of its large gas storage per unit volume and excellent environmental protection. Under standard conditions, 1 m3 natural gas hydrate can store about 164 m3 natural gas,3,4 and the energy storage efficiency is excellent. Compared with the liquefaction and compression of natural gas, the thermodynamic conditions of natural gas hydrate are milder, the storage time is longer, and the recovery rate is close to 100%. It shows the advantages of low cost, high safety and high efficiency in the field of natural gas storage and transportation.5 Therefore, natural gas hydrate has the ability to be used as the medium of natural gas storage and transportation. In addition to its use in energy transportation and storage,6,7 hydrate has also achieved great results in the fields of carbon dioxide capture,8–10 refrigeration11,12 and cooling storage,13,14 gas separation,15,16 seawater desalination17,18 and so on.However, the formation conditions of hydrate are harsh, the formation rate is slow, and the gas storage capacity cannot reach to the ideal value, which seriously affects its applications in natural gas storage and transportation and the development of other hydrate technologies. To address these problems, there are two main solutions proposed. One is to promote gas hydrate generation by changing the gas–liquid contact mode, increasing the gas–liquid contact area, and enhancing the heat and mass transfer capacity of the system, such as stirring, spraying, and bubbling.19–22 The other one is to add promoters to improve the thermodynamic conditions of hydrate generation or to accelerate the formation of hydrate and improve its kinetic parameters.23–26 The research of different physical methods and additives used to change the hydrate formation kinetics has made a great contribution to the development of hydrate technology.27 However, the operation process of physical method is complex, and the investment and operation cost of equipment is high. Traditional kinetic additives such as SDS will produce bubbles during dissociation, resulting in low gas recovery and difficult biodegradation, so they are not suitable for industrial scale application.28,29 Commonly used thermodynamic additives, such as quaternary ammonium salt30,31 and THF,32 are often non reusable, contain toxic substances and have poor environmental protection.33 They are also not suitable for industrial scale applications.
Nanoparticles refer to micro particles of nanometer scale, which are defined as particles less than 100 nm in at least one dimension. Due to the advantages of high specific surface area, high activity and good thermal conductivity, nano materials have attracted more and more attention in the field of hydrate. Eastman et al.34 investigated the thermal conductivity of nanofluids and found that the incorporation of nanomaterials significantly improved the heat transfer capacity of fluids. Li et al.35 drew on the idea of enhanced fluid heat transfer with nanoparticles to promote the rapid generation of gas hydrates for the first time. By studying the effect of nanoparticles on the kinetic parameters of gas hydrate, Samer et al.36 found that nanoparticles with the relatively large specific surface have the most significant promoting effects in the hydration reaction process. Graphene oxide (GO) is a monatomic layer product after oxidation and stripping from graphite powder. Compared with ordinary nanoparticles, graphene oxide has a superior specific surface area and thermal conductivity, which is more favorable to promote the nucleation and formation of gas hydrates. Moreover, it can stably exist in an aqueous solution and a polar solvent. Therefore, GO can be used as a promoter of gas hydrates. Wang et al.37 experimentally studied and analyzed the effects of SGO (sulfonated graphene oxide), GP, and GO on the growth kinetic properties of methane hydrates. The results showed that SGO greatly shortens the growth time of hydrate and improves the storage capacity of natural gas. Yan et al.38 demonstrated the existence of an optimal facilitating concentration of 50 ppm for GO in the generation of CO2 hydrate. Abedi et al.39,40 studied the formation of methane hydrate and propane hydrate in the presence of carbon nanostructures successively. The results suggested that the presence of carbon nanostructures such as GO had a positive effect on the nucleation and growth rate of hydrate. Rezaei et al.41 experimentally studied the promotion of ethylene hydrate by GO and SDS. The results showed that the use of graphene oxide suspensions significantly contributed to the induction time and effective energy storage of ethylene hydrate. Zhong et al.42 accelerated the separation of CH4 from low concentration coalbed methane by adding GO. The results showed that the addition of GO increased the hydrate formation rate and gas consumption.
Above all, it is shown that GO has been proved to be an excellent accelerator for a variety of gas hydrates. Nevertheless, there is still a lack of research on the recovery of graphene oxide and its memory effect based on hydrate formation. In addition, there are few reports on the thermodynamic effects of GO and the micromechanical investigation of the induction stage of hydrate generation. Therefore, this study emphasizes the thermodynamic characteristics and kinetic parameters of methane hydrate generation in the presence of GO and Re-GO, the memory effect of GO in hydrate generation, and the microscopic promotion mechanism of the formation stage.
2. Experimental section
2.1 Apparatus
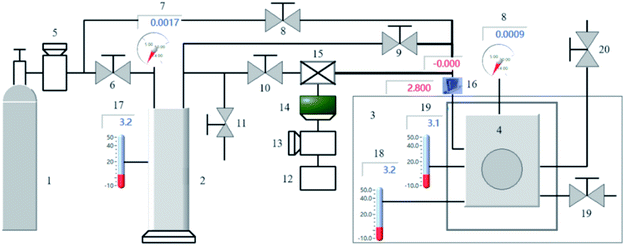
The experimental setup utilized in this study is schematically illustrated in Fig. 1. The primary experimental setup includes a high-pressure reactor, control device, gas supply equipment, buffer tank, magnetic coupling stirring, data acquisition system, and refrigeration unit. The reactor is fully transparent and visible. Its main body is 316L stainless steel, the observation surface is sapphire, the volume is 200 mL, the bearing pressure range is 0–20 MPa, the bearing temperature range is −10 to 40 °C, and the measurement and control accuracy of temperature and pressure are ±0.1 °C and 0.01 Mpa respectively. The temperature sensor model is XT5213-RDSC, produced by Hangzhou XueZhongTan Constant Temperature Technology Co., Ltd. The pressure sensor model is TRAFAG 8252.81, which is produced by Shanghai Bogu Automation Equipment Co., Ltd. The stirring speed is 100–1400 rpm, and the speed measurement accuracy is 1400 ± 2 rpm. The reactor is immersed in a thermostatic water tank of 80 × 80 × 80 cm, and the cold capacity is continuously provided by the cryostat. The cryostat has a temperature control accuracy of ±0.1 °C and a temperature control range of −10 to 15 °C. The cryostat model is DFY-30L, produced by Hai'an Hongmai Machinery Co., Ltd. The data acquisition system is a self-developed HMFY-II hydrate formation experimental device, which collects and records experimental data in real time.2.2 Materials
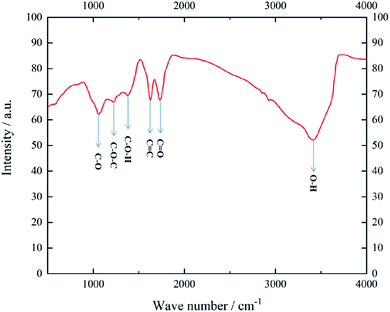
(1) Experimental gas methane, purity 99.99%, Henan Yuanzheng Special Gas Co., Ltd.(2) Experimental monolayer graphene oxide, Shenzhen Graphene Technology Co., Ltd. The material was characterized by FTIR to determine its functional group species, and the results are shown in Fig. 2. It indicates that GO mainly contains carboxyl (–COOH), hydroxyl (–OH), carbonyl (–C![[double bond, length as m-dash]](https://www.rsc.org/images/entities/char_e001.gif) O) and epoxy groups (–CH–O–CH).
O) and epoxy groups (–CH–O–CH).
(3) Deionized water, made in the laboratory.
(4) Electronic balance, model jzk-fa210, accuracy ±0.0001 g, Fuzhou Huazhi Scientific Instrument Co., Ltd.
(5) Ultrasonic cleaner, model kq3200de, Kunshan Ultrasonic Instrument Co., Ltd.
(6) Automatic surface tension analyzer, model qbzy-1, sensitivity 0.1 mN m−1, Shanghai Fangrui Instrument Co., Ltd.
(7) Bt-802 automatic circulating dispersion injection system and bt-9300se laser particle size distribution instrument, Dandong Baite Instrument Co., Ltd.
2.3 Solution preparation and recovery process
Prepare GO solutions with concentrations of 0.05, 0.1, 0.2, 0.4 g L−1, respectively, and ensure the uniformity of the solution through ultrasonic oscillation.GO in the solution was recovered by vacuum drying and water bath evaporation. The vacuum drying method is to put the beaker into the vacuum drying oven and set the temperature to 50 °C to prevent the properties from being damaged by high temperature until it is completely dried, which can ensure the complete recovery of graphene oxide. The water bath stirring and steaming method is to put the beaker on the constant temperature magnetic stirrer of the water bath, set the temperature at 50 °C, tie the fresh-keeping film with several holes to facilitate the outflow of water vapor, use stirring to accelerate the evaporation of water, turn off stirring when there is no obvious water, and use the constant temperature water bath to completely dry it.
2.4 Procedures
2.5 Calculation methods
According to the gas law equation and combined with the actual gas parameters, the gas absorption is calculated by the following equation:39
 | (1) |
In eqn (1), A and B are calculated using the following equation
 | (2) |
 | (3) |
 | (4) |
 | (5) |
| Vt = Vcell − VSO + VRWt − VHt | (6) |
The gas absorption rate at any time during hydrate formation, expressed as r, is defined as follows:
 | (7) |
The conversion rate of water to hydrate stands for the ratio of the moles of initial water to the hydrate generated at the end of the reaction.
 | (8) |
3. Results and discussions
3.1 Analysis of experimental process
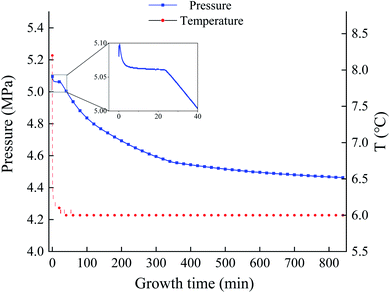
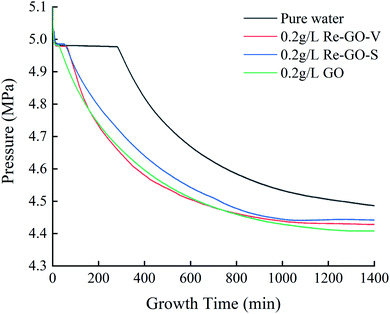
The experiment was carried out at 279.15 K and 5 MPa. Fig. 3 illustrates the variation of temperature and pressure for methane hydrate formation by GO under this condition. From the trend of the curve, the whole reaction stage can be divided into four parts: cooling dissolution stage, formation induction stage, mass formation stage, and complete formation stage. The initial 5 min is the gas dissolution stage. After the gas is introduced into the reactor, it is rapidly dissolved in water, and the pressure drops rapidly. The presence of graphene oxide can reduce the surface tension of the solution. At the same time, coupled with the role of stirring, it speeds up the dissolution rate of methane gas, resulting in a extremely short time of gas dissolution stage. After 5 min, the hydrate enters the formation induction stage. Within 5–25 minutes, methane gas and GO solution dissolved in methane reach fugacity equilibrium, the pressure in the kettle remains stable. This period is the formation stage of hydrate crystal nucleus, and the macro characteristics will hardly change. After 25 minutes, the induction period come to end. The growth of a large number of hydrate nuclei breaks through the critical size. At this time, a large number of hydrates begin to form and suddenly increase with the slope of the gas pressure curve. In addition, the process is accompanied by an increase in temperature because of the water and the reaction release heat. However, due to the large volume of the thermostatic water tank where the reactor is located and the high thermal conductivity generated by the huge specific surface area of go, the heat generated by the reaction can be eliminated in a very short time, resulting in little temperature change in the system. With the progress of hydration process, the gas pressure in the reactor gradually decreases, and the slope of pressure curve also gradually decreases, indicating that the formation rate of hydrate is slowing down until the system reaches a stable temperature and pressure state. This is because the pressure driving force of the system gradually decreases, and the formation and decomposition rate of hydrate gradually reach a balance state.Fig. 4 shows the temperature–pressure diagrams of the methane hydrate generation process for the pure water system, the GO system, and the Re-GO system with two recovery methods. It can be observed that the trend of the methane hydrate generation process is approximately the same for each system except for the difference in the length of induction time.
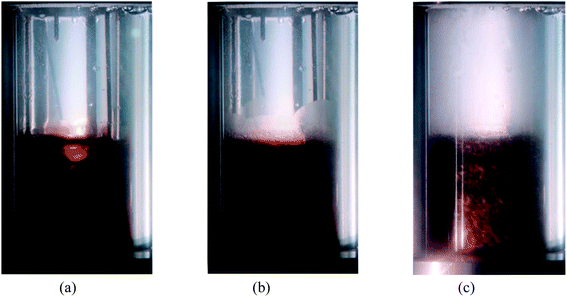
Fig. 5 shows the growth of hydrate in the reactor with time. Combined with the temperature and pressure analysis of hydrate formation process: at 10 min, the gas–liquid interface differentiated obviously, the liquid had a certain light transmittance, and the air pressure remained stable. It indicates that the system is still in the formation induction stage. 25 minutes after the critical size of hydrate nucleus increases to saturation state, the hydrate induction stage ended. At this point, the slope of the gas pressure curve suddenly increases, accompanied by temperature fluctuations with the exothermic generation, cloud-like hydrates are generated on the inner wall of the reactor, and the translucency of the liquid decreases, while granular hydrates are observed to begin to be generated at the gas–liquid contact interface. At 60 min, the inner wall is full of fog-like and cloud-like hydrate, and there is a lot of granular and wafer hydrate in the solution. The system is in a vigorous formation stage. With the increase of time, the slope of the pressure curve gradually decreases until it tends to be flat and reaches complete formation.
3.2 Dynamic effect
The kinetic experiment was carried out under the designed conditions of 279.15 K and 5 MPa. The effects of GO and Re-GO at the concentrations of 0.05, 0.1, 0.2, and 0.4 g L−1 on the kinetic effect of methane hydrate were studied were studied respectively. After the first formation experiment of methane hydrate, keep the temperature constant and reduce the pressure to below the phase equilibrium pressure to promote the decomposition of methane hydrate. When the decomposition is complete, replenish qi to the original experimental set pressure, continue the dynamic experimental steps, and complete the dynamic experiment of memory effect.The induction times of each system at 279.15 K and 5 MPa are shown in Table 1. It was found that the induction time for the pure water system was long at 264.5 min under these experimental conditions. After adding GO, the induction time of each system was significantly reduced, and the kinetic promotion effect was extremely effective. Among them, the addition of GO at a concentration of 0.05 g L−1 minimized the induction time of the system by 96.8% compared to the pure water system. The promotion of Re-GO is slightly lower than GO, about 85%, which still has high economic value and can be improved by the recycling process.
| Concentration, g L−1 | Ind time, min (fresh) | Ind time, min (memory) | Ind time, min (vacuum drying) | Ind time, min (water bath stirring) |
|---|---|---|---|---|
| Pure water | 264 ± 5 | |||
| 0.05 | 8 ± 1 | 6 ± 1 | 40 ± 2 | 18 ± 1 |
| 0.1 | 21 ± 2 | 15 ± 1 | 46 ± 2 | 24 ± 1 |
| 0.2 | 16 ± 1 | 11 ± 1 | 47 ± 3 | 21 ± 1 |
| 0.4 | 24 ± 2 | 19 ± 2 | 61 ± 3 | 30 ± 2 |
Due to the characteristics of the hydrate memory effect, the water produced by hydrate decomposition is more accessible to form hydrate again than the water without hydrate formation history, and the induction time at the second regeneration will be shorter. On the premise of ensuring that the physical properties of GO materials do not change, the water in the hydrate decomposition solution is evaporated dry by vacuum drying and water bath stirring, and the formation experiment is carried out again. It was found that after removing the memory effect of the hydrate itself, the induction time of each system in the presence of GO was longer than that of the first formation experiment. It can be proved that GO material itself does not have the memory effect of methane hydrate formation.
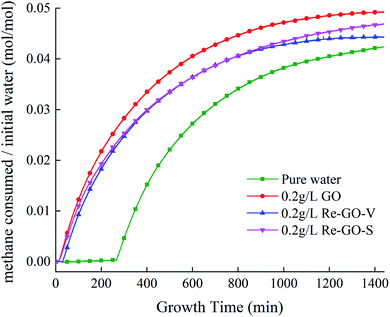
Fig. 6 shows the change of gas consumption in the progress of hydration at 5 MPa 279.15 K. It is observed that the gas consumption undergoes a stabilization period early in the early hydration process, which is the induction stage. After that, gas consumption increases rapidly, and gas is rapidly captured during the initial stages of large-scale hydrate generation, leading to a significant increase in gas consumption. In the progress of hydration, the temperature and pressure gradually reach a steady state, and the growth of gas consumption gradually tends to be flat until being stable. It can be seen that the gas storage capacity, compared to the pure water system, with the addition of GO, is increased in all cases, with a maximum increase of 16.2%. It indicates that the addition of GO can lead to an increase in gas storage during hydrate generation.
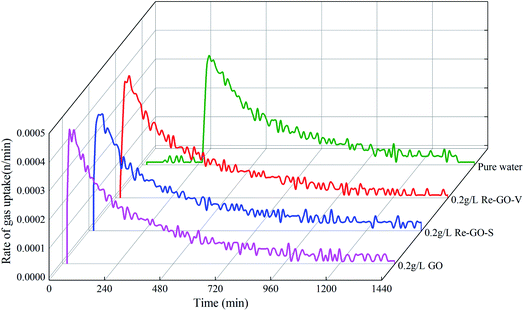
Fig. 7 shows the gas absorption rates of each system during the reaction. It can be observed that all systems will have a strong peak, indicating that the gas absorption rate reaches the highest. The strong peaks of GO and Re-GO systems are higher than those of the pure water, and GO at a concentration of 0.2 g L−1 works best for the first generation. The kinetic promotion effect of recovered Re-GO is slightly reduced, resulting in a slight decrease in gas absorption rate. After that, the rate will gradually decrease until the system is stable. The appearance of the strong peak of gas absorption rate was significantly earlier after the addition of GO, in comparison with the pure water system, indicating that the induction time was significantly reduced.
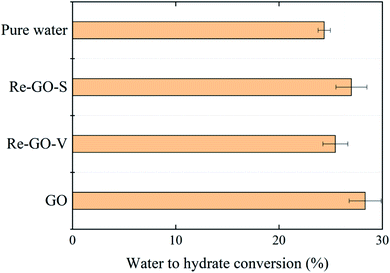
Fig. 8 shows the percentage of water converted to hydrate after complete hydrate formation in each system. It was observed that at the end of the hydrate reaction, the addition of GO, compared to the pure water system, had a significant effect on the final water to hydrate conversion. The effect of GO concentration on the conversion was consistent with the results of previous analyses. It is the presence of GO promotes the rate of reaction kinetics, increases gas storage, and enhances the heat and mass transfer capacity of the system. The closer the system parameters at the end of the hydration are to the phase equilibrium state parameters, the higher the water to hydrate conversion rate.
3.3 Thermodynamic effect
In order to verify the correctness of experimental equipment, materials, and operation methods and reduce experimental errors, the parameters of phase equilibrium state for the pure water system CH4 hydrate were determined and verified by experimental results43 from the literature. As shown in Fig. 9, the data parameters measured in the experiment are basically consistent with the literature. The phase equilibrium parameters of methane hydrate added with 0.05, 0.2, and 0.3 g L−1 graphene oxide under different pressure conditions and the thermodynamic promotion effect of GO before and after recovery at the same concentration 0.2 g L−1 were studied and measured. The experiments are compared with the phase equilibrium parameter in the pure water system.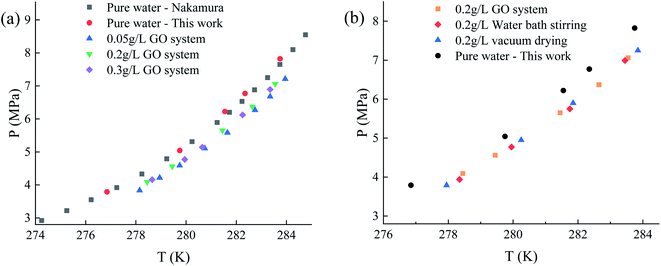 | ||
| Fig. 9 Phase equilibrium parameters of methane hydrate in each system. (a) Comparison between pure water and GO system. (b) Comparison between pure water and Re-GO system. | ||
As shown in Fig. 9, compared with the pure water system at the same temperature, the phase equilibrium pressure under the GO system is reduced. Within the research range of 278–284 K, the curve as whole shifts to the right by about 1–1.2 K, and this effect is little affected by the change of concentration. Furthermore, the thermodynamic effects of Re-GO after different recovery processes are not different from GO. It suggests that the contribution from GO to the thermodynamics of CH4 hydrate is limited and almost constant. The influence mechanism of nanoparticles on the phase equilibrium of hydrates remains inconclusive. In this study, it is considered that the size effect of the uniform dispersion of graphene oxide nanoparticles in the solution and the huge specific surface area of GO itself lead to the ordering of water molecules around it, reduce the activity of water molecules, and lead to the right deviation of the phase equilibrium curve.
3.4 Promotion mechanism analysis
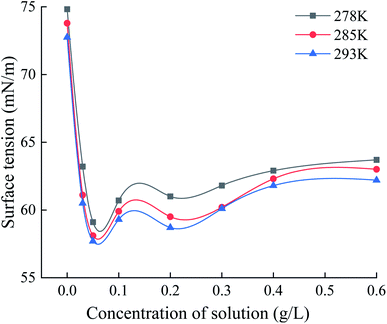
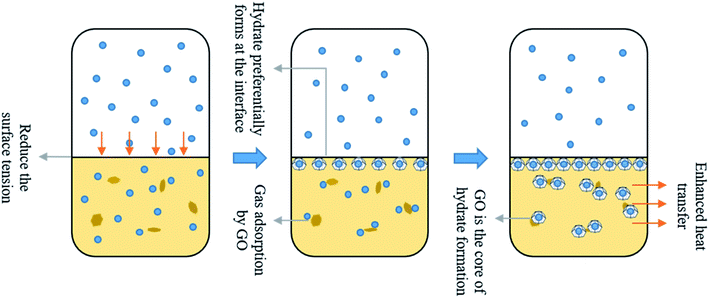
Graphene oxide is the monolayer product of graphene after oxidation. Hydroxyl and epoxy groups are randomly distributed on its monolayer, and carboxyl and carbonyl groups are present on the edge part. This makes GO distributed with different properties from hydrophilic to hydrophobic from the edge to the center. Therefore, GO can be present at the interface as surfactant, reducing the interfacial energy and the resistance of gas to enter the liquid phase. Fig. 10 shows the surface tension profiles of GO solutions with different concentrations at different temperature conditions and deionized water as a control. It can be observed that compared with the surface tension of deionized water of 72.75 mN m−1, the addition of low concentration of GO can significantly reduce the surface tension of the solution, with an overall reduction of about 14.6%–21.3%.Graphene oxide has a huge specific surface, which improves the overall heat transfer performance in solution and can rapidly export the heat generated by hydration, creating superior conditions for hydrate formation. The homogeneously dispersed GO nanoparticles in solution supply plenty of excellent heterogeneous nucleation points for the hydration reaction of gas and water with lower Gibbs free energy than homogeneous nucleation, to improve the nucleation efficiency of hydrates. In addition, GO has excellent hydrophilicity and easily constitutes hydrogen bonds to water molecules, to reduce the interfacial energy, enhance the gas–liquid contact area and the gas dissolution rate, accelerate the hydrate growth. Fig. 11 shows the promotion mechanism with GO for methane hydrate generation.
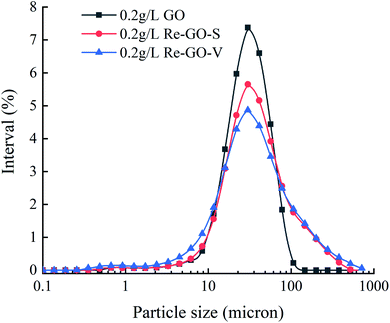
Fig. 12 shows the particle size distribution of GO with two recovery methods of Re-GO. The volume average diameter of 0.2 g L−1 graphene oxide solution is 32 μm. The volume average diameter of Re-GO by water bath stirring recovery process increases to 51 μm, while the volume average diameter of Re-GO by vacuum drying recovery process is 56 μm, especially 13.88% has exceeded 100 μm. This indicates that the GO solution within the nanomaterials are very uniformly dispersed, which provides a larger contact area between the gas and liquid phases for the generation of methane hydrate. In contrast, Re-GO is more aggregated in solution, which somewhat attenuates the promotion effect on hydrate generation.
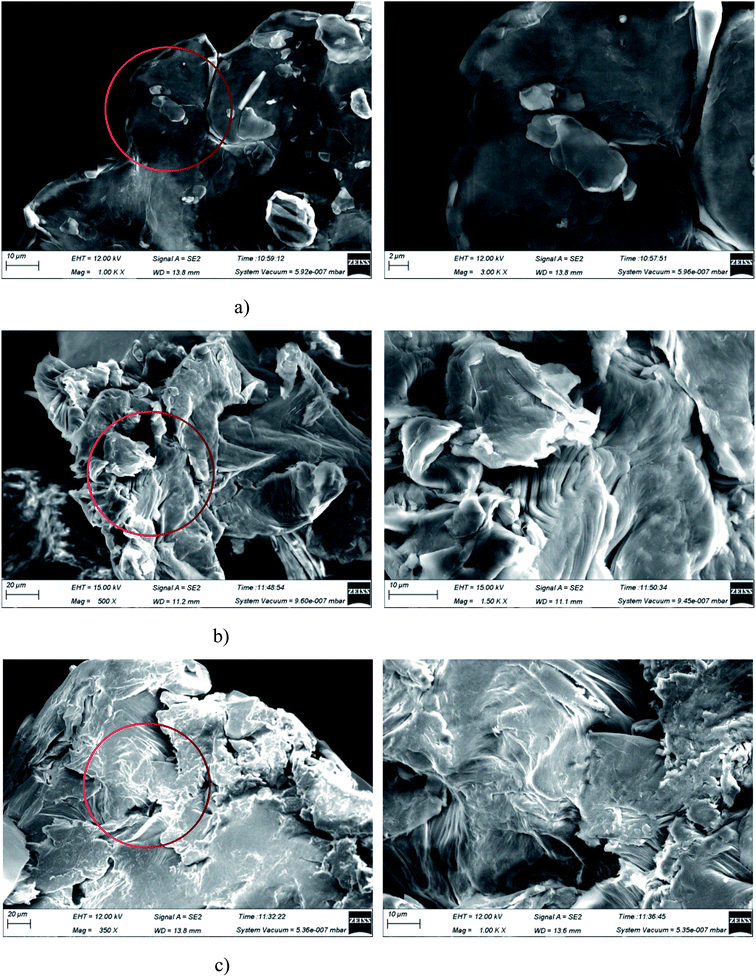
Fig. 13 shows the SEM images of GO and Re-GO at different magnification. It can be observed that the material planar ductility of GO is excellent and there is almost no wrinkling occurs, which well maintains the monolayer property of the structure. After triple magnification of the partial details, it is observed that the GO of the stacked part is still single-layered, which has no effect on the excellent monolayer and plane ductility of the material as a whole. The excellent kinetic promotion effect of GO is based on the huge specific surface area and high thermal conductivity of the material. The higher the monolayer ratio of the material, the better the physical properties and the better the promotion of hydrate formation. The morphology of the Re-GO recovered by vacuum drying and water bath agitation changed considerably, with the appearance of fold phenomena and interlayer accumulation. Especially, the plane ductility of Re-GO recovered by vacuum drying is greatly damaged. After triple magnification of the partial details, it is observed that the original expanded single-layer plane has become a composite layer full of folds, and some of them have changed from single atomic layer products to multi-layer products. This reduces the specific surface area and heat transfer properties of the material to a certain extent, affects the heat and mass transfer capacity of the solution, and reduces the kinetic promotion effect of Re-GO in the formation of hydrate. The Re-GO recovered by water bath stirring can better retain the original promotion effect, indicating that this recovery process has little impact on its form, which proves that the recovery effect of GO can be improved by the recovery process, with high repeated recovery rate and good economic value.
4. Conclusions
Effects of GO and Re-GO on the kinetic parameters and thermodynamic phase equilibrium parameters for methane hydrate under different systems were studied. The promotion mechanism is analyzed from the micro perspectives of molecular physical properties, interfacial reaction, and nucleation position. The main conclusions are summarized as follows:(1) The whole hydrate reaction stage was classified into four parts: cooling dissolution, formation induction, mass formation, and complete formation.
(2) The system containing GO and Re-GO, compared with traditional hydrate additives, has both kinetic and thermodynamic promoting effects on hydrate formation, such as shortened induction time, accelerating natural gas consumption, increasing natural gas reserves, improving hydrate conversion, and relieving formation phase equilibrium conditions. In addition, GO can be recycled after use. Therefore, it is a novel, environmentally friendly, and efficient excellent accelerator.
(3) Compared with GO, the thermodynamic effect of Re-GO is basically unchanged while the kinetic effect is slightly reduced. It has a significant economic value with a high repeatable recovery rate and the recovery effect can be improved by the recycling process.
(4) In the process of methane hydrate formation, GO does not have the memory effect of formation.
Conflicts of interest
There are no conflicts to declare.Acknowledgements
This work was supported by the Key Scientific Research Project of Henan Province (No. 21A470003), the Key Laboratory of Low-grade Energy Utilization Technologies and Systems, Ministry of Education (No. LLEUTS-201916 and LLEUTS-201915). This work was also supported by the Henan Yuanjiang Fund, Science and Technology Project of Hami City and Xinjiang Uygur Autonomous Region Talent Special Project.References
- G. C. Leung, Handbook of clean energy systems, 2015, pp. 1–15 Search PubMed.
- J. Liu, J.-X. Ding and D.-Q. Liang, Energy, 2018, 157, 54–64 CrossRef CAS.
- E. D. Sloan Jr and C. A. Koh, Clathrate hydrates of natural gases, CRC Press, 2007 Search PubMed.
- A. Khokhar, J. Gudmundsson and E. Sloan, Fluid Phase Equilib., 1998, 150, 383–392 CrossRef.
- F. Wang, H. Meng, G. Guo, S. J. Luo and R. B. Guo, ACS Sustainable Chem. Eng., 2017, 6597–6604 CrossRef CAS.
- H. P. Veluswamy, R. Kumar and P. Linga, Appl. Energy, 2014, 122, 112–132 CrossRef CAS.
- V. V. Struzhkin, B. Militzer, W. L. Mao, H.-k. Mao and R. J. Hemley, Chem. Rev., 2007, 107, 4133–4151 CrossRef CAS PubMed.
- Z.-M. Xia, X.-S. Li, Z.-Y. Chen, G. Li, K.-F. Yan, C.-G. Xu, Q.-N. Lv and J. Cai, Appl. Energy, 2016, 162, 1153–1159 CrossRef CAS.
- K. M. Sabil and B. Partoon, Current Opinion in Green and Sustainable Chemistry, 2018, 11, 22–26 CrossRef.
- A. Hassanpouryouzband, J. Yang, B. Tohidi, E. Chuvilin, V. Istomin, B. A. Bukhanov and A. Cheremisin, ACS Sustainable Chem. Eng., 2018, 6, 5732–5736 CrossRef CAS.
- X. Wang, M. Dennis and L. Hou, Renewable Sustainable Energy Rev., 2014, 36, 34–51 CrossRef CAS.
- W. Zhang, Y. Wang, X. Lang and S. Fan, Energy Convers. Manage., 2017, 146, 43–51 CrossRef CAS.
- X. Shi and P. Zhang, Int. J. Refrig., 2014, 42, 77–89 CrossRef CAS.
- W. Lin, D. Dalmazzone, W. Fürst, A. Delahaye, L. Fournaison and P. Clain, Fluid Phase Equilib., 2014, 372, 63–68 CrossRef CAS.
- D.-L. Zhong, N. Daraboina and P. Englezos, Energy Fuels, 2013, 27, 4581–4588 CrossRef CAS.
- D.-L. Zhong, D.-J. Sun, Y.-Y. Lu, J. Yan and J.-L. Wang, Ind. Eng. Chem. Res., 2014, 53, 15738–15746 CrossRef CAS.
- Y.-N. Lv, S.-S. Wang, C.-Y. Sun, J. Gong and G.-J. Chen, Desalination, 2017, 413, 217–222 CrossRef CAS.
- K.-n. Park, S. Y. Hong, J. W. Lee, K. C. Kang, Y. C. Lee, M.-G. Ha and J. D. Lee, Desalination, 2011, 274, 91–96 CrossRef CAS.
- S. Bergeron, J. G. Beltrán and P. Servio, Fuel, 2010, 89, 294–301 CrossRef CAS.
- Y. Tian, Y. Li, H. An, J. Ren and J. Su, J. Chem., 2017, 2017, 1–5 CrossRef.
- J. Cai, C.-G. Xu, Z.-M. Xia, Z.-Y. Chen and X.-S. Li, Appl. Energy, 2017, 204, 1526–1534 CrossRef CAS.
- S.-S. Park and N.-J. Kim, J. Ind. Eng. Chem., 2013, 19, 1668–1672 CrossRef CAS.
- H. Ganji, M. Manteghian, M. Omidkhah and H. R. Mofrad, Fuel, 2007, 86, 434–441 CrossRef CAS.
- U. Karaaslan and M. Parlaktuna, Ann. N. Y. Acad. Sci., 2000, 912, 735–743 CrossRef CAS.
- X. Wang and M. Dennis, Chem. Eng. Sci., 2015, 137, 938–946 CrossRef CAS.
- M. Mooijer-Van Den Heuvel, R. Witteman and C. Peters, Fluid Phase Equilib., 2001, 182, 97–110 CrossRef CAS.
- A. Hassanpouryouzband, E. Joonaki, M. V. Farahani, S. Takeya, C. Ruppel, J. Yang, N. J. English, J. M. Schicks, K. Edlmann and H. Mehrabian, Chem. Soc. Rev., 2020, 49, 5225–5309 RSC.
- H. P. Veluswamy, Q. W. Hong and P. Linga, Cryst. Growth Des., 2016, 16, 5932–5945 CrossRef CAS.
- F. Wang, G. Q. Liu, H. L. Meng, G. Guo, S. J. Luo and R. B. Guo, ACS Sustainable Chem. Eng., 2016, 4, 2107–2113 CrossRef CAS.
- M. Arjmandi, A. Chapoy and B. Tohidi, J. Chem. Eng. Data, 2007, 52, 2153–2158 CrossRef CAS.
- X. Wang and M. Dennis, Chem. Eng. Sci., 2015, 938–946 CrossRef.
- D.-L. Zhong, Z. Li, Y.-Y. Lu, J.-L. Wang and J. Yan, Appl. Energy, 2015, 158, 133–141 CrossRef CAS.
- S. R. Scott, L. J. Partridge and F. W. Mackison, DHHS publication (USA), no. (NIOSH) 81-123, 1981.
- J. A. Eastman, U. Choi, S. Li, L. Thompson and S. Lee, MRS Online Proc. Libr., 1996, 457, 3–11 CrossRef.
- J. Li, D. Liang, K. Guo, R. Wang and S. Fan, Energy Convers. Manage., 2006, 47, 201–210 CrossRef CAS.
- S. Said, V. Govindaraj, J.-M. Herri, Y. Ouabbas, M. Khodja, M. Belloum, J. S. Sangwai and R. Nagarajan, J. Nat. Gas Sci. Eng., 2016, 32, 95–108 CrossRef CAS.
- F. Wang, H.-L. Meng, G. Guo, S.-J. Luo and R.-B. Guo, ACS Sustainable Chem. Eng., 2017, 5, 6597–6604 CrossRef CAS.
- S. Yan, W. Dai, S. Wang, Y. Rao and S. Zhou, Energies, 2018, 11, 1756 CrossRef.
- S. Abedi-Farizhendi, M. Iranshahi, A. Mohammadi, M. Manteghian and A. H. Mohammadi, Pet. Sci., 2019, 16, 657–668 CrossRef CAS.
- S. Abedi-Farizhendi, M. Rahmati-Abkenar, M. Manteghian, J. S. Yekshaveh and V. Zahmatkeshan, J. Pet. Sci. Eng., 2019, 172, 636–642 CrossRef CAS.
- E. Rezaei, M. Manteghian and M. Tamaddondar, J. Pet. Sci. Eng., 2016, 857–863 CrossRef CAS.
- J.-B. Li, D.-L. Zhong and J. Yan, J. Nat. Gas Sci. Eng., 2020, 76, 103212 CrossRef CAS.
- T. Nakamura, T. Makino, T. Sugahara and K. Ohgaki, Chem. Eng. Sci., 2003, 58, 269–273 CrossRef CAS.
| This journal is © The Royal Society of Chemistry 2022 |

