 Open Access Article
Photocatalytic hydrogenation of acetophenone on a titanium dioxide cellulose film†
Tabea A. Thiela,
Keisuke Obatab,
Fatwa F. Abdi b,
Roel van de Krol
 ab,
Reinhard Schomäckera and
Michael Schwarze
 *a
*a
aTechnische Universität Berlin, Department of Chemistry: Multiphase Reaction Engineering, Straße des 17. Juni 124, Sekr. TC8, 10623 Berlin, Germany. E-mail: ms@chem.tu-berlin.de
bInstitute for Solar Fuels, Helmholtz-Zentrum Berlin für Materialien und Energie GmbH, Hahn-Meitner-Platz 1, 14109 Berlin, Germany
First published on 1st March 2022
Abstract
A previously developed sustainable immobilization concept for photocatalysts based on cellulose as a renewable support material was applied for the photocatalytic hydrogenation of acetophenone (ACP) to 1-phenyl ethanol (PE). Four different TiO2 modifications (P25, P90, PC105, and PC500) were screened for the reaction showing good performance for PC25 and PC500. PC500 was selected for a detailed kinetic study to find the optimal operating conditions, and to obtain a better understanding of the photocatalytic pathway in relation to conventional and transfer hydrogenation. The kinetic data were analyzed using the pseudo-first-order reaction rate law. A complete conversion was obtained for ACP concentrations below 1 mM using a 360 nm filter and argon as the purge gas within 2–3 hours. High oxygen concentrations slow down or prevent the reaction, and wavelengths below 300 nm lead to side-products. By investigating the temperature dependency, an activation energy of 22 kJ mol−1 was determined which is lower than the activation energies for conventional and transfer hydrogenation, because the light activation of the photocatalyst turns the endothermic to an exothermic reaction. PC500 was immobilized onto the cellulose film showing a 37% lower activity that remains almost constant after multiple use.
1. Introduction
Green chemistry has become increasingly significant in the context of environmental problems and climate change in the recent 20 years.1 It is defined by twelve principles including catalysis, energy efficiency, atom economy, renewable feedstocks, less hazardous synthesis pathways, and chemicals, and overall accident prevention. Hydrogenation of C![[double bond, length as m-dash]](https://www.rsc.org/images/entities/char_e001.gif) O, C
O, C![[double bond, length as m-dash]](https://www.rsc.org/images/entities/char_e001.gif) N, C
N, C![[double bond, length as m-dash]](https://www.rsc.org/images/entities/char_e001.gif) C, and N
C, and N![[double bond, length as m-dash]](https://www.rsc.org/images/entities/char_e001.gif) O bonds is one of the most basic reactions, performed industrially, and can be done using various pathways (Fig. 1). For “classic” hydrogenation with molecular hydrogen, technical safety equipment and assessments, as well as trained personnel concerning explosion hazards, are necessary. Furthermore, for this type of hydrogenation, harsh reaction conditions are required. For instance, the widely used representative molecule for aromatic ketones, acetophenone, requires elevated pressures up to 50 bar and temperatures up to 170 °C.2–5 Although many transfer hydrogenations use isopropanol as hydrogen donor and solvent simultaneously, they still need temperatures up to 70–80 °C, and catalysts that are sometimes difficult to synthesize and often sensitive to air and water.6–9 Photocatalytic hydrogenation reactions are similar to transfer hydrogenations since they also take place in a liquid phase and use alcohols as hydrogen donors, although with rather different reaction mechanisms.9,10 The photocatalytic process can make use of cheap and readily accessible photocatalysts like titanium dioxide (TiO2) that can be used without further modifications. Titanium dioxide is one of the most studied catalysts for photocatalytic applications, since it is used for the purification of wastewater, water splitting, and also for organic synthesis reactions.11
O bonds is one of the most basic reactions, performed industrially, and can be done using various pathways (Fig. 1). For “classic” hydrogenation with molecular hydrogen, technical safety equipment and assessments, as well as trained personnel concerning explosion hazards, are necessary. Furthermore, for this type of hydrogenation, harsh reaction conditions are required. For instance, the widely used representative molecule for aromatic ketones, acetophenone, requires elevated pressures up to 50 bar and temperatures up to 170 °C.2–5 Although many transfer hydrogenations use isopropanol as hydrogen donor and solvent simultaneously, they still need temperatures up to 70–80 °C, and catalysts that are sometimes difficult to synthesize and often sensitive to air and water.6–9 Photocatalytic hydrogenation reactions are similar to transfer hydrogenations since they also take place in a liquid phase and use alcohols as hydrogen donors, although with rather different reaction mechanisms.9,10 The photocatalytic process can make use of cheap and readily accessible photocatalysts like titanium dioxide (TiO2) that can be used without further modifications. Titanium dioxide is one of the most studied catalysts for photocatalytic applications, since it is used for the purification of wastewater, water splitting, and also for organic synthesis reactions.11
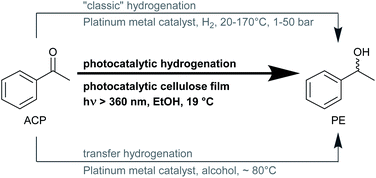 | ||
| Fig. 1 Three different types of hydrogenation reaction of acetophenone (ACP) to 1-phenyl ethanol (PE) with common reaction conditions. | ||
Photocatalytic hydrogenations of C![[double bond, length as m-dash]](https://www.rsc.org/images/entities/char_e001.gif) O, C
O, C![[double bond, length as m-dash]](https://www.rsc.org/images/entities/char_e001.gif) N, and N
N, and N![[double bond, length as m-dash]](https://www.rsc.org/images/entities/char_e001.gif) O double bonds in the liquid phase provide an even greener alternative to conventional hydrogenation reactions as they take place under mild reaction conditions and use alcohols as a green solvent and hydrogen donor.12 Since suspended photocatalysts are a problem for large-scale photoreactors with regard to separation and reuse of the catalyst from the liquid reaction medium, immobilization of the photocatalyst is necessary. Metal oxide photocatalysts like titanium dioxide can be deposited as a film on substrates via dip coating, sol–gel coating, spin coating or atomic layer deposition, where metal substrates like steel plates or polymeric substrates like polypropylene, polyacrylonitrile, and polyethersulfone can be used.13,14 Recently we reported the fabrication and testing of photocatalytic cellulose films for hydrogen evolution15 as cellulose is one of the most abundant biopolymers and can be inexpensively isolated from various sources and modified.16,17 Reported titanium dioxide cellulose composites were produced by depositing the titanium dioxide onto the cellulose via bottom-up approaches18 or by non-solvent induced phase separation.19 The advantage of our films is their non-elaborate fabrication method, where the existing photocatalyst powder is dispersed into the cellulose dispersion in a methanol–water mixture and filtered onto a filter paper.15 In this contribution, a self-supporting photocatalyst cellulose film (PCF) was prepared, in which cellulose acts as a support for the TiO2 photocatalyst. It was studied for the photocatalytic hydrogenation of acetophenone (ACP) to 1-phenylethanol (PE). The main target was to investigate, if a PCF can be used as a green and simple catalyst in photocatalytic synthesis reactions. For the study of the PCF in comparison to the dispersed photocatalyst, high initial ACP concentrations as reported in the literature20,21 would involve long and elaborate experiments. The comparison between a suspended photocatalyst and a PCF can also be done with less time consuming and less costly experiments at lower initial ACP concentrations. Therefore, initial ACP concentrations were fixed below 1 mM. At first, a suitable experimental approach was developed and photocatalytic experiments were carried out with varying the kind of purge gases, cut-off filters, commercial TiO2 photocatalysts, initial ACP concentrations, temperatures, and reactor geometries. The activity of the used TiO2 was evaluated based on the reaction rate constant obtained from fitting the experimental data to a pseudo-first-order reaction rate law. Finally, the optimum reaction conditions were applied to the PCF, and the activity and stability of the PCF for ACP hydrogenation were investigated.
O double bonds in the liquid phase provide an even greener alternative to conventional hydrogenation reactions as they take place under mild reaction conditions and use alcohols as a green solvent and hydrogen donor.12 Since suspended photocatalysts are a problem for large-scale photoreactors with regard to separation and reuse of the catalyst from the liquid reaction medium, immobilization of the photocatalyst is necessary. Metal oxide photocatalysts like titanium dioxide can be deposited as a film on substrates via dip coating, sol–gel coating, spin coating or atomic layer deposition, where metal substrates like steel plates or polymeric substrates like polypropylene, polyacrylonitrile, and polyethersulfone can be used.13,14 Recently we reported the fabrication and testing of photocatalytic cellulose films for hydrogen evolution15 as cellulose is one of the most abundant biopolymers and can be inexpensively isolated from various sources and modified.16,17 Reported titanium dioxide cellulose composites were produced by depositing the titanium dioxide onto the cellulose via bottom-up approaches18 or by non-solvent induced phase separation.19 The advantage of our films is their non-elaborate fabrication method, where the existing photocatalyst powder is dispersed into the cellulose dispersion in a methanol–water mixture and filtered onto a filter paper.15 In this contribution, a self-supporting photocatalyst cellulose film (PCF) was prepared, in which cellulose acts as a support for the TiO2 photocatalyst. It was studied for the photocatalytic hydrogenation of acetophenone (ACP) to 1-phenylethanol (PE). The main target was to investigate, if a PCF can be used as a green and simple catalyst in photocatalytic synthesis reactions. For the study of the PCF in comparison to the dispersed photocatalyst, high initial ACP concentrations as reported in the literature20,21 would involve long and elaborate experiments. The comparison between a suspended photocatalyst and a PCF can also be done with less time consuming and less costly experiments at lower initial ACP concentrations. Therefore, initial ACP concentrations were fixed below 1 mM. At first, a suitable experimental approach was developed and photocatalytic experiments were carried out with varying the kind of purge gases, cut-off filters, commercial TiO2 photocatalysts, initial ACP concentrations, temperatures, and reactor geometries. The activity of the used TiO2 was evaluated based on the reaction rate constant obtained from fitting the experimental data to a pseudo-first-order reaction rate law. Finally, the optimum reaction conditions were applied to the PCF, and the activity and stability of the PCF for ACP hydrogenation were investigated.
2. Materials and methods
2.1. Chemicals
For the experiments, the following chemicals and photocatalysts were used as received: acetophenone (ACP, >98.5%, TCI-Chemicals), 1-phenylethanol (PE, 98.0%, TCI-Chemicals), ethanol (EtOH, >99.7%, VWR-Chemicals), acetonitrile (ACN, 99.9%, Roth), and four titanium dioxide (TiO2) modifications namely PC500 (>99%, Cristal Activ), PC105 (>99%, Cristal Activ), P90 (≥99.5%, Evonik), and P25 (≥99.5%, Evonik). Argon (5.0, Linde) and nitrogen from the household line were used as purge gases.2.2. Preparation of photocatalyst cellulose films
The modification of cellulose was carried out by sulfuric acid hydrolysis (see ESI†). The modified cellulose (abbreviated as ModCe) was dispersed in a methanol–water mixture (v/v = 70/30) to prepare a ModCe dispersion which was used as the liquid phase. For the preparation of the photocatalyst cellulose film (PCF), PC500 (41 mg) was mixed with the ModCe dispersion (8.8 mL, 5 g L−1) and sonicated for 15 min. Then it was filtered through a common filter paper in an ultrafiltration cell at a pressure of 1.5 bar set with nitrogen, washed with water, and dried there. The dry PCF has a diameter of 4.2 cm. The PCF for photocatalytic hydrogenations was cut out with a punching iron for a diameter of 3.2 cm and easily pulled off from the filter paper.2.3. Photocatalytic hydrogenation of ACP
Two double-walled photoreactors, sealed with a rubber septum, one for side-irradiation (SIR, V = 35 mL) and another one for top-irradiation (TIR, V = 250 mL), were used for the photocatalytic hydrogenation experiments. For measurements with suspended catalysts, 24 mg of the photocatalyst were placed in the SIR and 20 mL ethanol containing 100 ppm ACP were added. For experiments with immobilized catalysts, the prepared PCF has an immobilized amount of TiO2 photocatalyst of 24 mg. It was fixed to a Teflon holder and placed into the TIR and 20 mL ethanol containing 100 ppm ACP was added. For the reference experiment with the powdered photocatalyst in TIR, the same approach as in SIR was used. The reactor was then sealed with rubber septa. The liquid phase was flushed with argon for 20 min with cannulas inserted through the septa. The reactors were tempered to 19 °C and irradiated through a quartz glass window by a 300 W Xe-lamp (Quantum Design Europe) for each setup. A cut-off filter that cuts the wavelengths below 360 nm was placed between the lamp and the reactor to remove a part from the UV spectrum. The liquid phases were mixed with a magnetic stirrer at 300 rpm for SIR and 1200 rpm for TIR. The distance between the lamp and the liquid surface was 10 cm for the SIR and 11.5 cm for the TIR. Samples were taken at given time intervals for 120 min for the SIR and 300 min for the TIR.2.4. HPLC analysis
The samples from the photocatalytic hydrogenation were filtered through a cellulose acetate (CA, 0.2 μm) syringe filter and analyzed by high-performance liquid chromatography (HPLC) using a chromatography setup from Agilent (model 1260 Infinity II) equipped with an RP18 column from Ziemer Chromatographie. ACN and water were used as eluents in a volume ratio of 40/60, at a column temperature of 25 °C and a flow rate of 1.3 mL min−1. The retention times were 6.0 min and 4.3 min for ACP and PE, respectively.In experiments with regular sampling, the ACP concentration profiles were fitted using a pseudo-first-order reaction rate law, where cACP is the ACP concentration, k is the reaction rate constant, and t the time.
 | (1) |
For curve fitting, the program Berkeley Madonna (Version 8.3.18) was used. From the reaction rate constants obtained for different reaction temperatures, the apparent activation energy was obtained by the Arrhenius plot, where EA is the activation energy, R the universal gas constant, and k∞ the pre-exponential factor:
 | (2) |
For further information about the reaction kinetics see ESI.†
2.5. SEM and GC analysis
The morphology of the film was studied by scanning electron microscopy (SEM) using a Zeiss DSM 982 GEMINI microscope which operated at an acceleration voltage of 8 kV. Hydrogen in the headspace after the photocatalytic reaction was detected by gas chromatography (GC) using an Agilent Technologies System (7890 A) equipped with a thermal conductivity detector (TCD). An HP Plot 5A column (Agilent Technologies, 30 m, 0.53 mm, 25 μm molsieve, inlet temperature 100 °C, and oven temperature 75 °C) and argon as the carrier gas (1.2 mL min−1) were used.3. Results and discussion
3.1. Establishing reaction operating conditions
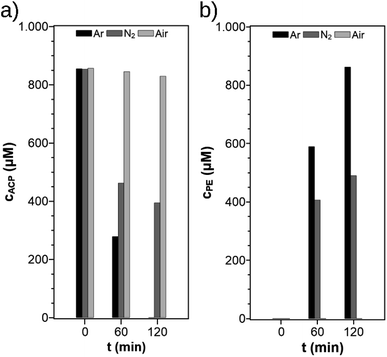
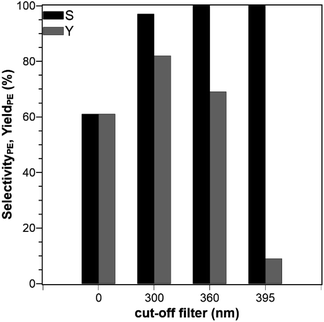
It is well known that the reaction conditions in photocatalysis can have a huge impact on the reaction kinetics. Therefore, different parameters were varied to find the optimum reaction conditions for suspended TiO2 photocatalysts. In the later part of the investigations these conditions were supposed to be applied for the photocatalyst cellulose film. For all experiments, the TiO2 modification PC500 was used based on a catalyst screening as described in Section 3.2. First, it was investigated whether the use of argon or nitrogen as a purge gas affects the reaction performance. The suspensions investigated in SIR were purged with each gas for 20 min, and as a reference, one suspension was not purged. The decay of the ACP concentration and the increase of the PE concentration are shown in Fig. 2. When argon is used as the purge gas, a complete conversion of ACP to PE takes place within 120 min, whereas the reaction takes place at a much slower rate when nitrogen is used as the purge gas. The aerated suspension shows no PE production and a small decay of ACP, probably by side reaction on the photocatalytic reduction sites with the remaining oxygen in the solution. The GC measurement of nitrogen from the household line shows a residual oxygen concentration of 0.10–0.12 vol%. Because argon is the heavier gas, it can displace the oxygen better than nitrogen and prevents it from re-entering. Higher oxygen content in the reactor will slowdown the reaction. In presence of dissolved air, almost no reaction takes place because oxygen acts as an inhibitor. An oxygen molecule O2 can scavenge an electron from the conduction band to form the superoxide O2˙−. The superoxide can react with surface adsorbed protons to form hydroxyl radicals HO˙− and hydroxyl anions HO−, which are the key reactants in photocatalytic degradation of pollutants.22,23 In the radical-mechanism for the photocatalytic ACP hydrogenation on TiO2 postulated by Kohtani et al.,20 these species interrupt the radical chain reaction. The concentration of atmospheric oxygen in ethanol was estimated to be 2 mM and the concentration in the headspace of the reactor is 23 M (calculations are shown in the ESI†) which is higher than the ACP concentration. Presumably, the photocatalytic hydrogenation of ACP should start if the oxygen in the reaction system is consumed. To validate the consumption of O2 in the reaction, another experiment with a non-inertised ACP solution was performed. The sealed reactor was irradiated for six hours and the ratio of N2/O2 for air of 3.71 changed to 128 showing the consumption of O2. After six hours, the residual O2 concentration in the headspace was about 0.5 vol% indicating that the consumption of oxygen needs a long time. For this reason, it was decided to use argon in all subsequent experiments.The selectivity and yield of PE in photocatalytic ACP hydrogenation were investigated using the SIR in combination with various cut-off-filters (cutting wavelengths below 300 nm, 360 nm, and 395 nm) and for one experiment no filter was used (Fig. 3). This experiment is focused on the optimal wavelength range. With a 300 nm filter, a maximum yield of 82% after 60 min was achieved but the selectivity was only 97%, whereas 100% selectivity with smaller yields of 69% and 9% were obtained for 395 nm and 360 nm filters, respectively. The conversion of ACP was complete after 60 min when no filter was used but the resulting yield and selectivity were only at 61%. With increasing threshold wavelength the available lamp spectrum is limited and leads to lower yields which were also reported in other publications.24 In the HPLC chromatograms of the experiments with the 300 nm filter and no filter, an additional signal (Fig. S1†) was visible which originates from a side-product but remains unknown since its concentration in the reaction solution was too low for purification and to conduct a structural analysis by NMR spectroscopy. For a cut-off filter of 300 nm or higher, the yield was almost quantitative. To ensure optimal selectivity while retaining a high activity, all further experiments were conducted with the 360 nm filter.
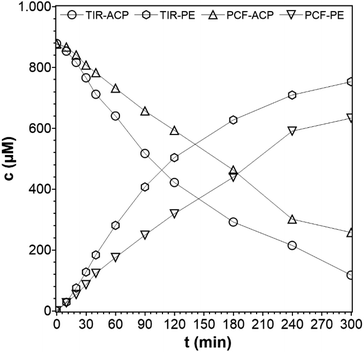
The type of reactor with its geometry and particular irradiation concept can strongly influence the photocatalytic activity of any photocatalytic reaction.25,26 Here, a SIR and a TIR were used, which are shown in Fig. S2 and S3 in the ESI.† The different geometries result in two different concentration–time profiles (Fig. 4), hereafter referred to only as concentration profiles, although the same liquid phase volume, lamp source, catalyst, reaction temperature, catalyst concentrations, and ACP concentrations were used. The reaction performed in the SIR is much faster than in the TIR, and the rate constants are k = 16.2 × 10⁻³ min−1 for SIR and k = 6.2 × 10⁻³ min−1 for TIR, respectively, which is a difference of 61%. The difference is attributed to the variation of the optical path length, the interfacial differences and the phase media in the reactor configurations. In the SIR, the light passes through a distance of 10 cm before reaching the quartz glass window, which is in direct contact with the liquid phase. In the TIR, the light has to cover a shorter distance (1.5 cm) in the air before it reaches the quartz glass window (Ø 4 cm), but then has to pass the saturated vapor phase (10 cm) before reaching the surface of the liquid phase. In the vapor phase, adsorption and scattering can take place, which is also an important cause for the lowered intensity. As the light intensity depends on the distance between light source and sample, the intensity in TIR is lower although the same lamp was used. This comparison of photocatalytic reactors was necessary because the experiments with the PCF can only be performed in the TIR. This means that the suspended catalyst experiments also have to be done in the TIR, in order to enable a direct comparison. However, because of the faster reaction in the SIR, the kinetic studies were done using this reactor.
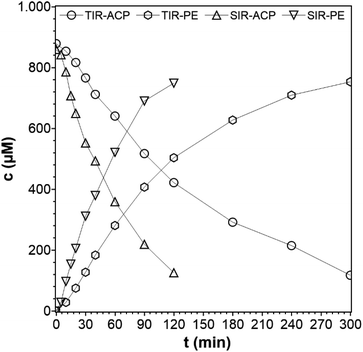 | ||
| Fig. 4 Concentration profiles of ACP and PE using different photoreactors (reaction conditions: purge gas = Ar, T = 19 °C, λ ≥ 360 nm, VL = 20 mL, cACP,0 = 860 μM, catalyst = TiO2 (PC500)). | ||
3.2. TiO2 screening for photocatalytic ACP hydrogenation
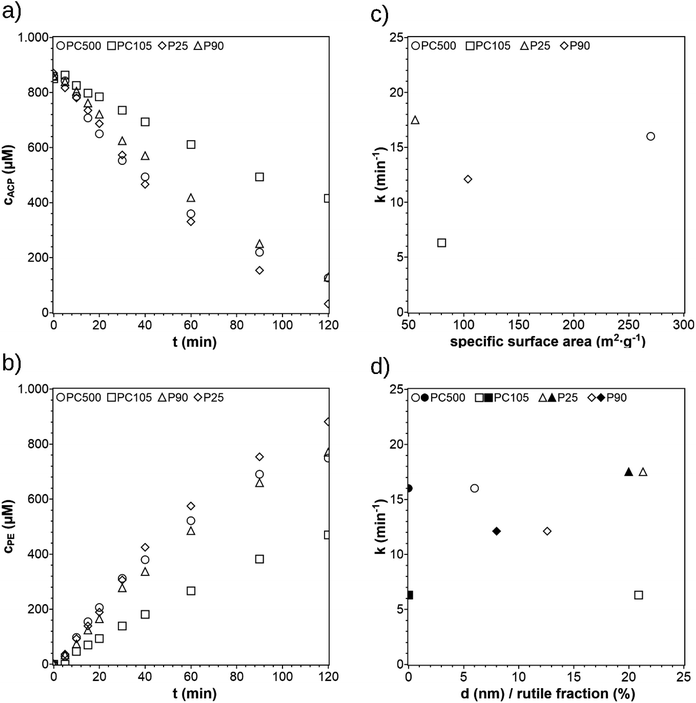
In previous publications on photocatalytic hydrogenation of ACP, the most common commercial available TiO2 modification P25 was used. TiO2 is an often investigated photocatalyst and is commercially available in different modifications. Four TiO2 modifications (P25, P90, PC500, and PC105) were selected and the reaction performance was investigated. The concentration profiles are shown in Fig. 5a and b and are listed together with the crystal phase ratios, crystallite sizes, and specific surface areas in Table 1. When using PC105, the reaction rate constant is significantly lower than for P25, P90, and PC500. The reaction rate constant for P25 is slightly higher than P90. The reaction rate constant for PC500 is similar to P25. To find how the activity depends on the characteristics of the photocatalyst, the reaction rate constant was plotted against the crystallite size, rutile ratio, and the BET surface in Fig. 5c and d. The rate constant increases with decreasing particle size and increasing BET surface, except the rate constant of P25. A greater surface area means more trapping sites on the surface leading to a higher number of active sites. The plot of the rate constant against the rutile fraction should be not misinterpreted as an increase of the rate constant in terms of the quantity of the rutile fraction. Mixtures of rutile and anatase phases show higher activities for photocatalytic reactions than single phase modifications. Pure anatase has a higher adsorptive affinity to organic compounds and higher rate of hole trapping and therefore lower recombination rates than pure rutile.25,27,28 Both attributes lead to a higher surface activity and then to a higher photocatalytic activity. The smaller band gap of rutile extends the adsorptive spectrum range to visible range, facilitating the excitation of electrons. By interfacing these phases, the exited electrons of the rutile phase can be trapped more effectively in the anatase phase leading to a lower recombination rate.27 The decisive factor for this synergy is the appropriate anatase–rutile ratio. Though P25 has the largest crystallite size and the lowest surface area, it shows the highest rate constant of all photocatalysts because it has the most optimal rutile–anatase ratio. Despite its larger surface area, P90 is less efficient than P25 because of its smaller and therefore less optimal rutile fraction. This leads to lower charge separation interfaces. PC500 has the largest surface area and smallest particles enabling a higher number of trapping sites on the surface and shorter pathways for the charge carriers, which makes the charge recombination less likely. PC105 performs much worse because the particle size is too large to benefit the higher surface reactivity because of the longer pathway to the surface for the charge carriers. The comparison of the reaction rate constants with the crystallite sizes, specific surface areas, and the rutile fraction suggests that a small crystallite size and an optimal rutile fraction as well as a high surface are beneficial for the photocatalytic hydrogenation of ACP. The comparison also shows that the activity of a photocatalyst does not result only from a single property. Moreover, it is a combination of different properties. For example, if a TiO2 photocatalyst has a less optimal rutile ratio it can be compensated with a small crystallite size and a high surface area. Since the reaction rate constants for PC500 and P25 are very similar, PC500 was used for the following experiments. This selection was also based on previous experience, where PC500 showed a very good performance for photocatalytic hydrogen production as suspended photocatalyst29 or as photocatalytic film.153.3. Kinetic studies
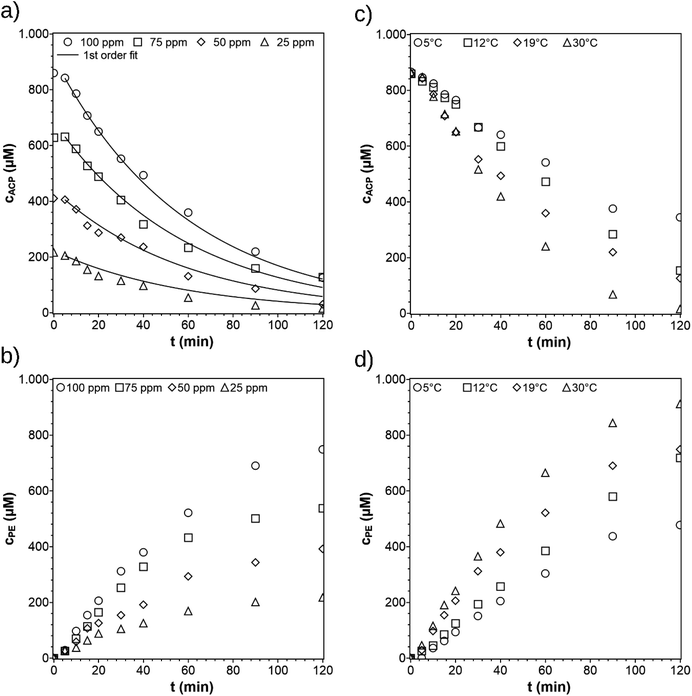
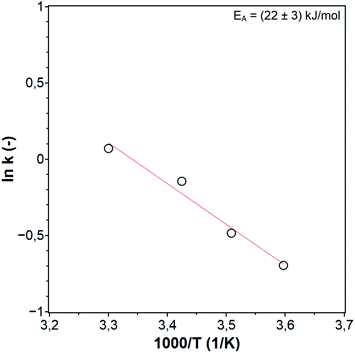
For the variation of the initial ACP concentration, the concentration profiles of ACP were simultaneously fitted according to the pseudo-first-order reaction rate law Fig. 6a with the reaction rate constant k = 17 × 10−3 min−1. The fitting can also be done by using the Langmuir–Hinshelwood equation as well with minor differences in the kinetic parameters (see ESI†). During the first minutes of irradiation (0–5 min) only small amounts of ACP react, due to an induction period. The colour of the catalyst turns from white blue (see Fig. S3b and c†). The blue colour arises from trapped holes and electrons generating active sites.20 Therefore, the fitting was started at t = 5 min. In the publication by Kohtani et al.,20 the concentration profiles were evaluated according to a zero-order reaction rate law due to the relatively high initial ACP concentrations of 1–20 mM, causing saturation of active sites. For ACP concentration below 1 mM, their concentration profiles show a transition from linear to non-linear dependency, indicating first order behavior. Since the concentration used in this work are also below 1 mM (0.2–0.8 mM), the data was fitted using a first order rate law.The reaction rate constants at different temperatures were determined from the ACP concentration profiles Fig. 6c using the first-order reaction rate law applying the software Berkeley Madonna. The value of ln(k) was plotted against 1/T to determine the apparent activation energy (Fig. 7). The apparent activation energy for the photocatalytic hydrogenation of ACP is EA = 22 ± 3 kJ mol−1. The value obtained in this work is lower than the activation energy for the hydrogenation of ACP reported in the literature (Table 2) but within the same range. The difference arises primarily from the hydrogenation type (i.e. classic hydrogenation, transfer hydrogenation, and photocatalytic hydrogenation), and from the used catalyst. The use of Au/CeO2 for both transfer (68 kJ mol−1) and photocatalytic hydrogenation (44 kJ mol−1) shows how the light driven mechanism reduces the activation energy.31 The activation energies for the different types of hydrogenation reactions are in certain ranges. The activation energy range of photocatalytic hydrogenation (26–44 kJ mol−1) is significantly lower compared to the reaction with molecular hydrogen (51–60 kJ mol−1) and transfer hydrogenation (64–87 kJ mol−1). The highest value of the activation energy for each type of hydrogenation reaction (Table 2) was used to draw the energy profile (Fig. 8, adapted from Ravelli et al.32). The energetic zero point was set to the standard enthalpy of formation of ACP. The individual calculations are shown in ESI.† The energy levels result from the used hydrogen donors. The standard enthalpy of formation for ACP is −142.5 kJ mol−1 and for PE is −138.7 kJ mol−1.33,34 The hydrogenation with molecular hydrogen and the transfer hydrogenation with isopropanol are endothermic with reaction enthalpies of 3.8 kJ mol−1 and 71.4 kJ mol−1, respectively. The measured activation energy of the photocatalytic hydrogenation is much lower than the other two types. The lower activation energy can be explained by the activation of the photocatalyst by light irradiation for which the energy level of the reactants is increased. In addition, this leads to a reaction enthalpy of −205.0 kJ mol−1. The irradiation of the photocatalytic system changes the reaction from uphill (endothermic) to downhill (exothermic) and exergonic (see ESI†). Through the provision of the light in appropriate wavelengths the photocatalytic hydrogenation runs even at low temperatures voluntarily as shown Fig. 6c and d to emphasize the advantage of the photocatalytic route operating at mild reaction conditions.
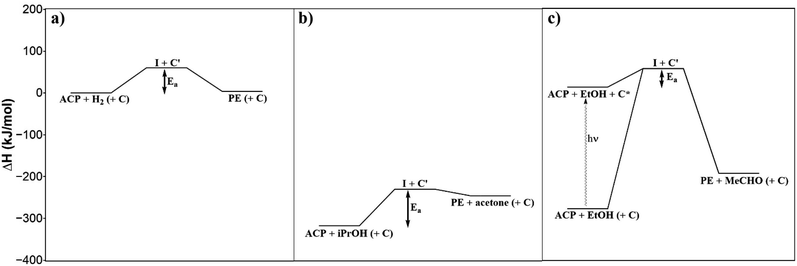 | ||
| Fig. 8 Energy profiles of the classic hydrogenation (a), transfer hydrogenation (b) and photocatalytic hydrogenation (c) of ACP. | ||
3.4. Testing and recycling of a photocatalyst cellulose film
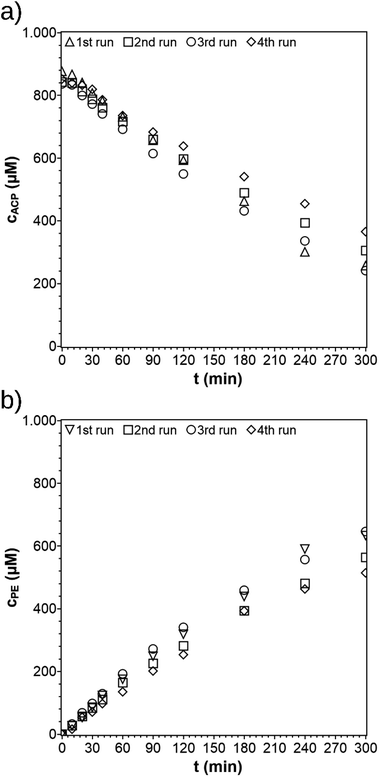
For the photocatalytic hydrogenation of ACP with immobilized TiO2, the PCF was fixed onto a Teflon substrate to prevent the film from floating (see ESI†). The film was active and remained intact during the reaction. In a previous work, the Pt@TiO2 (PC500) was immobilized by the same method and used for photocatalytic hydrogen evolution but exfoliated due to strong hydrogen evolution.15 A measurement of the composition of the gas phase of the hydrogenation of ACP by gas chromatography showed that only a negligible amount of hydrogen was formed. To check if PE as the main reaction product adsorbs onto the film, a cellulose film with a diameter of 2 cm was placed into the PE solution (100 ppm, 10 mL), and the PE concentration before and after showed that no significant adsorption of PE onto the cellulose film occurred. The concentration profiles for the immobilized and suspended TiO2 photocatalysts are shown in Fig. 9. From these data, the rate constant of the TiO2 immobilized on the PCF is found to be k = 3.9 × 10⁻³ min−1 compared to the rate constant of the dispersed TiO2 of k = 6.2 × 10⁻³ min−1, which is an activity loss of 37%. When a catalyst is immobilized, the loss in activity compared to the suspended photocatalyst is inevitable. In dispersed form, every TiO2 particle can take part in the reaction with its entire surface while in the immobilized form only a fraction of the surface of the immobilized particles can take part. Those are the particles on and beneath the surface where the light can reach them. In addition, the light has to pass through the liquid phase (0.5 cm) before reaching the PCF, which lowers the light intensity even more. The degree of the activity loss depends on the amount of immobilized catalyst per area because the thickness of the photocatalyst film grows with increasing photocatalyst amount. Optimal use of an immobilized photocatalyst can only be achieved for a thin photocatalyst film, but not all films provide the necessary stability. Drop coating with Nafion as a binder can lead to stable films, but requires auxiliaries. Schröder et al.39 demonstrated the immobilization of carbon nitride as the photocatalyst for hydrogen evolution. The suspended and immobilized carbon nitride had a similar activity only if the photocatalyst amount was sufficiently slow and the photocatalyst layer had a thickness of only 8–10 μm.39 Here, the focus was to manufacture a self-supporting PCF for a photocatalytic organic synthesis reaction and to study its activity and selectivity rather than optimizing the film thickness for optimum photon usage. The use of cellulose as a cheap and green material allows the synthesis of photocatalyst cellulose films by a simple preparation method.After its first run, the PCF was recycled three times (Fig. 10). The procedure of reuse of the PCF was very simple. The solution was removed and PCF cleaned with EtOH. The PCF was dried overnight between two Teflon discs to prevent the film from shrinking. The dried PCF was then fixed onto the substrate again and the experiment was repeated. The PCF shows no damages after four runs (Fig. S5†) which indicates no leaching of particles and a good overall stability towards the reaction. The rate constant determined from the first recycling run was k = 3.3 × 10⁻³ min−1 and stayed almost constant for the following recycling steps at k = 4.0 × 10⁻³ min−1 and the last recycling steps at k = 2.8 × 10⁻³ min−1. For the whole process, the activity was lowered by only 28% showing the good and stable performance of the film. Another PCF was prepared with the same diameter and irradiated in an ACP-solution (100 ppm) for 4 hours. The PCF mass remained constant, indicating a negligible leaching of TiO2 particles. The PCF is stable under the reaction conditions, but disintegrates when sonicated in ethanol. The latter could be used for the reuse of the catalyst and cellulose material to prepare new PCFs.
3.5. Characterization of the photocatalytic cellulose film
The SEM images (Fig. 11) show the surface and the cross-section of the PCF. The PCF consists of alternating layers of cellulose and photocatalyst, whose wavy shape indicate the flexibility of the film. The TiO2 (PC500) particles are dispersed evenly although some larger agglomerates are visible. The cellulose layers have a porous structure consisting of cellulose fibers agglomerated from cellulose nanoparticles which is favorable for diffusive transport of molecules participating in the photocatalytic hydrogenation of ACP.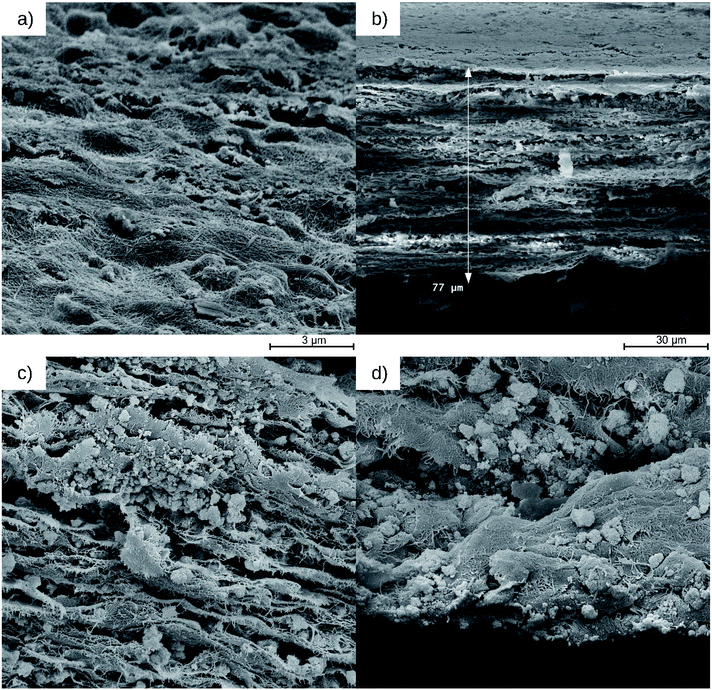 | ||
| Fig. 11 SEM images with top view of the surface (a), cross-section (b), cellulose-TiO2 layers (c) and TiO2 nanoparticles on an inner cellulose layer at the breaking edge (d) of the PCF. | ||
A TEM image of the suspended cellulose taken before the fabrication of the PCF is shown in Fig. S6.† The particles at the surface of the film are more enclosed by the cellulose fibers than the particle at the surfaces of the layers within the film. The particles within the film are embedded and attached tightly onto the layers by the cellulose nanofibrils. The distance between the layers is about 0.5–2 μm and the PCF has a thickness of 77 μm. The thickness of the PCF especially causes the activity loss of the photocatalytic hydrogenation of ACP compared to the suspended catalyst because only a fraction of particles are fully illuminated and can take part in the photocatalytic hydrogenation. Less influential is the agglomeration in general and the enclosure of particles on the surface of the film to the reduction of the activity. With these observations, it can also be concluded that the light has to pass through the uppermost cellulose-TiO2 layers because otherwise, the activity loss should be even greater. The use of cellulose provides a green method to prepare photocatalyst films in addition, the photocatalyst can be easily retained from the film. By treating the PCF with a sulfuric acid solution (98%, Vsulfuric acid/Vwater = 4/1), the cellulose dissolves and the photocatalyst particles can be obtained by subsequent centrifugation (Fig. S7†). The successful immobilization of the TiO2 photocatalyst is also shown in XRD measurements. An XRD spectrum of a PCF with TIO2 is shown in our previous work.15
4. Conclusions
For better separation of the photocatalyst and product after photocatalytic reaction, a photocatalyst cellulose film was manufactured, with TiO2 as the photocatalyst. The film and suspended TiO2 photocatalyst particles were investigated for the photocatalytic hydrogenation of ACP. With respect to conversion and selectivity, the reaction has to be carried out with wavelengths above 360 nm under argon atmosphere. The activity, expressed by the pseudo 1st order reaction rate constant, depends on reactor geometry as well as type (P25, P90, PC 105, PC500) and state (immobilized/dispersed) of TiO2. The best performance was obtained for P25 and PC500 particles because they have similar reaction rate constants, although their characteristics (e.g., composition and surface area) are very different. The activity depends on an interplay of different photocatalyst properties, and PC500 was chosen as photocatalyst for subsequent experiments. Kinetic studies with varying initial concentrations of acetophenone and reaction temperatures were performed. A reaction rate constant of k = 17 × 10−3 min−1 and an apparent activation energy of EA = 22 kJ mol−1 were obtained. Compared to the literature, EA of photocatalytic hydrogenation is lower than the activation energy for transfer and conventional hydrogenation. The light irradiation shift the system to a higher energy level turning the endothermic reaction into an exothermic one, wherefore the photocatalytic hydrogenation can be performed at lower temperatures. As expected, the activity of the PCF was lower than the dispersed photocatalyst. The activity loss is mainly due to the thickness of the PCF, which adsorbs part of the incident light and prevents the uniform illumination of deeper-lying TiO2 particles of the PCF. This means that not all particles can participate in the reaction to the same extent. The PCF can be easily recycled with minor loss in activity, and the PC500 can be easily retained from the PCF by acid treatment. In summary, the study has shown that the photocatalytic hydrogenation of ACP using ethanol combined with a cellulose-based immobilization technique for easy catalyst recycling is a green reaction protocol that should transferrable to other reactions. The film preparation is fast and simple, and larger areas of a photocatalyst film is theoretically possible. Further, photocatalyst immobilization is required for continuously operated photocatalytic reactions.Conflicts of interest
The authors declare no conflicts of interest.Acknowledgements
All authors acknowledge support from the Deutsche Forschungsgemeinschaft (DFG, German Research Foundation) under Germany's Excellence Strategy – EXC 2008/1 (UniSysCat) – 390540038 and from the German Helmholtz Association – Excellence Network – ExNet-0024-Phase2-3. We thank Dr Michael Schroeter for providing the cellulose. We acknowledge support by the German Research Foundation and the Open Access Publication Fund of TU Berlin.Notes and references
- H. C. Erythropel, J. B. Zimmerman, T. M. De Winter, L. Petitjean, F. Melnikov, C. H. Lam, A. W. Lounsbury, K. E. Mellor, N. Z. Janković, Q. Tu, L. N. Pincus, M. M. Falinski, W. Shi, P. Coish, D. L. Plata and P. T. Anastas, Green Chem., 2018, 20, 1929–1961 RSC.
- J. Huang, Y. Jiang, N. Van Vegten, M. Hunger and A. Baiker, J. Catal., 2011, 281, 352–360 CrossRef CAS.
- K. J. A. Raj, M. G. Prakash, R. Mahalakshmy, T. Elangovan and B. Viswanathan, Catal. Sci. Technol., 2012, 2, 1429–1436 RSC.
- M. Guo, H. Li, Y. Ren, X. Ren, Q. Yang and C. Li, ACS Catal., 2018, 8, 6476–6485 CrossRef CAS.
- S. Rösler, J. Obenauf and R. Kempe, J. Am. Chem. Soc., 2015, 137, 7998–8001 CrossRef PubMed.
- V. Gierz, A. Urbanaite, A. Seyboldt and D. Kunz, Organometallics, 2012, 31, 7532–7538 CrossRef CAS.
- T. Subramanian and K. Pitchumani, Catal. Sci. Technol., 2012, 2, 296–300 RSC.
- F. Alonso, P. Riente and M. Yus, Tetrahedron Lett., 2008, 49, 1939–1942 CrossRef CAS.
- R. H. Morris, Dalton Trans., 2018, 47, 10809–10826 RSC.
- S. Kohtani, Y. Kamoi, E. Yoshioka and H. Miyabe, Catal. Sci. Technol., 2014, 4, 1084–1091 RSC.
- S. Gisbertz and B. Pieber, ChemPhotoChem, 2020, 4, 456–475 CrossRef CAS.
- D. Ma, S. Zhai, Y. Wang, A. Liu and C. Chen, Molecules, 2019, 24, 330 CrossRef PubMed.
- H. S. Zakria, M. H. D. Othman, R. Kamaludin, S. H. Sheikh Abdul Kadir, T. A. Kurniawan and A. Jilani, RSC Adv., 2021, 11, 6985–7014 RSC.
- S. Mehla, J. Das, D. Jampaiah, S. Periasamy, A. Nafady and S. K. Bhargava, Catal. Sci. Technol., 2019, 9, 3582–3602 RSC.
- M. Schwarze, T. A. Thiel, M. Tasbihi, M. Schroeter, P. W. Menezes, C. Walter, M. Driess and R. Schomäcker, Energy Technol., 2021, 2100525 Search PubMed.
- R. J. Moon, A. Martini, J. Nairn, J. Simonsen and J. Youngblood, Chem. Soc. Rev., 2011, 40, 3941–3994 RSC.
- M. Jonoobi, R. Oladi, Y. Davoudpour, K. Oksman, A. Dufresne, Y. Hamzeh and R. Davoodi, Cellulose, 2015, 22, 935–969 CrossRef CAS.
- I. Chauhan and P. Mohanty, RSC Adv., 2014, 4, 57885–57890 RSC.
- A. Wittmar, H. Thierfeld, S. Köcher and M. Ulbricht, RSC Adv., 2015, 5, 35866–35873 RSC.
- S. Kohtani, E. Yoshioka, K. Saito, A. Kudo and H. Miyabe, J. Phys. Chem. C, 2012, 116, 17705–17713 CrossRef CAS.
- R. Molinari, C. Lavorato and P. Argurio, Chem. Eng. J., 2015, 274, 307–316 CrossRef CAS.
- J. Zhao, C. Chen and W. Ma, Top. Catal., 2005, 35, 269–278 CrossRef CAS.
- S. Y. Lee and S. J. Park, J. Ind. Eng. Chem., 2013, 19, 1761–1769 CrossRef CAS.
- S. Kohtani, E. Yoshioka, K. Saito, A. Kudo and H. Miyabe, Catal. Commun., 2010, 11, 1049–1053 CrossRef CAS.
- S. Sarkar, R. Das, H. Choi and C. Bhattacharjee, RSC Adv., 2014, 4, 57250–57266 RSC.
- E. Gong, S. Ali, C. B. Hiragond, H. S. Kim, N. S. Powar, D. Kim, H. Kim and S.-I. In, Energy Environ. Sci., 2022 10.1039/d1ee02714j.
- D. C. Hurum, A. G. Agrios, K. A. Gray, T. Rajh and M. C. Thurnauer, J. Phys. Chem. B, 2003, 107, 4545–4549 CrossRef CAS.
- G. Song, C. Luo, Q. Fu and C. Pan, RSC Adv., 2016, 6, 84035–84041 RSC.
- M. Schwarze, C. Klingbeil, H. U. Do, E. M. Kutorglo, R. Y. Parapat and M. Tasbihi, Catalysts, 2021, 11, 1027 CrossRef CAS.
- W. R. Siah, H. O. Lintang, M. Shamsuddin and L. Yuliati, IOP Conf. Ser.: Mater. Sci. Eng., 2016, 107, 012005 CrossRef.
- X. Ke, X. Zhang, J. Zhao, S. Sarina, J. Barry and H. Zhu, Green Chem., 2013, 15, 236–244 RSC.
- D. Ravelli, D. Dondi, M. Fagnoni and A. Albini, Chem. Soc. Rev., 2009, 38, 1999–2011 RSC.
- http://www.ethermo.us/mars663.htm.
- https://www.chemeo.com/cid/52-449-6/Acetophenone.
- R. Van Putten, G. A. Filonenko, A. Gonzalez De Castro, C. Liu, M. Weber, C. Müller, L. Lefort and E. Pidko, Organometallics, 2019, 38, 3187–3196 CrossRef CAS PubMed.
- L. O. Nindakova and N. M. Badyrova, Mol. Catal., 2020, 486, 110880 CrossRef CAS.
- Z. Lv, J. Wang, S. Zhang, B. Wang, Z. Guo and C. Zhang, Appl. Organomet. Chem., 2020, 34, 1–12 Search PubMed.
- M. Guo, S. Jayakumar, X. Kong, C. Li, H. Li, J. Chen, M.-F. Luo and Q. Yang, Res. Square, 2022 DOI:10.21203/rs.3.rs-871287/v1.
- M. Schröder, K. Kailasam, J. Borgmeyer, M. Neumann, A. Thomas, R. Schomäcker and M. Schwarze, Energy Technol., 2015, 3, 1014–1017 CrossRef.
Footnote |
| † Electronic supplementary information (ESI) available. See DOI: 10.1039/d1ra09294d |
| This journal is © The Royal Society of Chemistry 2022 |

![[thin space (1/6-em)]](https://www.rsc.org/images/entities/char_2009.gif) :
: