
 Open Access Article
 This Open Access Article is licensed under a Creative Commons Attribution-Non Commercial 3.0 Unported Licence
Quantification of phenol-formaldehyde curing resin in unvulcanized rubber blend using Py-GC/MS supplemented by TG-IR analysis
Silvia Ďurišová *a,
Darina Ondrušováa,
Mariana Pajtášováa,
Roman Brescherb and
Jana Šulcováa
*a,
Darina Ondrušováa,
Mariana Pajtášováa,
Roman Brescherb and
Jana Šulcováa
aDepartment of Material Technologies and Environment, Faculty of Industrial Technologies in Púchov, Alexander Dubček University of Trenčín, I. krasku, 020 01 Púchov, Slovakia. E-mail: silvia.durisova@tnuni.sk
bContinental Matador Rubber, s.r.o., Terézie Vansovej 1054/1, 0201 Púchov, Slovakia
First published on 17th February 2022
Abstract
The curing bladder is the main element when producing a car tire. The tire curing bladder is a cylindrical bag concaved with a heat transfer medium, hot water, steam or gas during the vulcanization process. It is highly stressed due to the extremely high temperatures and pressures inside the pressing mold and it ensures the optimal process of vulcanization. Therefore, it is necessary to verify the quality of the tire curing bladder made of a suitable elastomer (rubber) blend. Analysis of rubber is an important technological operation in research and development in the automotive industry. The purpose of rubber blend analysis may be to confirm that the manufacturer or supplier owns or supplies a material according to the composition pattern, to clarify the cause of difficulties and failures during processing or to verify that the individual components of the rubber blend are correctly batched during technological operation “mixing”. Five analytical methods were used to determine the quality, presence and quantity of applied curing resin, specifically a combination of pyrolysis, gas chromatography and mass spectrometry and a combination of infrared spectroscopy and thermogravimetry. The concentration and percentage of the curing resin were determined from individual measurements and by comparing with reference samples (standards) from an industrial factory.
Introduction
Phenol-formaldehyde resins are usually opaque materials ranging from a yellow, light amber brown color to dark brown or black, with dark color limiting their application in the market. Phenol-formaldehyde (PF) resin was developed by Bayer using an acid catalysed reaction. The first synthesized phenol-formaldehyde resin was prepared by Leo Baekeland in 1909. The reaction proceeded via the polycondensation of phenol with formaldehyde. Baekeland created PF resin as a material that was much more durable than cellulose, odorless and fire-resistant. The first PF resin factory was established in Berlin in 1910.1–6Phenol-formaldehyde curing resin is a condensation product of para-alkyl phenol with formaldehyde under controlled conditions. The alkyl group is usually octyl, forming the octyl-phenol-formaldehyde resin used particularly as a curing agent for EPDM rubber or butyl rubber or in combination with SnCl2 for dynamical vulcanization of thermoplastic vulcanizates.7 They are stable under atmospheric conditions and resistant to creep and deformation under certain stresses. Curing resins possess many important properties for the rubber industry, such as excellent resistance to high temperature, chemical resistance and good processing properties, as well as not absorbing water and not conducting electricity. The amount of curing resin used in the rubber blend depends on the desired properties and the type of used halogen donor. In most cases, the dose is in the range of 7–10 phr.1
During the vulcanization process, the temperature of the curing bladder can go up to 200 °C. Considering this, the curing bladder needs to be prepared using a homogenous, well-mixed blend that is resistant to thermal aging and degradation by hot water, inert gas or pressure and impermeable to gas, inert gas or steam.8–11 The process of curing uses the following parts: a pressing mold with a bottom-placed curing bladder, which is enclosed while incoming air is blowing up the curing bladder. While closing the mold, the pressure in the curing bladder is increased so the unvulcanized coat fills the mold cavity. Then, it is filled with the recirculating heat transfer medium, hot water, steam or gas according to a curing cycle environment divided into steam-hot water under high-pressure conditions, steam-inert gas conditions and steam–steam conditions.
The most used synthetic rubber to form curing bladder blend is butyl rubber, which excels at high temperature, chemical and aging resistance and is easily vulcanised by phenol-formaldehyde resin. The main characteristic of butyl rubber is its low gas permeability. It is often modified by using chloroprene rubber, neoprene, to obtain better elastic and dynamic properties.12–18 The composition of the tire curing bladder is given in Table 1.
| Component | Amount (phr) |
|---|---|
| Butyl rubber | 95 |
| Chloroprene rubber | 5 |
| ZnO | 5 |
| Stearic acid | 1 |
| Carbon black | 45–55 |
| Castor oil | 3–8 |
| Curing resin | 6–9 |
In general, many studies have been undertaken for the identification of polymer blend additives and main ingredients to determine the resulting or even enhanced properties. Therefore, the quantitative or also semi-quantitative determination of individual parts in rubber blend, especially, organic curing agents are not so often undertaken elsewhere but only happens in industrial rubber laboratories using a few techniques.
The aim of this work was to determine the presence and amount of batched phenol-formaldehyde curing resin in raw rubber blend for tire curing bladders using available analytical methods, namely: pyrolysis-gas chromatography and mass spectrometry and thermogravimetry with the detection of pyrolysis products by infrared spectroscopy.
The background problem was the stickiness of the phenol-formaldehyde curing resin. Curing resins used in tire curing bladder blends are too sticky so they may have got stuck in the screw during batching therefore the blend could have been obtained with less curing agent or on the other side too much of the curing agent, in the case, it was stuck together inside the screw at the end of the mixing stage. Both of these options signified inappropriately mixed blend, its properties, stability and curing.
Quantification of the curing resin was performed using the Py-GC/MS technique supplemented by thermal and infrared (TG-IR) analysis with the detection of pyrolysis products.
The methodology of analytical Py-GC/MS is known for ages but it was not so often used in laboratories due to the difficulty of gas chromatography and mass spectrometry spectra interpretation. The principle of the Py-GC/MS method is defined by characterizing a high molecular material in an inert atmosphere and it is aimed at the structural analysis and determination of pyrolysis products with its mass spectrum detection. The chemical process of pyrolysis reaction runs by thermal degradation under controlled conditions to break molecular bonds and form volatile compounds.19,20,23
Experimental
Analytical methods used
The instrument GCMS-Q5000 SHIMADZU used for qualitative and quantitative analysis consists of a gas chromatograph GC17A equipped with a mass spectrometer. The temperature of the injector was set at 300 °C. The apparatus of the equipment gas chromatograph was set at an initial column temperature of 45 °C for 5 minutes. A maximum temperature of 280 °C was reached in 30 minutes. This temperature was constant until the end of the measurement. As the temperature of the column was increasing, the column pressure was increasing too approximately at ∼30 kPa at a constant column flow rate 1.0 ml min−1. The DB-5MS nonpolar column was 60 m long and 0.32 mm in diameter. The analysis took 74 minutes. Mass spectrometry instrument was operating at a high vacuum atmosphere with a turbomolecular oil pump. Analysis lasted 74 minutes at scan intervals of 0.50 seconds. The detector voltage was 1.30 kV. Py-GC/MS quantification methods involved the standard addition method, a calibration curve method, mathematical operations and comparing the chromatography peak areas with standard samples.The infrared spectrometer Bruker Tensor 27 was used to identify phenol-formaldehyde resin in a rubber blend. The spectrometer was operating at a spectral range of 7500 cm−1 to 370 cm−1 KBr beam splitter. The optical resolution of the device was 1 cm−1, an apodized resolution was 1 cm−1. Thermal analysis was performed on the instrument Thermo Microbalance TG 209 F1 Iris NETZSCH. The microbalance works were performed based on the principle of electromagnetic power compensation and the balance was enclosed with vacuum-tight housing.
| ci = (cstAi)/Ast | (1) |
The concentration of the analyte can be calculated using formula (2) where cst is the concertation of the standard substance, ρst is the density of the standard substance, Vst is the volume of the pipetted standard into the solution and V is the volume of standard and solvent used.21
| cst = (ρstVst)/V | (2) |
Using the standard addition method, it is possible to calculate the mass of analyte mi by dividing the converted chromatograph peak areas of the analyte Ai and chromatograph peak area of the standard Ast and multiply by the weight of the standard mst according to the relation (3).
| mi = mstAi/Ast | (3) |
After the determination of the mass of the analyte, it is possible to determine the percentage of the curing resin by the proportion of the weight of the analyte mi with the total weight of the sample and multiply by 100 according to relation (4).22
| % w = (mi/m)100 | (4) |
Material
Three types of raw rubber blends were analyzed according to the composition (Table 1). The mixture comprised 95 phr of butyl rubber, 5 phr of CR chloroprene rubber, 5 phr of zinc oxide, 1 phr of stearic acid, then 45–55 phr of carbon black, 3–8 phr of castor oil and 6–9 phr of resin.To determine the curing resin amount in samples A, B and C, two standards D and E with a known amount of curing resin. Were used (Fig. 1).
 | ||
| Fig. 1 Analysed samples (A, B, C) and standards (D and E) containing curing resin I and II. | ||
A small amount of each sample was cut and weighted on analytical balances. A gas burner was used as an alternative pyrolysis apparatus, then the muffle oven. Oxygen was removed by a stream of nitrogen from the sample vial. The vial was grabbed using tweezers and circled in the flame space with the highest temperature. The pyrolyzed sample was cooled with liquid nitrogen, then a certain small amount of low volatile solvent was added.
The second alternative of pyrolysis apparatus was the muffle oven. The sample in a quartz glass tube was placed in a muffle oven heated to 500 °C and 600 °C. A small amount of solvent was added to the sample vial after pyrolysis. Prepared samples were manually dosed using a Hamilton microsyringe.
Results
Qualitative analysis
Pyrolysis products of PF resin are given in Table 2. Two types of mass spectra pyrolysis products were identified in each sample (Fig. 2 and 3). Pyrolysis products eluted at the 44th min. The value of retention time was depended on the synchronization of the GC/MS instrument launch and batching rate by the microsyringe (repeatability).| Sample | Retention time (min) | Pyrolysis product |
|---|---|---|
| A | 44.11 | p-tert-Octylphenol |
| 44.35 | 2-Methyl-p-tert-octylphenol | |
| B | 44.11 | p-tert-Octylphenol |
| 44.37 | 2-Methyl-p-tert-octylphenol | |
| C | 44.12 | p-tert-Octylphenol |
| 44.36 | 2-Methyl-p-tert-octylphenol |
 | ||
| Fig. 2 Mass spectrum of para-tert-octylphenol. | ||
 | ||
| Fig. 3 Mass spectrum of 2-methyl-para-tert-octylphenol. | ||
The base peak of p-tert-octylphenol in mass spectra was 135 m/z in samples A, B, C. Higher intensity peaks were observed at 107 m/z and 41 m/z in each sample. The general formula of the substance was identified using the GC/MS instrument was C14H22O. The molecular weight was 206.32 g mol−1 and the CAS code was 140-66-9. The base peak of 2-methyl-p-tert-octylphenol was 149 m/z in samples A, B, C. Higher intensity peaks were 121 m/z and 41 m/z. The general formula was C15H24O. The molecular weight of the identified substance was 220.35 g mol−1 and the CAS code was 2219-84-3.
Analyte identification
Pyrolysis products of sample A, phenol-formaldehyde curing resin and standard both eluted in 44th min. The intensity of the mass peak 91 m/z was higher in the mass spectrum of the standard. The base peak was 135 m/z in the case of both samples. Determining the base peak and base peak of the standard were both 149 m/z. The intensity of the mass peak 57 m/z was higher in the standard spectrum. Moreover, peak 135 m/z was observed in the standard spectrum. Pyrolysis products of sample B curing resin eluted in 44th min at both samples. The base beak of p-tert-octylphenol was 135 m/z in both cases, mass spectrum base peak of 2-methyl-p-tert-octylphenol was 149 m/z. Both PF pyrolysis products of standard and sample C eluted in 44th min. Mass spectra base peak of p-tert-octylphenol was 135 m/z and of 2-methyl-p-tert-octylphenol was 149 m/z.Determination of mass and concentration
Quantitative measurements were repeated multiple times to achieve reliable results. Individual measurements proved that the chromatograph peak area size is increasing with determined mass and the concentration of the analyte. The mass of curing resin-analyte is given in Fig. 4, the concentration of curing resin-analyte is given in Fig. 5. | ||
| Fig. 4 Dependence of analyte weight on chromatograph peak area. | ||
 | ||
| Fig. 5 Dependence of concentration on chromatograph peak area. | ||
The lowest weight established for the analyte of sample A was 0.474 mg, corresponding to the chromatograph peak area of 0.30. The weight of the sample B analyte was 0.765 mg and it is corresponding chromatograph peak area was 0.38 and weight of the analyte of sample C was determined as 0.655 mg and its chromatograph peak area was 0.36.
The lowest concentration of 0.0095 mg ml−1 was determined for sample A analyte, corresponding to the chromatograph peak area of 0.30, following the concentration sample C was 0.0142 mg ml−1 and the chromatography peak area was 0.36 and the highest concentration was established for analyte from sample B at 0.0152 mg ml−1 corresponding to the chromatograph peak area of 0.38.
From the performed measurements, repeated several times resulting, the highest match was observed in sample A (Fig. 6) in the cases of numbers 3 and 4 with the standard sample. In sample number 5, a slightly higher value of analyte weight corresponding to the standard was observed. Sample numbers 1 and 2 achieved the highest contrast to the standard.
 | ||
| Fig. 6 Weight comparison of phenol-formaldehyde resin analyte A. | ||
The mass of PF resin analyte was 0.45 mg for sample number 1, 0.44 mg for sample number 2, 0.49 mg for sample number 3, 0.49 mg for sample number 4 and 0.50 mg for sample number 5. According to the formula (4) described above, the highest match of the percentage was achieved in cases of samples number 3, 4 and 5 prepared from the original sample A.
Five samples were prepared from original sample B. In Fig. 7, the difference between the established weight of the curing resin analyte of sample B and available standards D and E is visible. The resulting weight of the analyte of sample B was higher than the known weight of the curing resin from standards D and E. Average mass of curing resin was 0.77 mg for the original sample B, analyte mass of samples, number 1 was 0.77 mg, number 2 was 0.73 mg, number 3 was 0.72 mg, number 4 was 0.85 mg and number 5 was 0.77 mg.
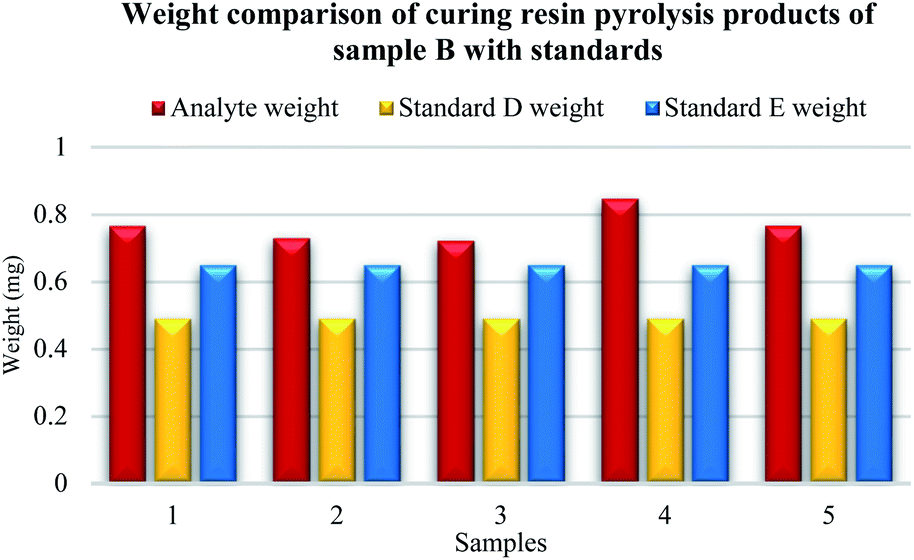 | ||
| Fig. 7 Weight comparison of phenol-formaldehyde resin analyte B. | ||
Five samples were prepared from the original sample C. The highest weight match of the curing resin analyte was observed in sample number 2 according to standard E (Fig. 8). A sight difference was observed for sample number 5, then number 4, number 3 and the highest difference was spotted for sample number 1.
 | ||
| Fig. 8 Weight comparison of phenol-formaldehyde resin analyte C. | ||
The established mass of the analyte was following 0.75 mg for sample number 1, 0.64 mg for sample number 2, 0.73 mg for sample number 3, 0.56 mg for sample number 4 and 0.59 for sample number 5.
The highest match of the measurement given in the resulting percentage was reached in the cases of samples number 1, 2, 3 and 5 according to the known amount of curing resin obtained in the standard E.
The described percentage result measurement deviation could be caused due to the incorrect manual dosing of pyrolyzed sample to the GC/MS device by micro-syringe device.
Analyte weight is related to the weight of the primarily cut sample, therefore it is needed to apply the mathematical recalculation between the initial weight of the sample and the resulting weight of the resin. Therefore, it is important to operate with the percentage results at the end of the analysis according to formula (4) above.
Thermogravimetric results interpretation
The weight of all samples changed in three main steps due to the rising temperature, see Table 3.| Sample | Weight loss (%) | Recorded temperature of the aromatic identification (°C) at 2nd step of TG | ||
|---|---|---|---|---|
| 1st step of TG | 2nd step of TG | 3rd step of TG | ||
| A | 11.03 | 53.53 | 30.43 | 421.8 |
| B | 13.17 | 50.00 | 33.10 | 426.4 |
| C | 10.60 | 50.62 | 32.45 | 426.5 |
| D | 6.75 | 56.09 | 33.63 | 425.3 |
| E | 8.40 | 52.80 | 38.53 | 425.3 |
Low volatile plasticizers and unstable polymers with a greater degree of unsaturation evaporated corresponding to the first weight loss at the recorded temperature of about 330 °C for sample A with a loss of 11.03% weight, for sample B it was at the temperature of 339.3 °C and weight loss of 13.17%, for sample C it was the temperature of 339.2 °C and weight loss of 10.60%, for sample D it was 347.2 °C and weight loss of 6.75%, for sample E it was 338.1 °C and 8.40% weight loss.
More stable polymers and aromatic compounds with a higher degree of saturation pyrolyzed in the second step of analysis at the recorded temperature of 421.8 °C for sample A and the observed weight loss was 53.53%, for sample B at the temperature of 426.4 °C and weight loss of 50.00%, for sample C at the temperature of 426.5 °C and weight loss of 50.62%. For standard D, it was the temperature of 425.3 °C and loss of 56.09% weight and for standard E it was the temperature of 425.3 °C and weight loss of 52.80%.
Carbon black was burned and oxidized in the third step due to the change in the atmosphere from inert to oxygen when pyrolysis carbon black was formed from aromatic compounds. This step was recorded at 597.2 °C and weight loss was 30.43% for sample A, for sample B it was the temperature of 597.8 °C and 33.10% of the weight loss, for sample C it was the temperature of 607.1 °C and the weight loss of 32.45%, for sample D at a temperature of about 592.0 °C and the weight loss was 33.63%, for sample E it was the temperature of 598.1 °C and the weight loss was 38.53%.
To complete the experiment, TG analysis of raw phenol-formaldehyde curing resin types I and II was performed. Samples were decomposed within three steps. The first step was the destruction of phenol, low molecular weight materials, ether bridges and carbonyl groups breaking down, followed by the loss of monomers, methylol and water. This was performed at the temperature of 195.3 °C for the raw resin sample I and at the temperature of 222.9 °C for the raw resin sample II. The second phase involved degradation of the polymer and aromatics nuclei. The second weight loss occurred during pyrolysis of organic matrix e.g., aromatic products, stable polymers and other components at the recorded temperature of 462.2 °C for the raw resin sample I and at the temperature of 453.1 for the raw resin sample II. The third weight loss occurred due to the oxidative pyrolysis of carbon black formed from aromatic components at the temperature of 604.9 °C for raw resin sample I and at the temperature of 596.6 °C for the raw resin sample II.
Determination of pyrolysis products by infrared spectroscopy
The infrared spectrum of pyrolysis products of samples A, B, C was recorded within the second mass change of TG analysis. The infrared spectrum of samples A (Fig. 9), was recorded at the beginning of the second weight loss. Spectra reported the same vibrations of functional groups. The vibrations of functional groups of aromatics are listed in Table 4. In each analyzed spectrum were present valence vibrations of aromatic hydrocarbons ν(Aryl-H) at the wavelength of 3095 cm−1 and 3085 cm−1 for samples A, B and C, the deformation vibrations of isolated –CH bond related to the tri-, tetra-, or penta-substituted aromatic hydrocarbon at the wavelength of 888 cm−1 for samples A, B and C, low-intensity planar vibration ν(CO) at the wavelength of 1224 cm−1 for sample A and 1223 cm−1 for samples B and C, the square type vibrations of aromatics at the wavelength of 1565 cm−1 for all samples, asymmetric valence vibration νas(CH3) at the wavelength of 2965 cm−1 for sample A and 2963 cm−1 for samples B and C and symmetric valence vibrations νs(CH3) at the wavelength of 2945 cm−1 for all samples. | ||
| Fig. 9 Infrared spectral comparison between sample A and the standard. | ||
| Sample | Wavelength (cm−1) | ||||
|---|---|---|---|---|---|
| ν(Aryl-H) | νas(CH3) | ν(Ar) | ν(CO) | δ(CH) | |
| A | 3095 | 2965 | 1565 | 1224 | 888 |
| 3085 | |||||
| B | 3095 | 2963 | 1565 | 1223 | 888 |
| 3085 | |||||
| C | 3095 | 2963 | 1565 | 1223 | 888 |
| 3085 | |||||
Vibrations of aromatic heterocyclic backbone compound at 1391 cm−1 and valence vibration ν(CH![[double bond, length as m-dash]](https://www.rsc.org/images/entities/char_e001.gif) O) were also present in spectra. Infrared spectra of pyrolysis products of raw phenol-formaldehyde resins were registered at the second weight loss of TG analysis where decomposition of the aromatic nucleus was seen. The vibrations of functional groups are listed in Table 5.
O) were also present in spectra. Infrared spectra of pyrolysis products of raw phenol-formaldehyde resins were registered at the second weight loss of TG analysis where decomposition of the aromatic nucleus was seen. The vibrations of functional groups are listed in Table 5.
| Sample | Wavelength (cm−1) | ||||
|---|---|---|---|---|---|
| ν(Aryl-H) | ν(CH) | δ(CH2) | ν(CO) | δ(CH) | |
| I | 3086 | 3016 | 1488 | 1248 | 888 |
| II | 3086 | 3016 | 1473 | 1247 | 888 |
The unfavorable effect of the absorption peaks of the pyrolysis products of phenolic resin samples I and II occurred in the area of 3400–4000 cm−1 according to the water signals, as seen from the presence of the OH group overlapping the methylol and phenol OH groups.
In the infrared spectra were present absorption peaks of deformation vibrations δ(CH) of benzene nucleus (1100 cm−1), absorption peaks of valence vibrations ν(C–O) of methylol (1010 cm−1), then the planar type of valence vibrations ν(CO) at the wavelength of 1248 cm−1 for raw resin sample I and at the wavelength of 1247 cm−1 for the raw resin sample II, deformation vibration δ(CH2) of methylol at the wavelength of 1488 cm−1 for raw resin sample I and at the wavelength of 1473 cm−1 for raw resin sample II, valence vibration ν(CH) at the wavelength of 3016 cm−1, ν(Aryl-H) at the wavelength of 3086 cm−1 and deformation vibrations of isolated –CH bond related to the tri-, tetra-, or penta-substituted aromatic hydrocarbon at the wavelength of 888 cm−1 are present in the spectra.
Conclusions
The focus of the presented study was aimed at the research of a sustainable method for the quantitative determination of octylphenol-formaldehyde curing resin in tire curing bladder raw blend based on butyl rubber.The analysis was performed on three samples A, B, C of raw blend after all components were mixed. The analysis involved the use of gas chromatography-mass spectrometry and thermogravimetry with detection of pyrolysis products by infrared spectroscopy and quantitative determination by gas chromatography-mass spectrometry. The samples were prepared by the pyrolysis process.
The principle of qualitative analysis by gas chromatography with mass spectrometry was to measure the spectra of pyrolysis products of curing resin and by comparison to the spectra library and available standards. Qualitative analysis was carried out with the knowledge of a phenolic resin as the only component in the blend with the content of aromatic character. Samples A, B, C were pyrolyzed in two ways: using a gas burner and muffle oven multiple times to obtain repeatability in the subsequent quantitative experiments. Two pyrolysis products of phenolic resin were present namely: p-tert-octylphenol and 2-methyl-p-tert-octylphenol.
The presence of aromatic character in the phenol-formaldehyde resin was confirmed by analyzing the infrared spectra obtained from the thermogravimetric analysis. The presence of aromatic character for sample A was proved from the identification of the valence vibrations ν(Aryl-H) wavelength of 3085 cm−1 and 3095 cm−1, the square type of vibrations of aromatics at a wavelength of 1565 cm−1, deformation vibration of the δ(CH) substituted aromatic compound was identified at the wavelength of 888 cm−1. Planar valence vibrations ν(CO) of phenol were identified at the wavelength of 1224 cm−1. Absorption peaks of aromatic functional groups reached a maximum at the second weight loss at the recorded temperature of 421.8 °C. Aromatic character of sample B was identified by a valence vibrations ν(Aryl-H) at the wavelength of 3085 cm−1 and 3095 cm−1, the square type of vibrations of aromatics at a wavelength of 1565 cm−1, next deformation vibration of the δ(CH) substituted aromatic compound was identified at a wavelength of 888 cm−1. Planar valence vibrations ν(CO) of phenol were identified at the wavelength of 1223 cm−1. Absorption peaks of aromatic character functional groups reached a maximum at the second weight loss. This point was characterized by a temperature of 426.4 °C. The presence of aromatic skeleton of sample C was proved by an identification of valence vibrations ν(Aryl-H) at the wavelength of 3085 cm−1 and 3095 cm−1, the square type of vibrations of aromatics at wavelength 1565 cm−1 and 1537 cm−1, deformation vibrations of the δ(CH) substituted aromatic compound were identified at a wavelength of 888 cm−1. The planar valence vibrations ν(CO) were seen at a wavelength of 1223 cm−1. Absorption peaks of aromatic character reached the maximum at the second weight loss at the recorded temperature of 426.5 °C.
The mass and concentration of octyl-phenol-formaldehyde resin pyrolysis products were determined by the size of chromatograph peak area converted to some initial parameters of taken samples from original A, B and C samples. The experiment was performed following a standard addition method using a low volatile solvent with a chemical structure similar to that of phenol as a standard substance and using a calibration method by creating calibration curves of chromatograph peak area dependence on increasing mass and concentration of the analyte.
The mass of phenol-formaldehyde curing resin pyrolysis products obtained in sample A was 0.47 ± 0.0121 mg and concentration was 9.47 × 10⁻³ ± 0.0017 mg ml−1. The mass of phenolic resin pyrolysis products in sample B was determined to be 0.77 ± 0.0229 mg and the concentration was 1.52 × 10⁻² mg ml−1. The mass of phenol-formaldehyde resin pyrolysis products in sample C was 0.66 ± 0.0336 mg and the concentration was 1.42 × 10⁻² ± 0.0007 mg ml−1.
After all the measurements were performed, the percentage of used octylphenol-formaldehyde resin in given samples was calculated and compared to the original blend recipes, with the percentage amount of batched phenolic curing resin from the industrial company.
To sum up, the qualitative analysis of curing resin in curing bladders blend can be carried out by a combined analytical method pyrolysis-gas chromatography with mass spectrometry and thermogravimetry with the detection device of infrared spectroscopy. The most appropriate method for the quantitative determination of octylphenol-formaldehyde curing resin in the raw blend is a combined method of pyrolysis gas chromatography with mass spectrometry equipped with automatic batching of prepared samples to the chromatographic column. The main advantage of this method is its application on various materials for the purpose of separation and identification only with a small, minor amount or concentration of the sample. Other advantages of this method include a guarantee of batching samples volume and repeatability of the experiment, so the loss of prepared samples is eliminated, the ability to achieve accurate quantitative results within a relatively short time.
Author contributions
Conceptualization, S. Ď., D. O. and M. P.; methodology R. B.; software, S. Ď., D. O., M. P., R. B. and J. Š.; validation, R. B.; investigation, S. Ď. and R. B.; resources, M. P., D. O., S. Ď. and J. Š.; data curation, M. P., J. Š., D. O.; writing – original draft preparation S. Ď.; writing – review and editing M. P., D. O. and R. B.; visualization, S. Ď.; supervision R. B., D. O.; R. B.; project administration D. O.; funding acquisition; all authors have read and agreed to the final version of the manuscript submitted for publication.Conflicts of interest
There are no conflicts to declare.Acknowledgements
This work was supported by industrial company Continental Matador Rubber s.r.o. 1054/1, Terézie Vansovej, 020 01 Púchov, Slovakia: Department of Material Processing, Development and Industrialization, Curing and Curing Bladders and Laboratory of Analytical Chemistry CMR. Author would like to thank to the KEGA 003 TnUAD-4/2019, and to the project of advancement and support of R&D for center of diagnosis and quality testing of materials in the domains of the RIS3 SK specialization, code NFP313010W442 for support.Notes and references
- S. H. Goodman, Handbook of thermoset plastics, Noyes Publications, Westwood, 2nd edn, 1998, ISBN: 9780815517771 Search PubMed.
- P. A. Caron, A. E. Larreteguy and P. F. Porta, Lat. Am. Appl. Res., 2017, 64, 59–64 Search PubMed.
- E. S. Medeiros, J. A. M. Agnelli, J. Kuruvilla, L. H. Carvalho and J. Appl, Polym. Sci., 2003, 90, 1678–1682 Search PubMed.
- D. B. Fan, G. I. Li, T. F. Quin and F. X. Chu, Polymers, 2014, 6, 2221–2231 CrossRef.
- Y. Yu, P. Xu, M. Chang and J. Chang, Polymers, 2018, 10(11), 1183 CrossRef PubMed.
- J. S. Dick, Rubber technology: compounding and testing for performance, Hanser Publishers, Munich, 2nd edn, 2009 Search PubMed.
- J. S. Dick and C. P. Rader, Raw materials supply chain for rubber products: overview of the global use of raw materials, polymers, compounding ingredients, and chemical intermediates, Hanser Publishers, Cincinnati, 2014 Search PubMed.
- G. Kyselá, I. Hudec and P. Alexy, Manufacture and processing of rubber and gum, Slovak technical university, Bratislava, 2010 Search PubMed.
- J. Ronald, Tire curing bladders, Technical Bulletin, 2016, https://www.scribd.com/document/321103678/10-Tire-Curing-Bladders-pdf.
- R. Thorsten, Conti bladders, Technical databook: curing bladders, 2016/2017, https://blobs.continental-tires.com/www8/servlet/blob/814468/b0f8ba3b67802cb68e6658f9dcec9a96/technical-databook-curing-bladders-dld-data.pdf.
- R. Thorsten, Curing bladders: general information, https://www.continental-tires.com/car/about-us/continental-tires/contibladders/products/curing-bladders.
- J. Charles and S. Muthusamy, J. Appl. Sci. Environ. Manage., 2016, 2, 206–211 Search PubMed.
- S. Bell and M. Asaro, IHS Chemical: PEP Review, 2016 Search PubMed.
- J. Bonila-Cruz, B. Hernández-Mireles, R. Mendoza-Carrizales, L. A. Ramírez-Leal, R. Torres-Lubián, L. F. Ramosde-Valle, D. R. Paul and E. Saldívar-Guerra, Polymer, 2017, 9, 63 Search PubMed.
- O. B. Abdiyev, B. A. Mamedov, E. G. Mamedbeyli, A. M. Garamanov and N. Kh. Gusiyev, Azarb. Kim. J., 2019, 1, 19–22 Search PubMed.
- N. M. Nagornaya, G. I. Razdyakonova and S. Ya. Khodakova, Proc. Eng., 2016, 152, 563–569 CrossRef.
- J. Li, Q. Wang, I. A. Isayev and M. D. Soucek, J. Appl. Polym. Sci., 2017, 135, 45500 CrossRef.
- M. Harada, Int. Polym. Sci. Technol., 2015, 42, 192–197 Search PubMed.
- T. Lachowicz, J. Zieba-Palus and P. Koscielniak, Probl. Forensic Sci., 2012, 91, 195–207 CAS.
- X. M. Ma, R. Lu and T. Miyakoshi, Polymers, 2014, 6, 132–144 CrossRef.
- M. Melikantová, Determination of aromatic active substances in occasional types of small fruits, Bacehlor thesis, University of Technology, Brno, 2012.
- J. Krupka, Evaluation of chromatographic data, University of Chemistry and Technology, Prague, 2018 Search PubMed.
- P. Kusch, Pyrolysis-Gas Chromatography Mass Spectrometry of Polymeric Materials, World Scientific, London, 2018 Search PubMed.
| This journal is © The Royal Society of Chemistry 2022 |