
 Open Access Article
 This Open Access Article is licensed under a Creative Commons Attribution-Non Commercial 3.0 Unported Licence
Two-step facile synthesis of Co3O4@C reinforced PbO2 coated electrode to promote efficient oxygen evolution reaction for zinc electrowinning†
Wenhao Jiangab,
Junli Wangc,
Xuanbing Wang ab,
Jiang Liaoa,
Jinlong Weib,
Ruidong Xu*ab and
Linjing Yang*ab
ab,
Jiang Liaoa,
Jinlong Weib,
Ruidong Xu*ab and
Linjing Yang*ab
aState Key Laboratory of Complex Nonferrous Metal Resources Clean Utilization, Kunming University of Science and Technology, Kunming 650093, China. E-mail: eslinjingyang@kust.edu.cn; rdxupaper@aliyun.com
bFaculty of Metallurgical and Energy Engineering, Kunming University of Science and Technology, Kunming 650093, China
cResearcher Center for Analysis and Measurement, Kunming University of Science and Technology, Kunming 650093, China
First published on 6th April 2022
Abstract
The conventional Pb–Ag alloy possesses a high oxygen evolution reaction overpotential, poor stability, and short service life in acidic solutions, making it an unsuitable sort of anode material for the zinc electrowinning process. Therefore, a layered carbon-covered cobalt tetroxide (Co3O4@C)-reinforced PbO2-coated electrode is fabricated via a facile two-step pyrolysis-oxidation and subsequent electrodeposition process. As a result, the reinforced PbO2-coated electrode exhibits a low OER overpotential of 517 mV at 500 A m−2 and a Tafel slope of 0.152 V per decade in a zinc electrowinning simulation solution (0.3 M ZnSO4 and 1.53 M H2SO4). The reduced overpotential of 431 mV at 500 A m−2 compared to traditional Pb–0.76%Ag alloy leads to improved energy savings, which is attributable to the presence of Co3O4@C to refine the grain size and thus increase the effective contact area. Moreover, the reinforced PbO2-coated electrode has a prolonged service life of 93 h at 20![[thin space (1/6-em)]](https://www.rsc.org/images/entities/char_2009.gif) 000 A m−2 in 1.53 M H2SO4. Therefore, an accessible and efficient strategy for preparing a coated electrode to improve OER performance for zinc electrowinning is presented in this research.
000 A m−2 in 1.53 M H2SO4. Therefore, an accessible and efficient strategy for preparing a coated electrode to improve OER performance for zinc electrowinning is presented in this research.
1. Introduction
About 85% of zinc is currently extracted through hydrometallurgical electrowinning, but this process is economically burdensome due to high energy consumption.1 In the zinc electrowinning process, the anode oxygen evolution reaction (OER) involves a four-electron transfer process resulting in slow kinetics, and its occurrence requires an ultrahigh overpotential, which is the dominant cause of the vast energy consumption.2 Therefore, lowering the anodic OER overpotential is the principal direction for energy saving in the zinc electrowinning process.3 Generally, Pb–(0.5–1%)Ag alloy is the most extensively employed insoluble anode.4,5 However, its deficiencies, such as high overpotential, poor conductivity, and Pb contamination, are still tremendous challenges.6,7Lead dioxide (PbO2), as an inert metal oxide with the characteristics of good corrosion resistance and low price, is regularly prepared on the surface of Pb–(0.5–1%)Ag alloy in the zinc electrowinning industry.8,9 Whereas further improvement is urgently needed due to its inferior OER catalytic activity and poor stability in strongly acidic electrolytes.10 Hence, the development of a PbO2-coated electrode material with high electrocatalytic activity has always been the focus of research. For the past several decades, SnO2–SbxOy,11,12 IrO2–RuO2,13,14 and TiO2 nanotubes (TiO2-NTs)15 have usually been fabricated as intermediate layers to improve the electrocatalytic activity and stability of PbO2. In addition, some ions and active particles including Ag2+,16,17 Ni2+,18,19 Sn4+,20 RuO2,21 CeO2,22 MnO2,23,24 carbon nanotubes (CNTs)25 and Co3O4 (ref. 26 and 27) have been applied for reinforcing PbO2 to achieve prominent OER electrocatalytic activity, thereby leading to lower energy consumption.
Cobalt-based oxide is a promisingly inexpensive and efficient OER catalyst.28 Typically, it is reported that the unique spinel structure of Co3O4 facilitates electron transfer between cobalt ions in two different oxidation states: Co2+ occupying the tetrahedral sites and Co3+ located at the octahedral sites, offering more active sites and fewer energy barriers for the OER. And Co2+ is conducive to the formation of a CoOOH intermediate, which is the active site of the four-electron water splitting.29 Nevertheless, it still has certain defects as a high-efficiency OER electrocatalyst. The surface energy of nanoscale Co3O4 increased as its size decreased, and it caused metal aggregation, dissolution and oxidation under long-term contact with the external environment, leading to a decrease in its electrocatalytic activity and stability. Moreover, Co3O4 was a p-type semiconductor with poor electrical conductivity, which hindered electron transfer and reduced the energy conversion efficiency.26,30 As a substance with stable properties, carbon is an ideal material for improving the stability of transition metal-based catalysts.31 Therefore, it has been found that using carbon materials to coat metal nanoparticles is an effective improvement strategy to avoid the contact of internal metals with the external environment and improve the stability of the catalyst.32
Accordingly, we synthesized a Co3O4@C-reinforced PbO2-coated electrode by a simple two-step pyrolysis-oxidation and subsequent electrodeposition process. The morphology and structure were characterized by scanning electron microscopy (SEM), transmission electron microscopy (TEM), X-ray diffraction (XRD), and X-ray photoelectron spectroscopy (XPS), while other electrochemical tests were used to measure the electrochemical performance. Notably, a Co3O4@C-reinforced PbO2-coated electrode showed excellent OER activity and long service life in zinc electrowinning simulation solution (0.3 M ZnSO4 and 1.53 M H2SO4). In comparison with a conventional Pb–0.76%Ag electrode, the reinforced PbO2 electrode possessed a reduced η value of 431 mV at 500 A m−2, which significantly reduced the energy consumption. In addition, it exhibited strong durability with a service life of up to 93 h in 1.53 M H2SO4 at 20000 A m−2.
2. Experimental
2.1 Materials
Polyvinyl pyrrolidone (PVP) (Mw ≈ 1300000), cobalt nitrate hexahydrate (Co(NO3)2·6H2O), lead nitrate (Pb(NO3)2), lead oxide yellow (PbO), nitric acid (HNO3), and sodium hydroxide (NaOH) were procured from Aladdin. Pb–0.6%Sb plates were provided by the Kunming Hendera company. All chemicals were analytically pure and ready for use without further purification.
2.2 Synthesis of the Co3O4@C composite
In a typical synthesis of Co3O4@C composite, Co(NO3)2·6H2O (1.7 g) and PVP powder (2 g) were dissolved in 15 mL of DI water, then stirred intensively for 1 h and dried in a drying oven at 70 °C for 15 h. Then the Co3O4@C composite was prepared by pyrolysing at 750 °C for 2 h under an N2 atmosphere followed by oxidation in air at 250 °C.2.3 Preparation of PbO2-coated electrode
To begin with, a Pb–0.6%Sb/α-PbO2 electrode was prepared by electrodeposition in an alkaline system (0.15 M PbO and 3 M NaOH) at 15 mA cm−1. Then, the Co3O4@C-reinforced PbO2-coated electrode was prepared by constant-current electrodeposition in a solution consisting of 0.8 M Pb(NO3)2, 0.03 M HNO3, and a specific amount of Co3O4@C. A previously prepared Pb–0.6%Sb/α-PbO2 electrode was applied as the anode and a stainless steel sheet was employed as the cathode. The electrodeposition process proceeded at 25 mA cm−2 in a 40 °C thermostatic water bath for 1 h. After the reaction, the sample was taken out and dried at room temperature for subsequent testing.2.4 Characterization
The crystalline structures of the Co3O4@C composite and PbO2-coated electrodes were characterized using X-ray diffraction (XRD) measurement and X-ray photoelectron spectroscopy (XPS, PHI5500). The morphology and microstructure of the Co3O4@C composite were identified with field-emission scanning electron microscopic (FE-SEM; Nova NanoSEM 450) and transmission electron microscopic (TEM) measurements. Raman spectra were documented utilizing a LabRAM HR evolution Raman spectrometer. Fourier-transform infrared (FT-IR) spectra were performed using a Bruker ALPHA (Germany) spectrometer.2.5 Electrochemistry
All electrochemical tests were performed utilizing an electrochemical workstation equipped with a traditional three-electrode cell in zinc electrowinning simulation solution (0.3 M ZnSO4 and 1.53 M H2SO4) at 35 °C. All electrochemical tests in this work were performed without iR compensation. The PbO2-coated electrode served as a working electrode with an effective area of 1 cm2. A saturated calomel electrode (SCE) and stainless-steel dish were used for the reference and counter electrodes, respectively.3. Results and discussion
3.1 Fabrication and characterization
The graphical representation in Fig. 1a shows that the Co3O4@C composite was synthesized by pyrolysis in a tube furnace, followed by oxidation. PVP and Co(NO3)2·6H2O served as the carbon and cobalt sources, respectively. After the pyrolysis-oxidation process, the prepared Co3O4@C composite served as an electrochemically active modifier for subsequent electrodeposition. The PbO2 electrodeposition mechanism in Fig. 1b can be described according to previously studied literature.33,34 A Co3O4@C-reinforced PbO2-coated electrode with a layered structure was fabricated via electrodeposition. As depicted in Fig. 1c, the layered Co3O4@C-reinforced PbO2-coated electrode consisted of three layers, with Pb–0.6%Sb alloy as the substrate, α-PbO2 as the intermediate layer to strengthen the combination of the substrate and the β-PbO2 layer, and the outermost β-PbO2-Co3O4@C as the active layer for boosting OER activity.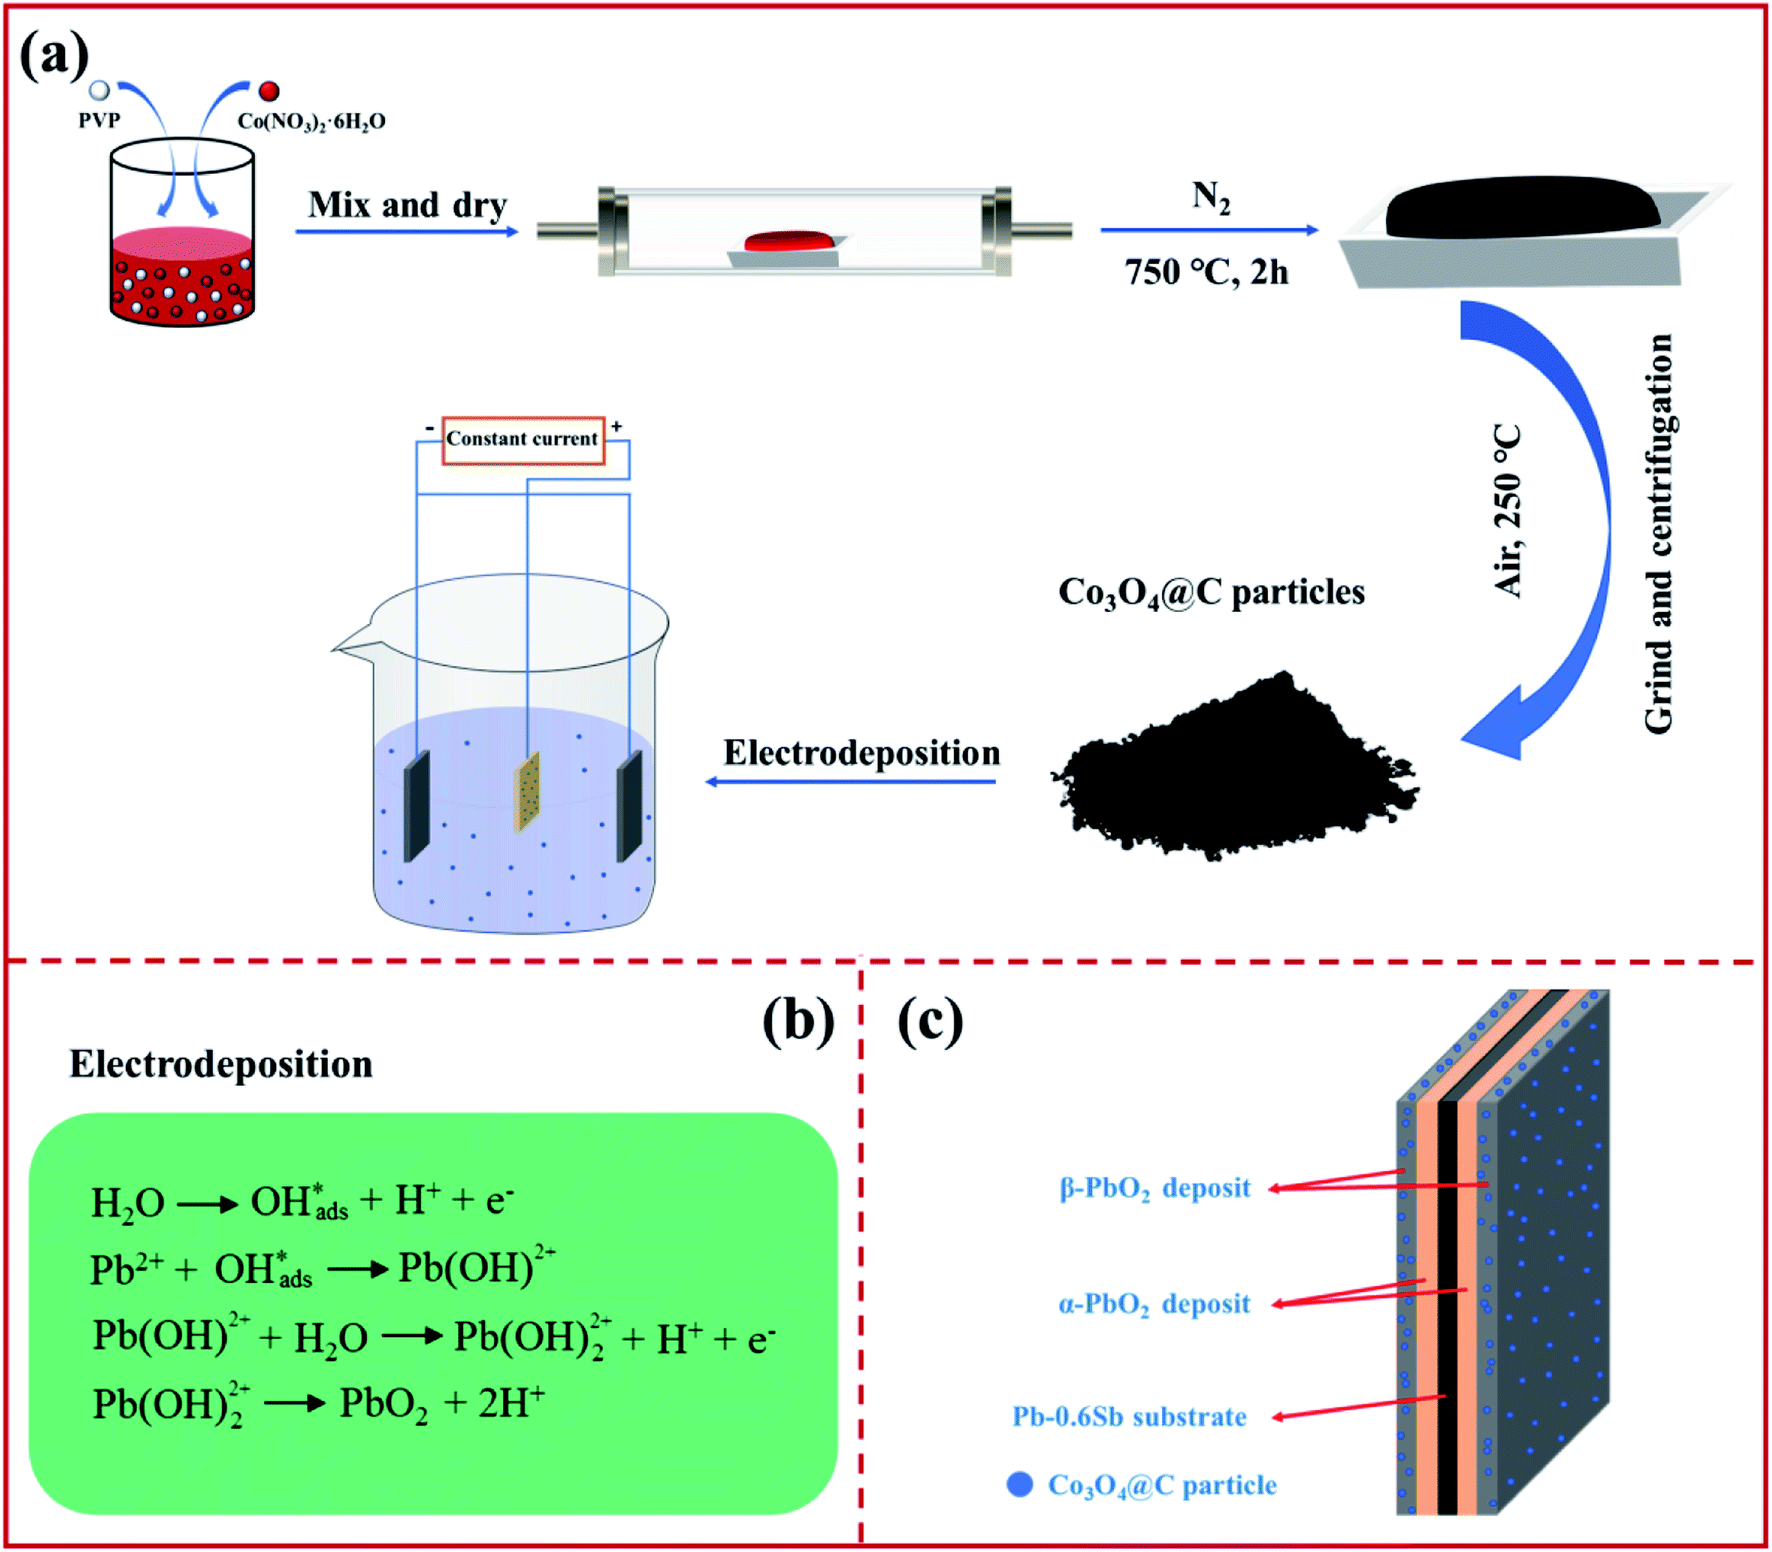 | ||
| Fig. 1 An illustration of (a) the fabrication procedure, (b) equations of the lead dioxide deposition mechanism, and (c) the construction of a layered Co3O4@C-reinforced PbO2-coated electrode. | ||
The X-ray diffraction (XRD) pattern of Co3O4@C is recorded in Fig. 2a. The outstanding diffraction peaks at 19.0, 31.2, 36.8, 38.5, 44.8, 55.7, 59.4, and 65.2° can be well indexed to the (111), (220), (311), (222), (400), (422), (511) and (440) lattice planes of pure spinel Co3O4 without any evident impurities. The Raman spectrum (Fig. 2b) was collected in the range of 100–2000 cm−1 and showed five evident vibrational bands at 205, 482, 527, 618, and 691 cm−1, indexed to F2g 205, Eg 482, F2g 527, F2g 618, and A1g 691 symmetry modes, respectively. All five identified peaks accurately matched the pure Co3O4 spinel structure. Moreover, in Fig. 2b, the D band (due to the highly ordered graphite lattice)35 can be observed at 1349.35 cm−1 and the G band (given the sp2 carbon)36 at 1593.39 cm−1. These two bands were in accord with the characteristic D and G vibrational bands of graphitic carbon that may be produced by PVP carbonization. The composition of the Co3O4@C composite was further verified by the FT-IR spectrum (Fig. 2c). In terms of details, the absorption band at 1403.42 cm−1 was assigned to the O–H stretching vibration in absorbed water, while the O–H deformation vibration band in absorbed water was observed at 3416.94 cm−1.37 The band at 1636.42 cm−1 derived from C![[double bond, length as m-dash]](https://www.rsc.org/images/entities/char_e001.gif) O groups. The Co–O bond characteristic of the Co3O4@C composite was investigated in the intensive bands at 662.97 and 564.61 cm−1.38
O groups. The Co–O bond characteristic of the Co3O4@C composite was investigated in the intensive bands at 662.97 and 564.61 cm−1.38
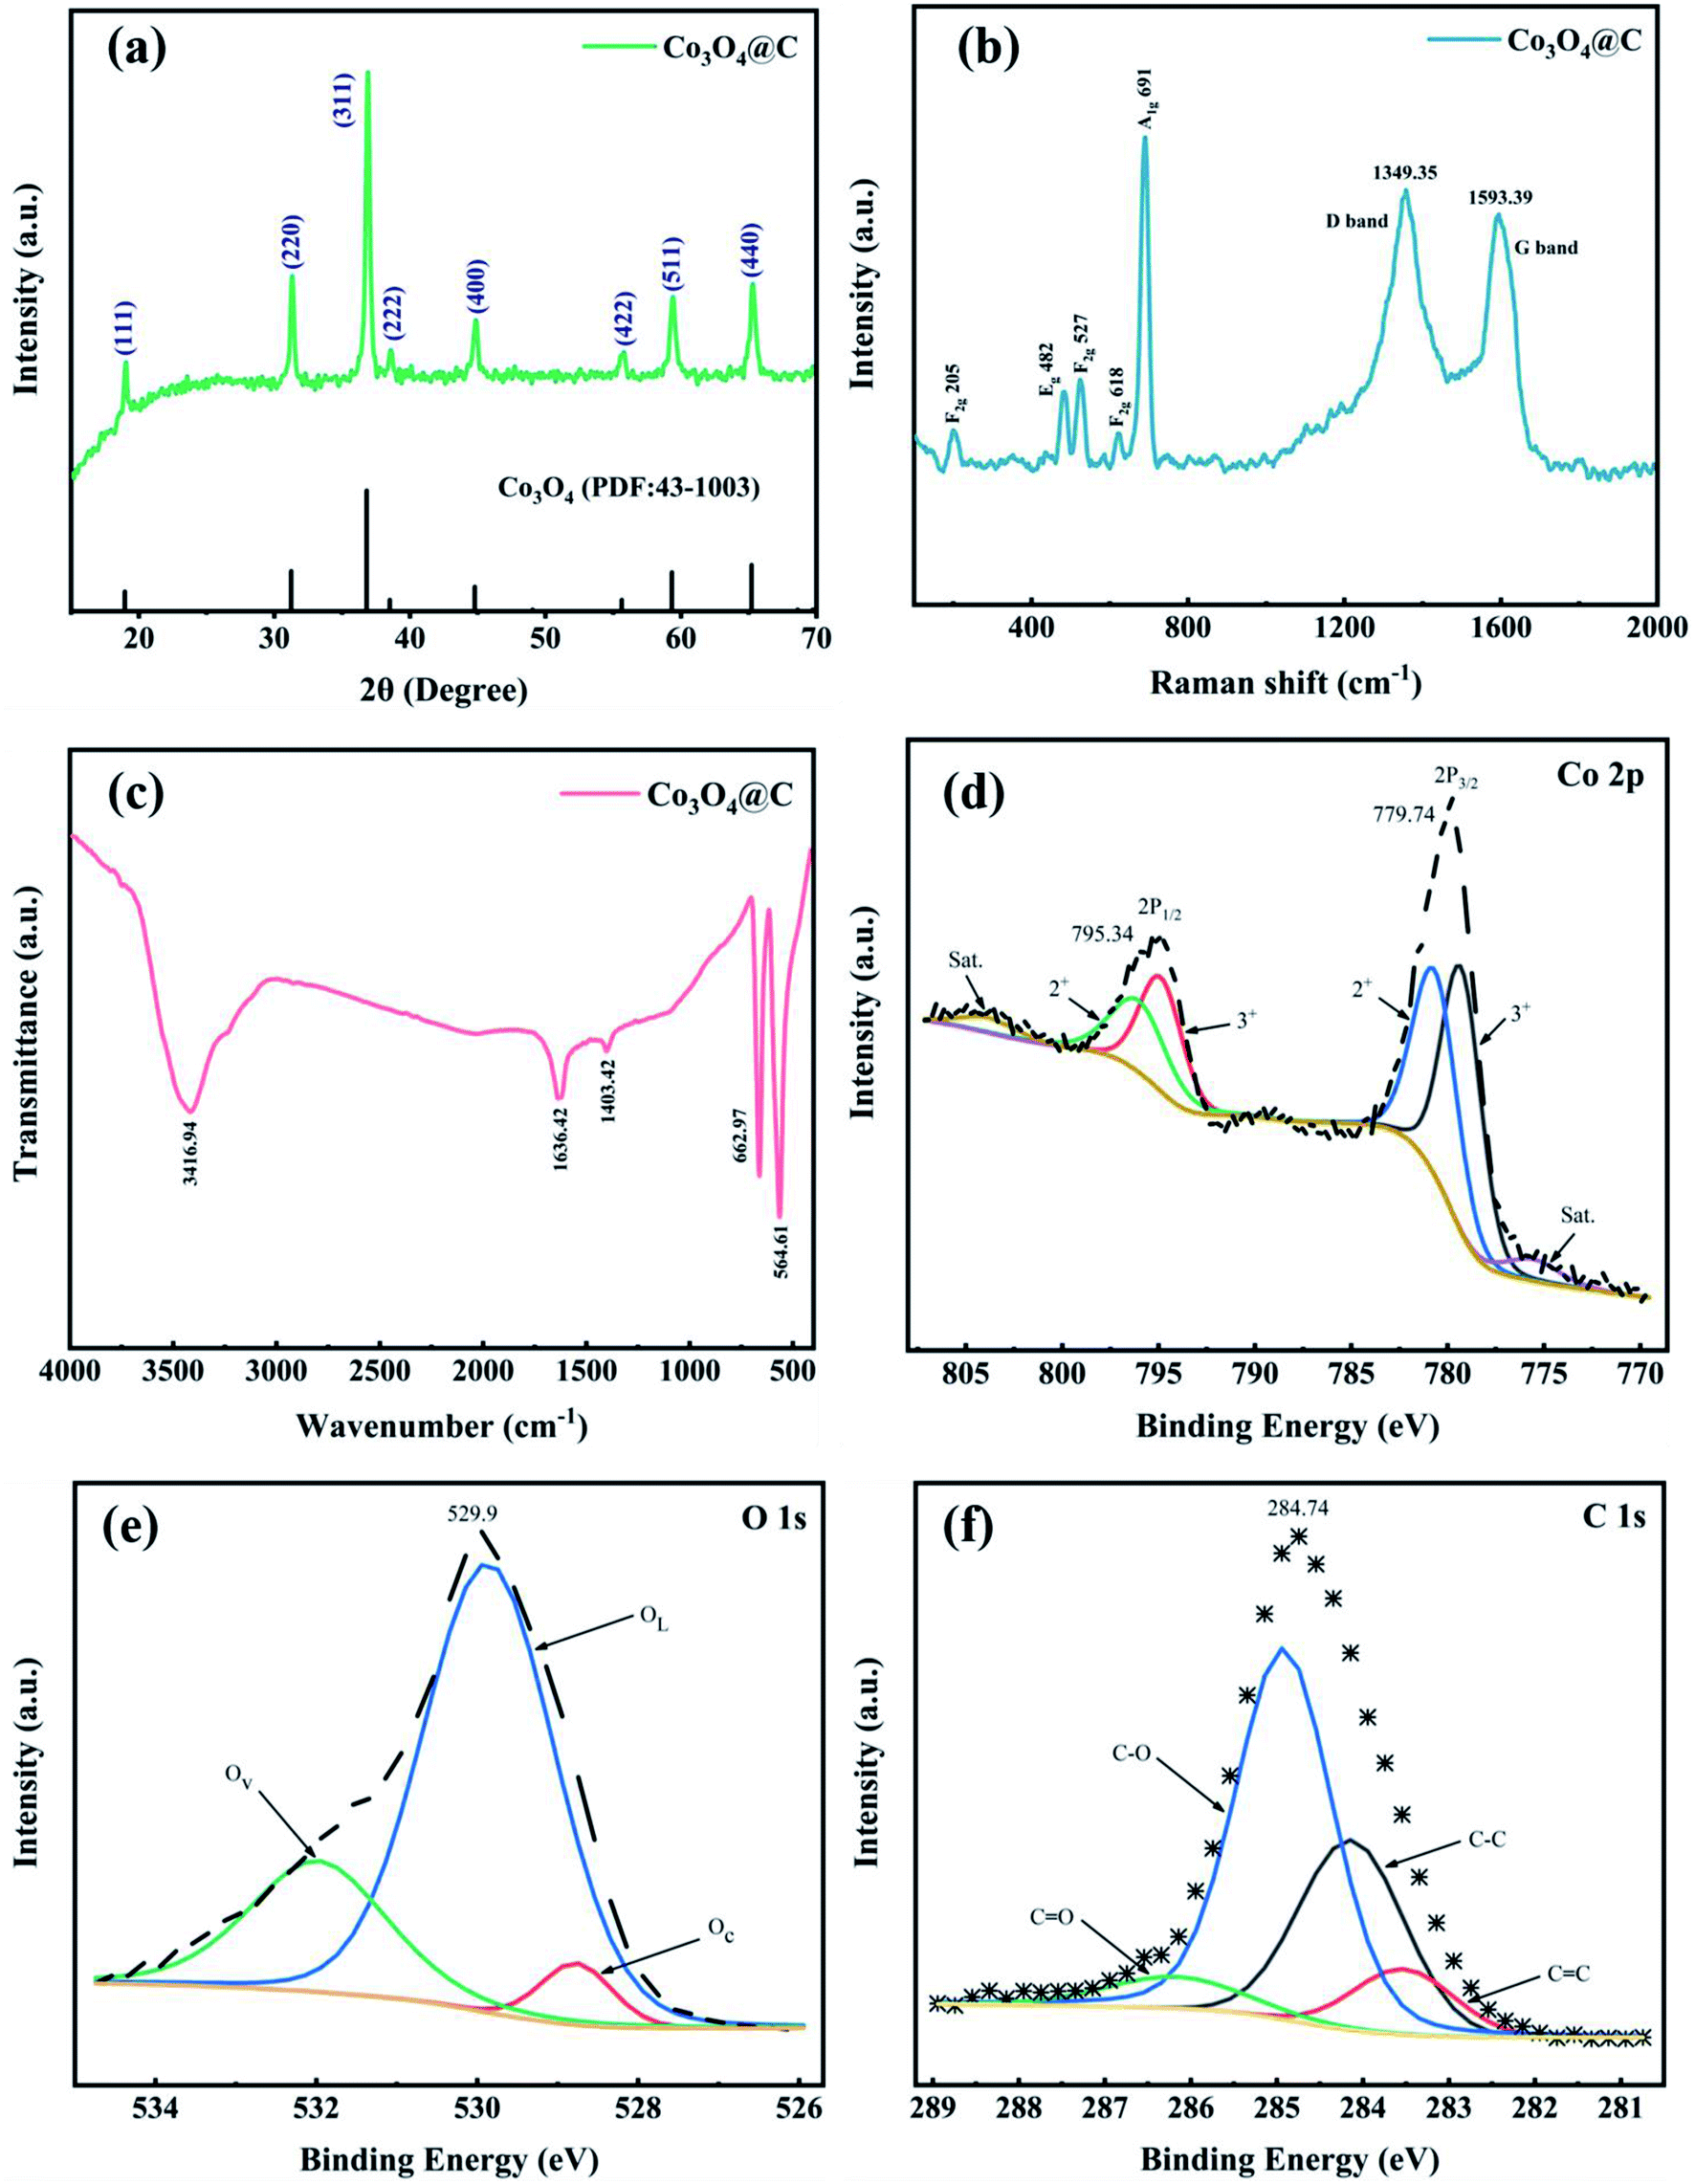 | ||
| Fig. 2 (a) XRD pattern, (b) Raman and (c) FT-IR spectra, high-resolution XPS spectra for (d) Co 2p, (e) O 1s and (f) C 1s of the as-prepared Co3O4@C composite. | ||
XPS measurements were carried out to characterize the chemical states and structure of the Co3O4@C composite. Fig. S1† exhibits the overall XPS spectra to confirm the main Co, O, C elements with their characteristic peaks for Co 2p, O 1s, and C 1s at 780.0, 529.6, and 284.8 eV binding energies, respectively. Two prominent peaks in Fig. 2d located at 779.74 and 795.34 eV were related to Co 2p3/2 and Co 2p1/2, respectively, indicating spin–orbit doublets and the formation of Co3O4. In addition, two related satellite peaks were fitted at 775.59 and 803.84 eV, further denoting the coexistence of Co2+ and Co3+ oxidation states. The Co 2p3/2 and the Co 2p1/2 peaks can be further separated into two peaks. The peaks located at 780.65 and 796.03 eV were identified as Co2+. And the other two peaks positioned at 779.28 and 794.88 eV were correlated with Co3+ in the Co3O4@C composite.39
As displayed in Fig. 2e, in the high-resolution XPS spectra of O 1s, there were three deconvoluted peaks representing chemisorbed oxygen (Oc) at 528.77 eV, lattice oxygen (OL) at 529.86 eV, and oxygen vacancies (Ov) at 531.98 eV.31,40 The high-resolution C 1s spectrum (Fig. 2f) revealed the existence of four species, which were associated with CC (283.53 eV), C–C (284.14 eV), C–O (284.92 eV), and CO (286.18 eV).41,42 Notably, oxygen-containing groups (C–O and CO) were beneficial for enhancing the hydrophilicity of Co3O4@C, leading to facilitating the absorption of H2O molecules on the catalyst surface, thus improving the OER activity in an acidic electrolyte.40,43
The morphology and microstructure examined via SEM and TEM images of the prepared Co3O4@C composite are summarized in Fig. 3. In the SEM image (Fig. 3a), numerous spherical nanoparticles in a diameter range from 55 to 85 nm overlapped to form large-sized clusters, which is consistent with the morphology revealed by the dark spots of the low-magnification TEM images. From the elemental mappings (Fig. 3b), the Co, O, and C elements were uniformly distributed and were the main components of Co3O4@C, which further proved the coexistence of Co, O, and C in the prepared Co3O4@C composite. A detailed examination of the HRTEM (Fig. 3e) showed that the lattice fringes were arrayed in a legible and disciplined manner. The interplanar spacing of 0.47 nm, corresponding to the (111) plane of spinel Co3O4, was clearly observed. Besides, it can be seen that crystalline Co3O4 was covered with amorphous carbon involving inconspicuous lattice fringes across the obvious interface, which was in keeping with the spherical structure of the nanoparticles exhibiting a layer of carbon wrapped around them in Fig. 3f and g. Fig. 3h exhibits a selected area electron diffraction (SAED) pattern, suggesting that the Co3O4 composite was well crystallized with a polycrystalline essence. The several diffraction rings corresponded to the (111), (220), (311), and (400) planes of the Co3O4 composite. As detailed above for all characterizations, the elemental composition and phase information of the spinel Co3O4 and carbon were precisely determined utilizing the XRD, Raman, FT-IR, and XPS spectra. And the morphology and nanostructure of the Co3O4 composite were subsequently investigated using SEM and TEM images, which revealed the co-existence of crystalline Co3O4 and amorphous carbon in an encapsulated state.
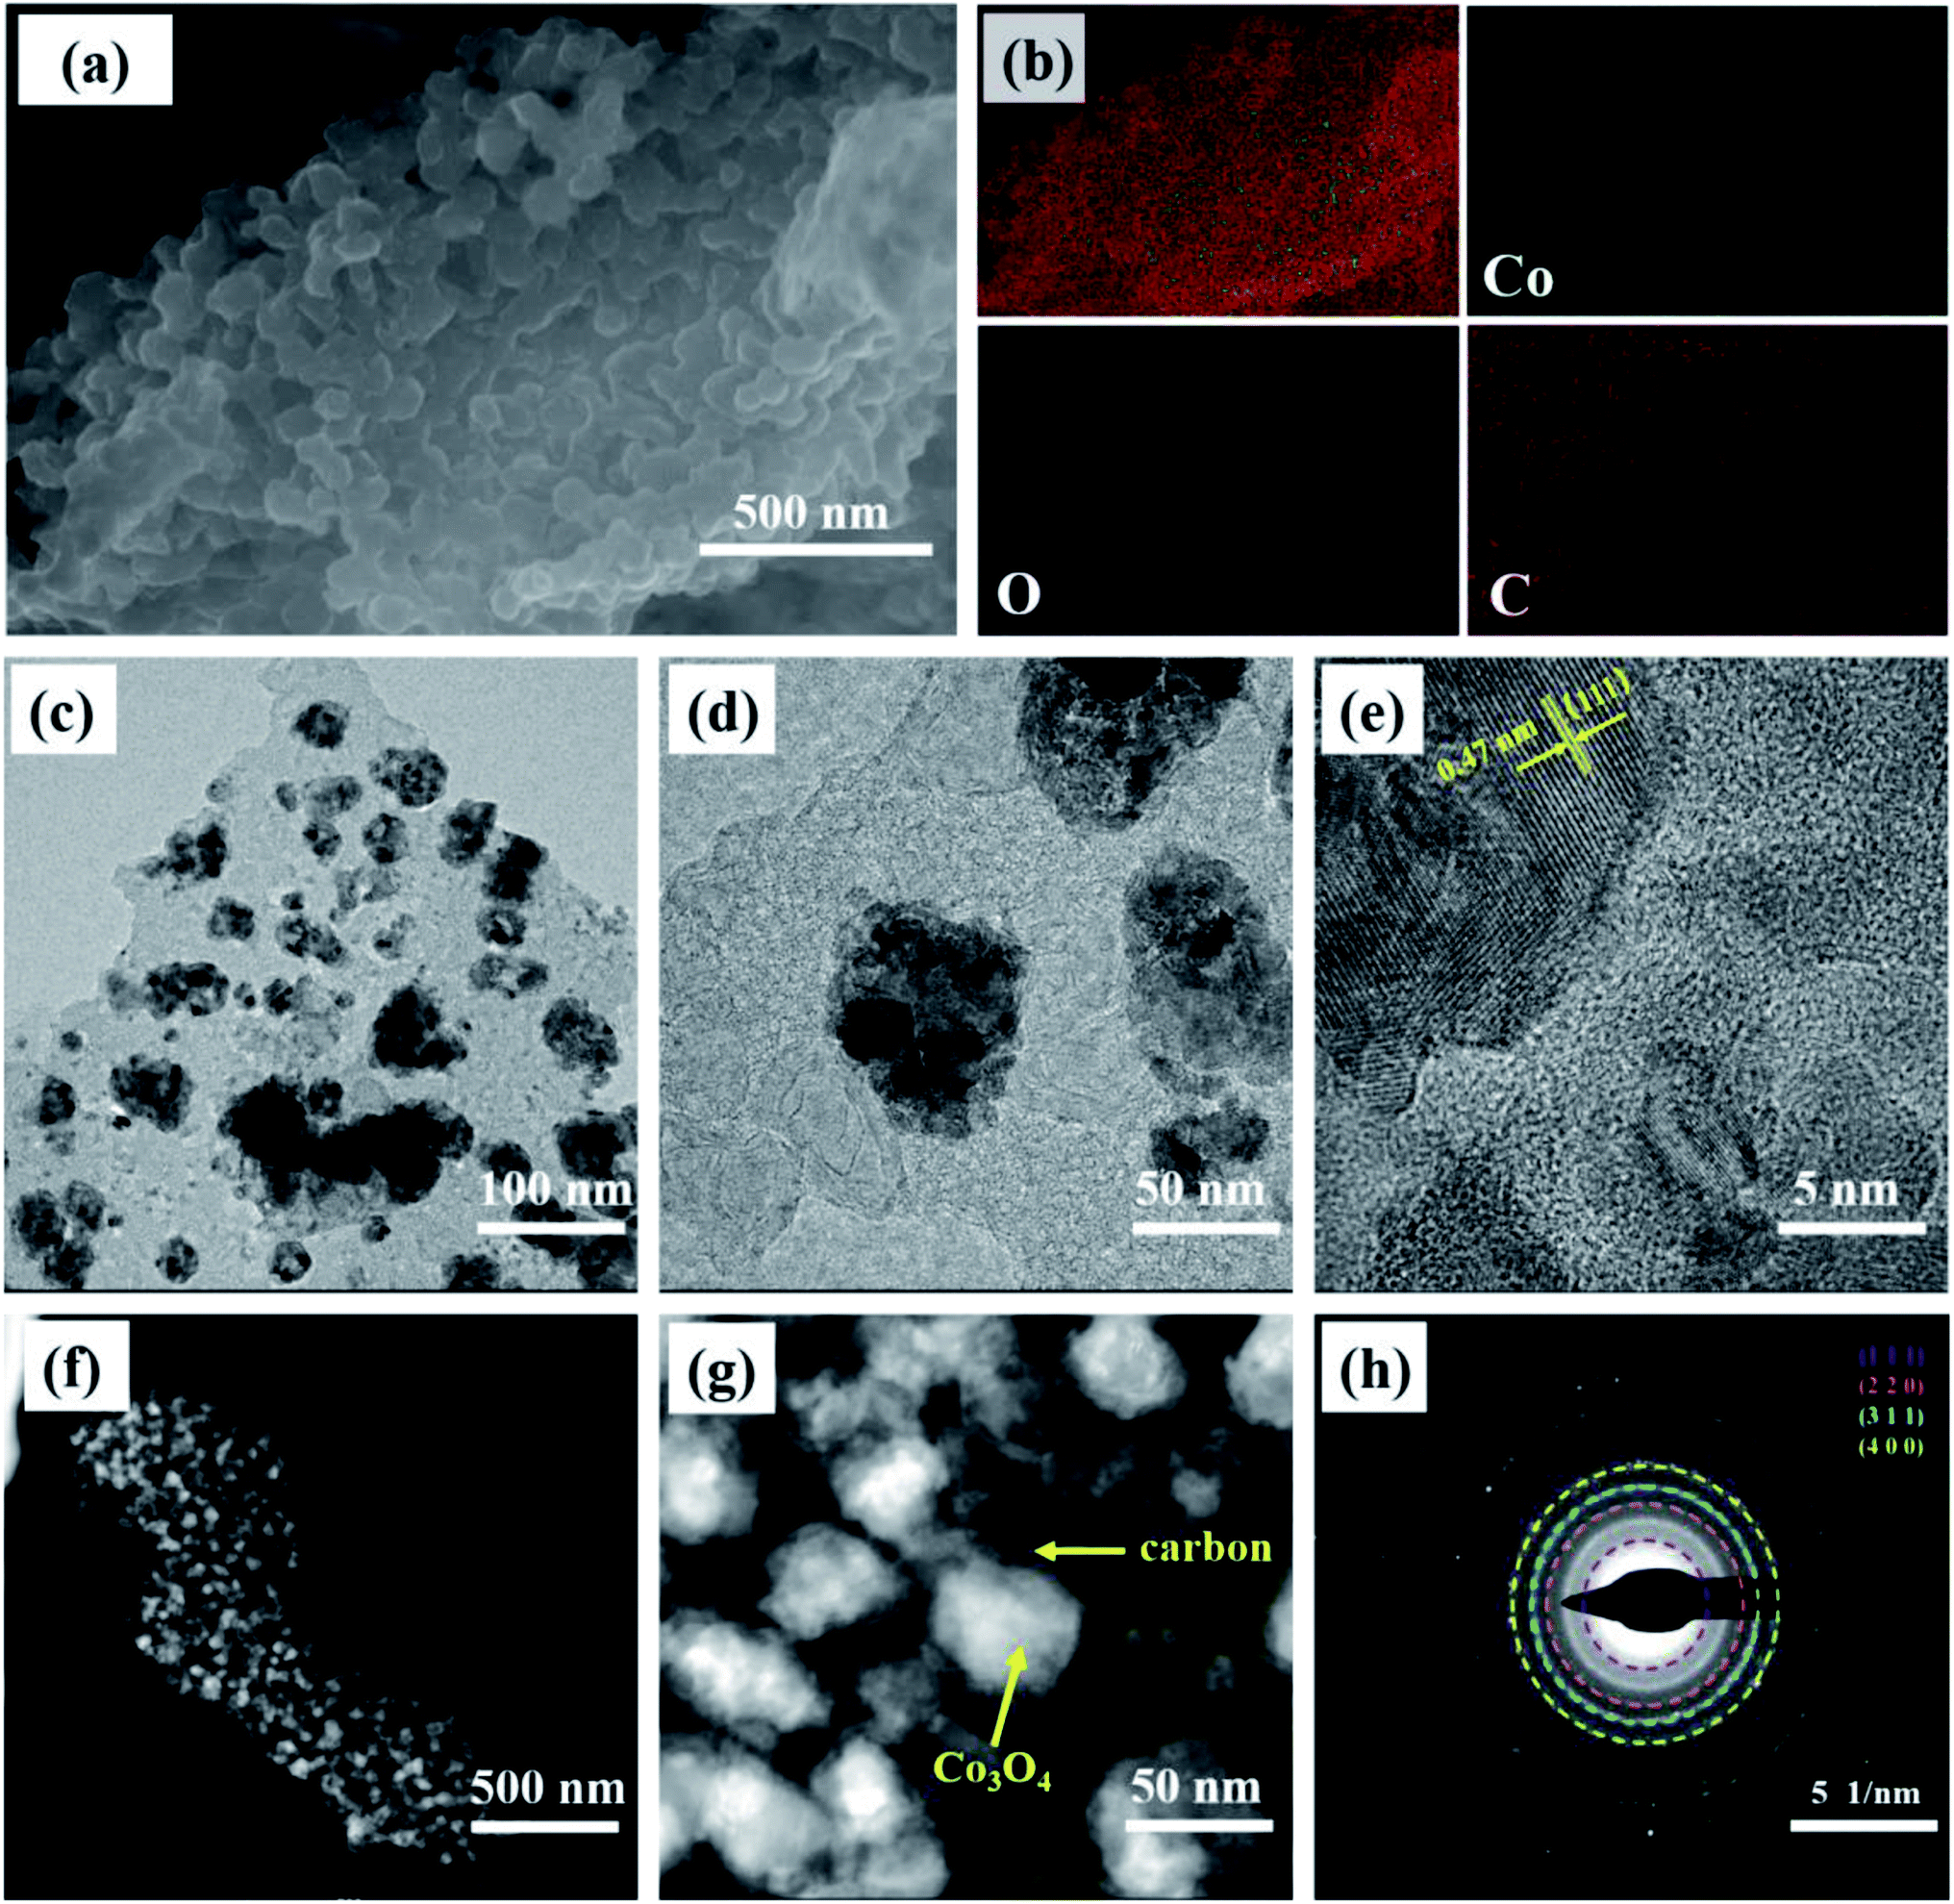 | ||
| Fig. 3 (a) The SEM image, (b) elemental mapping, (c and d) and (f and g) TEM images, (e) HRTEM image, and (h) SAED pattern of the Co3O4@C composite. | ||
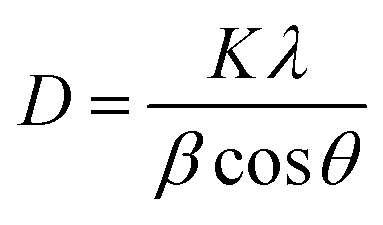
The XRD patterns of PbO2 deposited without and with reinforcement by Co3O4@C are recorded in Fig. 4a. Specifically, according to the standard data (JCPDS, no. 41-1492), the significant peaks located at 25.43°, 31.97°, 36.19°, 49.04°, 62.46°, and 74.41° were assigned to (110), (101), (200), (211), (301) and (321) planes, respectively, which were associated with β-PbO2. The related characteristic peaks of α-PbO2 were found at 28.62°, 36.16°, 49.49°, matching well with the (111), (200) and (130) crystal planes (JCPDS, no. 45-1416). The existence of Co3O4@C was not detected from this XRD measurement, which may be caused by the low content of Co3O4@C in the deposit. Furthermore, it was found that the addition of Co3O4@C weakened the intensity of the diffraction peak, which was beneficial for reducing the crystal grain size since the half-width height of the diffraction peak was negatively correlated with the grain size according to Debye–Scherrer's eqn (1). It is also worth noting that the characteristic diffraction peaks of Co3O4 and carbon were not observed in the XRD measurement, which may be explained by the small amount in the electrode. Hence, the grain sizes of the (110), (101), (021), and (210) crystal planes were calculated with eqn (1), and the calculations are plotted in Fig. 4b.
 | (1) |
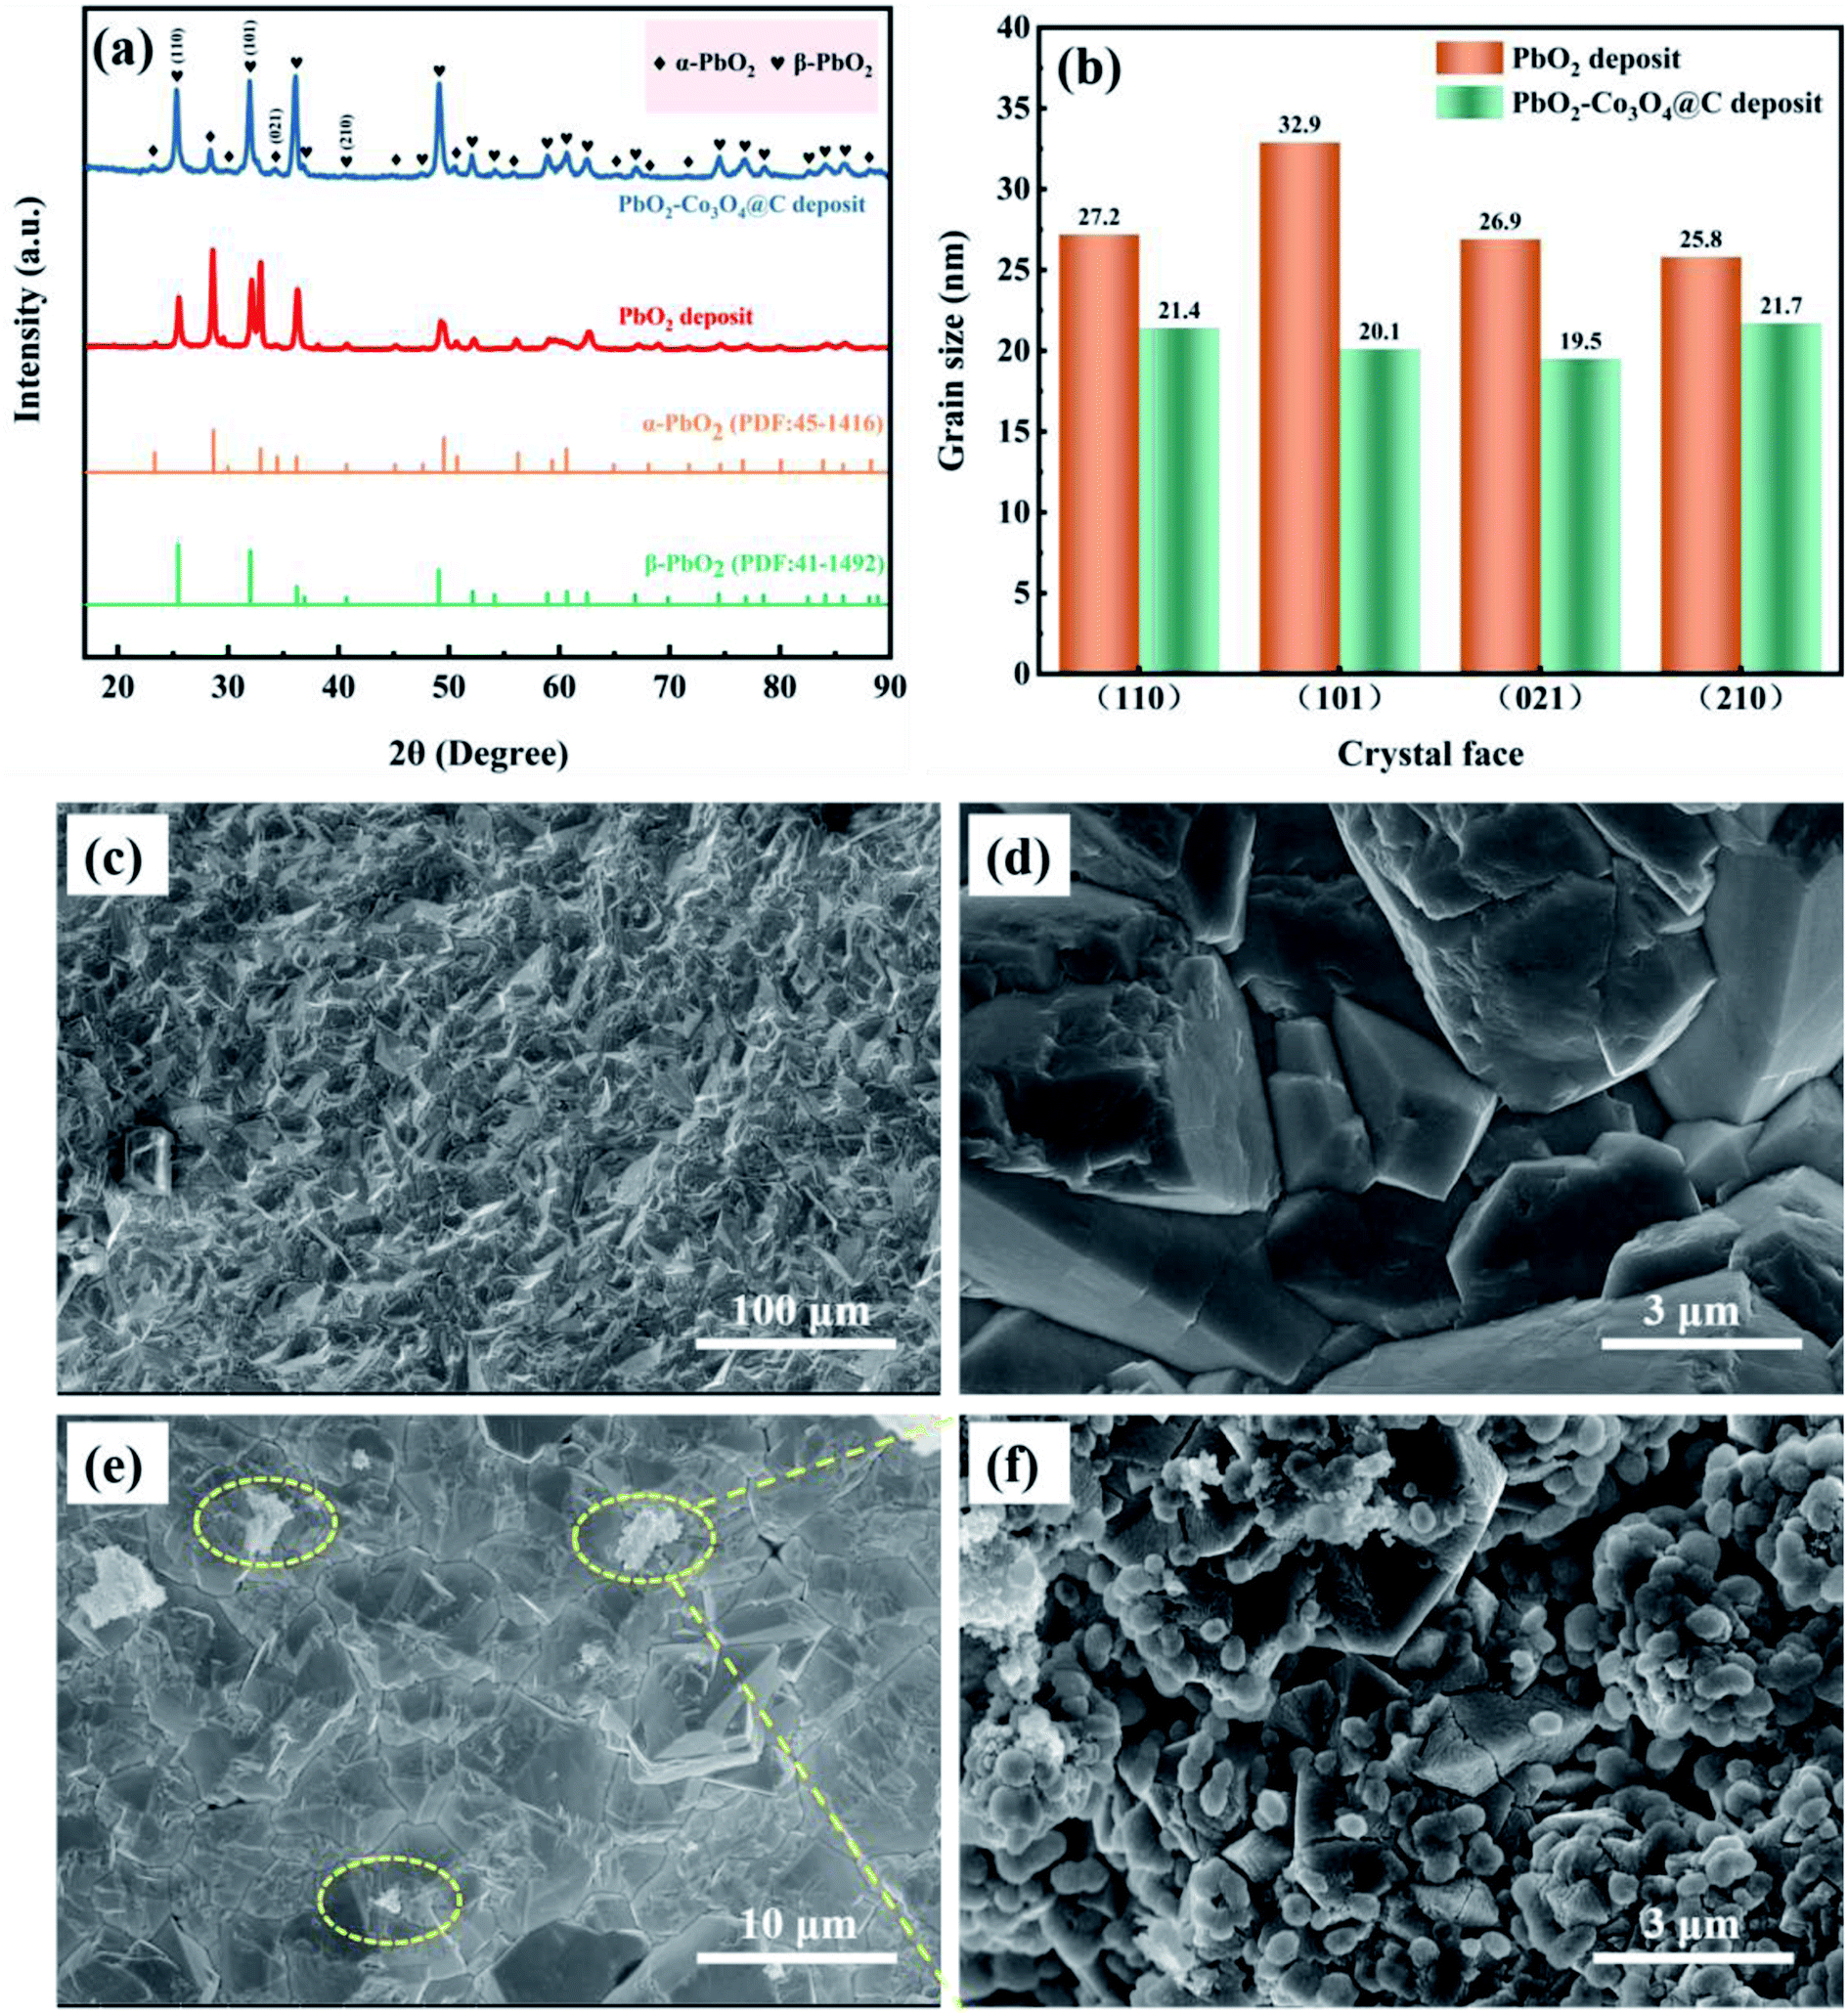 | ||
| Fig. 4 (a) The XRD patterns, (b) a comparison of grain size of different crystal planes, and the SEM images of (c and d) β-PbO2 and (e and f) β-PbO2-Co3O4@C sedimentary layers. | ||
To clarify the role of α-PbO2, Fig. S3† shows cross-sectional SEM images of Pb–0.6%Sb/β-PbO2 and Pb–0.6%Sb/α-PbO2/β-PbO2 electrodes. As can be seen in Fig. S3a,† the thickness of the α-PbO2 layer was around 50 μm while the thickness of the β-PbO2 layer was in range of 105 to 165 μm. There were no obvious structural defects at the interface among the substrates, α-PbO2 and β-PbO2, and the structure was dense and uniform. However, in Fig. S3b,† the interface between the substrate and β-PbO2 is more obviously heterogeneous, which caused the PbO2 electrode to have poor durability in harsh environments. Therefore, in this work, a layer of α-PbO2 was electrodeposited to improve the bonding between the substrate and the β-PbO2 active layer, thus improving the lifetime of the whole PbO2 electrode. Fig. 4c and d show the images of β-PbO2 without reinforcement by Co3O4@C at high and low magnification. It can be found that β-PbO2 exhibited a regular pyramidal morphology which can effectively increase the contact area and thus lead to a speedy OER. Fig. 4e shows a β-PbO2-Co3O4@C deposit at low magnification, and Fig. 4f shows a partial high-magnification view. The Co3O4@C composite can be seen in the β-PbO2 deposit, confirming that Co3O4@C and PbO2 co-deposited to form the Co3O4@C-reinforced PbO2-coated electrode. To highlight this, Fig. S4† shows the SEM image and element map of the PbO2–Co3O4@C deposit. From the SEM image, it could be found that numerous Co3O4@C particles overlaid a portion of the pyramidal β-PbO2. The elemental map exhibited a uniform distribution of the four elements Pb, Co, O, and C, which further demonstrated the coexistence of PbO2 and Co3O4@C.
3.2 Electrochemical performance
Fig. S5† displays the linear sweep voltammetry (LSV) curves of electrodes without reinforcement and reinforced by the prepared Co3O4@C composite with different oxidation times (OTs). To explore the best oxidation time, the Co3O4@C composite was fabricated through oxidation in air at 250 °C for 1 hour, 3 hours, 5 hours, and 7 hours, respectively. One can see that the Pb–0.6%Sb/α-PbO2/β-PbO2-Co3O4@C (OT = 3 h) electrode exhibited the lowest potential of 1.516 V at 500 A m−2, which was remarkably reduced by 431 mV compared with the unreinforced electrode (Pb–0.6%Sb/α-PbO2/β-PbO2). The potentials of other reinforced PbO2 electrodes were 1.680 V (Pb–0.6%Sb/α-PbO2/β-PbO2-Co3O4@C, OT = 1 h), 1.517 V (OT = 5 h), and 1.569 V (OT = 7 h), respectively. Fig. S6† shows the OER overpotential of all the electrodes mentioned above at 500 A m−2. As depicted, the Pb–0.6%Sb/α-PbO2/β-PbO2-Co3O4@C (OT = 3 h) electrode exhibited the lowest overpotential of 517 mV. Obviously, Co3O4@C (OT = 3 h) showed the most excellent catalytic activity. Therefore, over the whole context, the Co3O4@C (OT = 3 h) composite and Pb–0.6%Sb/α-PbO2/β-PbO2-Co3O4@C (OT = 3 h) with different concentrations will be discussed.The cyclic voltammetry (CV) curves of the Co3O4@C-reinforced PbO2-coated electrodes with different concentrations are shown in Fig. 5a. All electrodes possessed a strong oxidation peak, indicating the splitting of H2O into O2. And all the reduction peaks can be correlated with the formation of Pb2+ (PbSO4), as given in the formula below:
| PbO2 + H2SO4 + 2H+ + 2e− ↔ PbSO4 + 2H2O | (2) |
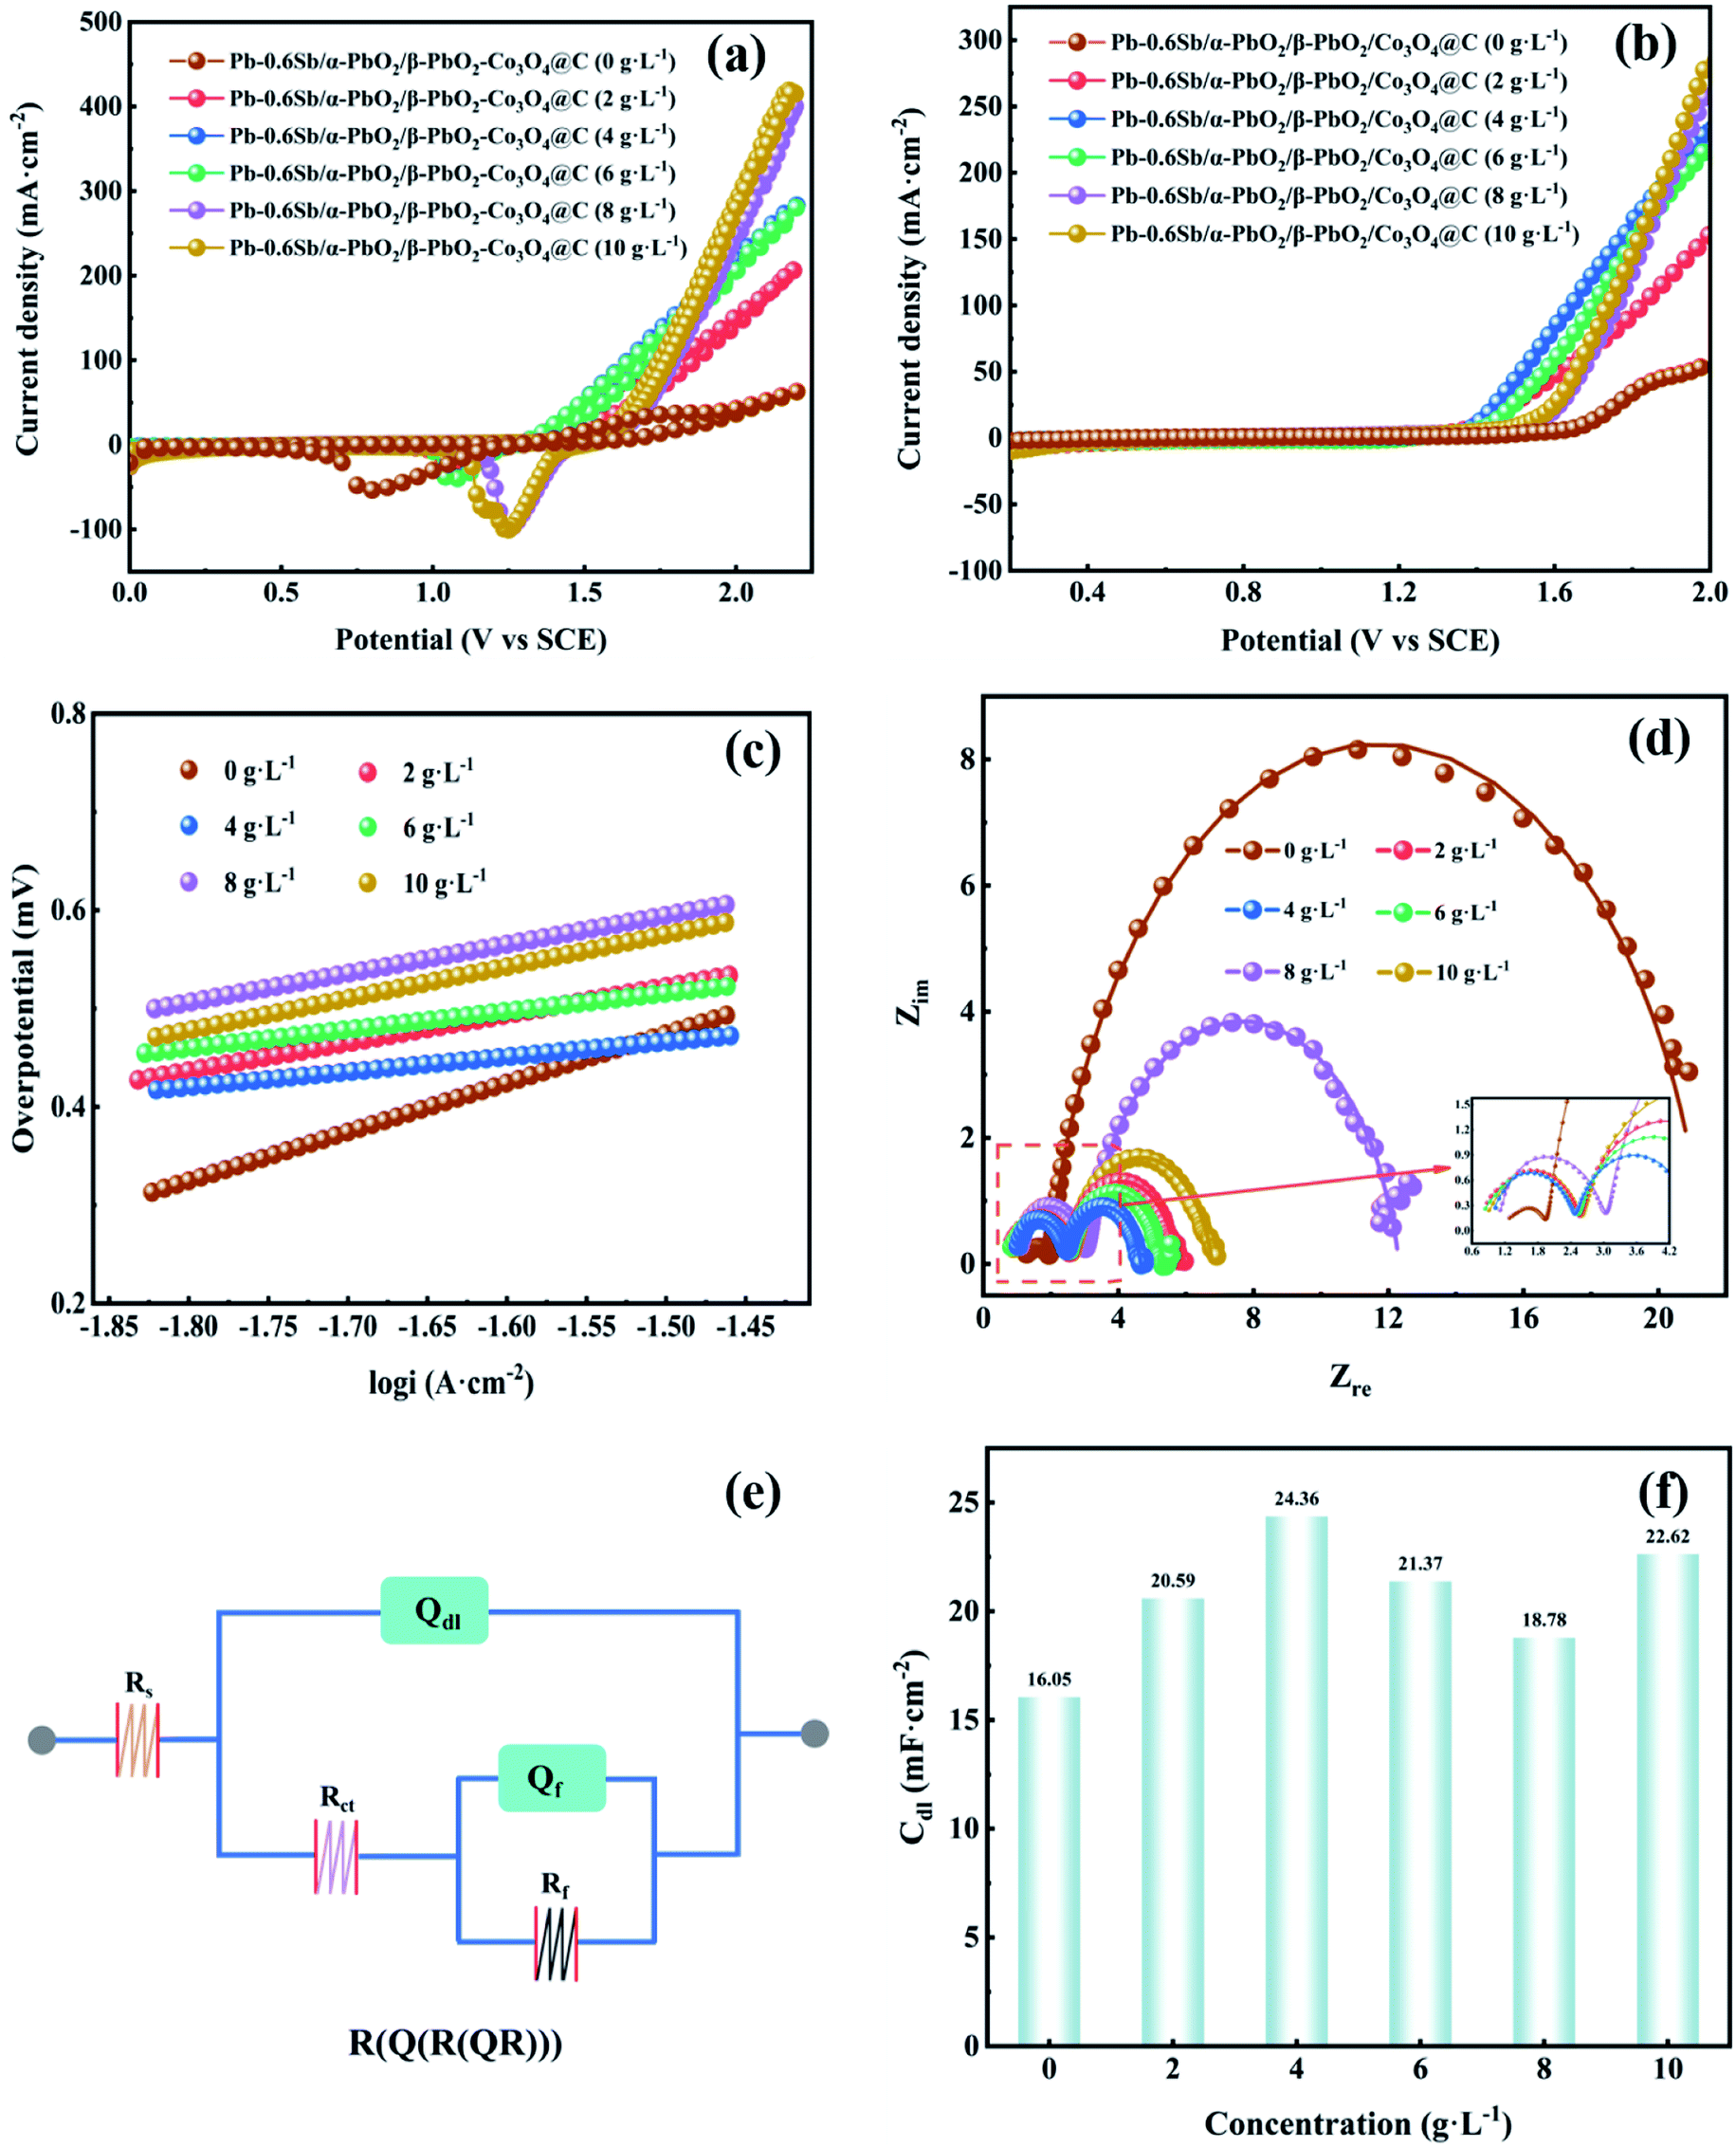 | ||
| Fig. 5 (a) CV curves, (b) LSV curves, (c) related Tafel fitting plots, (d) electrochemical impedance spectroscopy Nyquist plots, (e) equivalent circuit, (f) Cdl values of the PbO2-coated electrode reinforced with different concentrations of Co3O4@C. | ||
The redox performance of all PbO2 electrodes seemed to be similar. It is worth noting that the reduction peak in the cathodic branch of the Pb–0.6%Sb/α-PbO2/β-PbO2-Co3O4@C (0 g L−1) electrode showed a significantly negative shift, which may be due to the susceptibility of the unreinforced electrode to changes in solution composition during the test.47
Fig. 5b displays the LSV curves of all PbO2-coated electrodes with different Co3O4@C concentrations. The order of oxygen evolution potential at 500 A m−2 from high to low is Pb–0.6%Sb/α-PbO2/β-PbO2 (0 g L−1) (1.947 V) > Pb–0.6%Sb/α-PbO2/β-PbO2-Co3O4@C (8 g L−1) (1.670 V) > Pb–0.6%Sb/α-PbO2/β-PbO2-Co3O4@C (10 g L−1) (1.655 V) > Pb–0.6%Sb/α-PbO2/β-PbO2-Co3O4@C (2 g L−1) (1.619 V) > Pb–0.6%Sb/α-PbO2/β-PbO2-Co3O4@C (6 g L−1) (1.575 V) > Pb–0.6%Sb/α-PbO2/β-PbO2-Co3O4@C (4 g L−1) (1.516 V). As represented in Fig. S7,† the corresponding order of overpotential is 948, 671, 656, 620, 576, and 517 mV, respectively. Evidently, when the electrodeposition concentration of Co3O4@C was 4 g L−1, the reinforced PbO2 electrode exhibited the lowest overpotential, suggesting the most excellent OER electrocatalytic activity. Hence, the concentration of Co3O4@C in the electrolyte of 4 g L−1 was considered the best condition for preparing composite electrodes. Furthermore, Fig. S8† shows the relationship among the Co3O4@C concentration, the loading mass, and the percentage of Co3O4@C mass in the active β-PbO2 layer. When the concentration of Co3O4@C was raised from 0 to 4 g L−1, the loading mass showed a significant increase. However, the increasing trend of the loading mass was more gradual when the concentration exceeded 4 g L−1. This regularity also confirmed that the Co3O4@C-reinforced PbO2-coated electrode (4 g L−1) had minimum OER overpotential in Fig. S7.† Therefore, 4 g L−1 Co3O4@C in the electrolytic solution was considered the best concentration conditions to prepare the coated electrodes.
From Fig. 5c, one can see that the LSV curves were processed with the Tafel equation (η = a + blgi) to obtain the Tafel linear fitting lines for all PbO2 electrodes. Related factors are listed in Table S1.† All R2 values exceeded 0.99, indicating the accuracy of the fitting. It can be observed from Table S1† (column b) that all Co3O4@C-reinforced PbO2-coated electrodes showed lower OER values, indicating that their OER kinetics were enhanced. In particular, the Co3O4@C-reinforced PbO2-coated electrode (4 g L−1) showed a minimum Tafel slope value of 0.156 V dec−1, which denoted the fastest oxygen evolution reaction kinetics.
A widely recognized OER pathway could be elaborated in detail using formulae (3)–(5):48,49
| S + H2O → S–OHads + H+ + e− | (3) |
| S–OHads → S–Oads + H+ + e− | (4a) |
| 2S–OHads → S–Oads + S + H2O | (4b) |
| S–Oads → S + 1/2O2 | (5) |
To improve our understanding of the electrochemical performance of all PbO2 electrodes, EIS measurements were employed to examine the charge transfer property of the electrode–solution interface in the frequency region of 0.01–100000 Hz. As displayed in Fig. 5d, the Nyquist plots of all PbO2 electrodes showed a similar shape consisting of two semicircles located in the high-frequency and low-frequency regions, respectively. The high-frequency semicircle represents the adsorption resistance (Rf) of the OER intermediates (S–OHads and S–Oads), and the low-frequency semicircle represents the charge transfer resistance (Rct).15,50 Each electrode exhibited a low adsorption resistance (Rf) value, reaching the smallest one when Co3O4@C electrodeposition concentration was 4 g L−1. And the radius of curvature of the low-frequency semicircle in the Nyquist plot was smallest when the Co3O4@C electrodeposition concentration was 4 g L−1, implying the smallest charge transfer resistance (Rct) (2.18 Ω). The equivalent circuit of R(Q(R(QR))) (Fig. 5e) was utilized to model the electrochemical system, where the Rs was the solution resistance, Qdl was a constant phase element associated with the bilayer capacitance (Cdl) on the (Pb–0.6%Sb substrate|coated layers|electrolytic solution) and Qf was another constant-phase element, and Rf was the adsorption resistance. All the calculations are listed in Table S2.† The Rs values of all PbO2 electrodes fluctuated over a small range, indicating that the tested solutions were in a similar steady-state. For Qdl, the bilayer capacitance Cdl was derived from formula (6), and all calculations are plotted in Fig. 5f. Obviously, the reinforced PbO2 electrode with the Co3O4@C concentration of 4 g L−1 possessed the largest Cdl value. Among all PbO2 electrodes, the Co3O4@C-reinforced PbO2-coated electrode (4 g L−1) showed minimum Rf (0.12 Ω), Rct (2.18 Ω) and maximum Cdl (24.36 mF cm−2) values, demonstrating the most significant OER electrocatalytic activity.51
| C = Q1/nRs(1−n)/n | (6) |
Fig. S9† is a histogram comparing the overpotential at 500 A m−2 of various electrodes investigated in the literature and this study, and the relevant references cited are listed in Table S3.† Notably, the overpotential of the Co3O4@C-reinforced PbO2-coated electrode (4 g L−1) in this work was the lowest compared with other electrodes. The possible reasons are as follows: (1) the presence of Co3O4@C composite refined the crystal grains, thereby increasing its contact surface area; (2) the existence of carbon not only increased the electrical conductivity but prevented the internal metal oxide from contacting the outside, consequently providing a stable electrochemical reaction interface; (3) the intrinsic OER electrocatalytic performance of the Co2+/Co3+ redox couple generated more active sites to promote the OER and (4) the Co3O4@C composite significantly expanded the active surface area, reduced the Rct value and promoted rapid electron transfer. The combined effects of these four aspects promoted enhanced OER electrocatalytic activity.
The potential of Co3O4@C in the suspension was measured with a zeta potential analyzer (90Plus Zeta, Brookhaven Instruments Corporation), and the sedimentation time of Co3O4@C in the suspension was recorded with photographs to figure out the nature of the Co3O4@C suspension. The zeta potential values of Co3O4@C measured in Fig. S10† were all negative, indicating that the Co3O4@C particles were negatively charged in this plating system and the electric field force caused Co3O4@C to co-deposit with PbO2 at the anode. In Fig. S11,† when the time reached 90 min, the vast majority of Co3O4@C particles had settled at the bottom of the bottle. Whereas the suspension was constantly being stirred during the electrodeposition process, so the original dispersion state of the suspension could always be maintained. As is vividly depicted in Fig. S12,† the negatively charged Co3O4@C particles migrated to the anode because of stirring and the electric field forces and were then embedded in the β-PbO2 deposit.
3.3 The zinc electrowinning simulation experiment
In order to evaluate the OER stability, service life tests of the three electrodes were performed at a current density of 500 A m−2 for 50000 s in a zinc electrodeposition simulation solution (0.3 M ZnSO4 and 1.53 M H2SO4) and the corresponding galvanostatic polarization curves are recorded in Fig. 6a. When the electrowinning reached a steady-state, the order of the average potential from large to small is 1.925, 1.907, 1.516 V, in accordance with the Pb–0.76%Ag alloy, Pb–0.6%Sb/α-PbO2/β-PbO2, and Pb–0.6%Sb/α-PbO2/β-PbO2-Co3O4@C electrodes, respectively. Apparently, the Co3O4@C-reinforced PbO2-coated electrode (4 g L−1) had strong stability and the lowest steady-state potential, leading to enhanced OER activity. However, the stability of the PbO2 electrode prepared in this work still needed to improve. The improvement methods that have been reported in the literature to enhance the stability of the electrode could be learned from. For instance, TiO2 nanotubes/network as an interlayer and gas electrodes made of carbon black (CB) supported on a titanium grid and combined with polytetrafluoroethylene (PTFE) have shown good stability in the field of electrochemistry.52–54
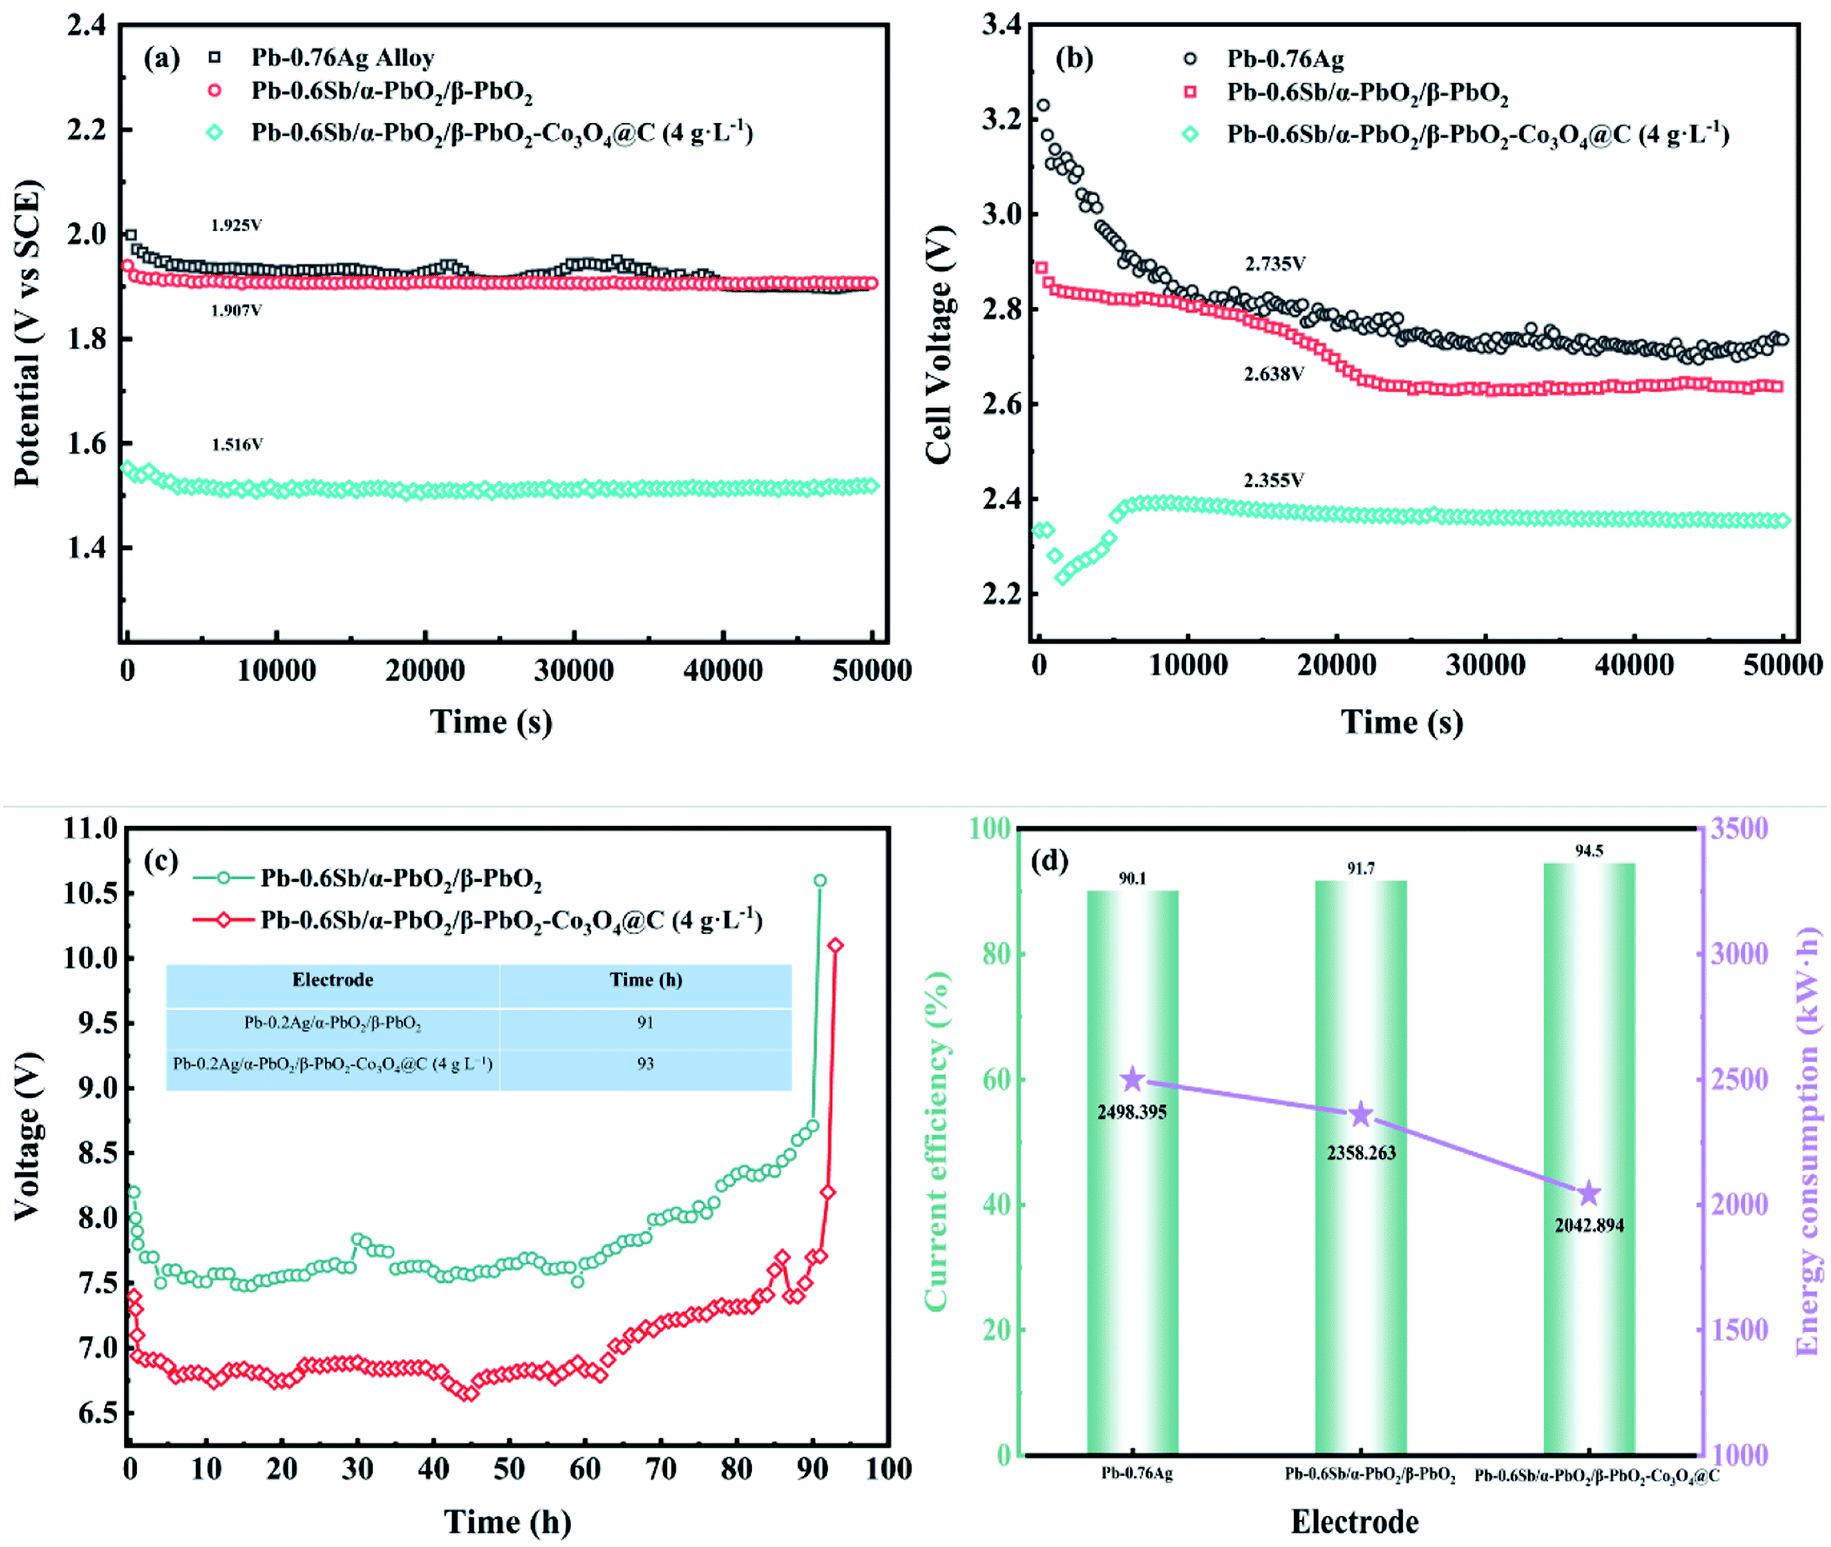 | ||
| Fig. 6 (a) Galvanostatic polarization curves, (b) cell voltage, (c) service life, and (d) current efficiency and tonne of zinc electricity consumption of different electrodes in the zinc electrowinning simulation experiment. | ||
The cell voltage of the zinc electrowinning process was the leading cause of excessive energy consumption, which consisted of the following five main components:
| Uc = IR1 + IR2 + IR3 + IR4 + IR5 | (7) |
The cell voltages of the three electrodes over 50000 s are illustrated in Fig. 6b. In the early stage of electrowinning, the Co3O4@C-reinforced PbO2-coated electrode gradually stabilized after 5000 s; however, the other two electrodes tended to stabilize after 20000 s, which showed the remarkable stability of the Co3O4@C reinforced PbO2-coated electrode and was consistent with the results of galvanostatic polarization measurement. As plotted in Fig. 6b, the cell voltage of the Co3O4@C-reinforced PbO2-coated electrode (4 g L−1) is a minimum of 2.355 V, which is 380 mV lower than the Pb–0.76%Ag alloy, showing an outstanding energy-saving effect. Furthermore, the lower cell voltage value for Pb–0.76%Ag compared to industrial applications was mainly because the laboratory's zinc electrowinning simulation solution was configured using deionized water, which had few impurity ions in the solution.
Fig. 6c displays the service life of the electrode with and without reinforcement at an ultra-high current density of 20000 A m−2. As shown in this figure, the Co3O4@C-reinforced PbO2-coated electrode (4 g L−1) can serve 93 hours in a strongly acidic electrolyte (1.53 M H2SO4), demonstrating excellent corrosion resistance. As two essential economic indicators in the zinc electrowinning simulation experiment, the calculated current efficiency and tonne of zinc electricity consumption values are drawn in Fig. 6d. The current efficiency (η) is the proportion of actual Zn deposition to theoretical Zn deposition and was calculated according to eqn (8) (m represents the actual amount of Zn deposited during time t (g), I is the current (A), t refers to the deposition time (h), n stands for the quantity of electrolytic tanks, and q denotes the electrochemical equivalent of Zn (1.22 g A−1 h−1)). Calculations suggested that the Co3O4@C-reinforced PbO2-coated electrode had the highest current efficiency of 94.5%. The slightly lower current efficiency of the Pb–0.76%Ag alloy may be due to the gradual oxidation of the surface to produce PbO2 oxide film, which consumed some of the current. The tonne of zinc electricity consumption (W) of the three composite electrodes was calculated from eqn (9) (v represents the cell voltage, η represents the current efficiency). The tonne of zinc electricity consumption of the Co3O4@C-reinforced PbO2-coated electrode (4 g L−1) was reduced by 315.369 kW h compared with the Pb–0.6%Sb/α-PbO2/β-PbO2 coated electrode and by 455.501 kW h compared with the Pb–0.76%Ag alloy, indicating a prominent energy-saving effect in the zinc electrowinning process.
| η = m/(qItn) × 100% | (8) |
| W = 819.76v/η | (9) |
4. Conclusion
To sum up, a layered Co3O4@C-reinforced PbO2-coated electrode was synthesized by a simple two-step pyrolysis-oxidation and following electrodeposition process on a Pb–0.6%Sb substrate. The prepared Co3O4@C-reinforced PbO2-coated electrode showed a minimum overpotential of 517 mV at 500 A m−2 and a Tafel slope of 0.152 V dec−1 at an optimum Co3O4@C concentration of 4 g L−1. It also exhibited a low Rct value of 2.18 Ω and a satisfactory Cdl value of 24.36 mF cm−2, resulting in a boost in OER activity. In the zinc electrowinning simulation experiment, the Co3O4@C-reinforced PbO2-coated electrode (4 g L−1) showed the most excellent stability and various zinc electrowinning parameters compared to the other two unreinforced electrodes. Moreover, the Co3O4@C-reinforced PbO2-coated electrode (4 g L−1) possessed a service life of up to 93 hours under high current density and high acidity of 20000 A m−2 and 1.53 M H2SO4.
Author contributions
Wenhao Jiang: data processing and analysis, experimental operation, manuscript writing and revising. Junli Wang, Xuanbing Wang: materials characterization, data analysis, manuscript reviewing. Xuanbing Wuan, Jiang Liao: data analysis, discussing the research idea, manuscript reviewing. Jinlong Wei: data analysis, manuscript reviewing. Ruidong Xu, Linjing Yang: discussing the research idea, manuscript reviewing and editing.Conflicts of interest
There are no conflicts to declare.Acknowledgements
The authors express our sincere gratitude for the financial assistance of the National Natural Science Foundation of China (Grant no. 51874154).References
- L. Jin, H. Huang, Y. Fei, H.-t. Yang, H.-y. Zhang and Z.-c. Guo, Hydrometallurgy, 2018, 176, 201–207 CrossRef CAS.
- H.-h. Li, T.-c. Yuan, R.-d. Li, W.-j. Wang, D. Zheng and J.-w. Yuan, Trans. Nonferrous Met. Soc. China, 2019, 29, 2422–2429 CrossRef CAS.
- B. Shen, Y. He, W. Li, Z. Wang, L. Yu, Y. Jiang, X. Liu, J. Kang, H. Gao and N. Lin, Mater. Des., 2020, 191, 108645 CrossRef CAS.
- S. He, R. Xu, L. Sun, Y. Fan, Z. Zhao, H. Liu and H. Lv, Hydrometallurgy, 2020, 194, 105357 CrossRef CAS.
- A. J. Bloomfield, S. W. Sheehan, S. L. Collom and P. T. Anastas, ACS Sustainable Chem. Eng., 2015, 3, 1234–1240 CrossRef CAS.
- G. Hu, R.-d. Xu, S.-w. He, B.-m. Chen, H.-t. Yang, B.-h. Yu and Q. Liu, Trans. Nonferrous Met. Soc. China, 2015, 25, 2095–2102 CrossRef CAS.
- H. You, Z. Chen, Q. Yu, W. Zhu, B. Chen, Z. Lv, Q. Hu, Y. Liu, Z. Zheng, S. Li and F. Yeasmin, Sep. Purif. Technol., 2021, 276, 119406 CrossRef CAS.
- Z. M. Alimirzaeva, A. B. Isaev, N. S. Shabanov, A. G. Magomedova, M. V. Kadiev and K. Kaviyarasu, Mater. Today: Proc., 2021, 36, 325–327 CAS.
- A. M. Ali, S. A. M. Issa, M. R. Ahmed, Y. B. Saddeek, M. H. M. Zaid, M. Sayed, H. H. Somaily, H. O. Tekin, H. A. A. Sidek, K. A. Matori and H. M. H. Zakaly, J. Mater. Res. Technol., 2020, 9, 13956–13962 CrossRef CAS.
- A. Ansari and D. Nematollahi, Water Res., 2018, 144, 462–473 CrossRef CAS PubMed.
- X. Qian, K. Peng, L. Xu, S. Tang, W. Wang, M. Zhang and J. Niu, Chem. Eng. J., 2022, 429, 132309 CrossRef CAS.
- Y. Wang, M. Chen, C. Wang, X. Meng, W. Zhang, Z. Chen and J. Crittenden, Chem. Eng. J., 2019, 374, 626–636 CrossRef CAS.
- Y. Qiu, J. A. Lopez-Ruiz, U. Sanyal, E. Andrews, O. Y. Gutiérrez and J. D. Holladay, Appl. Catal., B, 2020, 277, 119277 CrossRef CAS.
- W. J. de Santana Mota, G. de Oliveira Santiago Santos, A. Resende Dória, M. Rubens dos Reis Souza, L. C. Krause, G. R. Salazar-Banda, K. I. Barrios Eguiluz, J. A. López and M. L. Hernández-Macedo, Chemosphere, 2021, 279, 130875 CrossRef CAS PubMed.
- C. Chen, R. Xu, X. Wang, W. Jiang, S. Feng and A. Ju, Ceram. Int., 2021, 47, 25350–25362 CrossRef CAS.
- Z. Xiangyang, W. Shuai, M. Chiyuan, L. Bo, W. Hui, Y. Juan, G. Zhongcheng and C. Buming, Rare Met. Mater. Eng., 2018, 47, 1999–2004 CrossRef.
- B. Monahov, D. Pavlov and D. Petrov, J. Power Sources, 2000, 85, 59–62 CrossRef CAS.
- C. Liao, B. Yang, N. Zhang, M. Liu, G. Chen, X. Jiang, G. Chen, J. Yang, X. Liu, T.-S. Chan, Y.-J. Lu, R. Ma and W. Zhou, Adv. Funct. Mater., 2019, 29, 1904020 CrossRef.
- C. Liao, Z. Xiao, N. Zhang, B. Liang, G. Chen, W. Wu, J. Pan, M. Liu, X.-R. Zheng, Q. Kang, X. Cao, X. Liu and R. Ma, Chem. Commun., 2021, 57, 9060–9063 RSC.
- O. Shmychkova, T. Luk'yanenko, R. Amadelli and A. Velichenko, J. Electroanal. Chem., 2014, 717–718, 196–201 CrossRef CAS.
- O. Kosohin, O. Makohoniuk and A. Kushmyruk, Mater. Today: Proc., 2019, 6, 219–226 CAS.
- H. Mo, Y. Tang, N. Wang, M. Zhang, H. Cheng, Y. Chen, P. Wan, Y. Sun, S. Liu and L. Wang, J. Solid State Electrochem., 2016, 20, 2179–2189 CrossRef CAS.
- C.-b. Tang, Y.-x. Lu, F. Wang, H. Niu, L.-h. Yu and J.-q. Xue, Electrochim. Acta, 2020, 331, 135381 CrossRef CAS.
- H.-t. Yang, B.-m. Chen, Z.-c. Guo, H.-r. Liu, Y.-c. Zhang, H. Huang, R.-d. Xu and R.-c. Fu, Trans. Nonferrous Met. Soc. China, 2014, 24, 3394–3404 CrossRef CAS.
- X. Duan, F. Ma, Z. Yuan, L. Chang and X. Jin, J. Electroanal. Chem., 2012, 677–680, 90–100 CrossRef CAS.
- B. Yang, N. Zhang, G. Chen, K. Liu, J. Yang, A. Pan, M. Liu, X. Liu, R. Ma and T. Qiu, Appl. Catal., B, 2020, 260, 118184 CrossRef CAS.
- Y. Wang, B. Yu, K. Liu, X. Yang, M. Liu, T.-S. Chan, X. Qiu, J. Li and W. Li, J. Mater. Chem. A, 2020, 8, 2131–2139 RSC.
- G. Zhang, J. Yang, H. Wang, H. Chen, J. Yang and F. Pan, ACS Appl. Mater. Interfaces, 2017, 9, 16159–16167 CrossRef CAS PubMed.
- Z. Wang, W. Xu, X. Chen, Y. Peng, Y. Song, C. Lv, H. Liu, J. Sun, D. Yuan, X. Li, X. Guo, D. Yang and L. Zhang, Adv. Funct. Mater., 2019, 29, 1902875 CrossRef.
- M. Zhang, J. Shi, Y. Sun, W. Ning and Z. Hou, Catal. Commun., 2015, 70, 72–76 CrossRef CAS.
- B. Sun, S. Lou, W. Zheng, Z. Qian, C. Cui, P. Zuo, C. Du, J. Xie, J. Wang and G. Yin, Nano Energy, 2020, 78, 105366 CrossRef CAS.
- C. Zhang, J. Liu, Y. Ye, Z. Aslam, R. Brydson and C. Liang, ACS Appl. Mater. Interfaces, 2018, 10, 2423–2429 CrossRef CAS PubMed.
- Y. Yao, T. Zhou, C. Zhao, Q. Jing and Y. Wang, Electrochim. Acta, 2013, 99, 225–229 CrossRef CAS.
- A. B. Velichenko, R. Amadelli, E. V. Gruzdeva, T. V. Luk'yanenko and F. I. Danilov, J. Power Sources, 2009, 191, 103–110 CrossRef CAS.
- R. Barik, A. Raulo, S. Jha, B. Nandan and P. P. Ingole, ACS Appl. Energy Mater., 2020, 3, 11002–11014 CrossRef CAS.
- L. Yang, W. Zhou, J. Lu, D. Hou, Y. Ke, G. Li, Z. Tang, X. Kang and S. Chen, Nano Energy, 2016, 22, 490–498 CrossRef CAS.
- A. Al Nafiey, A. Addad, B. Sieber, G. Chastanet, A. Barras, S. Szunerits and R. Boukherroub, Chem. Eng. J., 2017, 322, 375–384 CrossRef CAS.
- L. Ma, H. Zhou, X. Shen, Q. Chen, G. Zhu and Z. Ji, RSC Adv., 2014, 4, 53180–53187 RSC.
- D. He, X. Song, W. Li, C. Tang, J. Liu, Z. Ke, C. Jiang and X. Xiao, Angew. Chem., Int. Ed., 2020, 59, 6929–6935 CrossRef CAS PubMed.
- X. Li, S. You, J. Du, Y. Dai, H. Chen, Z. Cai, N. Ren and J. Zou, J. Mater. Chem. A, 2019, 7, 25853–25864 RSC.
- K. Kumar, C. Canaff, J. Rousseau, S. Arrii-Clacens, T. W. Napporn, A. Habrioux and K. B. Kokoh, J. Phys. Chem. C, 2016, 120, 7949–7958 CrossRef CAS.
- R. Li, Y. Huang, D. Zhu, W. Ho, J. Cao and S. Lee, Environ. Sci. Technol., 2021, 55, 4054–4063 CrossRef CAS PubMed.
- J. Xiao, C. Chen, J. Xi, Y. Xu, F. Xiao, S. Wang and S. Yang, Nanoscale, 2015, 7, 7056–7064 CAS.
- G. Darabizad, M. S. Rahmanifar, M. F. Mousavi and A. Pendashteh, Mater. Chem. Phys., 2015, 156, 121–128 CrossRef CAS.
- U. Holzwarth and N. Gibson, Nat. Nanotechnol., 2011, 6, 534 CrossRef CAS PubMed.
- X. Duan, F. Xu, Y. Wang, Y. Chen and L. Chang, Electrochim. Acta, 2018, 282, 662–671 CrossRef CAS.
- H. Liu, A. M. Kuznetsov, A. N. Masliy, J. F. Ferguson and G. V. Korshin, Environ. Sci. Technol., 2012, 46, 1430–1438 CrossRef CAS PubMed.
- Y. Lai, Y. Li, L. Jiang, W. Xu, X. Lv, J. Li and Y. Liu, J. Electroanal. Chem., 2012, 671, 16–23 CrossRef CAS.
- J. Aromaa and O. Forsén, Electrochim. Acta, 2006, 51, 6104–6110 CrossRef CAS.
- F. Shen and K. Lu, ACS Appl. Mater. Interfaces, 2017, 9, 6022–6029 CrossRef CAS PubMed.
- B. Hirschorn, M. E. Orazem, B. Tribollet, V. Vivier, I. Frateur and M. Musiani, Electrochim. Acta, 2010, 55, 6218–6227 CrossRef CAS.
- L. Xu, Y. Wang and W. Zhang, RSC Adv., 2019, 9, 39242–39251 RSC.
- L. Xu, Y. Yi, G. Liang and W. Zhang, Electroanalysis, 2020, 32, 1370–1378 CrossRef CAS.
- Z. Zhao, L. Liu, L. Min, W. Zhang and Y. Wang, Materials, 2021, 14, 2841 CrossRef CAS PubMed.
Footnote |
| † Electronic supplementary information (ESI) available. See DOI: 10.1039/d1ra09100j |
| This journal is © The Royal Society of Chemistry 2022 |