
 Open Access Article
 This Open Access Article is licensed under a Creative Commons Attribution-Non Commercial 3.0 Unported Licence
Integration detection of mercury(II) and GSH with a fluorescent “on-off-on” switch sensor based on nitrogen, sulfur co-doped carbon dots†
Haiyan Qi *a,
Xiaona Suna,
Tao Jinga,
Jinlong Lib and
Jun Lic
*a,
Xiaona Suna,
Tao Jinga,
Jinlong Lib and
Jun Lic
aCollege of Chemistry and Chemical Engineering, Qiqihar University, No. 42, Wenhua Street, Qiqihar, 161006, P. R. China. E-mail: qhy120@sina.com; Tel: +86-452-2738214
bKey Laboratory of Fine Chemicals of College of Heilongjiang Province, Qiqihar University, No. 42, Wenhua Street, Qiqihar, 161006, P. R. China
cHeilongjiang Industrial Hemp Processing Technology Innovation Center, Qiqihar University, No. 42, Wenhua Street, Qiqihar, 161006, P. R. China
First published on 12th January 2022
Abstract
Using aurine and citric acid as precursors, we have synthesized stable blue-fluorescent nitrogen and sulfur co-doped carbon dots (NS-CDs), with a high quantum yield of up to 68.94% via a thermal lysis method. The fluorescent NS-CDs were employed as a sensitive sensor for the integration detection of Hg2+ and glutathione (GSH). This was attributed to Hg2+ effectively quenching the fluorescence of the NS-CDs by static quenching, and then GSH was able to recover the fluorescence owing to the stronger binding between Hg2+ and the sulfhydryl of GSH. Based on the “on-off-on” tactic, the detection limits of Hg2+ ions and GSH were 50 nM and 67 nM respectively. The fluorescence sensor was successfully applied to detect Hg2+ ions and GSH in actual samples (tap water and fetal bovine serum). Furthermore, we have proved that the sensor had good reversibility. Overall, our NS-CDs can serve as effective sensors for environmental and biological analysis in the future.
1. Introduction
As an important zero-dimensional carbon-based nanometer material, carbon dots (CDs) have been studied since 2004 (ref. 1–4) and widely used in biological analysis,5,6 sensing,7–9 catalysis,10,11 bioimaging12 and photothermal therapy13–15 and bio-medicine.16 They have various properties, including stable fluorescence photoluminescence,17,18 low toxicity,19 excellent biocompatibility,20 good water solubility21,22 and low-cost synthesis.23However, the applications of CDs are limited by their low quantum yield (QY) in conventional carbon sources. To increase QY, a hetero atom doping method has been utilized, in which nitrogen (N) and sulfur (S) are the commonest doped elements used to improve the fluorescence performance of CDs and provide targeting properties for special functional groups.24,25
In recent years, heavy metals have been considered as hazardous chemicals in the environment. Hg2+ ions, as one of the most stable inorganic forms of mercury, are known to be highly toxic because of their easy bioaccumulation and inactive sulfhydryl group. Glutathione (GSH) is one of the most ubiquitous low-molecular-weight (LMW) thiol in living cells26,27 and can cause various physiological dysregulations with an anomalous concentration. Therefore, GSH28 has been commonly used as a diagnostic biomarker for multiple diseases. Especially, it is very important to monitor the level of GSH in living cells considering the high GSH concentration in cancer cells.29,30
To monitor Hg2+ ions31,32 and GSH,33,34 numerous analytical methods have been developed, including AAS,35 electrochemical,36 electrophoresis,37 HPLC,38 mass spectrometry,39 and etc.40 However, most of them are laborious, intricate, and in need of professional operating and expensive instruments. Fluorescence probes providing a better choice of Hg2+ ions and GSH detection in living cells, tissues, even animals due to the exclusive advantages of high sensitivity,41,42 simple controls, convenient testing/monitoring and quick response, etc. However, most of the conventional fluorescent probes such as small organic fluorescent molecule, and semiconductor quantum dots are relatively toxic and poorly water-soluble, and greatly limit the detection of Hg2+ ions and GSH in bioassay. Accordingly, CDs as a novel fluorescent probe with excellent biocompatibility has attracted increasing attention.
In this study, we have successfully prepared CDs with citric acid and taurine, with its QY up to 68.94%. With the addition of Hg2+ ions, the fluorescence of NS-CDs can be quenched efficiently, and the fluorescence was recovered while GSH was added. Moreover, NS-CDs have been tested in actual sample (tap water and fetal bovine serum) to detect Hg2+ ions and GSH, showing their good selectivity and sensitivity.
2. Results and discussion
2.1. Characterization of NS-CDs
As shown in Fig. 1a, NS-CDs are well dispersed and have nearly spherical shape. The particle sizes of NS-CDs are mainly distributed in a narrow range from 1.2 nm to 2.8 nm, with an average particle diameter of 1.7 nm (Fig. 1b). The XRD pattern result indicates a broad peak at 2θ = 23°, suggesting its attribution to the amorphous structure. Then, we have examined the surface groups on the NS-CDs. The FTIR results shows several strong absorption peaks at 2500–3440 cm−1, 1710 cm−1 and 1210 cm−1, 1349 cm−1, 1410 cm−1, 1052 cm−1, and 741 cm−1, which are attributed to O–H groups, C![[double bond, length as m-dash]](https://www.rsc.org/images/entities/char_e001.gif) O and C–O, SO bonds, C–N bond, OSO bonds, and NH bonds, respectively (Fig. 1d). Overall, this suggests NS-CDs have high solubility in water because of their carboxyl, hydroxyl, and amino functional groups on surface.
O and C–O, SO bonds, C–N bond, OSO bonds, and NH bonds, respectively (Fig. 1d). Overall, this suggests NS-CDs have high solubility in water because of their carboxyl, hydroxyl, and amino functional groups on surface.
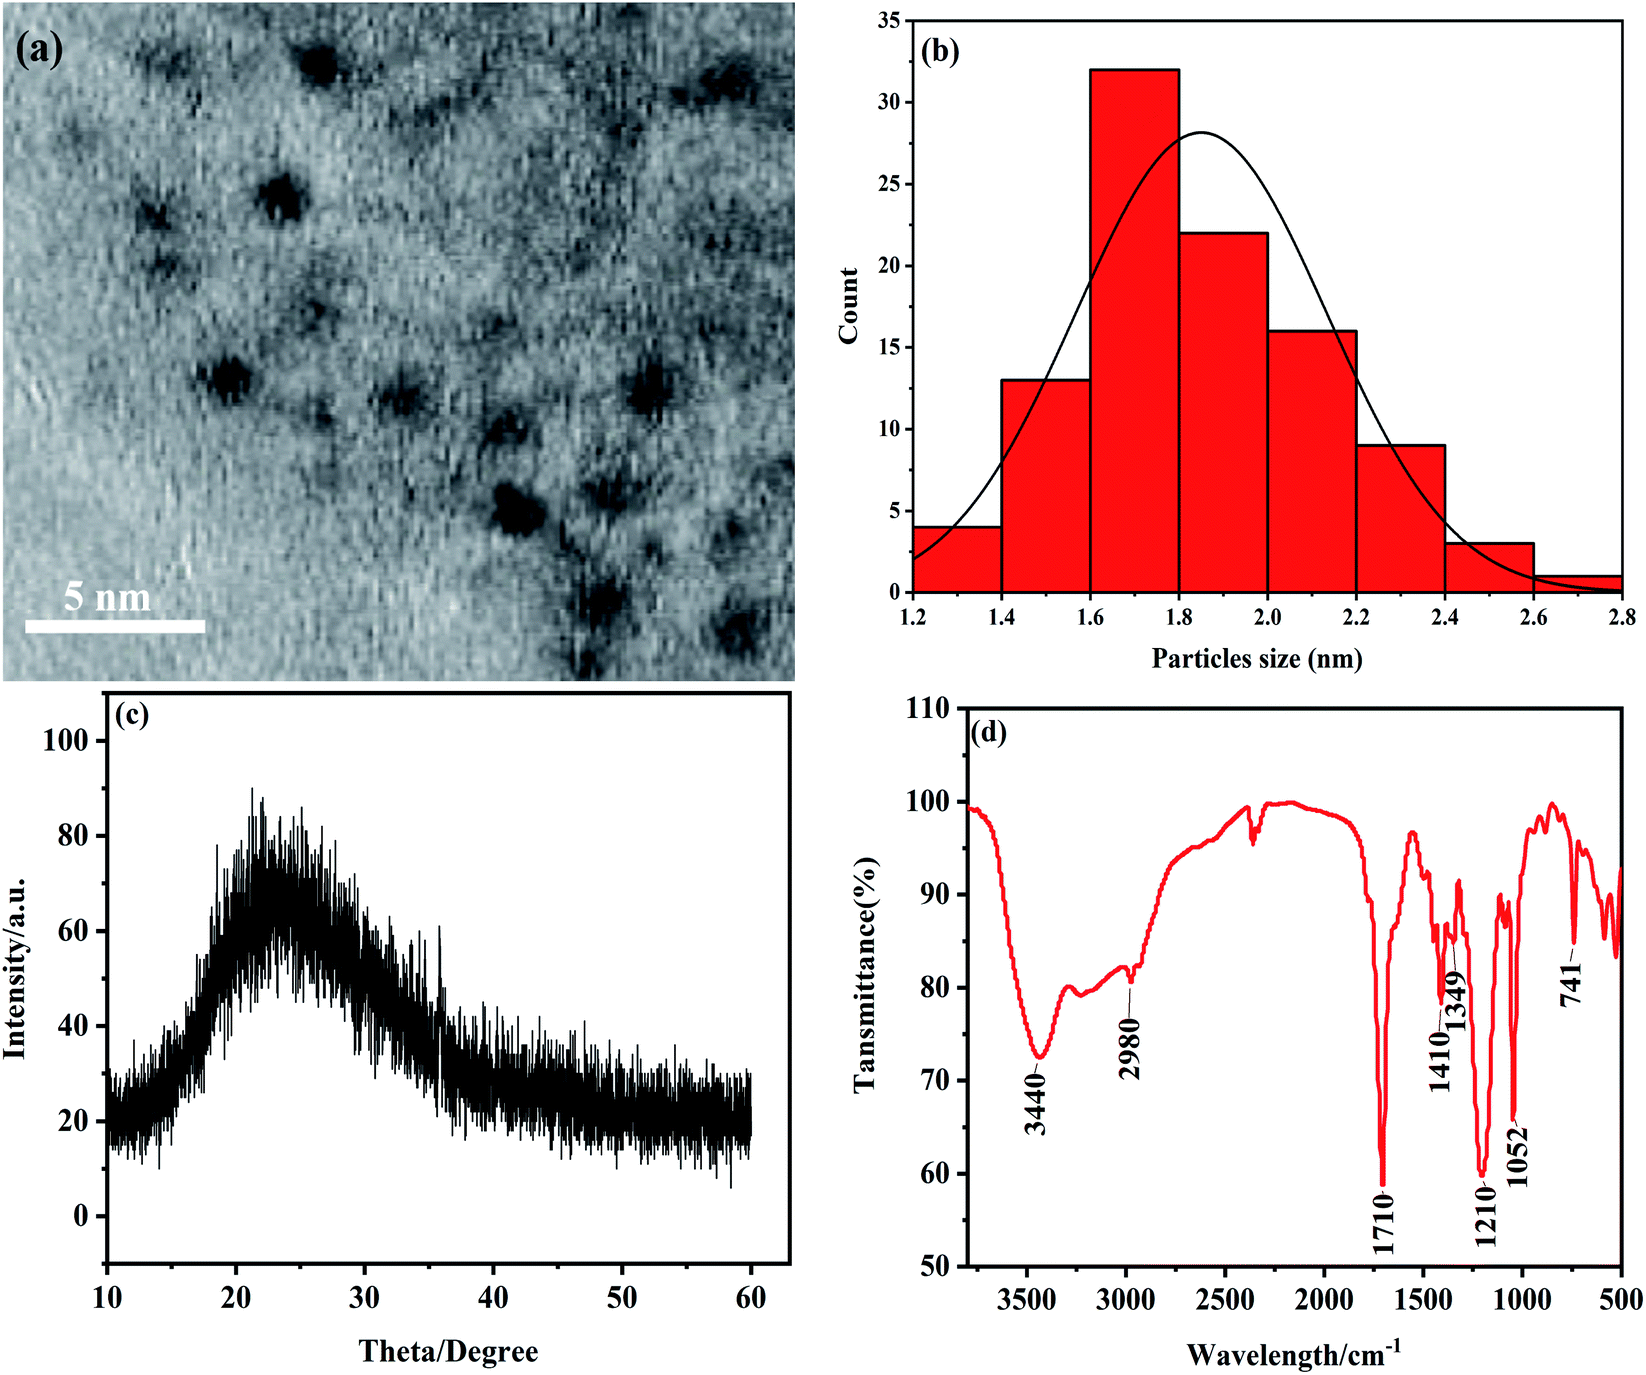 | ||
| Fig. 1 (a) TEM of the NS-CDs. (b) Histograms showing the particle size distributions of NS-CDs. (c) XRD pattern of the NS-CDs. (d) FTIR spectrum of NS-CDs. | ||
To further analyze the composed elements of NS-CDs, we have performed XPS analysis, and the full XPS survey spectrum shows the elementary analysis of sulfur (S2p, 169.08 eV), carbon (C1s, 286.08 eV), nitrogen (N1s, 401.08 eV), and oxygen (O1s, 532.08 eV) (Fig. 2a). This indicated NS-CDs includes four elements, C, O, N, and S, with a content of 47.7 wt%, 32.03 wt%, 8.6 wt% and 8.06 wt%, respectively. To reveal the detailed bonds, we have conducts XPS spectrum experiments for each element. C1s spectrum displays four distinct peaks at 288.28 eV (CO), 286.58 eV (C–S), 285.78 eV (C–O/C–C) and 284.78 eV (C–N) (Fig. 2b). O1s spectrum reveals three O forms, SO (533.68 eV), C–O (533.18 eV) and CO (531.68 eV) (Fig. 2c). N1s spectrum shows a peak at 400.40 eV, which is produced by N–H group (Fig. 2d). S2p spectrum reveals three peaks at 168.78 eV, 167.68 eV and 167.08 eV, which are attributed to OSO group, C–S group and SO group, respectively (Fig. 2e). Hence, we concluded that N and S elements are on the surface of NS-CDs, which is consistent with our FTIR measurements data (Fig. 1d). Both XPS spectra and FTIR spectra suggests the hydrophilicity and stability of NS-CDs due to their functional hydroxyl, amide, amino, and carboxyl/carbonyl groups.
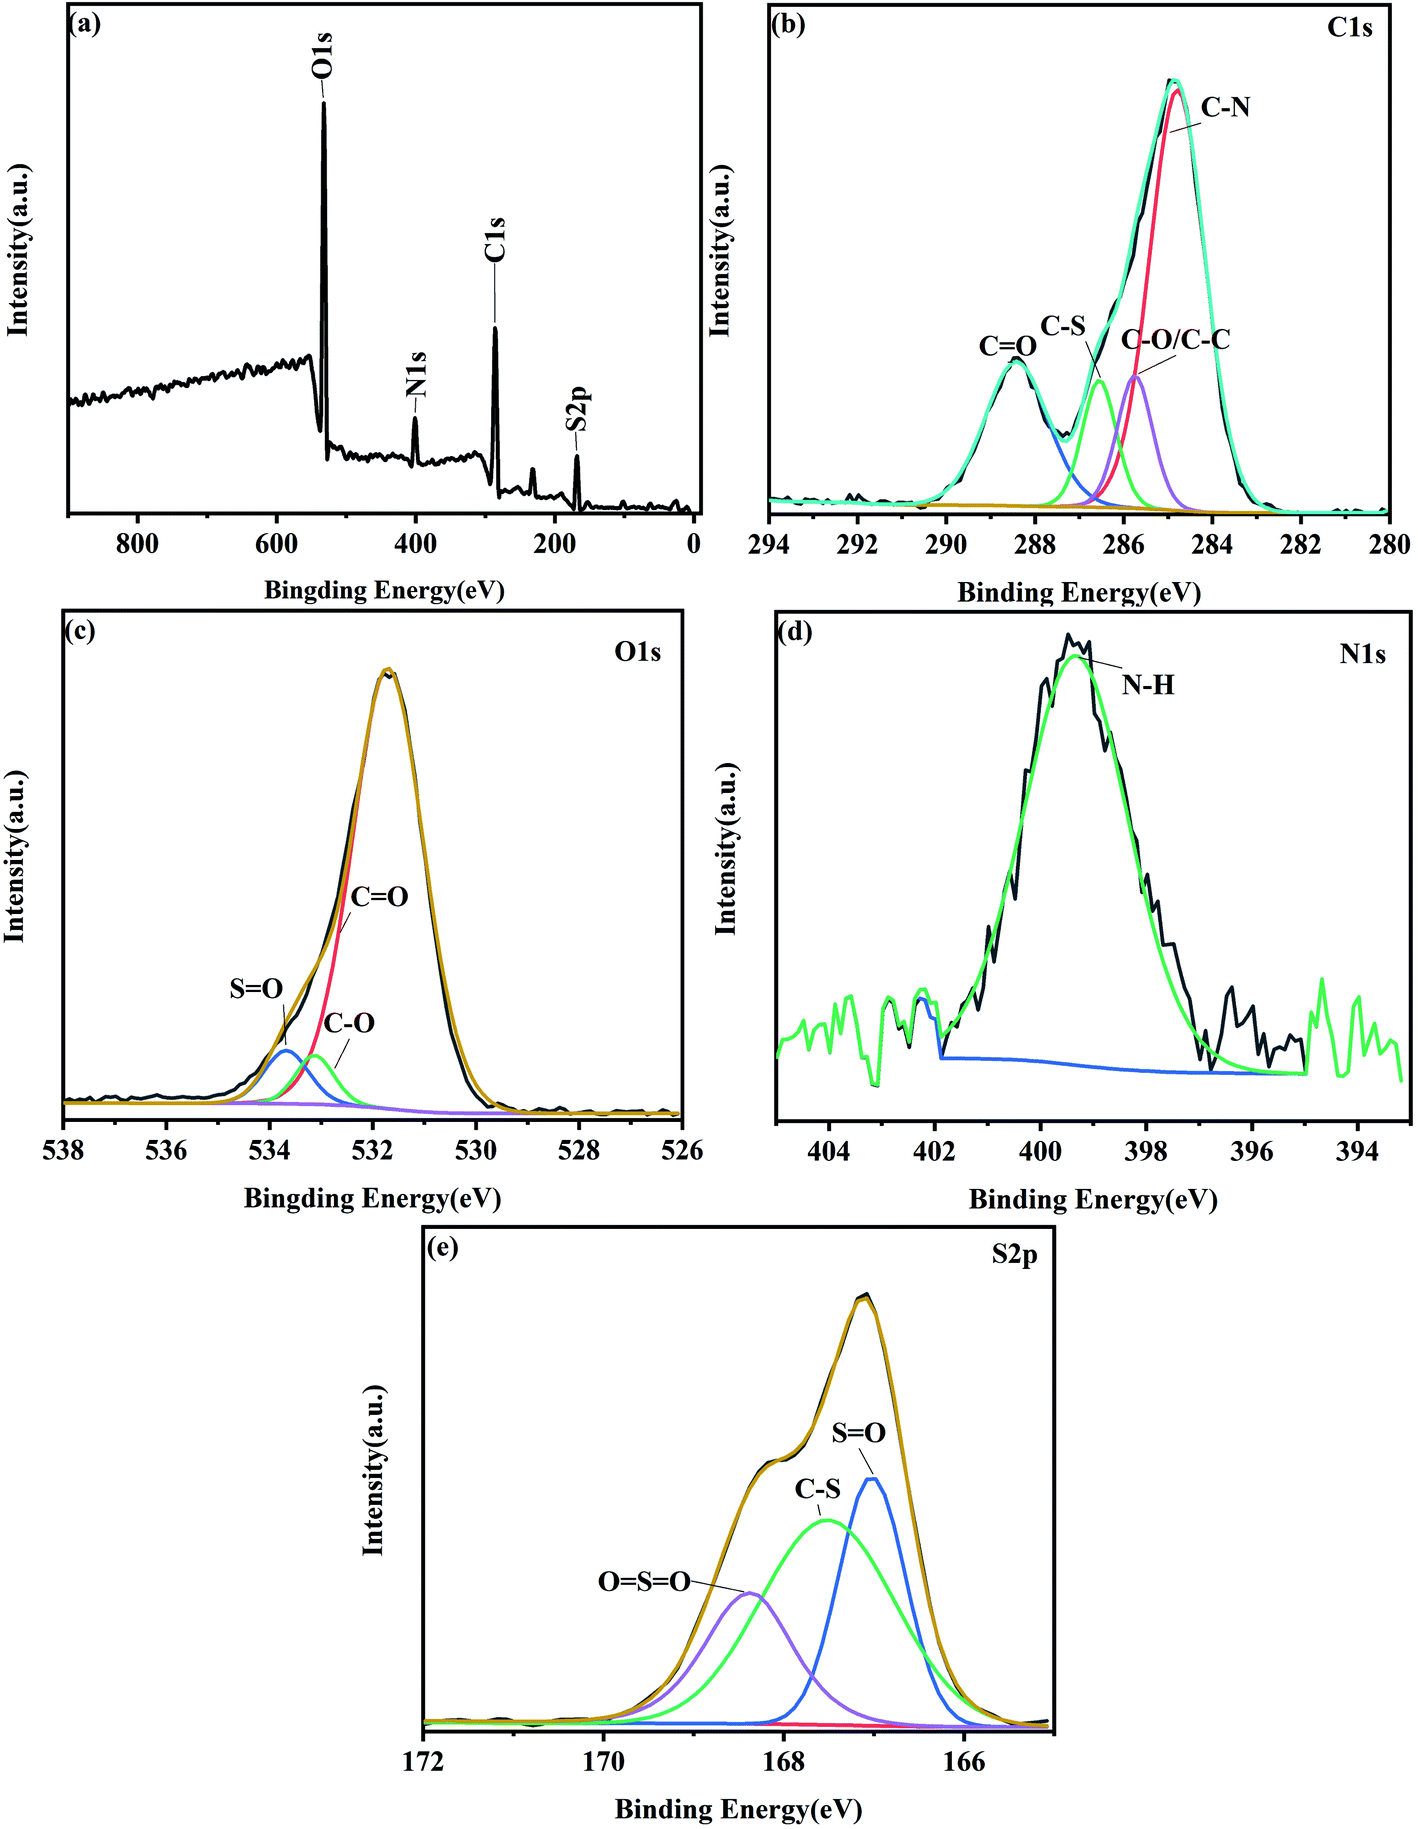 | ||
| Fig. 2 (a) XPS survey of the NS-CDs. (b) XPS spectrum of C1s. (c) XPS spectrum of O1s. (d) XPS spectrum of N1s. (e) XPS spectrum of S2p. | ||
2.2. Optical properties of NS-CDs
Next, we determined the optical properties of NS-CDs. NS-CDs display an absorption peak at 332 nm because of the absorption of connected carbonyl/amine group43 with its maximum excitation wavelength and emission at 345 nm and 443 nm, respectively (Fig. 3a). The aqueous solution of NS-CDs displays colorless under sunlight but emits blue fluorescence while under UV lamp (Fig. 3a inset). The CIE color coordinate of NS-CDs is (0.1545, 0.1551), further indicating NS-CDs show blue fluorescence with UV radiation (Fig. 3c). With the excitation wavelength of NS-CDs ranging from 325 nm to 385 nm, their emission peak shifts from 439 nm to 446 nm, showing redshift (Fig. 3b). This suggests that N and S doping elements contribute to a surface condition and uniform size distribution of NS-CDs.44 2D-emission plots show that a photoluminescence center could be observed at the emission wavelength of 443 nm and excitation wavelength of 345 nm (Fig. 3d). In addition, the fluorescence QY of NS-CDs was calculated to be 68.94%.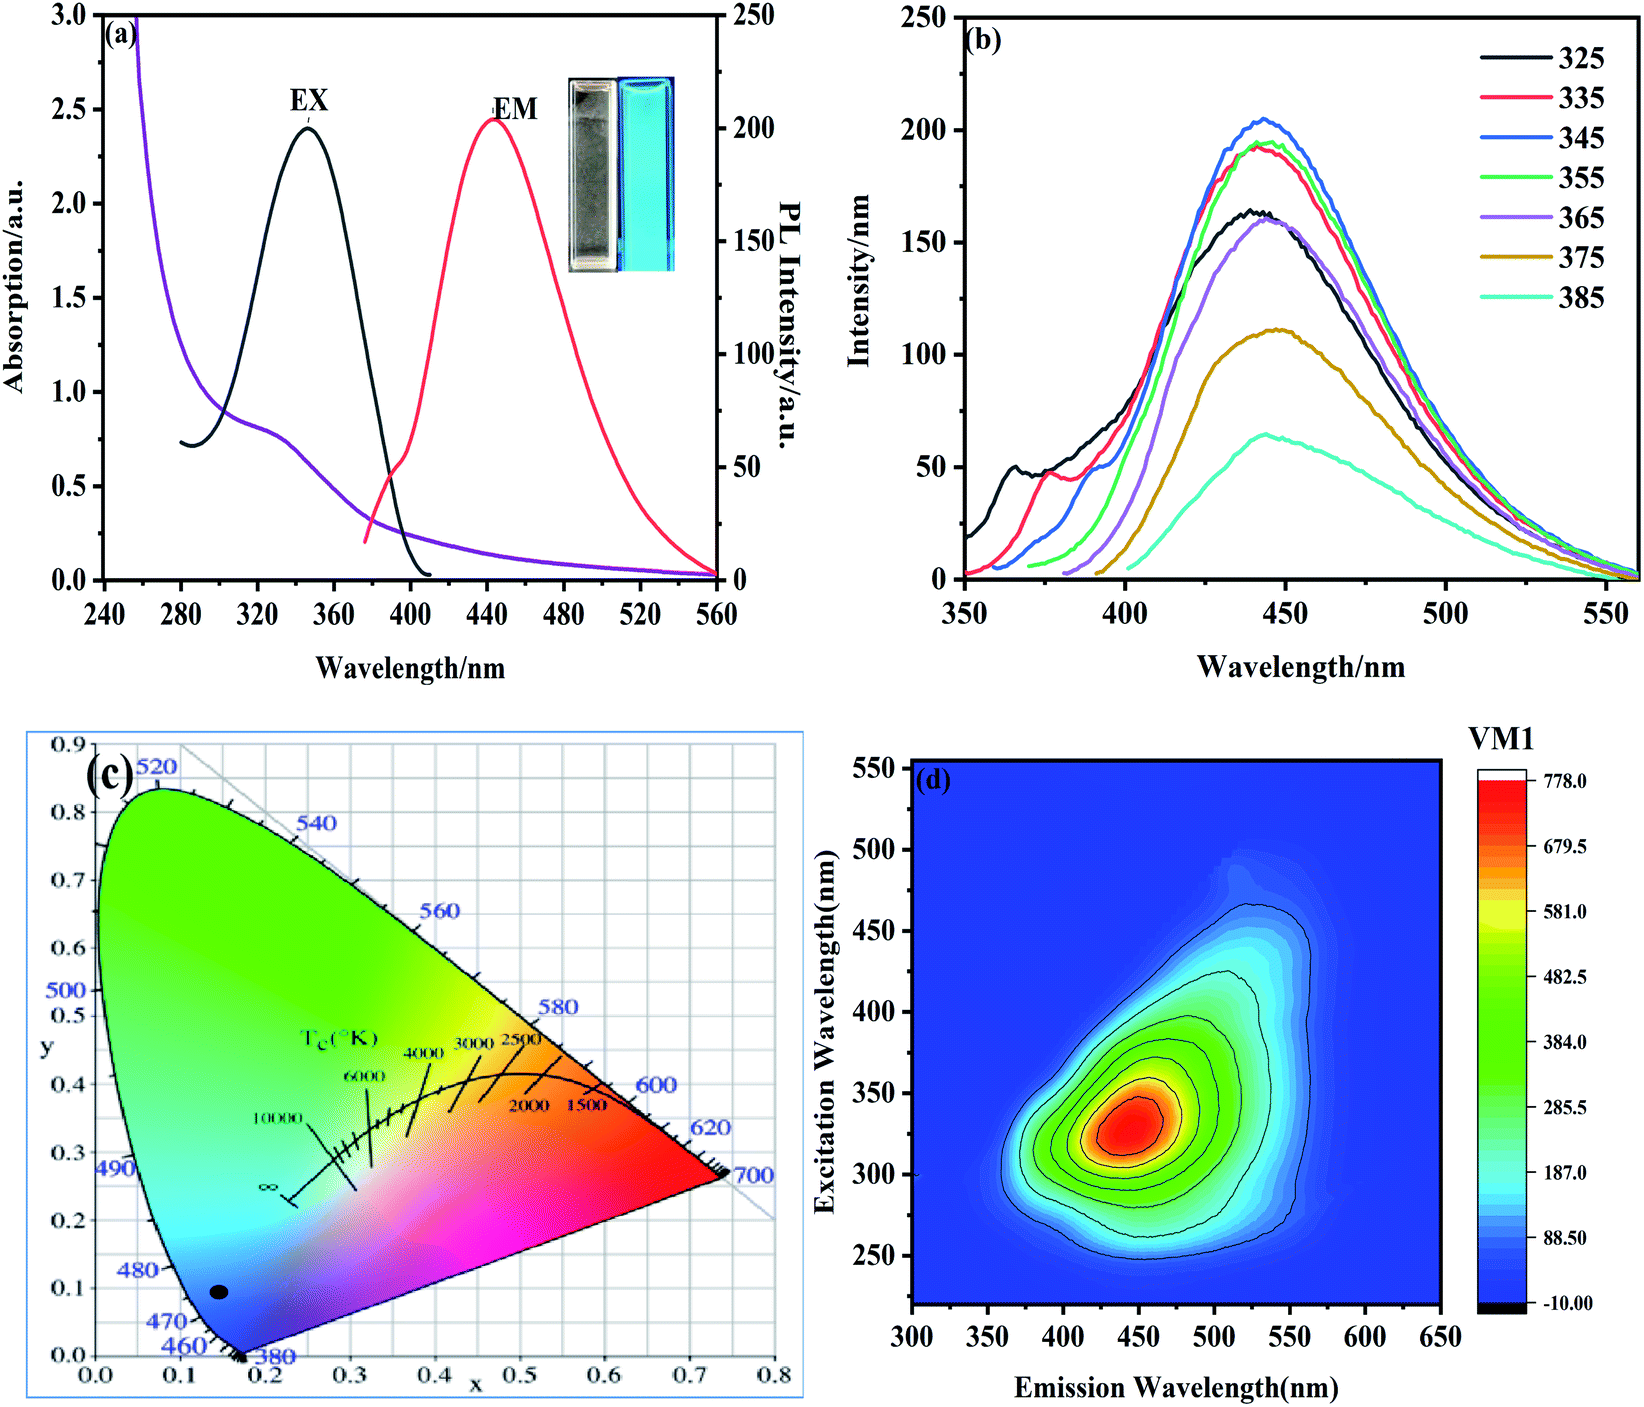 | ||
| Fig. 3 (a) UV-vis absorption spectrum, the excitation of the NS-CD, the emission of the NS-CDs. Inset: photographs of the NS-CDs under white light (left) and UV light at 365 nm (right). (b) Fluorescence spectra of NS-CDs under different excitation wavelengths. (c) CIE diagram of NS-CDs. (d) Excitation-emission map of NS-CDs. | ||
Furthermore, ionic strength, illumination, and pH value were examined to assess the fluorescence stability of NS-CDs. With increasing the concentration of sodium chloride (from 0 to 4 M), there was no obviously change on the fluorescence intensity of NS-CDs, suggesting their excellent tolerance in ion solutions (Fig. S1†). In addition, the fluorescence intensity of NS-CDs remains unaltered under the UV light irradiation for at least 90 min, showing their stability under UV light (Fig. S2†). The fluorescence intensity of NS-CDs gradually increases when pH value increases from 1 to 7, and decreases when pH value raised from 7 to 13, with the maximum intensity at pH value of 7 (Fig. S3†). In general, we have confirmed that NS-CDs have a stable and excellent optical performance even under extreme environmental conditions.
2.3. Detection of Hg2+ and GSH
To evaluate their selectivity of specific metal ions, we investigated the fluorescence response of NS-CDs to common metal ions. Compared with other ions, Hg2+ ions have a stronger interaction with NS-CDs, with outstanding fluorescence quenching (Fig. 4a).45,46 When possible interference ions coexists, the addition of coexisted ions exert no effect on the fluorescence quenching caused by the Hg2+ ions, further indicating a high selectivity of NS-CDs for Hg2+ ions detection even in the presence of possible interference ions (Fig. 4b).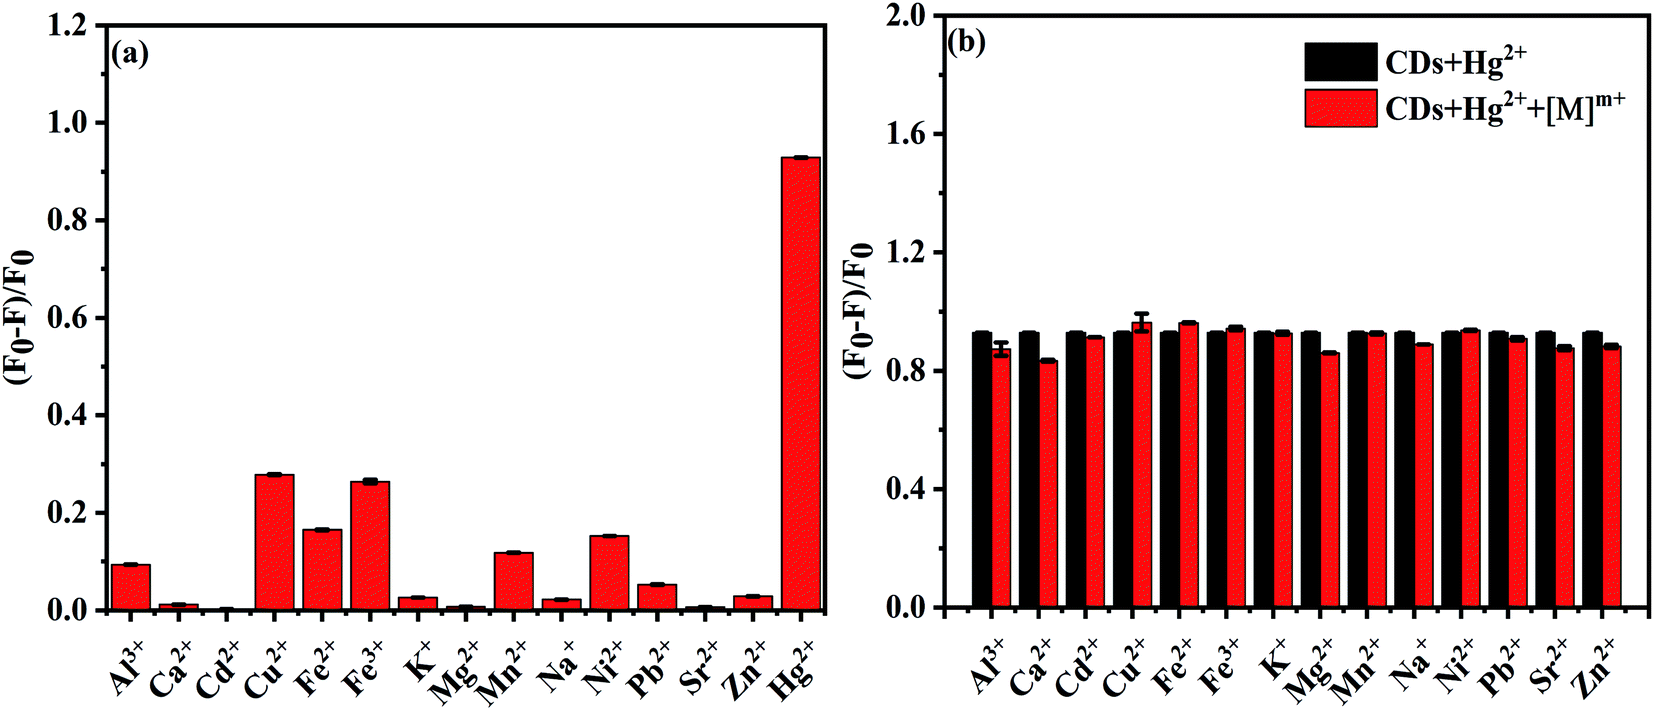 | ||
| Fig. 4 (a) Selectivity of the NS-CDs to different metal ions (30 μM). (b) Bar diagram of fluorescence intensity of NS-CDs to Hg2+ (30 μM) with or without interfering metal ions (30 μM). | ||
The fluorescence spectra were recorded with adding Hg2+ ions of various concentrations into the NS-CDs solution. The fluorescence intensity drops quickly when the concentration of Hg2+ increases from 0 μM to 100 μM (Fig. 5a). The relationship between the relative fluorescence intensity ((F0 − F)/F0) of NS-CDs and the concentration of Hg2+ ions is shown in Fig. 5b. When the concentrations of Hg2+ ions range from 0–10 μM, there is a strong linear correlation, with the relative coefficient (R2) of 0.9932. The fitted linear equation is (F0 − F)/F0 = 0.0776c (Hg2+) − 0.4405, where F and F0 are the fluorescence intensities of NS-CDs with or without adding Hg2+ ions, respectively. According to 3δ/k, we have determined the detection limit of Hg2+ ions at 50 nM. Table 1 shows the linear range and LOD of Hg2+ are compared with previously literature values.
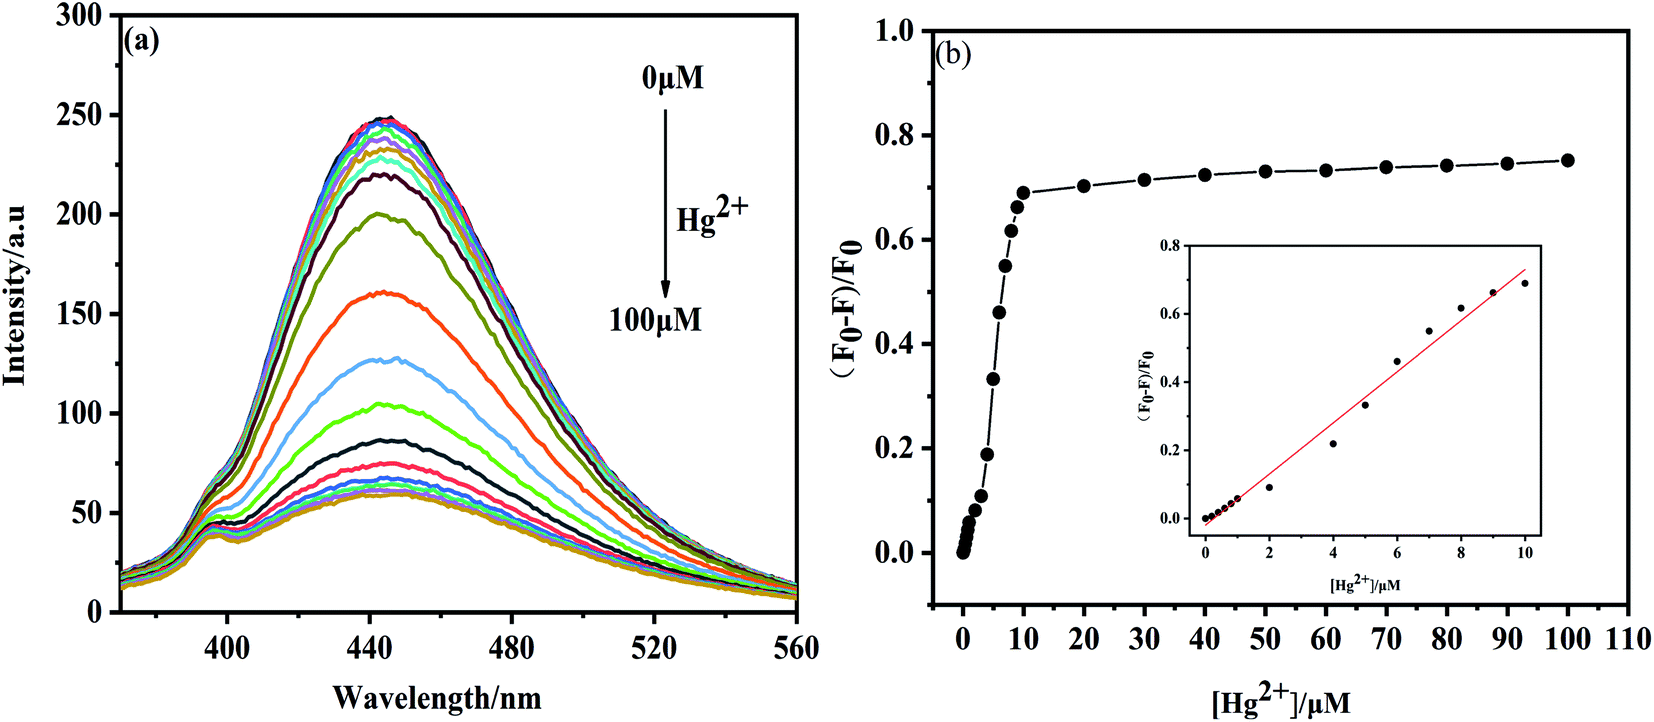 | ||
| Fig. 5 (a) Fluorescence spectra of NS-CDs after addition of different concentrations of Hg2+. (b) Relation of the (F0 − F)/F0 and Hg2+ concentration (0 μM to 100 μM). Insert: linear relationship of the (F0 − F)/F0 and Hg2+ concentration (0 μM to 10 μM). | ||
| Precursor | Probes | Linear range (μM) | LOD (nM) | References |
|---|---|---|---|---|
| Cucumber juice | N/S/P-CD | 1–70 | 180 | 47 |
| Folic acid | N-CQDs | 0–75 | 230 | 48 |
| CA and APTES | Si/N-CDs | 0.5–30 | 140 | 49 |
| Citric acid, ethylenediamine, and methyl blue | NSCDs | 0.7–15 | 540 | 50 |
| Citric acid and 2,6-diaminopyridine | N-CQDs | 0.2–1.2 | 85 | 51 |
| Citric acid and polyacrylamide | CDs-AgNPs | 0.01–2.5 | 3.6 | 52 |
| Gadenia fruits | N/S-CDs | 0.2–20 | 320 | 32 |
| L-Cysteine and citric acid | S,N-CDs/AgNPs | 1.5 × 10⁻³ to 2.0 | 0.51 | 53 |
| Citric acid and urea | N-CDs@NaFZ | 0.1–1.5 | 5.5 × 10⁻³ | 54 |
| Citric acid and taurine | NS-CDs | 0–100 | 50 | This work |
When we examined the selectivity of the NS-CDs–Hg2+ system to different amino acids, other small biomolecules cannot or little alter the fluorescence, except for GSH (Fig. 6a). The quenched fluorescence is only recovered when GSH is added into the NS-CDs–Hg2+ system. Consequently, the NS-CDs–Hg2+ system could be served as a turn-on sensor to detect GSH specifically. When other biomolecules were mixed with GSH, the effect of coexistent biomolecules can be neglected, suggesting the specificity of the NS-CDs–Hg2+ system to GSH detection (Fig. 6b).
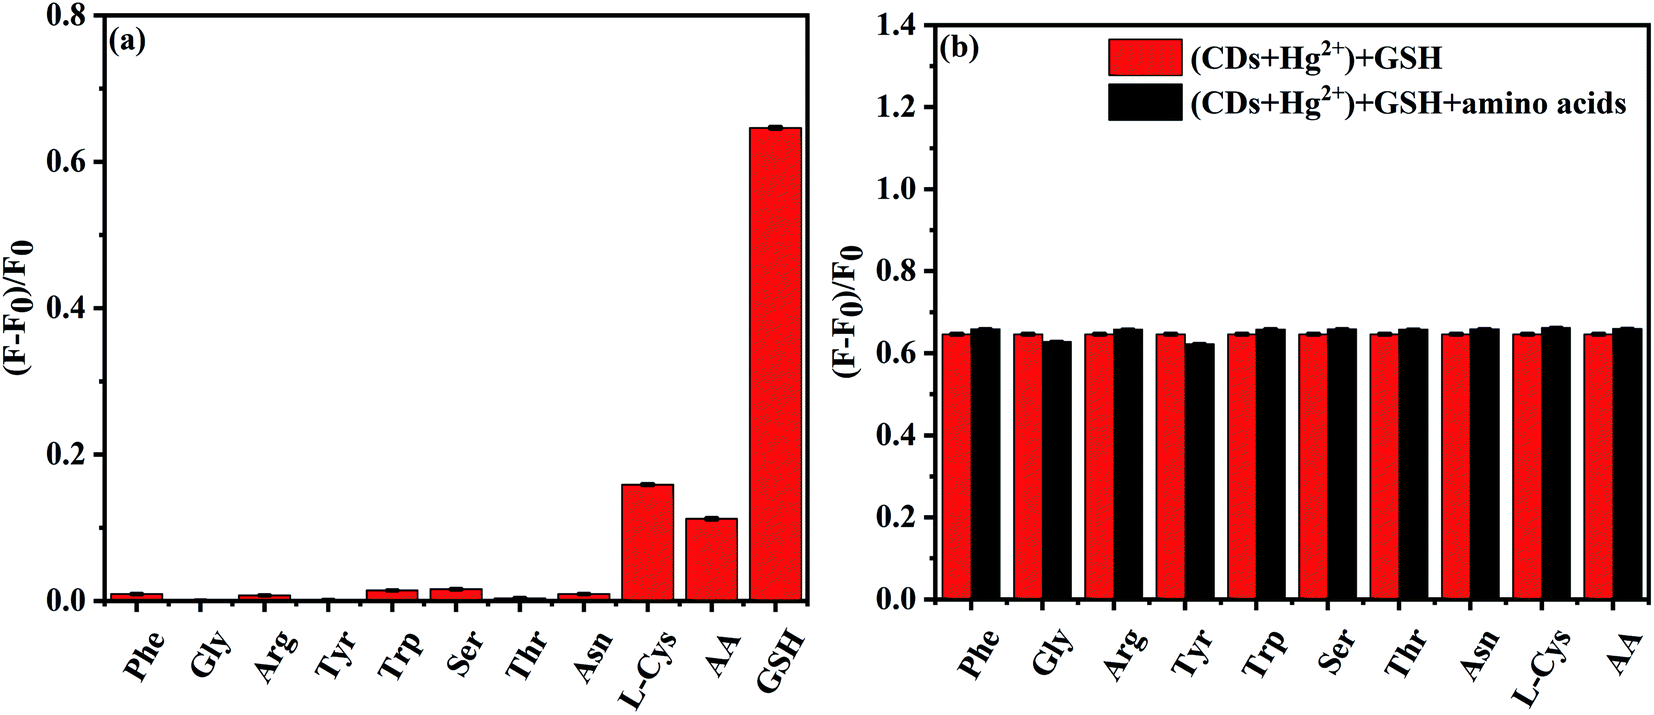 | ||
| Fig. 6 (a) Selectivity of the NS-CDs–Hg2+ system to different biomolecules (30 μM). (b) Bar diagram of intensity of NS-CDs–Hg2+ system to GSH (30 μM) with or without interfering biomolecules (30 μM). | ||
With GSH concentration increased, the fluorescence intensity of NS-CDs–Hg2+ is gradually returned (Fig. 7a). Then, we calculated the relation between the relative fluorescence intensity ((F − F0)/F0) of NS-CDs–Hg2+ and the concentration of GSH. The relative intensity of NS-CDs–Hg2+ shows a strong linear correlation to the concentration of GSH in the range of 0–10 μM, with the related coefficient (R2) of 0.9932 (Fig. 7b). The linear fitting equation is (F − F0)/F0 = 0.05792c (GSH) + 0.01393, where F and F0 are the fluorescence intensities of NS-CDs–Hg2+ with or without adding GSH, respectively. The detection limit of GSH is calculated at 67 nM. The NS-CDs–Hg2+ as the fluorescence sensor to test GSH is also compared with the other works in Table 2. In conclusion, these results demonstrate the NS-CDs can detect Hg2+ and GSH at “on-off-on” mode in a sensitive and specific manner.
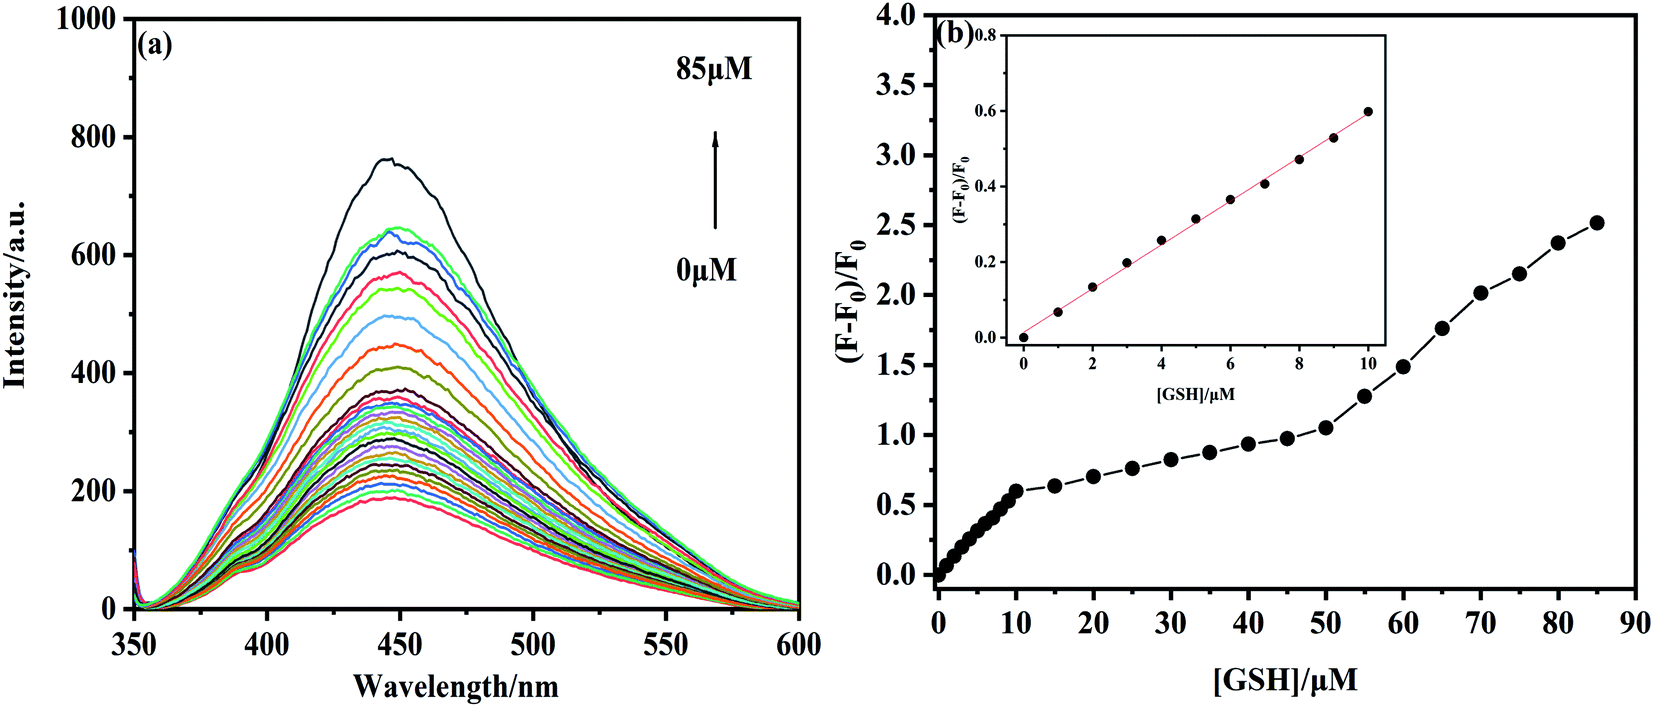 | ||
| Fig. 7 (a) Fluorescence spectra of NS-CDs–Hg2+ after addition of different concentrations of GSH. (b) Relation of the (F − F0)/F0 and GSH concentration (0 μM to 85 μM). Insert: linear relation of the (F − F0)/F0 and GSH concentration (0 μM to 10 μM). | ||
| Precursor | Probes | Linear range (μM) | LOD (nM) | References |
|---|---|---|---|---|
| Boric acid and ethylenediamine | B,N-CDs/MnO2 | 0–90 | 320 | 55 |
| O-Phenylenediamine and citric acid | CQDs | 1–80 | 300 | 56 |
| Eggshell membrane ashes | C-Dots | 5 × 10² to 8 × 10⁴ | 480 | 57 |
| Citric acid monohydrate and L-cysteine | S-CDs/AuNPs | 0.01–5.0 | 3.6 | 58 |
| Citric acid and taurine | NS-CDs–Hg2+ | 0–85 | 67 | This work |
2.4. Mechanism of the “on-off-on” mode
In this work, the NS-CDs displays a fascinating “on-off-on” experimental phenomena with the gradual addition of Hg2+ and GSH. Scheme 1 illustrates a proposed sensing mechanism of NS-CDs. On the one hand, the fluorescence of NS-CDs can be quenched by Hg2+ because the combination between Hg2+ and S-containing groups can form the Hg2+–S bonds.59,60 The structure change of NS-CDs–Hg2+ is demonstrated by FTIR spectrometry, compared to the FTIR spectrum of NS-CDs, the characteristic peak of SO group (1349 cm−1) is disappeared. The result further illustrate the formation of Hg2+–S bonds (Fig. S4†). On the other hand, since the sulfhydryl of GSH has a stronger binding interaction with Hg2+, it can take away Hg2+ from the surface of NS-CDs and then recover the fluorescence of NS-CDs.
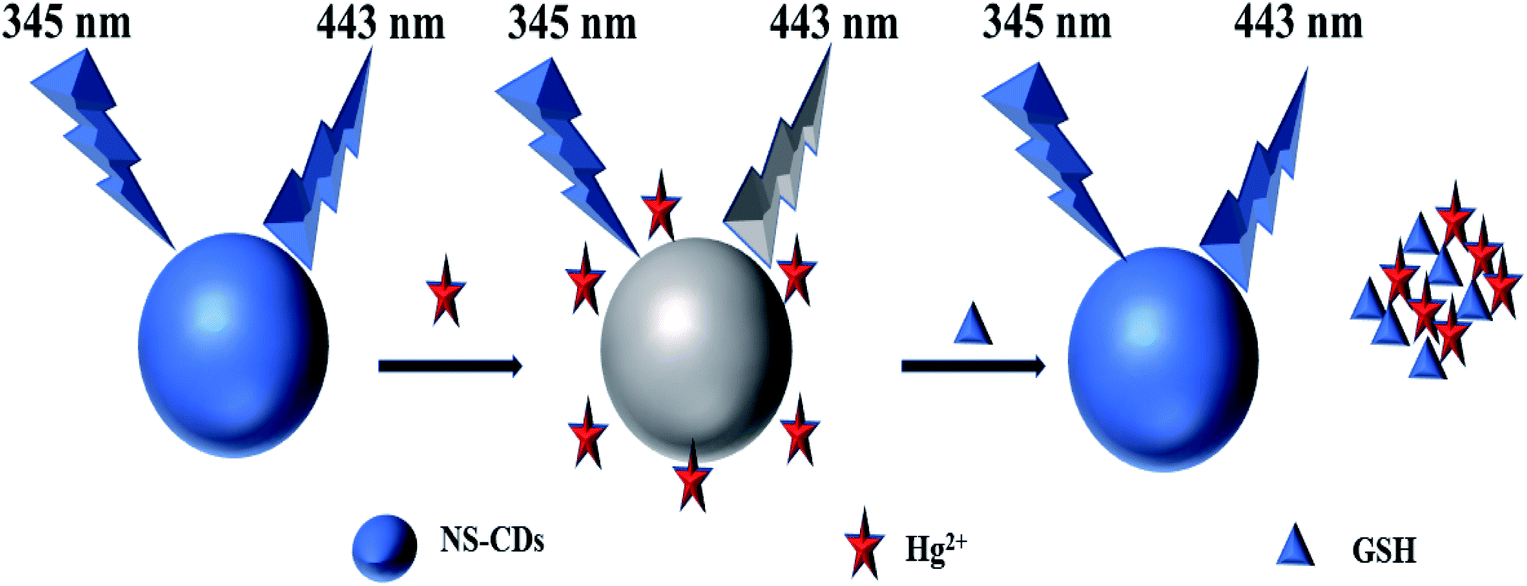 | ||
| Scheme 1 Schematic diagram of Hg2+ and GSH determinations. | ||
The fluorescence sensing procedure was demonstrated by fluorescence lifetime and UV-vis experiments. In Fig. 8a, the absorption peak of NS-CDs (345 nm) is weakened after the addition of Hg2+, which proves Hg2+ compounds with NS-CDs. However, the absorption peaks intensity is strengthened with the addition of GSH, proving that Hg2+ is removed from the surface of NS-CDs.61
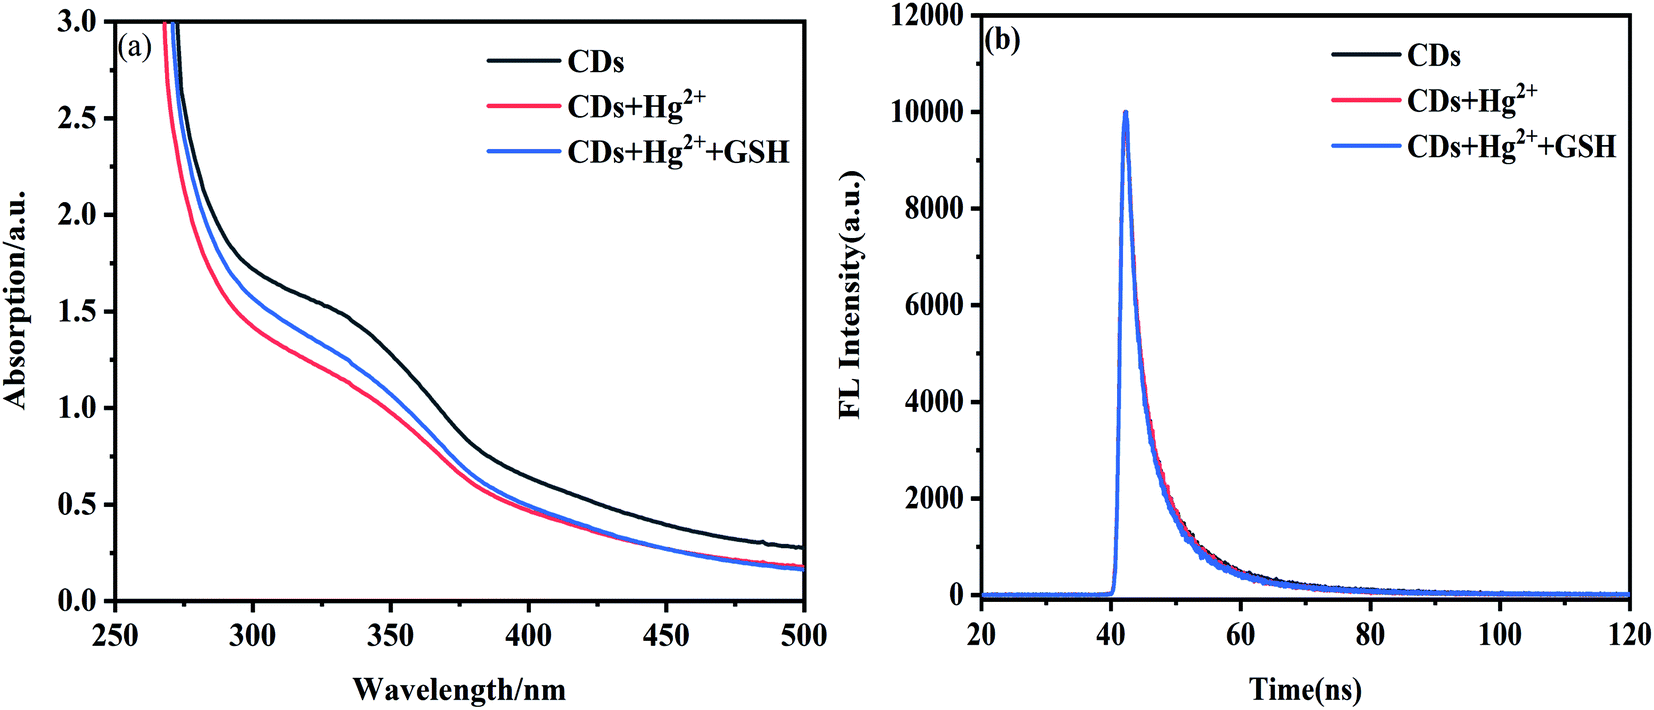 | ||
| Fig. 8 (a) UV-vis spectra of NS-CDs, Hg2+, and GSH system. (b) Fluorescence decay curves of the NS-CDs, NS-CDs–Hg 2+, and NS-CDs–Hg2+ + GSH. | ||
The measured FL decay curves exhibit a double-exponential function (Fig. 8b). The average excition lifetime of NS-CDs is 9.89 ns, containing long lifetime of 11.39 ns (50.15%) and short lifetime of 2.25 ns (49.85%). With the addition of Hg2+ and GSH, there is no change in the average fluorescence lifetime of NS-CDs, indicating the fluorescence quenching mechanism is static quenching.62,63
2.5. Detection of Hg2+ and GSH in actual samples
To investigate the feasibility and sensitivity of the method, the N-CDs was applied to determine Hg2+ in tap water. The tap water samples obtained from the laboratory and was not any pretreatment. The recoveries of Hg2+ are 94.0–105.2 (RSD < 3.4%) in Table S1.† Tap water contains some other elements, we further study the interferences experiment of ions commonly present in tap water (Fig. S5†), the result shows the addition of metal ions did not interfere with the fluorescence intensity of NS-CDs/tap water system, further illustrating the metals does not affect the test results of actual samples.Future, practical applications of N-CDs–Hg2+ sensor for GSH determination in fetal bovine serum sample were executed. The measurement of GSH in fetal bovine serum is 0.35 μM, and the recoveries of GSH are 98.4–102.5% (RSD < 2.4%) (Table S2†). All the results indicate that the N-CDs sensor have high precision and accuracy for determining Hg2+ and GSH in the practical detection.
Reversibility (also known as fatigue resistance) is one of the important indicators for evaluating “on-off-on” fluorescent sensors. In order to study the reversibility of NS-CDs for Hg2+ and GSH detection, Hg2+ and GSH were added alternately to the NS-CDs solution (Fig. 9). The results reflects the fluorescent intensity shows an alternating change, and retains good fatigue resistance after 10 cycles, indicating that the fluorescent sensor has good reversibility.
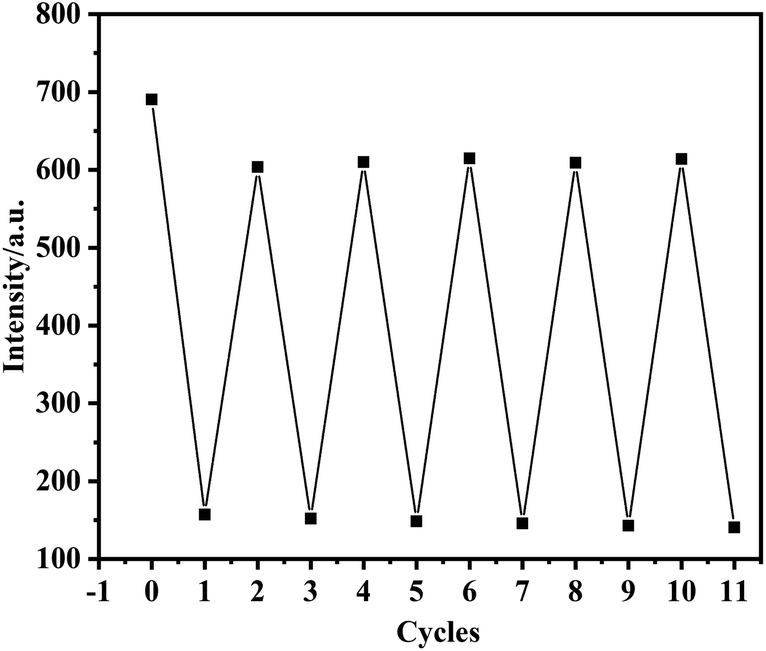 | ||
| Fig. 9 The reversibility of the NS-CDs by alternately adding Hg2+ and GSH. | ||
3. Conclusions
In summary, NS-CDs based fluorescent “on-off-on” was prepared for detecting Hg2+ and GSH. The blue emission NS-CDs showed excellent optical performance, good fluorescent stability, with the fluorescence quantum yield up to 68.94%. The fluorescence of NS-CDs solution was quenched (namely turn-off) when Hg2+ ions were added and subsequently recovered (turn-on) when GSH was added. These results illustrate that the NS-CDs can be used as fluorescence sensor to detect Hg2+ ions and GSH through fluorescent “on-off-on” detection mode, with the detection limits as low as 50 nM and 67 nM, respectively. Furthermore, the fluorescent sensor had good reversibility. Consequently, the NS-CDs offered an effective platform for biological analysis and environmental analysis.Conflicts of interest
The researcher claims no conflicts of interests.Acknowledgements
This work is supported by the National Natural Science Foundation of China (52172092), the Fundamental Research Funds in Heilongjiang Provincial Universities (300882) and the Program for Science and technology of Qiqihar (GYGG-201903).References
- J. Feng, S. Chen, L. Yu and H. Wang, Talanta, 2020, 217, 121014 CrossRef CAS PubMed.
- X. Xu, R. Ray, Y. Gu, H. Ploehn, L. Gearheart, K. Raker and W. A. Scrivens, J. Am. Chem. Soc., 2004, 126, 12736–12737 CrossRef CAS PubMed.
- X. Y. Zhao, S. Liao, L. M. Wang, Q. Liu and X. Q. Chen, Talanta, 2019, 201, 1–8 CrossRef CAS PubMed.
- X. J. Gong, H. P. Wang, Y. Liu, Q. Hu, Y. F. Gao, Z. H. Yang, S. M. Shuang and C. Dong, Anal. Chim. Acta, 2019, 1057, 132–144 CAS.
- Y. Zhao, Y. Z. Li, P. P. Zhang, Z. H. Yan, Y. G. Zhou, Y. P. Du, C. Y. Qu, Y. J. Song, D. Zhou, S. N. Qu and R. F. Yang, Biosens. Bioelectron., 2021, 179, 113057 CrossRef CAS PubMed.
- Z. D. Xie, Y. Y. Zhou, M. L. Fu, L. C. Ni, Y. P. Tong, Y. Yu, N. Li, Z. Y. Yang, Q. Zhu and J. X. Wang, Talanta, 2021, 231, 122365 CrossRef CAS PubMed.
- Z. H. Zhang, B. Hu, Q. F. Zhuang, Y. Wang, X. B. Luo, Y. Xie and D. Zhou, Anal. Lett., 2020, 53, 1704–1718 CrossRef CAS.
- X. Y. Deng, Y. L. Feng and D. S. He, Chin. J. Anal. Chem., 2020, 48, 20126–20133 Search PubMed.
- J. H. Guo, W. J. Lu, H. Zhang, Y. Meng, F. F. Du, S. M. Shuang and S. Dong, Sens. Actuators, B, 2021, 330, 129360 CrossRef CAS.
- Y. H. Yi, L. R. Liu, Y. T. Wu and G. B. Zhu, Anal. Sci., 2021, 37, 275–281 CrossRef CAS PubMed.
- X. L. Kou, S. C. Jiang, S. J. Park and L. Y. Meng, Dalton Trans., 2020, 49, 6915–6938 RSC.
- M. J. Molaei, Talanta, 2019, 196, 456–478 CrossRef CAS PubMed.
- L. F. Pang, Y. C. Sun, X. F. Guo and H. Wang, Sens. Actuators, B, 2021, 345, 130403 CrossRef CAS.
- F. F. Zhao, T. Y. Zhang, Y. Yang and C. I. Lü, Luminescence, 2020, 35, 1277–1285 CrossRef CAS PubMed.
- N. Dhenadhayalan, K. C. Lin and T. A. Saleh, Small, 2020, 16, 1905767 CrossRef CAS PubMed.
- H. Gao, A. V. Sapelkin and M. M. Titirici, ACS Nano, 2016, 10, 9608–9615 CrossRef CAS PubMed.
- Q. Su, L. L. Gan, Y. Zhu and X. M. Yang, Sens. Actuators, B, 2021, 335, 129715 CrossRef CAS.
- J. Lei, H. H. Ding, S. Lu, T. Geng, G. Xiao, B. Zou and H. Bi, Angew. Chem., Int. Ed., 2020, 132, 10072–10077 CrossRef.
- R. Fatemeh, M. Nasrin and Z. Nosratollah, Talanta, 2020, 209, 120547 CrossRef PubMed.
- X. Pang, Y. Q. Li, Z. L. Zhou, Q. J. Lu, R. H. Xie, C. Y. Wu, Y. Y. Zhang and H. T. Li, Talanta, 2020, 217, 121098 CrossRef CAS PubMed.
- X. Chao, M. Cao, J. Xia, D. Jiang, G. Zhou, C. Yu and H. Li, J. Am. Ceram. Soc., 2020, 8, 4507–4516 Search PubMed.
- H. Zhang, Y. Gao, Y. Jiao, W. Lu, S. Shuang and C. Dong, Analyst, 2020, 145, 2212–2218 RSC.
- D. X. Xue, F. J. Yu, Z. J. Zhang and Y. Yang, Sens. Actuators, B, 2019, 279, 130–137 CrossRef CAS.
- Y. Huang and Z. J. Cheng, Nano, 2017, 12, 1750123 CrossRef CAS.
- X. J. Zhu, Y. Chen, Z. Zhang, S. Y. Zhao, L. P. Xie and R. Q. Zhang, Sci. Rep., 2020, 10, 8971 CrossRef CAS PubMed.
- S. Q. Yao, X. Mao, P. Yuan, C. Yu and L. Li, Angew. Chem., 2018, 130, 10414–10419 CrossRef.
- H. Li, X. Yang, F. Gao, C. Qian, C. Li, D. Oupicky and M. Sun, J. Controlled Release, 2018, 292, 78–90 CrossRef CAS PubMed.
- Q. Zhao, Y. Zhang, Z. Guo, D. Liu and G. Zuo, Microchem. J., 2020, 159, 105435 CrossRef CAS.
- X. Han, X. Song, F. Yu and L. Chen, Chem. Sci., 2017, 10, 6991–7002 RSC.
- Y. Liu, S. J. Zhu, K. Z. Gu, Z. Q. Guo, X. Y. Huang, M. W. Wang, M. Amin, W. H. Zhu and P. Shi, ACS Appl. Mater. Interfaces, 2017, 35, 29496–29504 CrossRef PubMed.
- G. H. Liu, H. S. Jia, N. Li, X. N. Li, Z. Y. Yu, J. Wang and Y. T. Song, Microchem. J., 2019, 145, 718–728 CrossRef CAS.
- D. Sun, T. T. Liu, C. F. Wang, L. F. Yang, S. K. Yang and K. L. Zhuo, Spectrochim. Acta, Part A, 2020, 240, 118598 CrossRef CAS PubMed.
- L. Li, L. H. Shi, J. Jia, O. Eltayeb, E. J. Lu, Y. H. Tang, C. Dong and S. M. Shuang, ACS Appl. Mater. Interfaces, 2020, 12, 18250–18257 CrossRef CAS PubMed.
- Z. P. Li, J. Zhang, Y. X. Li, S. Zhao, P. X. Zhang, Y. Zhang, J. S. Bi, G. H. Liu and Z. Yue, Biosens. Bioelectron., 2018, 99, 251–258 CrossRef CAS PubMed.
- S. Berisha, I. Živković, J. Kotnik, T. L. Mlakar and M. Horvat, Accredit. Qual. Assur., 2020, 1–10 Search PubMed.
- M. Talat, P. Tripathi and O. N. Srivastava, Innovations in Corrosion and Materials Science, 2018, 8, 24–31 Search PubMed.
- R. Leona, C. Makamba, S. Saito and L. Christa, Molecules, 2019, 24, 1916 CrossRef PubMed.
- H. Cheng, W. W. Zhang, Y. C. Wang and J. H. Liu, Microchim. Acta, 2018, 185, 1–8 CrossRef PubMed.
- K. K. Jinadasa, H. Paloma, P. Elena, B. Pilar and M. Antonio, Talanta, 2021, 224, 121841 CrossRef CAS PubMed.
- F. Du, L. Sun, Q. Zen, W. Tan, Z. Cheng, G. Ruan and J. Li, Sens. Actuators, B, 2019, 288, 96–103 CrossRef CAS.
- C. Shi, X. Wei, F. Liu and Z. Zong, ChemistrySelect, 2020, 5, 12125–12130 CrossRef CAS.
- L. Xiao, J. Shi, B. Nan, W. Chen, Q. Zhang, E. Zhang and M. Lu, Macromol. Mater. Eng., 2020, 305, 1900810 CrossRef CAS.
- Z. H. Yi, X. M. Li, H. Y. Zhang, X. L. Ji, W. Sun, Y. X. Yu, Y. N. Liu and J. X. Huang, Talanta, 2021, 222, 121663 CrossRef CAS PubMed.
- Y. H. Liu, W. X. Duan, W. Song, J. J. Liu, C. L. Ren, J. Wu, D. Liu and H. L. Chen, ACS Appl. Mater. Interfaces, 2017, 9, 12663e12672 Search PubMed.
- Z. Liu, W. Jin, F. Wang, T. Li, J. Nie, W. Xiao, Q. Zhang and Y. Zhang, ACS Appl. Mater. Interfaces, 2019, 296, 126698 CAS.
- A. Majid, A. P. Altalhi, M. ElMegharbel, H. Saad and S. Refat, Crystals, 2021, 11, 92 CrossRef.
- C. Wang, D. Sun, K. Zhuo, H. Zhang and J. Wang, RSC Adv., 2014, 4, 54060–54065 RSC.
- R. Zhang and W. Chen, Biosens. Bioelectron., 2014, 55, 83–90 CrossRef CAS PubMed.
- D. Cao, Y. X. Luo, W. Liu, Y. S. Li and X. F. Gao, Spectrochim. Acta, Part A, 2021, 263, 120182 CrossRef CAS PubMed.
- H. Lee, Y. C. Su, H. O. Tang, Y. H. Lee, J. Y. Lee and C. C. Hu, Nanomaterials, 2021, 11, 1831 CrossRef CAS PubMed.
- V. K. Singh, V. Singh, P. K. Yadav, S. Chandra, D. Bano, B. Koch, M. Talat and S. H. Hasan, J. Photochem. Photobiol., B, 2019, 384, 112042 CrossRef CAS.
- Q. X. Zhou, Y. L. Liu, Y. L. Wu, L. Zhi, Y. H. Li, M. H. Liu, T. X. Qu and C. M. Chen, Chemosphere, 2021, 274, 129959 CrossRef CAS PubMed.
- A. F. Zahra, H. Tooba and A. Mohammad, Luminescence, 2021, 36, 1151–1158 CrossRef PubMed.
- O. H. Omar, H. Rebwar, F. Azad and G. MGhadiri, Talanta, 2021, 234, 122646 CrossRef PubMed.
- J. Zhang, H. Yang and S. Pan, Spectrochim. Acta, Part A, 2021, 244, 1188312 Search PubMed.
- K. Zhuo, D. Sun, P. Xu, C. F. Wang, Y. Y. Cao, Y. J. Chen and J. M. Liu, J. Lumin., 2017, 187, 227–234 CrossRef CAS.
- Z. Y. Ma, T. T. Wu, P. P. Li, M. L. Liu, S. Huang, H. T. Li, Y. Y. Zhang and S. Z. Yao, Microchim. Acta, 2019, 186, 1–10 CrossRef PubMed.
- S. Huang, E. Yang, J. Yao, Y. Liu and Q. Xiao, Anal. Chim. Acta, 2018, 1035, 192–202 CrossRef CAS PubMed.
- Z. Han, D. Y. Nan, H. Yang, Q. Q. Sun, S. Pan, H. Liu and X. Hu, Sens. Actuators, B, 2019, 298, 126842 CrossRef CAS.
- Q. Wang, X. Liu, L. C. Zhang and L. Lv, Analyst, 2012, 137, 5392–5397 RSC.
- J. Z. Li, X. Y. Rao, F. Xiang, J. J. Wei, M. Yuan and Z. Liu, Analyst, 2018, 143, 2083–2089 RSC.
- A. Iqbal, K. Iqbal, L. Xu, B. Li, D. Gong, X. Liu, Y. Guo, W. Liu, W. Qin and H. Guo, Sens. Actuators, B, 2018, 255, 1130–1138 CrossRef CAS.
- R. Dongare and H. Gorel, ChemistrySelect, 2021, 6, 5657–5669 CrossRef.
Footnote |
| † Electronic supplementary information (ESI) available: The experiment details, supporting table, supporting figure. See DOI: 10.1039/d1ra08890d |
| This journal is © The Royal Society of Chemistry 2022 |