
 Open Access Article
 This Open Access Article is licensed under a Creative Commons Attribution-Non Commercial 3.0 Unported Licence
In situ electrochemical investigation of the reaction progress between Zr and a CuCl–SnCl2 mixture in a LiCl–KCl molten salt
Yanqing Cai a,
Xinggang Chen*a,
Ying Xua and
Qian Xub
a,
Xinggang Chen*a,
Ying Xua and
Qian Xub
aCollege of Material Science and Engineering, North China University of Science and Technology, Tangshan, 063210, PR China. E-mail: 443142343@qq.com
bSchool of Materials Science and Engineering, Shanghai University, Shanghai, 200072, PR China
First published on 2nd February 2022
Abstract
The electrochemical behaviors of CuCl, SnCl2 and a CuCl–SnCl2 mixture were investigated by cyclic voltammetry (CV) and square wave voltammetry (SWV). The reduction potentials of Cu(I) and Sn(II) on CV curves are −0.49 and −0.36 V, respectively, while the reduction potentials of Cu(I)–Sn(II) in the CuCl–SnCl2 mixture almost overlap. The co-chlorination reaction progress between CuCl–SnCl2 and Zr was also studied by monitoring the concentration changes of Cu(I), Sn(II) and Zr(IV) ions in situ by CV, SWV and inductively coupled plasma-atomic emission spectroscopy (ICP-AES) analyses. The results indicate that during the reaction, the concentration of Zr(IV) ions increases gradually, while those of Cu(I) and Sn(II) decrease rapidly until they disappear. When the molar ratios of Cu(I) to Sn(II) are 1![[thin space (1/6-em)]](https://www.rsc.org/images/entities/char_2009.gif) :1 and 1:0.5, the reaction between Cu(I) and Zr is faster but cannot exceed twice that of Sn(II) and Zr in a short time. When the theoretical product of ZrCl4 is a constant, and with the proportion of CuCl to SnCl2 decreasing from 1:0 to 0:1, the chlorination reaction time periods increase from 40 to 170 min. Chloride products such as CuxSny, SnxZry, and CuxZry, are formed with different molar ratios. The coupling effect caused by the formation of alloys will promote the chlorination reaction when the ratios of CuCl to SnCl2 are 0.66:0.17 and 0.5:0.25. The results provide a theoretical basis for the electrolytic refinement of zirconium.
:1 and 1:0.5, the reaction between Cu(I) and Zr is faster but cannot exceed twice that of Sn(II) and Zr in a short time. When the theoretical product of ZrCl4 is a constant, and with the proportion of CuCl to SnCl2 decreasing from 1:0 to 0:1, the chlorination reaction time periods increase from 40 to 170 min. Chloride products such as CuxSny, SnxZry, and CuxZry, are formed with different molar ratios. The coupling effect caused by the formation of alloys will promote the chlorination reaction when the ratios of CuCl to SnCl2 are 0.66:0.17 and 0.5:0.25. The results provide a theoretical basis for the electrolytic refinement of zirconium.
1 Introduction
Zirconium and its alloys are widely investigated due to their low neutron-capture cross-section and special use in the nuclear field such as protection against corrosion and catalysis.1 With the development of the application of zirconium products, residues and wastes are being rapidly produced.2,3 Except for polluting the environment, the residues and wastes contain a large amount of zirconium, which is free of hafnium and valuable and difficult to obtain. Therefore, due to its economic and environmental value, it is highly necessary to recycle zirconium present in residual and waste materials.4Among the methods available for recycling, much attention has been paid to electrochemical refinement of zirconium in molten salts. Commonly, the electrorefining of Zr occurs in alkali chloride, fluoride, or chloride-fluoride mixed fused melts.5–8 Sohn et al.9 studied the electrolytic recovery of high-purity Zr from radioactively contaminated zircaloy-4 alloys in LiCl–KCl–ZrCl4 salts. Han and Zhang3,10,11 have also studied the recovery of Zr from LiCl–KCl–K2ZrF6 molten salts using Fe, Cu, and Sn electrodes. In fact, a low-melting Cu–Sn–Zr alloy has been proposed for use as a liquid anode in the refinement of spent zirconium in our previous work, and high-purity nuclear-grade zirconium would be obtained at the cathode.12–14 Note that Zr in Cu–Sn–Zr is a residual and waste material that is made of nuclear-grade zirconium and does not contain hafnium. Considering the melting point of the liquid alloy anode and moderate experimental conditions, electrorefining of Zr is proposed in LiCl–KCl–ZrCl4 molten salts at 773 K in our initial stage of research. Traditionally, ZrCl4 is mainly prepared by the chemical reaction between zirconite (ZrSiO4) and a chlorinating agent such as chlorine gas. However, the preparation process of ZrCl4 is complex, and the cost is high. Moreover, ZrCl4 sublimates at a low temperature (331 °C), part of which will be lost if it is directly introduced into the salt.15 Thus, the preparation of melts with a certain amount of ZrCl4 has been a great challenge in electrochemical refinement studies.16
Several researchers have been working on the in situ preparation of chlorides in molten salts for electrorefining or reprocessing spent metal fuels. Kuznetsov et al. and Ghosh et al. investigated the preparation of UCl3 and PuCl3 by the chemical equilibration of U–Pu–Zr spent fuel with stoichiometric amounts of CdCl2 in LiCl–KCl molten salts.17,18 Murakami et al.16 investigated the preparation of a LiCl–KCl–ZrCl4 melt by the reaction between CdCl2 and Zr. The equilibration reactions between CuCl and zirconium, and SnCl2 and zirconium to prepare ZrCl4 in situ have been investigated in our previous work,13,19 while Cu is solid and Sn is liquid at the operating temperature, the co-chlorination reaction between a binary mixture of CuCl–SnCl2 and zirconium is important to clarify their co-chlorination progress and mechanism. Hence, the present work focused on the in situ preparation of ZrCl4 by the chemical equilibration of zirconium with CuCl–SnCl2 chlorides in the LiCl–KCl melt, which can be used as the electrolyte in the electrorefining of Zr with the low-melting liquid alloy anode. There are few reports on investigation about the reaction between Zr and CuCl–SnCl2 in the molten salt. Additionally, the co-chlorination progress, phase of mid-products and the mechanism should be studied in detail; the influence of alloying effect on the corresponding reduzates such as Cu, Sn or CuxSny alloys also need to be further investigated.
Hence, in the present study, the in situ preparation of ZrCl4 in a LiCl–KCl melt was investigated by the equilibration reaction between a binary mixture of CuCl–SnCl2 and zirconium. Pure Zr metal instead of the Cu–Sn–Zr alloy was first used as a reactant with CuCl–SnCl2 to investigate the reaction process by several electrochemical methods such as cyclic voltammetry (CV) and square wave voltammetry (SWV). Moreover, the chlorination reaction time and the ratio of CuCl to SnCl2 were also investigated. Special attention was paid to the occurrence of mid-products and reduzates. Furthermore, the final compositions of the melt and the reduzate were examined by ICP-AES and XRD analyses.
2 Experimental
2.1 Materials
The experimental apparatus used in this work is shown in Fig. 1. A three-electrode electrochemical cell was assembled in an alumina crucible, which was positioned in a stainless steel vessel and heated in an electric furnace. A chromel–alumel thermocouple was used for temperature measurement with an accuracy of ±2 K, and all the operating temperatures were kept at 500 °C. All of the electrochemical experiments were conducted in a high-purity argon atmosphere.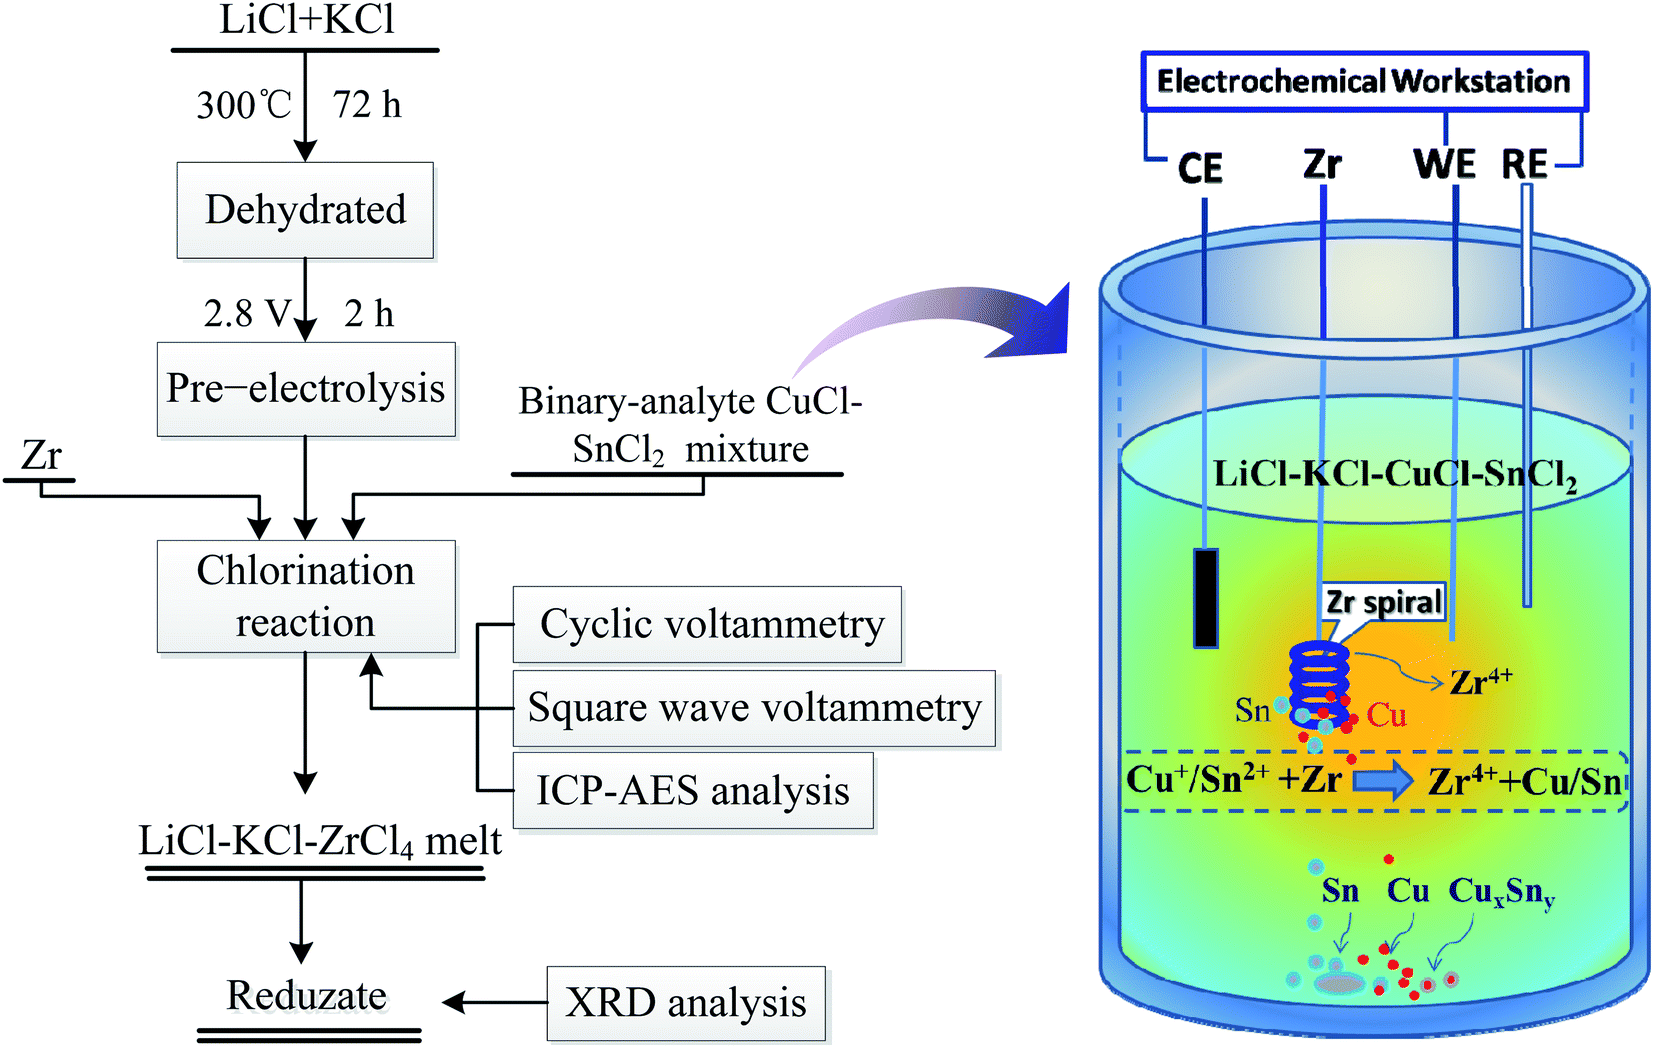 | ||
| Fig. 1 Flow chart and schematic diagram of the co-chlorination reaction. | ||
A graphite rod with a diameter of 10 mm and a length of 50 mm (spectroscopically pure) was used as the counter electrode (CE). A molybdenum wire (Ø1 mm, 99.95% purity) served as the working electrode (WE) to investigate electrochemical behaviors. The active electrode surface area was determined by measuring the immersion depth of the electrode in the melt after each experiment. The reference electrode (RE) was self-assembled by a silver wire (Ø1 mm, 99.99% purity) immersed in a LiCl–KCl melt with 1.0 wt% AgCl. It was contained in a close-ended and polished alundum tube, and all potentials were referred to this electrode. Molybdenum wires, silver wires, and zirconium wires were supplied by Rare Metallic Co., Ltd of Shenyang, which were used after polishing with sandpaper and then washing with deionized water and alcohol.
The mixture of LiCl (99% purity) and KCl (99% purity) with a eutectic composition (59:41 mol%) served as the supporting electrolyte, previously dehydrated at 300 °C for 72 h and premelted at 500 °C to remove residual moisture. Pre-electrolysis of the LiCl–KCl melt was conducted to eliminate residual water and other possible redox-active impurities at 2.8 V for 2 h between two graphite rods. Copper(I) and stannous(II) ions were introduced into the bath in the form of dehydrated CuCl powders (Sinopharm, China) and dehydrated SnCl2 powders (Aladdin, China), respectively. Anhydrous zirconium tetrachloride was obtained from Aladdin and used without further purification. All chemicals used in this study were of analytical grade.
2.2 Methods
A flow chart of the co-chlorination reaction process is shown in Fig. 1. After pre-electrolysis, a certain amount of the CuCl–SnCl2 binary mixture was introduced into the LiCl–KCl eutectic, and then, a zirconium spiral (99.4% purity) was introduced when the salt was under a stable condition. After that, a chlorination reaction between zirconium and CuCl–SnCl2 occurred. Zr(IV) ions were generated and introduced into the molten salt during the chlorination reaction, and tin and copper (perhaps CuxSny alloy) were produced and deposited at the bottom of the crucible. During the reaction process, the electrochemical behavior of Sn(II), Cu(I) and Zr(IV) was studied to monitor the reaction progress by CV and SWV at certain time points. Meanwhile, the melt was sucked out at various times using a quartz tube during the reaction process, and the concentrations of Sn(II), Cu(I) and Zr(IV) in the melt were determined by ICP-AES analysis. The exact practical time label is shown in the figures of each section. Moreover, special attention was paid to the occurrence of intermediate compounds and reduzates.All electrochemical measurements (CV and SWV) were conducted using an AUTOLAB/PGSTAT320 potentiostat from M s−1. EcoChemie, Netherlands, and data acquisition was controlled using the GPES 4.9 software for CV and using the NOVA 1.6 software for SWV. Quantitative compositional measurement of the melt at certain time points was made by inductively coupled plasma-atomic emission spectroscopy. After each chlorination reaction experiment, the reduzates were deposited at the bottom of the crucible due to their higher densities; then, they were collected, washed several times with water and ethanol and dried. After that, an X-ray diffractometer (Rigaku D/max-RA, Japan) was employed for the characterization of reduzates.
3 Results and discussion
The results include three parts: first, the electrochemical behaviors of CuCl and SnCl2 coexisting in the LiCl–KCl melt were studied. Second, the in situ electrochemical method is used to monitor the chlorination reaction process between Zr and the CuCl–SnCl2 mixture in the LiCl–KCl molten salt. Third, chlorination reaction times and products were compared and analyzed when different proportions of CuCl and SnCl2 were added.3.1 Electrochemical behaviors of Cu+, Sn2+ and Cu+–Sn2+ on molybdenum electrodes
| 2CuCl = 2Cu + Cl2(g) EΘ500 °C(vs.Ag/AgCl) = −0.02 V | (1) |
| SnCl2 = Sn + Cl2(g) EΘ500 °C(vs.Ag/AgCl) = −0.214 V | (2) |
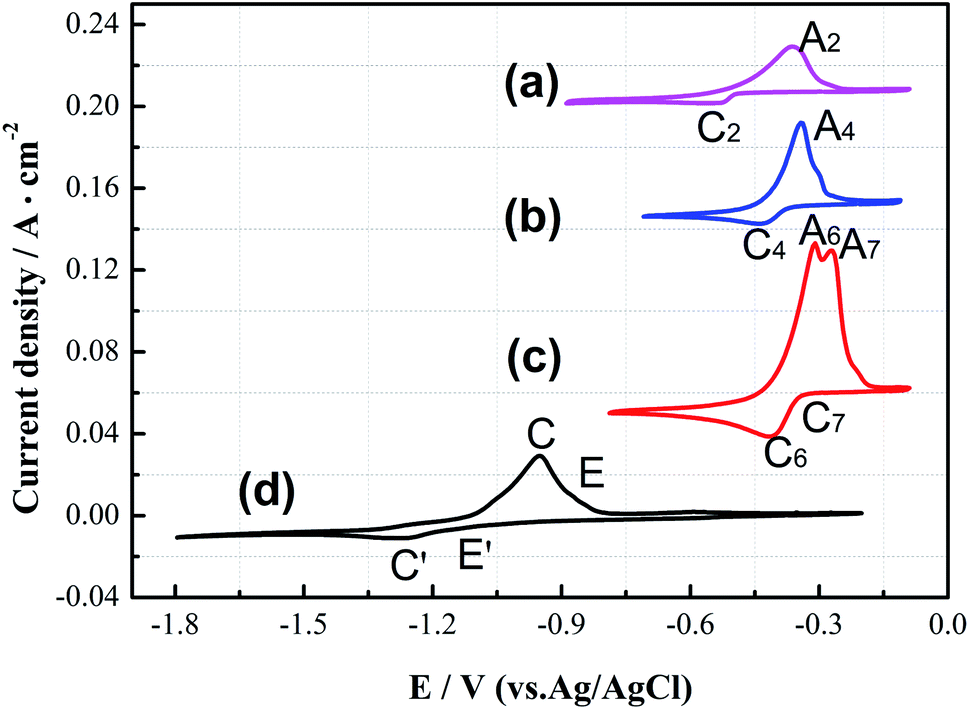 | ||
| Fig. 2 CVs for molybdenum electrode in LiCl–KCl eutectic with (a) 1.93 × 10⁻⁵ mol cm−3 CuCl, (b) 1.01 × 10⁻⁵ mol cm−3 SnCl2 and (c) 1.93 × 10⁻⁵ mol cm−3 CuCl + 2.02 × 10⁻⁵ mol cm−3 SnCl2 and (d) 1.64 × 10⁻⁵ mol cm−3 ZrCl4 at 500 °C, scan rate: 0.10 V s−1. | ||
Curve (c) in Fig. 2 is the CV curve of the CuCl–SnCl2 binary mixture. Comparing Fig. 2(a)–(c), it can be observed that the redox peaks (A6/C6, A7/C7) shown in Fig. 2(c) are the superposition of the former two pairs in Fig. 2(a) and (b). Because the peak potentials of copper and tin are too close, it can conclude that A6/C6 corresponds to the deposition and oxidation peaks of Cu(I)/Cu, and A7/C7 is the redox peak of Sn(II)/Sn. In addition, from the Cu–Sn alloy phase diagram in Fig. 3,20 with the changing mole ratio of Sn and Cu, the composition of Cux–Sn1−x will be changed, and multiple alloys and intermetallic compounds were found, e.g., Cu6Sn5, Cu4Sn, Cu3Sn and Cu10Sn3. Here, it can be concluded that the co-reduction of Cu(I) and Sn(II) may also form one or more kinds of CuxSny alloys in redox peaks A6/C6 and A7/C7. In curve (d), two cathodic peaks E′ and C′ at approximately −1.15 and −1.22 V are observed, which relate to the reduction of Zr(IV) to Zr(II), and Zr(II) and Zr(IV) to Zr, respectively. Their corresponding anodic peaks, C and E, are found at around −0.85 and −0.78 V, respectively. The electrochemical behavior of Zr(IV) in a LiCl–KCl melt has been studied by several investigators.5,21–27 These results will provide a reference for the redox potentials of copper, tin and zirconium in the subsequent chlorination process.
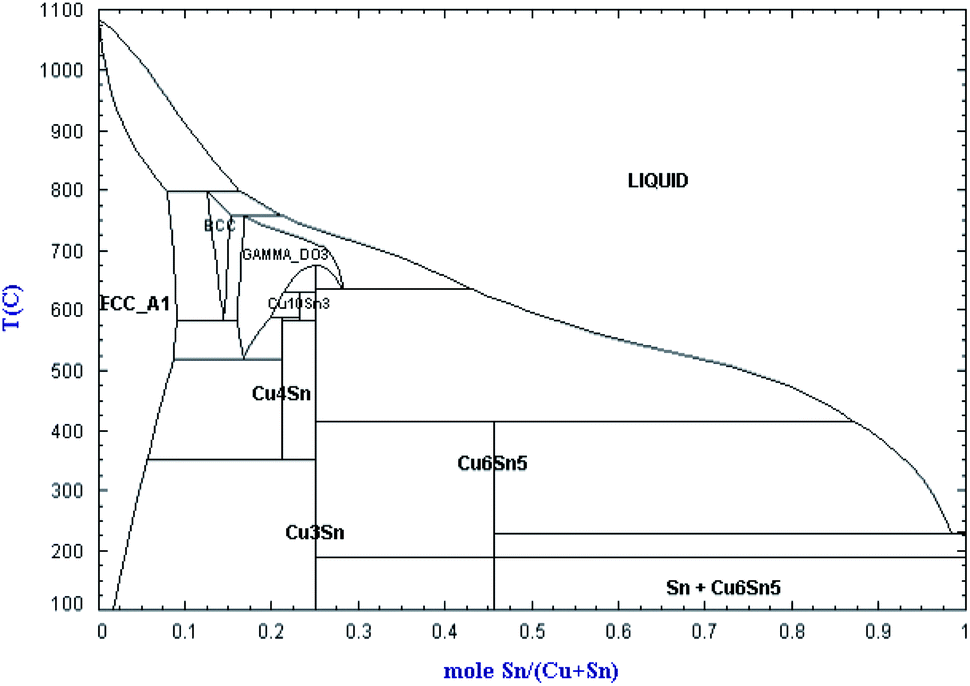 | ||
| Fig. 3 Phase diagram of Cu–Sn alloy.20 | ||
Fig. 4 shows the SWV curves after the addition of 1.93 × 10⁻⁵ mol cm−3 CuCl (Curve I), 1.01 × 10⁻⁵ mol cm−3 SnCl2 (Curve II), 1.93 × 10⁻⁵ mol cm−3 CuCl + 2.02 × 10⁻⁵ mol cm−3 SnCl2 (Curve III), and 1.64 × 10⁻⁵ mol cm−3 ZrCl4 (Curve IV) to the LiCl–KCl molten salt at 500 °C on a molybdenum electrode. The figure shows that the reduction peak of Cu(I) to Cu is at −0.45 V on Curve I, and that of Sn(II) to Sn is at −0.32 V on Curve II. When Cu(I) and Sn(II) ions are both present in the molten salt, there is a reduction peak at −0.38 V between the deposition peaks of Cu and Sn on Curve III, which should be the codeposition peak of Cu, Sn and Cu–Sn alloys. Cathodic peaks E′ and C′ on Curve IV at approximately −1.15 and −1.22 V are related to the multistep reduction of zirconium. SWV is more sensitive than cyclic voltammetry, while the results of SWV are in agreement with those obtained from the CV measurements, and it can clearly distinguish the deposition potentials of Cu, Sn and Cu–Sn alloys.
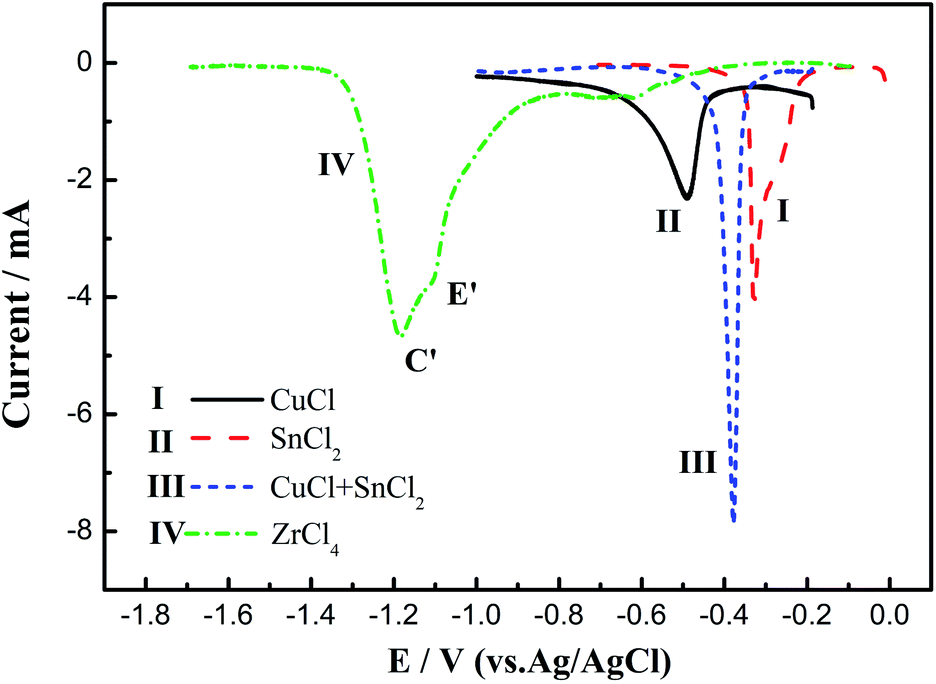 | ||
| Fig. 4 SWVs for molybdenum electrode (S = 0.56 cm2) in LiCl–KCl eutectic with (I) 1.93 × 10⁻⁵ mol cm−3 CuCl, (II) 1.01 × 10⁻⁵ mol cm−3 SnCl2, (III) 1.93 × 10⁻⁵ mol cm−3 CuCl + 2.02 × 10⁻⁵ mol cm−3 and 1.64 × 10⁻⁵ mol cm−3 ZrCl4 (Curve IV). | ||
3.2 Chlorination reaction between Zr and the CuCl–SnCl2 mixture
In this section, the electrochemical behavior of the CuCl–SnCl2 mixture in the chlorination reaction with Zr was analyzed in detail by CV and SWV, and the concentration changes of Cu(I) and Sn(II) in the reaction process were observed.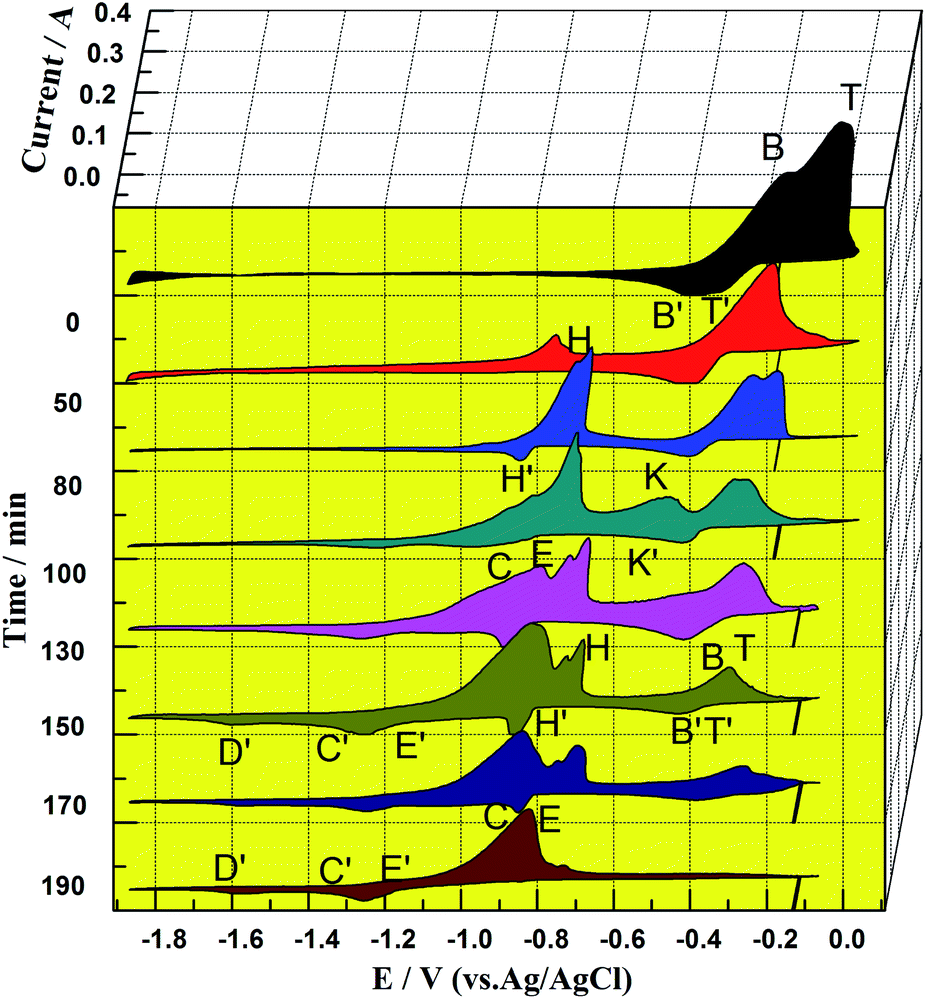 | ||
| Fig. 5 CVs of LiCl–KCl–CuCl (1.10 × 10⁻⁴ mol cm−3)–SnCl2 (1.09 × 10⁻⁴ mol cm−3) (molar ratio of Cu(I)/Sn(II) = 1:1) with excessive Zr spiral at different times (Y axis) during the chlorination reaction on molybdenum electrode (S = 0.628 cm2) at 500 °C. Scan rate: 0.10 V s−1. | ||
Fig. 5 shows the CV curves after an excess of Zr was added into the LiCl–KCl–(1.10 × 10⁻⁴ mol cm−3) CuCl–(1.09 × 10⁻⁴ mol cm−3)–SnCl2 melt (the molar ratio of Cu(I)/Sn(II) is 1:1). In Fig. 5, the peak potential, reaction time, and peak current were taken as the X, Y, and Z coordinate axes, respectively. Before the introduction of zirconium into the molten salt (0 min), two pairs of redox peaks, T/T′ and B/B′, appeared near −0.25 V, which are attributed to redox peaks of Cu, Sn and the Cu–Sn alloy according to Fig. 2 (curve (c)).
With the introduction of zirconium, the peak current intensities of T/T′ and B/B′ have a declining trend over time, indicating that the chlorination reaction between CuCl–SnCl2 and Zr has occurred according to Reactions (3) and (4). Reactions (3) and (4) are thermodynamically favorable in theory according to very high values of the equilibrium constant. Moreover, the peak potentials of T/T′ and B/B′ also show a slight negative shift over time, which can be explained by the concentration decrease of Cu+ and Sn2+ during the chlorination reaction of Zr and CuCl–SnCl2.19 When the reaction lasts 50 min, a new redox peak H/H′, according to Cu–Zr alloys, appears at −0.80 V. Then, another pair of redox peaks K/K′, according to Sn–Zr alloys, appears at approximately −0.50 V when the reaction proceeded to 100 min. The two pairs are more positive than the oxidation potential of zirconium in Fig. 2. They first increase and then decrease over time. The results indicate that zirconium ions were produced during the chlorination reaction, and then codeposited with Cu and Sn to form Cu–Zr and Sn–Zr alloys, and their distinctive features are the redox peaks of H/H′ and K/K′, respectively.
| [Zr] + 4CuCl4 − Cu + (ZrCl4) ΚΘ500 °C = 1.81 × 1024 | (3) |
| [Zr] + 2(SnCl2) − 2[Sn] + (ZrCl4) ΚΘ500 °C = 1.25 × 10¹⁹ | (4) |
In addition, comparing the oxidation peak shapes and potentials of Cu–Zr and Sn–Zr alloys in our previous works13,19 shows that the oxidation peaks of the Sn–Zr alloys are relatively sharp, and there is a certain distance from the reduction peak potentials of Sn–Zr alloys (approximately −0.70 V)) to the reduction peak potential of Zr (−0.90 V). The oxidation peaks of Cu–Zr alloys are relatively smooth, and one of the oxidation peaks at −0.80 V is close to the peak of Zr(IV)/Zr(II). After comparison, the peak shape of K/K′ in Fig. 5 is more similar to those of the Sn–Zr alloys, so it can be inferred that the characteristic peak of Sn–Zr in the intermediate product is more obvious. The main reason for this phenomenon is that Sn(II) and Cu(I) have different charges. One mol of Sn(II) can chloridize 0.5 mol of Zr, while 1 mol of Cu(I) can only chloridize 0.25 mol of Zr, so the chlorination effect of Sn(II) is twice as much as that of Cu(I). In addition, the reduzate Sn is liquid at the experimental temperature and wraps Zr, making the reaction between Cu(I) and Zr more advantageous. Then, the Cu(I) concentration decreases faster, leaving the concentration of Sn(II) in the molten salt relatively high, so the peaks of Sn–Zr alloys are more obvious on the CV curve. With the prolonged chlorination reaction time, the concentrations of Cu(I) and Sn(II) ions gradually decrease, and the concentration of Zr(IV) ions gradually increases.
When the reaction lasts for 130 min, the peaks for couples C/C′ and E/E′ appear and increase gradually, which correspond to the couples Zr(IV)/Zr(II), Zr(II)/Zr and Zr(IV)/Zr.24,25 In addition to the formation of Cu–Zr and Sn–Zr alloys, excess zirconium ions are deposited on the surface of the alloys, and a zirconium deposit layer appears; correspondingly, redox peaks of zirconium appears. When the reaction reaches the final stage (190 min), the redox peaks of Cu, Sn and their alloys disappear, and all the redox peaks are the same as those in the cyclic voltammogram of directly introduced ZrCl4 in Fig. 2. The above-mentioned results indicate that when the reaction lasts for 190 min, only Zr(IV) ions are present in the molten salt, and the reactions between CuCl, SnCl2 and Zr were completed.
To further observe the progress of the chlorination reaction with different Cu(I)/Sn(II) ratios, CV curves were investigated after an excess of Zr was added into LiCl–KCl–CuCl (1.25 × 10⁻⁴ mol cm−3)–SnCl2 (6.22 × 10⁻⁵ mol cm−3) (the molar ratio of Cu(I)/Sn(II) is 1:0.5), as shown in Fig. 6. To analyze the changes in several ion concentrations more clearly, oxidation peaks in the range of −1.20 to −0.25 V are enlarged and compared, as shown in Fig. 7. It shows that before the reaction starts (0 min), there are only redox peaks (B/B′) of Cu, Sn and their alloys, and there is no oxidation peak related to Zr. When the reaction progresses to 8 min, two oxidation peaks, H2 and H3, appear at −0.75 and −0.66 V, respectively, and they increase gradually with the prolonging reaction time. When the reaction progresses to 16 min, another oxidation peak, H1, appears at −0.57 V. The peak currents of H1, H2, and H3 (collectively called H in Fig. 6) all increase first and then decrease during the reaction process, especially that of H3. Before the disappearance of H3, oxidation peak C appeared when the reaction proceeds to 21 min and increases to a maximum as the reaction time extends to 80 min.
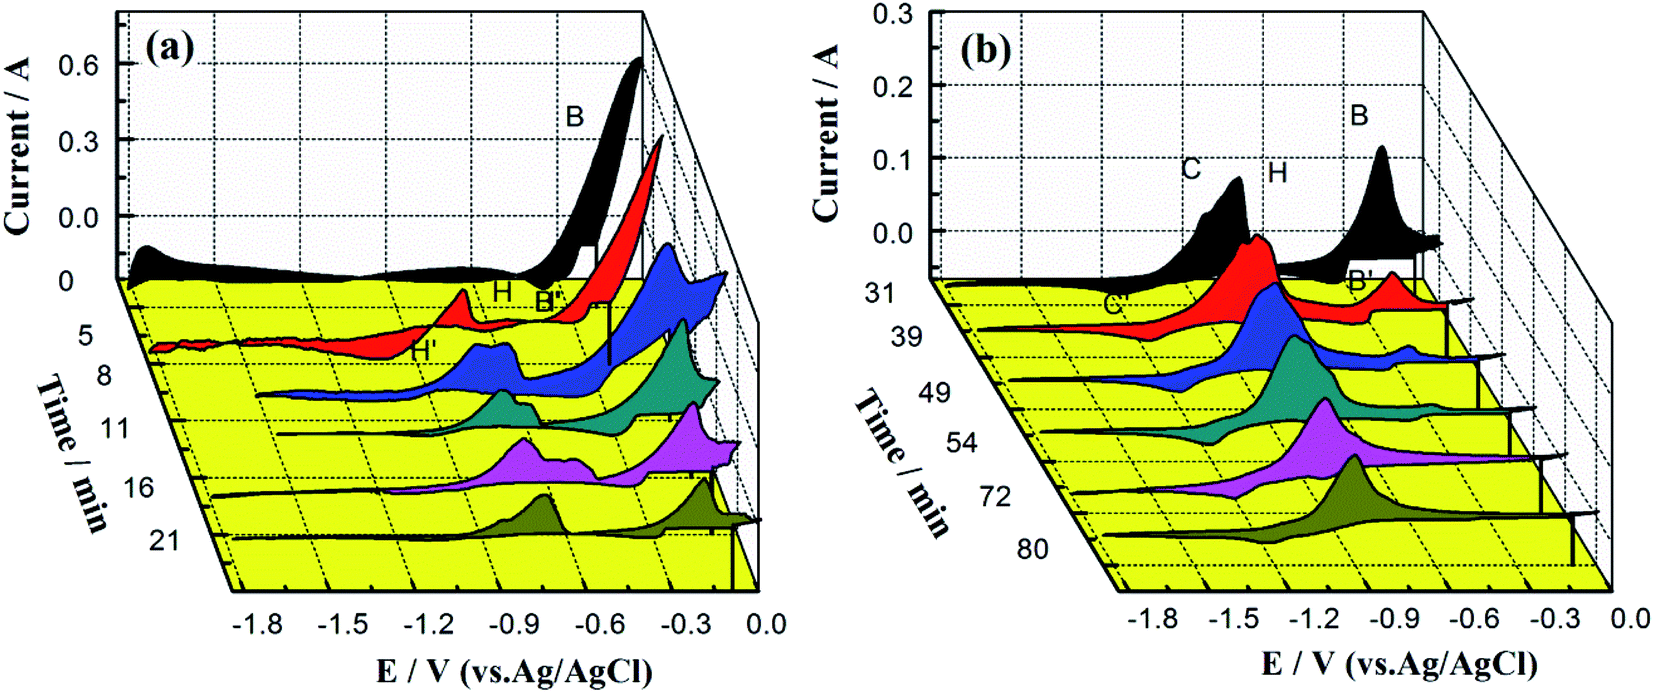 | ||
| Fig. 6 CVs of LiCl–KCl–CuCl (1.25 × 10⁻⁴ mol cm−3)–SnCl2 (6.22 × 10⁻⁵ mol cm−3) (molar ratio of Cu(I)/Sn(II) = 1:0.5) with excessive Zr spiral at different times (a) 0–21 min, (b) 31–80 min during the chlorination reaction on the molybdenum electrode (S = 0.628 cm2) at 500 °C. Scan rate: 0.10 V s−1. | ||
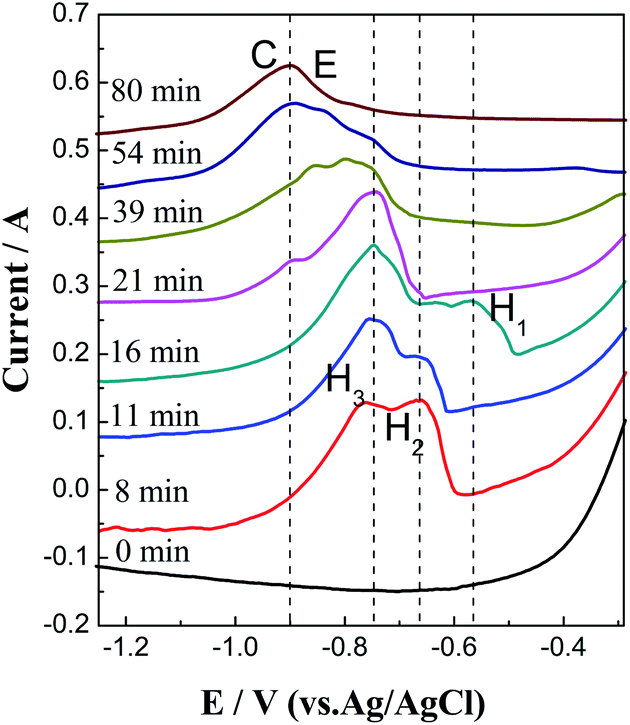 | ||
| Fig. 7 High-resolution CVs of anodic peaks in Fig. 6 at a potential between −1.20 and −0.25 V. | ||
Compared with our previous works, peaks H1, H2, and H3 should be the oxidation peaks of Cu–Zr and Sn–Zr alloys. Further analyses of the peak shape and position show that they mainly represent Cu–Zr alloys. This is because the molar mass of Cu(I) in the melt is twice that of Sn(II). Even if the reaction speed between Cu(I) and Zr is higher, the concentration of Cu(I) in the melt is still higher than that of Sn(II).
Comparing the CV curves in Fig. 5 and 6 with different proportions of Cu(I)/Sn(II), it can be observed that when the molar ratio of Cu(I)/Sn(II) is 1:1, mainly the peaks of the Sn–Zr alloys are shown, which due to the reaction between Cu(I) and Zr is faster than Sn(II) and Zr. When the Cu(I)/Sn(II) molar ratio is 1:0.5, the peaks mainly represent Cu–Zr alloys, which is due to the increase in the concentration of Cu(I). Moreover, the reaction times are also different in the two cases; the latter (80 min) is faster than the former (190 min). There are two possible reasons: one is due to the different reaction rates between Cu(I), Sn(II) and Zr, and the other is due to the different proportions of Cu(I)/Sn(II). The effect of different ratios of Cu(I)/Sn(II) on the reaction time is analyzed in detail in Section 3.3. The similarity between the above-mentioned two cases is that after the chlorination reaction, only the oxidation peak of Zr ions remains in the CV curve, indicating that the chlorination reaction can proceed completely in both cases, and Cu(I) and Sn(II) have reacted with Zr completely, and the final molten salt contains only ZrCl4.
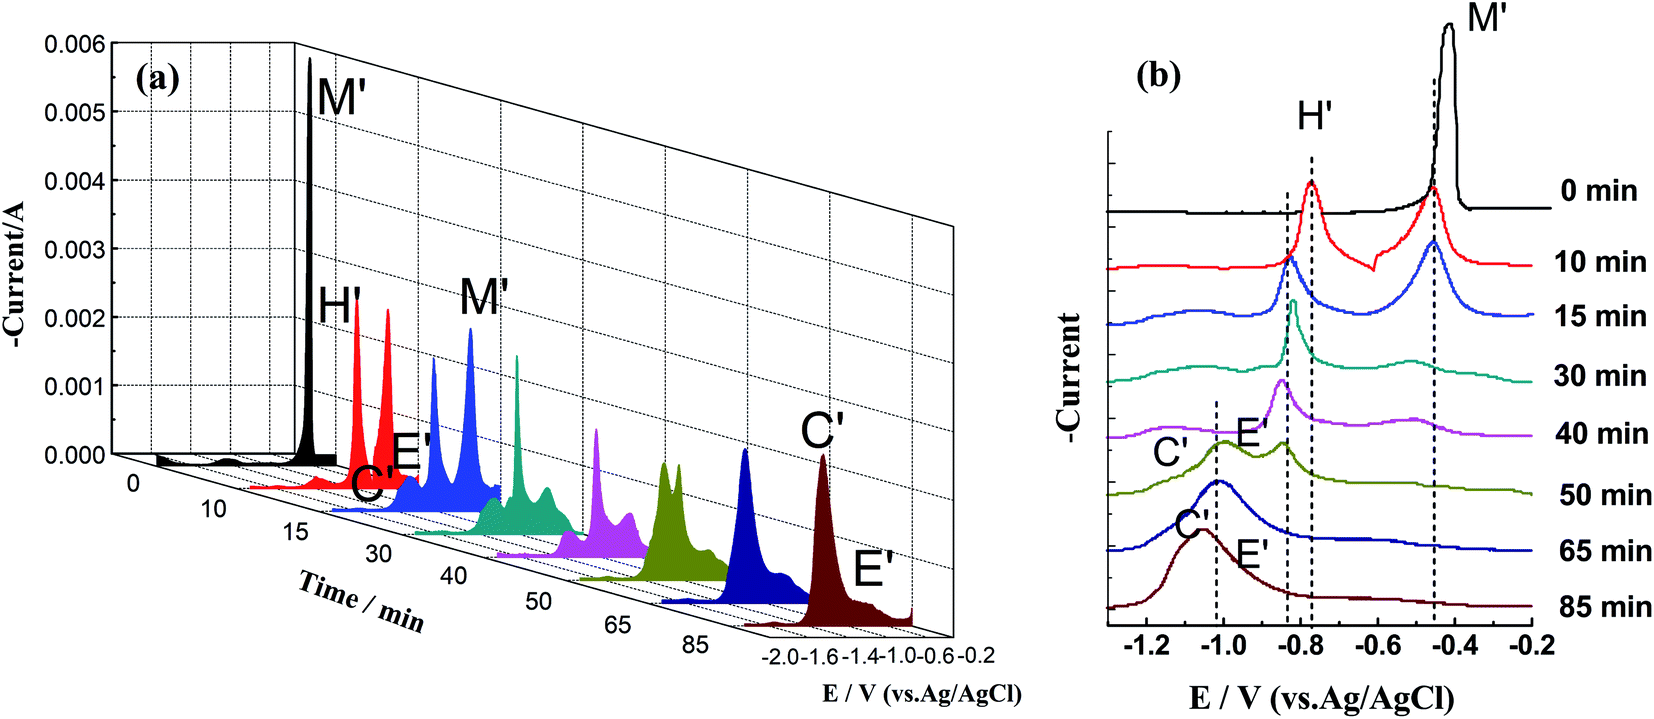
Fig. 8 shows a series of SWV curves detected at different times during the reaction between CuCl–SnCl2 and Zr in the LiCl–KCl–CuCl(1.10 × 10⁻⁴ mol cm−3)–SnCl2(1.09 × 10⁻⁴ mol cm−3) (molar ratio of Cu(I)/Sn(II) is 1:1) melt at a step potential of 1 mV and a frequency of 15 Hz. In Fig. 8(a), the peak potential and reaction time were taken as the X and Y coordinate axes, respectively. For ease of observation, the negative value of the peak current is taken as the positive direction of the Z-axis, and the peaks in the range of −0.65 to −1.25 V are enlarged and compared, as shown in Fig. 8(b).
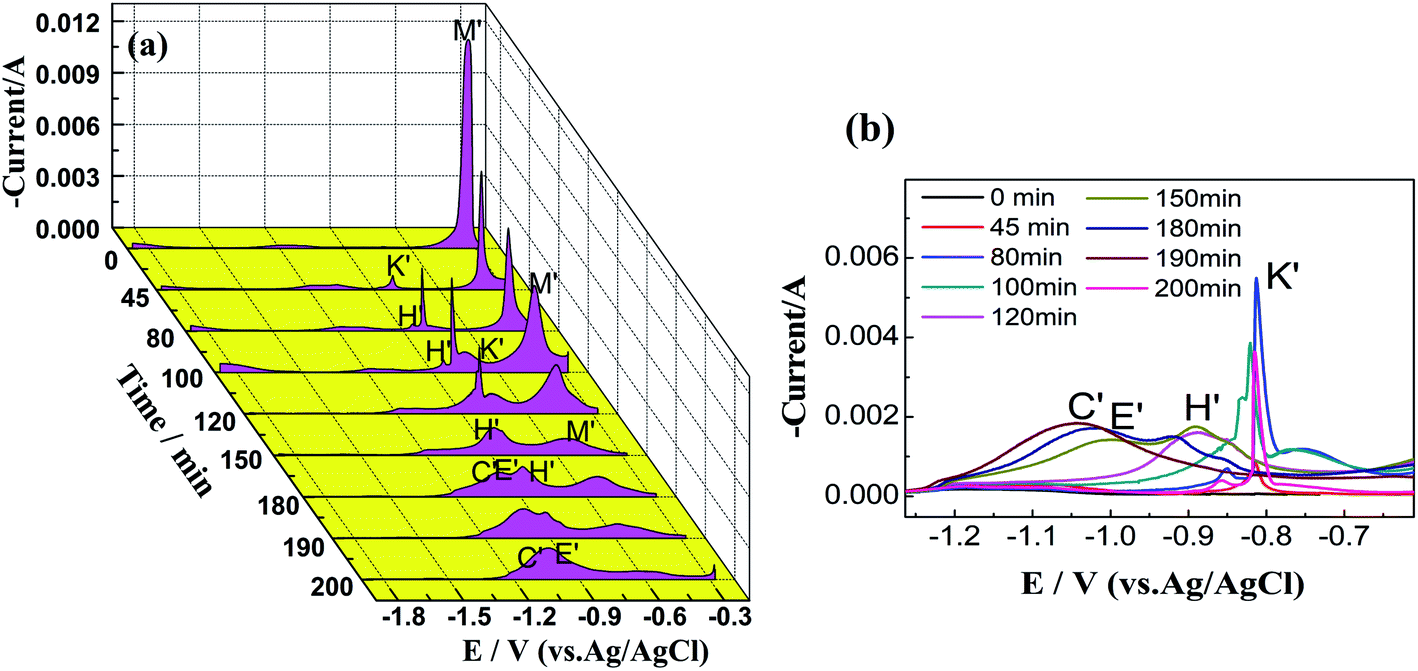 | ||
| Fig. 8 (a) SWVs of LiCl–KCl–CuCl (1.10 × 10⁻⁴ mol cm−3)–SnCl2 (1.09 × 10⁻⁴ mol cm−3) (molar ratio of Cu(I)/Sn(II) = 1:1) with excessive Zr spiral at different times during the chlorination reaction on Mo electrode (S = 0.628 cm2) at 500 °C. (b) High-resolution SWVs at a potential between −1.25 and −0.60 V. Frequency: 20 Hz, pulse height: 15 mV, potential step: 1 mV. | ||
Before the introduction of zirconium (0 min), it shows that reduction peak M′ appears at −0.40 V, which should be the deposition peaks of Cu, Sn and their alloys according to the CV results shown in Fig. 2. With the introduction of zirconium, the chlorination reaction begins, and reduction peak M′ begins to decrease gradually. When the chlorination reaction lasts 45 min, a new reduction peak, peak K′, appears at −0.80 V. In addition, as the reaction progresses, reduction peak H′ appears at −0.90 V, which is more negative than that of K′.
Comparing the peak potentials and shapes of K′ and H′ with our previous work on the chlorination reactions between Zr and CuCl, and between Zr and SnCl2, we can conclude that K′ represents the deposition peaks of Sn–Zr alloys, and H′ should be the peaks of Cu–Zr alloys.
This shows that with the progress of the chlorination reaction, the concentrations of Cu(I) and Sn(II) decrease, and Zr(IV) is generated and Sn–Zr and Cu–Zr alloys are formed. Among them, the deposition peaks of the Sn–Zr alloys are more obvious than those of the Cu–Zr alloys, and the reason is consistent with the explanation in the CV results.
With the prolonged reaction time, reduction peaks K′ and H′ first increase and then decrease. This is also caused by the change in the concentrations of Sn(II), Cu(I), and Zr(IV) ions in the molten salt. When the reaction progresses to 180 min, new reduction peaks C′ and E′appear. This is because when the reaction reaches a certain level, in addition to the formation of Sn–Zr and Cu–Zr alloys, excess zirconium deposits appear. In the later stage of the reaction, the peak currents of C′ and E′ increase gradually, while the peak currents of K′ and H′ weaken until they disappear. When the reaction progresses to 200 min, only peaks C′ and E′ remain, indicating that only Zr(IV) ions exist in the molten salt and Cu(I) and Sn(II) have reacted completely. The SWV results can well explain the changes in Cu(I), Sn(II) and Zr(IV) ions during the chlorination reaction from the reduction process and are well consistent with the CV results.
To further observe the progress of the chlorination reaction at different Cu(I)/Sn(II) ratios, SWV measurements were conducted after excess Zr was added to LiCl–KCl–CuCl(1.25 × 10⁻⁴ mol cm−3)–SnCl2(6.22 × 10⁻⁵ mol cm−3) (molar ratio of Cu(I)/Sn(II) is 1:0.5), as shown in Fig. 9. To better compare the positions of the peaks, the plan view of SWV curves in Fig. 9(a) was plotted in the range from −1.3 to 0.2 V and shown in Fig. 9(b). Similarly, before the introduction of zirconium (0 min), there is only one reduction peak at −0.40 V with high current intensity, corresponding to the reduction peaks of Cu, Sn and their alloys.
 | ||
| Fig. 9 (a) SWVs of LiCl–KCl–CuCl (1.25 × 10⁻⁴ mol cm−3)–SnCl2 (6.22 × 10⁻⁴ mol cm−3) (molar ratio of Cu(I)/Sn(II) = 1:0.5) with excessive Zr spiral at different times during the chlorination reaction on Mo electrode (S = 0.628 cm2) at 500 °C. (b) High-resolution SWVs at a potential between −1.30 and −0.10 V. Frequency: 20 Hz, pulse height: 15 mV, potential step: 1 mV. | ||
When the reaction progresses to 10 min, reduction peak M′ is reduced, and reduction peak H′ is obtained at −0.80 V, indicating that Zr(IV) has generated and formed Cu–Zr and Sn–Zr alloys. It can be inferred from the sharp shape that the alloys are mainly Sn–Zr alloys. As the reaction progresses, the peak current of H′ gradually decreases, and the peak potential shifts negatively at the same time. When the reaction reaches 50 min, the peak potential shifts negatively to −0.85 V, and the shape is no longer sharp, closer to the peaks of the Cu–Zr alloys.
From the above-mentioned results, it can be inferred that during the reaction process, the alloys deposited in the initial stage are mainly Sn–Zr alloys. As the reaction progresses, the relative content of the Cu–Zr alloys gradually increases. The possible reasons are as follows: on the one hand, although Cu–Zr and Sn–Zr alloys formed at the same time during the reduction process in the initial stage, it mainly shows Sn–Zr alloys due to the sharp peaks. On the other hand, although the reaction between Sn(II) and Zr is relatively slow, the content of Cu(I) in the molten salt is twice as high as that of Sn(II). In the later stage, the molten salt is still dominated by Cu(I).
:1, as shown in Fig. 10, the contents of Cu(I) and Sn(II) ions decrease rapidly in the initial stage of the reaction (0–30 min), while the content of Zr(IV) ions increases rapidly, indicating that the reaction is faster at this stage. The reaction is relatively gentle in the middle (30–250 min). The reaction rate can be explained by the law of mass action.13 When the reaction is prolonged to 190 min, Cu(I) and Sn(II) disappear in the molten salt (<0.01 mol%), and the Zr(IV) concentration reaches the highest value (0.24 mol%). With the increase in time period, the concentrations of Cu(I) and Sn(II) drop below the detection limit of the ICP-AES instrument. While the concentration of zirconium has a little drop, this reason is similar to the decrease in the concentration of zirconium in the later stage of the chlorination reaction between Zr and CuCl.13
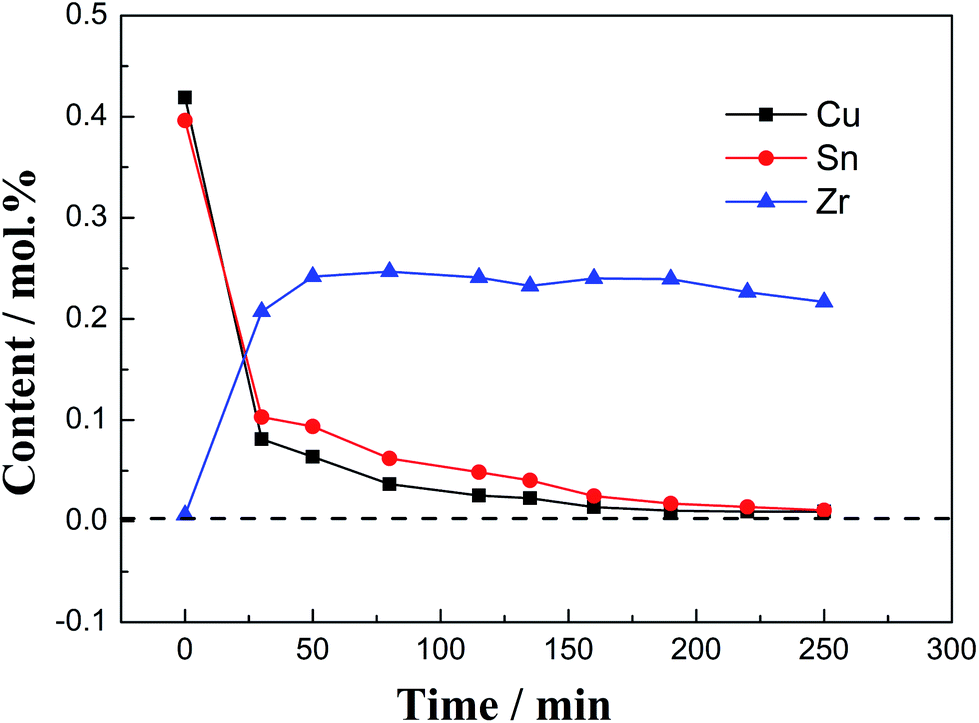 | ||
| Fig. 10 Concentrations of dissolved Cu(I), Sn(II), and Zr(IV)ions in LiCl–KCl–CuCl (1.10 × 10⁻⁴ mol cm−3)–SnCl2 (1.09 × 10⁻⁴ mol cm−3) (molar ratio of Cu(I)/Sn(II) = 1:1) melt with excessive Zr as a function of the chlorination reaction time. | ||
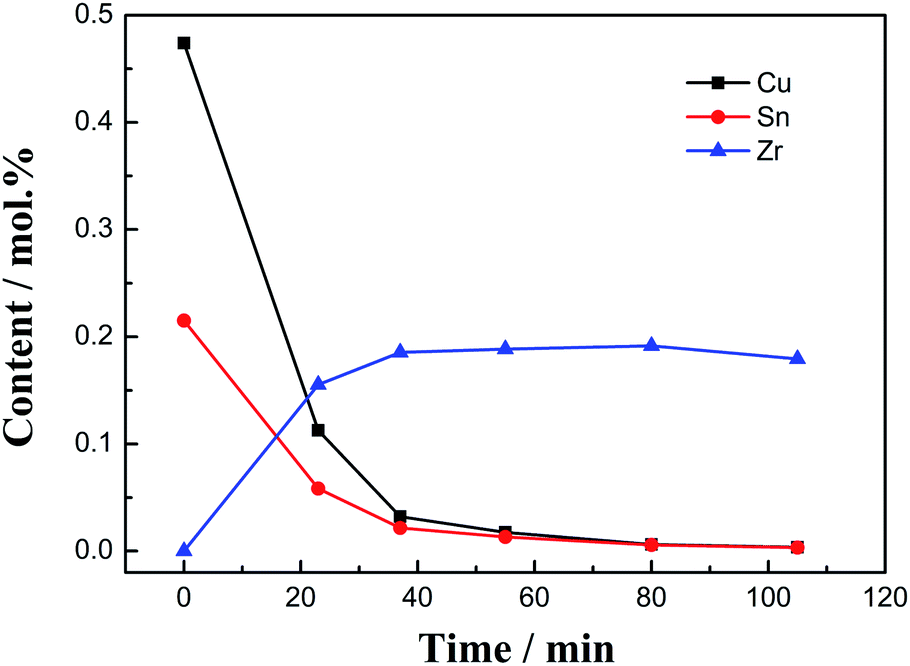 | ||
| Fig. 11 Concentrations of dissolved Cu(I), Sn(II), and Zr(IV) ions in LiCl–KCl–CuCl (1.25 × 10⁻⁴ mol cm−3)–SnCl2 (6.22 × 10⁻⁵ mol cm−3) (molar ratio of Cu(I)/Sn(II) = 2:1) melt with excessive Zr as a function of the chlorination reaction time. | ||
Moreover, when the molar ratio of Cu(I)/Sn(II) is 1:0.5, as shown in Fig. 11, the concentration change trend is the same, as the molar ratio of Cu(I)/Sn(II) is 1:1. Additionally, the concentrations of Cu(I) and Sn(II) decrease rapidly at the beginning, while the content of Zr(IV) increases rapidly. When the reaction reaches 80 min, Cu(I) and Sn(II) disappear in the molten salt (<0.01 mol%), and the concentration of Zr(IV) reaches the highest value (0.19 mol%).
Although the concentration of Cu(I) is twice that of Sn(II) at the beginning, as the reaction progresses, both concentrations decrease rapidly, while the concentration of Cu(I) is always higher than that of Sn(II) and the two are nearly coincident when the reaction reaches 55 min. This shows that although the chlorination reaction rate of Cu(I) and Zr is faster than that of Sn(II) and Zr, the reaction speed of the former cannot exceed twice that of the latter in a short time.
3.3 Effect of the Cu(I)/Sn(II) ratio on the chlorination reaction time and products
To further study the principle of the chlorination reaction between the CuCl–SnCl2 mixture and excess Zr, the effect of the Cu(I)/Sn(II) molar ratio on the chlorination reaction time and products was investigated, as shown in Table 1. When a certain concentration (0.25 mol%) of ZrCl4 is generated in theory, the theoretical addition amounts of CuCl and SnCl2 were also calculated and added, with molar ratios of CuCl/SnCl2 of 1:0, 0.66:0.17, 0.5:0.25, 0.33:0.34 and 0:1. Table 1 shows that when the reactant is only CuCl, the chlorination time is 40 min, which is much faster than the reaction time when only SnCl2 is added (170 min). This phenomenon can be explained by two factors. On the one hand, it was due to the high reaction activation energy of CuCl and Zr. On the other hand, it may be caused by the existence of replacement products. Sn is liquid at the experimental temperature, and Zr will be wrapped by liquid Sn, which virtually reduces the contact area of the reaction and further hinders the progress of the reaction. The replaced Cu is powdery and deposited at the bottom of the crucible, which will not affect the reaction contact area of Zr.
| No. | CuCl/mol% | SnCl2/mol% | Reaction time/min | Main products | Theoretical ZrCl4/mol% | Actual ZrCl4/mol% |
|---|---|---|---|---|---|---|
| a Cux1Sny1 stands for Cu327.9Sn88.08, and Cux2Sny2 stands for Cu6Sn5. | ||||||
| (1) | 1 | 0 | 40 | Cu, Zr | 0.25 | 0.22 |
| (2) | 0.66 | 0.17 | 50 | Cux1Sny1, SnxZry | 0.25 | 0.23 |
| (3) | 0.5 | 0.25 | 80 | Cux1Sny1, SnxZry, CuxZry | 0.25 | 0.22 |
| (4) | 0.33 | 0.34 | 140 | Cux2Sny2, SnxZry | 0.25 | 0.22 |
| (5) | 0 | 0.5 | 170 | Sn, SnxZry | 0.25 | 0.23 |
With the change in CuCl/SnCl2 molar ratios, there is a decrease in the relative content of CuCl; the reaction times are 50, 80 and 140 min for CuCl/SnCl2 molar ratios of 0.66:0.17, 0.5:0.25 and 0.33:0.34, respectively. Obviously, when the ratio is 0.33:0.34, the chlorination reaction time is longer than those of the former two molar ratios. This difference may be caused by the difference in the products produced during the reaction. Fig. 12 shows the XRD results of the products in the chlorination reaction of several experiments in Table 1. The results indicate that when the molar ratios of CuCl and SnCl2 are 0.66:0.17 and 0.5:0.25, the chlorination product is mainly Cu327.9Sn88.08 and a small amount of CuxZry and SnxZry. When the molar ratio is 0.33:0.34, the chlorination product is mainly Cu6Sn5 and a small amount of CuxZry and SnxZry. The Cu–Sn phase diagram in Fig. 3 shows that Cu327.9Sn88.08 should be a mixture of Cu3Sn and Cu4Sn alloys, which are formed during the cooling process and both are solid at an experimental temperature of 500 °C. Due to spontaneous coupling between the alloys, the chlorination reaction is promoted, and the time is shortened. While Cu6Sn5 is liquid at 500 °C, Zr is wrapped during the reaction and hinders the reaction. As a result, the reaction time is slightly longer.
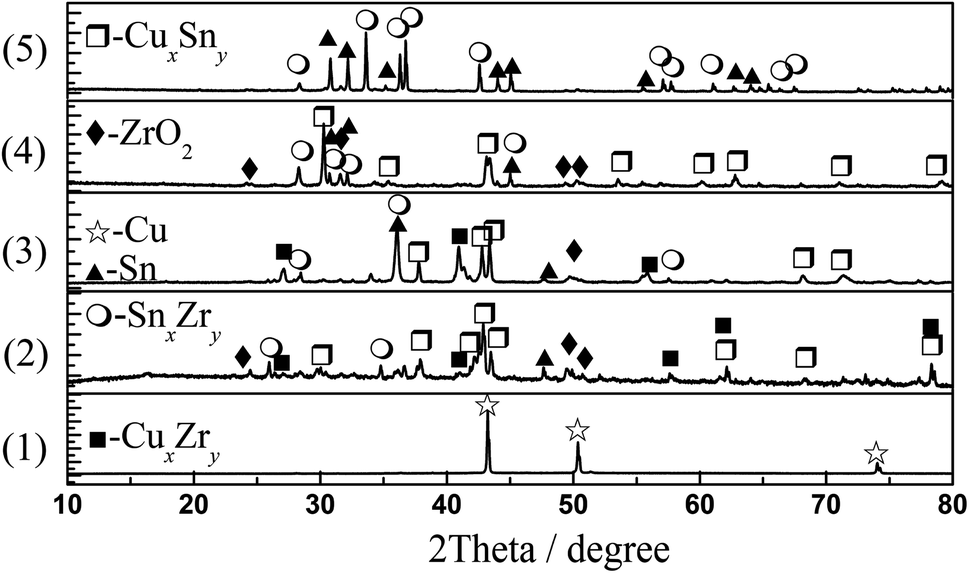 | ||
| Fig. 12 XRD patterns of products obtained at different molar ratios of CuCl/SnCl2 in Table 1. | ||
In addition, the concentration of ZrCl4 generated by the chlorination reaction in the molten salt was tested by ICP-AES analysis, as shown in Table 1. Compared with the theoretical concentration of 0.25 mol%, the actual ZrCl4 concentration of 0.22–0.23 mol% is slightly lower. This is also caused by the neutralization reaction between ZrCl4 and Zr, producing ZrCl2. ZrCl2 is unstable and disproportionately decomposes into ZrCl4 and Zr. The generated Zr easily forms alloys with Cu and Sn, so a small amount of SnxZry and CuxZry alloys are found in the chlorination products. In the actual refinement process, these products will return to the liquid anode alloy without causing pollution or waste.
Overall, Table 1 shows that as the relative content of CuCl decreases and that of SnCl2 increases, the chlorination reaction time gradually increases. This is because CuCl and SnCl2 take different times to react with Zr, which results in different times for the addition ratio of the two. In addition, Cu and Sn are generated when CuCl and SnCl2 participate in chlorination reactions and simultaneously form Cu–Sn compounds. When the introduction ratio of CuCl and SnCl2 is 0.66:0.17 and 0.5:0.25 respectively, the coupling effect caused by the formation of intermetallic compounds will promote the chlorination reaction.28
4 Conclusions
The electrochemical behavior of the CuCl–SnCl2 mixture was investigated by cyclic voltammetry and square wave voltammetry. The reduction potentials of Cu(I) and Sn(II) on CV curves are −0.49 and −0.36 V, respectively, which are relatively close. When the two coexist in molten salt, the reduction potentials almost overlap. The co-chlorination reaction between the CuCl–SnCl2 mixture and Zr was also studied by monitoring the concentration changes in Cu(I), Sn(II) and Zr(IV) ions in situ by electrochemical methods and ICP-AES analysis. Regardless of the ratio of Cu(I) to Sn(II), the electrochemical results indicate that the concentration of Zr(IV) ions increases gradually and reaches a maximum value with the prolonged chlorination reaction, while the concentration of Cu(I) and Sn(II) decreases rapidly until the electrochemical signals disappear. When the molar ratio of Cu(I) to Sn(II) is 1:1, the concentration of Cu(I) decreases faster than that of Sn(II). While the molar ratio is 1:0.5, both concentrations decrease rapidly as the reaction progresses, but the Cu(I) concentration is always higher than that of Sn(II). Although the chlorination reaction of Cu(I) and Zr is faster than that of Sn(II) and Zr, the reaction speed of the former cannot exceed twice that of the latter in a short time. As the introduced proportion of CuCl to SnCl2 changes from 1:0 to 0:1, the chlorination reaction time increases from 40 to 170 min. Cu and Sn are generated and Cu–Sn alloys are formed at the same time. When the introduction ratio of CuCl to SnCl2 is 0.66:0.17 and 0.5:0.25, the coupling effect caused by the formation of alloys will promote the chlorination reaction. The research results provide a theoretical basis for the recycling and electrolytic refining of zirconium.
Author contributions
Yanqing Cai: investigation, writing – original draft, writing – review & editing. Xinggang Chen: writing – review & editing. Ying Xu: supervision. Qian Xu: investigation, resources.Conflicts of interest
The authors declare that they have no conflict of interest.Acknowledgements
The authors acknowledge the financial support of the National Natural Science Foundation of China (Grant No. 51804124), Hebei Natural Science Foundation of China (Grant No. E2017209128 and E2020209097), and Science and technology project of Tangshan City (21130229C). We would like to thank AJE (http://www.aje.com) for English language editing.References
- R. Roper, M. Harkema, P. Sabharwall, C. Riddle, B. Chisholm, B. Day and P. Marotta, Ann. Nucl. Energy, 2022, 169, 108924 CrossRef CAS.
- L. Xu, Y. Xiao, A. V. Sandwijk, Q. Xu and Y. Yang, J. Nucl. Mater., 2015, 466, 21–28 CrossRef CAS.
- W. Han, W. Wang, H. Li, Y. Zhao, Y. Wang, R. Liu and M. Li, ACS Sustainable Chem. Eng., 2021, 9, 17393–17402 CrossRef CAS.
- Y. Q. Cai, X. G. Chen, Q. Xu and Y. Xu, R. Soc. Open Sci., 2019, 6, 181278 CrossRef CAS PubMed.
- C. H. Lee, K. H. Kang, M. K. Jeon, C. M. Heo and Y. L. Lee, J. Electrochem. Soc., 2012, 159, D463–D468 CrossRef CAS.
- K. T. Park, T. H. Lee, N. C. Jo, H. H. Nersisyan, B. S. Chun, H. H. Lee and J. H. Lee, J. Nucl. Mater., 2013, 436, 130–138 CrossRef CAS.
- C. Y. Li, W. Han, M. Li, W. Wang and X. G. Yang, Int. J. Electrochem. Sci., 2018, 13, 11795 CrossRef CAS.
- D. Quaranta, L. Massot, M. Gibilaro, E. Mendes, J. Serp and P. Chamelot, Electrochim. Acta, 2018, 265, 586–593 CrossRef CAS.
- P. J. Sohn Sungjune and H. Il Soon, Int. J. Electrochem. Sci., 2018, 13, 3897–3909 CrossRef.
- W. Han, W. Wang, M. Li, J. Wang, Y. Sun, X. G. Yang and M. L. Zhang, Sep. Purif. Technol., 2020, 232, 115965 CrossRef CAS.
- L. Ding, Y. Yan, V. Smolenski, A. Novoselova, Y. Xue, F. Ma and M. Zhang, Sep. Purif. Technol., 2021, 279, 119683 CrossRef CAS.
- Y. Xiao, A. V. Sandwijk, Y. Yang and V. Laging, Molten Salts Chem. Technol., 2014, 389–401 Search PubMed.
- Y. Cai, H. Liu, Q. Xu, Q. Song and L. Xu, Electrochim. Acta, 2015, 161, 177–185 CrossRef CAS.
- Y. Q. Cai, X. G. Chen, Q. Xu and Y. Xu, Int. J. Electrochem. Sci., 2018, 13, 10786–10797 CrossRef CAS.
- J. Park, S. Choi, S. Sohn, K. Kim and I. S. Hwang, J. Electrochem. Soc., 2014, 161, H97–H104 CrossRef CAS.
- T. Murakami and T. Kato, J. Electrochem. Soc., 2008, 155, E90–E95 CrossRef CAS.
- S. A. Kuznetsov, H. Hayashi, K. Minato and M. Gaune-Escard, J. Electrochem. Soc., 2005, 152, C203–C212 CrossRef CAS.
- S. Ghosh, S. Vandarkuzhali, N. Gogoi, P. Venkatesh, G. Seenivasan, B. P. Reddy and K. Nagarajan, Electrochim. Acta, 2011, 56, 8204–8218 CrossRef CAS.
- Y. Q. Cai, H. X. Liu, Q. Xu, Q. S. Song and H. J. Liu, RSC Adv., 2015, 5, 31648–31655 RSC.
- A. Avery, A Handbook Of Phase Diagrams Materials Science And Technology, Tritech Digital Media, 2018 Search PubMed.
- Y. Sakamura, J. Electrochem. Soc., 2004, 151, C187 CrossRef CAS.
- H. Groult, A. Barhoun, H. El Ghallali, S. Borensztjan and F. Lantelme, J. Electrochem. Soc., 2008, 155, E19–E25 CrossRef CAS.
- Z. Chen, Y. J. Li and S. J. Li, J. Alloys Compd., 2011, 509, 5958–5961 CrossRef CAS.
- J. Park, S. Choi, S. Sohn, K. R. Kim and I. S. Hwang, J. Electrochem. Soc., 2013, 161, H97–H104 CrossRef.
- Y. Cai, H. Liu, X. Qian, Q. Song and X. Liang, Int. J. Electrochem. Sci., 2015, 10, 4324–4334 CAS.
- H. L. Cha and J. I. Yun, Electrochem. Commun., 2017, 84, 86–89 CrossRef CAS.
- L. Xu, Y. Xiao, Q. Xu, A. V. Sandwijk, Z. Zhao, Q. Song, Y. Cai and Y. Yang, J. Nucl. Mater., 2017, 488, 295–301 CrossRef CAS.
- Y. D. Yan, Y. L. Xu, M. L. Zhang, Y. Xue, W. Han, Y. Huang, Q. Chen and Z. J. Zhang, J. Nucl. Mater., 2013, 433, 152–159 CrossRef CAS.
| This journal is © The Royal Society of Chemistry 2022 |