DOI:
10.1039/D1RA08786J
(Paper)
RSC Adv., 2022,
12, 4780-4794
DOE-based synthesis of gellan gum-acrylic acid-based biodegradable hydrogels: screening of significant process variables and in situ field studies
Received
2nd December 2021
, Accepted 14th January 2022
First published on 9th February 2022
Abstract
The current study uses the free radical graft copolymerization of acrylic acid as a monomer, N,N-methylene-bis-(acrylamide) as a crosslinker and ammonium persulfate as an initiator to synthesise GG-cl-poly(AA) hydrogels based on gellan gum utilising response surface methodology (RSM). A full factorial design was used to obtain the greatest percent swelling (Ps), and key process variables were determined using the Pareto chart. To make the procedure cost-effective, a multiple regression model employing ANOVA projected a linear model with a maximum percentage swelling of 556 at the lowest concentration of all three studied factors. As a result, the sequential experimental design was successful in obtaining two-fold increases in the percentage swelling in a systematic way. An RSM-based central composite design was used to optimize the percentage swelling of the three most important synthesis parameters: initiator concentration, monomer concentration, and crosslinker concentration. The best process conditions are 7.3 mM L−1 initiator, 44 μM L−1 monomer, and 21.6 mM L−1 crosslinker. The effective synthesis of GG-cl-poly(AA) was validated by Fourier transform infrared spectroscopy (FTIR), X-ray diffraction, field emission scanning electron microscopy (FE-SEM), and 1H-nuclear magnetic resonance. The swelling behavior of GG-cl-poly(AA) in water and saline solutions, as well as its water retention capability, was investigated. In comparison to distilled water, the swelling potential of optimized hydrogel was shown to be significantly reduced in saline solutions. The addition of GG-cl-poly(AA) significantly improved the moisture properties of plant growth media (clay, sandy, and clay–soil combination), implying that it has great potential in moisture stress agriculture. GG-cl-poly(AA) biodegradation was studied by soil burial and vermicomposting methods. The composting approach showed 89.95% deterioration after 22 days, while the soil burial method showed 86.71% degradation after 22 days. The synthesized hydrogel may be beneficial for agricultural applications because of its considerable degradation behaviour, strong water retention capacity, low cost, and environmental friendliness.
Introduction
Due to the rapid depletion of groundwater reserves, the unpredictability of rainfall in the arid and semiarid regions of the world, and the world's growing population, efficient use of water resources for agriculture has become increasingly important. Superabsorbent hydrogels (SAHs) have recently been proposed as a new way to increase the efficiency of water consumption in agricultural operations.1 Several strategies have been used to improve the quality of agricultural water utilisation. In farming regions, hydrogel materials, especially SAHs, are frequently investigated for water saving and soil conditioning.2,3 SAHs are hydrogels that can absorb multiple times their own weight in water. SAHs absorb and hold a substantial amount of water during rainfall/irrigation, acting as an additional porous water reservoir. During droughts, the absorbed water in the SAHs is released into the soil when the soil dries, allowing plant roots to absorb it. During droughts, the SAHs hold drainage water, lowering the frequency of watering and thereby conserving water. Their huge surface area adds more pores to the soil matrix, which improves soil breathing and keeps nutrients in the soil, promoting plant growth.4,5 Due to their hydrophilic nature and the availability of free carboxylic groups, these SAHs can also operate as humic materials when mixed with soil in arid/semiarid zone soils.
These characteristics make SAH a suitable candidate for water conservation in agriculture. In addition, SAHs can affect the physical properties of the soil, such as increasing the permeability and penetration rates, reducing soil erosion and surface runoff, and increasing cation exchange capacities. A majority of SAHs, however, are solely made of petroleum-based polymers, which have been shown to be expensive, poorly biodegradable, and harmful to the environment.6 AqualicTM, LuquasorbTM, StockosorbTM, and other industrial SAHs are now employed in agriculture.7 The biggest concern with their use is that they are not completely biodegradable, and the by-products of their breakdown can be harmful to the environment and cause serious problems.8 Furthermore, their existence in the ecosystem has been discovered to be the primary source of solid waste pollution. As a result, there is a pressing need to investigate certain specialised and capable SAHs that are green, non-toxic, and biodegradable, and that boost agricultural yield and production while increasing the water retention capacity and biodegradability. They have attracted much attention in agricultural applications because of their beneficial qualities such as non-toxicity, low manufacturing cost, environmental safety, and biodegradability.9,10 Furthermore, their degrading components produce environmentally acceptable by-products such as CO2, CH4, and H2O at the end of their life cycle.11 SAHs are extensively documented to be used in the restoration of arid and desert environments as water-saving materials.12 Both academics and industries have been paying close attention to the use of polysaccharides and alternatives for petroleum-based polymers.
A gum gellan (GG)-based microbial polysaccharide derived from Pseudomonas elodea, a linear anionic polymer containing a [(3)-â-D-glucose-(1,4)-â-D-glucuronic acid-(1,4) â-D-glucose (1,4)-R-L-rhamnose-(1)] repeating unit and a –COOH group in glucuronic acid, is responsible for gelation.13,14 It is one of the most important biopolymers because of its biocompatibility and biodegradability. It is widely used in a range of fields including food industry, biotechnology, special purpose textile materials, and controlled release devices for biomedical applications.15,16 Graft copolymerization is a simple approach to change the structure of polysaccharides, allowing them to be used in a wide range of applications. Distinct ways to making graft copolymers require different processes for creating free radical sites on prefabricated polymer backbones. There are few studies on the synthesis of GG-based graft copolymers in the literature. Vijan et al.17 studied the utilisation of an acrylamide-grafted-gellan gum in drug delivery. Sabadini et al.18 examined the role of biodegradable hydrogels made by crosslinking high acetyl GG and chitosan in soil humidity management and fertilizer release. Pandey et al.19 used graft copolymerization with N,N-dimethyl acrylamide to investigate the metal adsorption and flocculation behaviour of the gellan gum. We previously reported the synthesis of a gum gellan-cl-poly(acrylic-co-methacrylic acid) hydrogel for the removal of cationic dyes.20 Karthika et al.21 used microwave irradiation to synthesise a polyaniline (PANI)-grafted GG electrical conductive biopolymer.
To our knowledge, no research on the RSM-mediated synthesis of GG-based hydrogels with better swelling has been done. The reaction conditions were screened and optimised using the response surface methodology (RSM) to get the maximum percentage swelling of the grafted copolymer. Not only is the traditional optimization technique, known as “single-parameter optimization,” inefficient and time-consuming, but it also ignores the cumulative interactions between the independent variables. It is also possible to misread the results while using this old method. The RSM was used to portray the overall influence of process factors (monomer concentration, initiator concentration, solvent, and so on) utilising a set of mathematical and statistical methodologies to resolve these challenges. It also has the ability to optimise processes with a small number of experimental runs.22–25 Several researchers have utilised the RSM method to evaluate the process parameters in preparation trials,26–30 as well as to optimise the chemical and physical properties of prepared SAHs.31,32 SAHs may carry a substantial amount of water within their 3-D cross-linked structure, according to the current study. The presence of many hydrophilic groups connected to its backbone can increase the water-holding capacity of the surrounding soil. SAH application limited water inside the root zone by reducing evaporation from the soil and percolation of water into the deeper layer.33 The swelling capacity of SAHs was found to be strongly influenced by soil salinity. In addition, when compared to commercial-grade SAH, laboratory-produced SAH had a greater biodegradability rate.34 The purpose of this study was to use acrylic acid to improve the properties of gum gellan-based SAH, making them more appropriate for agricultural uses.
Experimental design
Materials and methods
Gellan gum (GG) [backbone], acrylic acid (AA) [monomer] and N,N′-methylene bisacrylamide (MBA) [crosslinker] were purchased from Central Drug House [CDH] Ltd, India. Ammonium persulfate (APS) [initiator] was obtained from Sigma-Aldrich. Throughout the process, distilled water was employed as a solvent.
Microwave-assisted synthesis of GG-cl-poly(AA)
The GG-cl-poly(AA) was made utilizing the RSM-CCD techniques to find the best process variables, with the percentage swelling as the criterion for free radical polymerization. In 6 mL of distilled water, known amounts of gum gellan and ammonium persulfate were dissolved. Acrylic acid was added to the reaction mixture, followed by N,N′-methylenebis(acrylamide), and the mixture was continually agitated to obtain a homogeneous solution. In a laboratory microwave oven, the homogenous reaction mixture was microwaved at a given microwave power and exposure duration. The obtained hydrogel was taken out of the microwave and allowed to cool for 10 minutes. After that, it was washed in 10 mL of distilled water. Finally, the SAH was dried at 60 °C in an oven.
Instrumentation
PerkinElmer's Spectrum RX-IFTIR was used to record the structure of the samples. Powdered samples were combined with KBr (spectroscopic grade) before being pressed into 1 mm pellets. The samples' spectra were recorded at 4 cm−1 resolutions, with 32 scans averaged to decrease noise. The spectra were then reduced to only cover the region of 4000 to 400 cm−1. An electronic balance (LIBROR AEG-220, Shimadzu) was used to weigh the items. XRD patterns of polymers were recorded using an Analytical, Netherlands X-ray diffractometer with Cu-Kα radiations for a range of Bragg's angle 2θ (5° < θ < 160°) at a scanning rate of 1° min−1. An FESEM Hitachi SU8010 series was used to examine the surface morphology of the samples. A 1H NMR Cryo-magnet Spectrometer 400 MHz (Bruker) was used to exactly determine its chemical structure. The chemical shift was measured in parts per million (ppm) using tetramethylsilane as a standard.
Response surface optimal design
A response surface optimal design was chosen to investigate the relationship between three process variables and compute the best conditions for achieving the highest percentage swelling (Ps). The initiator, monomer, and crosslinker were the independent variables studied. In the experiment, Ps was used as a response variable. The variable's ratio was chosen based on a preliminary investigation conducted in a previous study.20 Regression analysis (R2) and ANOVA analysis (p < 0.05) were used to verify the factorial model, and significant variables were identified based on the p-value. The importance of the regression coefficients was analysed using Pareto charts, and the simplified model was confirmed by deleting significant terms. Response surface plots were found to be quite useful in analysing the interaction between process factors as well as Ps during synthesis. A factorial design was used to investigate the significant variables further. The RSM approach was used to produce response plots and process optimization using the model results.
Swelling behaviour
To attain the highest Ps, the RSM model was used to optimise the various reaction conditions. After every 1 hour, the swelling behaviour of 0.2 g of hydrogel soaked in 10 mL of distilled water was investigated. The hydrogel was then wiped with a piece of tissue paper and weighed using a measuring balance for a set time. The procedure was repeated until an equilibrium value of Ps was reached. The Ps was calculated using eqn (1) as follows:| |
 | (1) |
where Ws and Wd are the weights of the functionalized polymer backbone for swelled and dry samples, respectively.
Salt solution absorbency measurement
By immersing 0.2 g of dried material in aqueous solutions of various strengths of sodium chloride salt solutions for 24 hours at room temperature, the swelling behaviour in saline solutions was investigated. Then, 10 mM, 50 mM, 100 mM, and 500 mM salt solutions were utilised in this experiment. The swelled gel was weighed after 24 hours, and Qt was determined using the following equation:| |
 | (2) |
where M0 (g) and Mt (g) are the weights of the samples in the dry and swollen states (in saline solutions) at a given time.
Water retention capacity
The effect of a synthetic hydrogel on the water holding capacity of numerous soils including sandy soil, clay, and a mixture of the two was tested. In a plastic cup, 0.5 g dried crosslinked polymer was weighed and combined with 50 g dry soil. Then, 15 mL tap water was carefully dripped into the beaker, and the entire container was weighed (Wi). The experiment also included a control sample of untreated soil. The container was kept at room temperature and weighed at a predetermined time interval (Wf) to ensure that there was no weight loss. The percentage water retention (WR%) of soil was calculated using eqn (3) as follows:| |
 | (3) |
where WR% is the soil water retention, and Wi, Wf and V are the initial weight of the container, final weight of the container and volume of water taken, respectively.
Biodegradation studies of GG-cl-poly(AA) by using soil burial and vermi-composting methods
Vermi-composting and soil burial methods were used to study the degradation of GG-cl-poly(AA). Vermicompost was bought from a local vendor in Chandigarh, India, for the composting method of biodegradation, while garden soil was taken from one of Panjab University's gardens in Chandigarh, India, for the soil burial biodegradation method. Vermicompost is the product of a decomposition process involving a variety of worm species, most commonly red wigglers, white worms, and other earthworms. As a result, to ensure their proper growth, vermicompost pots were regularly watered with water. The biodegradation study was carried out for 30 days. All pots contain an equal quantity of soil. The test samples were buried at 2 cm depth and at an equal distance of 3 cm and weighed as Wi. All samples were weighed equivalently and placed in the pots. After a predetermined time, one sample was removed from each pot, washed properly, dried, and carefully weighed. The surface morphology was further evaluated by FE-SEM and FTIR spectroscopy. The weight loss showed the extent of sample deterioration. SEM was used to record the surface alterations, and the percentage loss can be measured as follows:| |
 | (4) |
where Wi represents the initial weight of the hydrogel and Wf is the weight of the sample after 3 days.
Results and discussion
Reaction mechanism
Fig. 1 depicts the procedure for converting GG into GG-cl-poly(AA). The radical copolymerization sites are formed when the APS absorbs hydrogen from the GG's CH2OH group.35 As a result, under microwave radiations, the sulphate anion radical generated by homolytic cleavage of the APS initiator combines with the hydroxyl free radical to form the hydroxyl radical. The free radical then interacted with the monomer, causing poly(AA) to graft onto GG.36 In the presence of a crosslinker, the GG free radicals are chemically coupled to the monomer unit, resulting in a covalent bond between the poly(AA) and GG, allowing the chain reaction to propagate and produce a 3D network of GG-cl-poly(AA). Depending on the crosslinking density, the polymer becomes insoluble in water and forms a gel substance capable of storing water.26,37
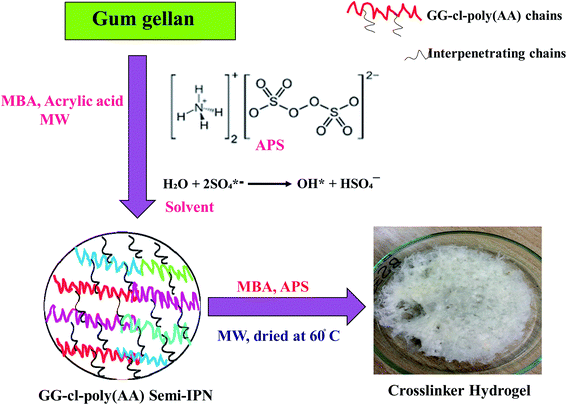 |
| | Fig. 1 Synthesis mechanism of the GG-cl-poly(AA) hydrogel. | |
Phase 1: historical data analysis to select the optimal range of process variables
Preliminary tests were carried out to determine the significant process variables (data not shown). Three process factors were evaluated at the maximum and lowest levels based on experience: (i) initiator (14.6–43.8) mM L−1, (ii) monomer (65–153) mM L−1, and (iii) crosslinker (32.4–75.6) mM L−1 (Table 1). The percentage swelling was used as the response variable in an analysis of variance (ANOVA) examination of the data. The best fit model was proposed using successive fitting of experimental data for linear, two-factor interaction (2FI), and quadratic models. However, out of the three factors, only the crosslinker was recommended as a relevant process variable (Table 2). At the lowest crosslinker concentration (32.4 mM L−1), the greatest Ps of 430 was achieved. The fitted ANOVA model is significant at p-value = 0.01 (F-value = 11.23 with degree of freedom = 1). The unitless regression coefficients are given in eqn (5) and actual process factors in eqn (6). The coded equation can be used to check the contribution of each variable by normalizing all the variables.| | |
Percent swelling (Ps) = +365.29 − 37.61 × crosslinker
| (5) |
where the crosslinker is in coded terms.| | |
Percent swelling (Ps) = 459.322 − 1.741 × crosslinker (mM L−1)
| (6) |
Table 1 Historical data analysis for the screening and range selection of process variables for maximizing Ps
| S. No. |
Factor-1 |
Factor-2 |
Factor-3 |
Response |
| Initiator (mM L−1) |
Monomer (μM L−1) |
Crosslinker (mM L−1) |
Percentage swelling (Ps) |
| Coded |
Actual |
Coded |
Actual |
Coded |
Actual |
| 1 |
1 |
43.8 |
1 |
153 |
1 |
75.6 |
358 |
| 2 |
−1 |
14.6 |
1 |
153 |
−1 |
32.4 |
396 |
| 3 |
1 |
43.8 |
−1 |
65 |
−1 |
32.4 |
430 |
| 4 |
0 |
29.2 |
0 |
109 |
0 |
54 |
326 |
| 5 |
−1 |
14.6 |
−1 |
65 |
1 |
75.6 |
334 |
| 6 |
0 |
29.2 |
0 |
109 |
0 |
54 |
318 |
| 7 |
−1 |
14.6 |
1 |
153 |
1 |
75.6 |
331 |
| 8 |
1 |
43.8 |
1 |
153 |
−1 |
32.4 |
426 |
| 9 |
1 |
43.8 |
−1 |
65 |
1 |
75.6 |
331 |
Table 2 (a) ANOVA table and (b) model statistics for the linear model showing only significant process variables
| (a) AVONA table |
| Source |
Sum of squares |
Degree of freedom |
Mean square |
F-Value |
p-Value |
| Significant at p-value <0.05. Not significant at p-value <0.05. |
| Model |
9745.92 |
1 |
9745.92 |
11.23 |
0.0122a |
| C – crosslinker |
9745.92 |
1 |
9745.92 |
11.23 |
0.0122a |
| Lack of fit |
6044.97 |
6 |
1007.49 |
31.48 |
0.1356b |
| (b) Model statistics |
| Standard deviation |
29.46 |
R2 |
0.6159 |
| Mean |
361.11 |
Adjusted R2 |
0.5611 |
| C. V. (%) |
8.16 |
Predicted R2 |
0.4279 |
| |
|
Adeq precision |
5.4160 |
Thus, a new full factorial 2-level 3-factor experimental design was proposed with 3 additional runs at a center point, with a total number of 11 experimental runs (Table 1).
Phase 2: a two-level full factorial design
In phase 2, three significant variables, namely, initiator concentration (7.3–22 mM L−1), monomer concentration (44–87 μM L−1), and crosslinker concentration (21.6–43.2 mM L−1), were investigated in a modified range with the percentage swelling as a response variable (Table 3). This sequential nature of the experimental design helps in achieving global maxima. Under new conditions, a percentage swelling of 556 was achieved (30% increase from phase-1) and at a minimum dose of all the three variables. As illustrated in Fig. 2a, a Pareto chart revealed that the crosslinker was highly significant, followed by the monomer and initiator. The actual vs. predicted plot (Fig. 2b) as per the fitted ANOVA model with a significant model at p = 0.01 (F-value = 8.06, df = 3). Lack of fit is non-significant at p-value = 0.266, which indicated a strong signal (Table 4). Moreover, the predicted R2 is well within an adjusted R2 value of 0.2. Thus, a fitted model can be navigated in the design space. The coded equation and actual regression equation are given in eqn (7) and eqn (8) respectively as follows:| | |
(Ps) = 392.45 − 35.37 × initiator − 50.87 × monomer − 54.37 × crosslinker
| (7) |
where Ps = percentage swelling, and all process variables are in coded units.| | |
Ps = 781.080 − 4.812 × initiator − 2.366 × monomer − 5.034 × crosslinker
| (8) |
where Ps = percentage swelling, and the initiator (mM L−1), monomer (μM L−1), crosslinker (mM L−1) are in actual units.
Table 3 Factorial designs with response values
| S. No. |
|
Factor-1 |
Factor-2 |
Factor-3 |
Response |
| Initiator (mM L−1) |
Monomer (μM L−1) |
Crosslinker (mM L−1) |
Percentage swelling (Ps) |
| Coded |
Actual |
Coded |
Actual |
Coded |
Actual |
| 1 |
Factorial |
−1 |
7.3 |
−1 |
44 |
−1 |
21.6 |
556 |
| 2 |
Factorial |
1 |
22 |
−1 |
44 |
−1 |
21.6 |
483 |
| 3 |
Factorial |
−1 |
7.3 |
1 |
87 |
−1 |
21.6 |
461 |
| 4 |
Factorial |
1 |
22 |
1 |
87 |
−1 |
21.6 |
356 |
| 5 |
Factorial |
−1 |
7.3 |
−1 |
44 |
1 |
43.2 |
398 |
| 6 |
Factorial |
1 |
22 |
−1 |
44 |
1 |
43.2 |
405 |
| 7 |
Factorial |
−1 |
7.3 |
1 |
87 |
1 |
43.2 |
365 |
| 8 |
Factorial |
1 |
22 |
1 |
87 |
1 |
43.2 |
253 |
| 9 |
Center |
0 |
14.65 |
0 |
65.5 |
0 |
32.4 |
349 |
| 10 |
Center |
0 |
14.65 |
0 |
65.5 |
0 |
32.4 |
316 |
| 11 |
Center |
0 |
14.65 |
0 |
65.5 |
0 |
32.4 |
375 |
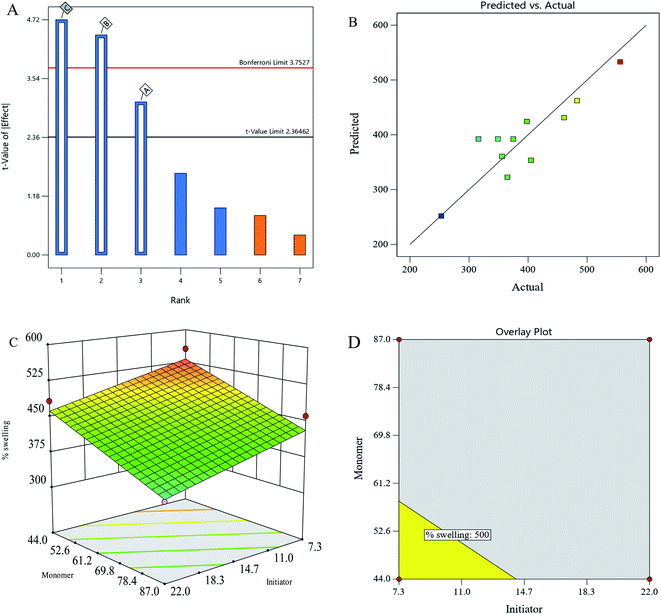 |
| | Fig. 2 (A) Pareto chart showing significant variables. (B) Actual vs. predicted plot of the fitted ANOVA model. (C) 3-D plot of the initiator and monomer vs. percentage swelling at a minimum crosslinker concentration. (D) Overlay plot showing the range of initiator and monomer concentrations to achieve 500% swelling (yellow) (A: initiator, B: monomer, C: crosslinker). | |
Table 4 (a) ANOVA table and (b) model statistics for the fitted linear model
| (a) AVONA table |
| Source |
Sum of squares |
Degree of freedom |
Mean square |
F-Value |
p-Value |
| Significant at p-value <0.05. Non-significant at p-value <0.05. |
| Model |
54370.38 |
3 |
18123.46 |
8.44 |
0.0100a |
| A-initiator |
10011.12 |
1 |
10011.12 |
4.66 |
0.0677a |
| B-monomer |
20706.12 |
1 |
20706.12 |
9.64 |
0.0172a |
| C-crosslinker |
23653.12 |
1 |
23653.12 |
11.02 |
0.0128a |
| Lack of fit |
13281.69 |
5 |
2656.34 |
3.04 |
0.2660b |
| (b) Model statistics |
| Standard deviation |
46.34 |
R2 |
0.783 |
| Mean |
392.45 |
Adjusted R2 |
0.690 |
| C. V. (%) |
11.81 |
Predicted R2 |
0.506 |
The 3-D plot of regression equation (Fig. 2c) showed the maximum swelling rate at the minimum range of the monomer and initiator. At the lowest crosslinker concentration, the highest percentage swelling of 550 is reached. Due to a time constraint, no further testing was done; however, according to the experimental design method, a new design should have a smaller number of variables to optimise the percentage swelling. If a researcher desires to attain a minimum of 500% swelling, the overlay plot suggested the process requirements.
To accomplish the desired percentage swelling under these constraints, an initiator of 14.5 mM L−1 and a monomer of 60 mM L−1 may be used (Fig. 2d). The range and the ideal process conditions are given in Table 5.
Table 5 Optimized process conditions
| |
Design type |
Range of variables |
Maximum% swelling |
Optimized process conditions |
| A: initiator (mM L−1), B: monomer (μM L−1), C: crosslinker (mM L−1) |
| Phase-1 |
Full factorial |
A: 14.6–43.8 |
430 |
A: 43.8 mM L−1 |
| B: 65–153 |
B: 65 μM L−1 |
| C: 32.4–75.6 |
C: 32.4 mM L−1 |
| Phase-2 |
Full factorial |
A: 7.3–22 |
556 |
A: 7.3 mM L−1 |
| B: 44–87 |
B: 44 μM L−1 |
| C: 21.6–43.2 |
C: 21.6 mM L−1 |
FTIR spectroscopy
Fig. 3 shows the FTIR spectra of gum gellan and GG-cl-poly(AA). A distinctive absorption signal for the carbonyl group appears at 1639 cm−1 for pure gellan, implying C![[double bond, length as m-dash]](https://www.rsc.org/images/entities/char_e001.gif) O stretching.38 The peak at 1026 cm−1 is ascribed to the N–H stretching and bending vibrations.39 Some differences were found in the GG-cl-poly(AA) range relative to gum. The infrared spectra of the grafted hydrogel indicated peak characteristics at 1711 cm−1, attributed to the acrylic acid carbonyl group stretching vibration, and at 1410 cm−1, attributed to the C–O–H bending vibration, both of which promote AA grafting on gellan gum.40 A prominent band detected at 1026 cm−1 for the CH–O–CH2 group confirms the grafting process between the OH group of gellan and the π bond of acrylic acid.41 Absorption peaks at 1413 cm−1 assigned to the –NH in-plane bending vibration of the (MBA) amide group further establish the formation of cross-linked hydrogels.42 The grafting of AA over the native polysaccharide was confirmed by the observation of extra bands and changing intensities.
O stretching.38 The peak at 1026 cm−1 is ascribed to the N–H stretching and bending vibrations.39 Some differences were found in the GG-cl-poly(AA) range relative to gum. The infrared spectra of the grafted hydrogel indicated peak characteristics at 1711 cm−1, attributed to the acrylic acid carbonyl group stretching vibration, and at 1410 cm−1, attributed to the C–O–H bending vibration, both of which promote AA grafting on gellan gum.40 A prominent band detected at 1026 cm−1 for the CH–O–CH2 group confirms the grafting process between the OH group of gellan and the π bond of acrylic acid.41 Absorption peaks at 1413 cm−1 assigned to the –NH in-plane bending vibration of the (MBA) amide group further establish the formation of cross-linked hydrogels.42 The grafting of AA over the native polysaccharide was confirmed by the observation of extra bands and changing intensities.
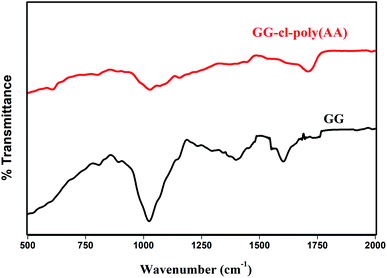 |
| | Fig. 3 FTIR spectra of GG and GG-cl-poly(AA). | |
1H-NMR spectroscopy
The 1H-NMR spectrum of gum gellan is depicted in Fig. 4. The signal at 1.302 ppm should be attributed to H-6 (methyl groups) of the converged and α and β anomers of L-rhamnopyranosyl residues. The methyl proton of the acetyl groups was attributed to the peaks at 2.187 and 2.159 ppm and the signal in the range of 3.8–4.9 ppm was ascribed to 2-acetylated D-glucopyranosyl, D-glucopyranosyl, and D-glucuropyranosyl residues.43 The peak at 4.50 ppm confirms the presence of the –CH– group of glucose, and a single bond –CH of glucuronic acid appears at 5.03 ppm and is found to be consistent with the reports in the literature.44,45 The two peaks at 2.50 and 3.30 δ are due to protons of DMSO and traces of moisture in DMSO.
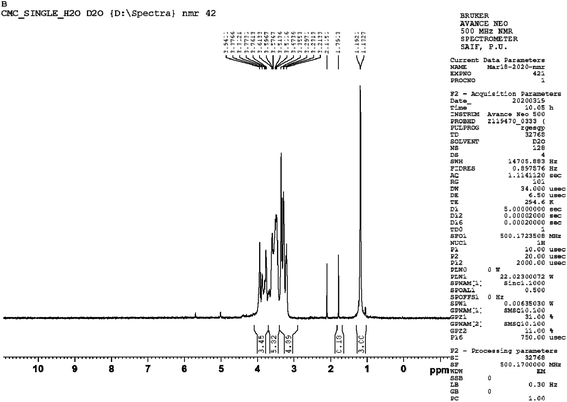 |
| | Fig. 4 1H-NMR spectra of GG. | |
XRD
Fig. 5 shows the XRD patterns of GG and GG-cl-poly(AA). Gum gellan is characterized by a wide peak at 2θ ∼ 19.37°. The lower intensity diffraction pattern of GG indicates its dominant amorphous character. The GG-cl-poly(AA) diffraction pattern, however, was distinct from gum gellan, indicating the formation of a cross-linked hydrogel network.46 The GG-cl-poly(AA) produces two major characteristic crystalline peaks at 2θ ∼ 21.13° and 2θ ∼ 26.67° respectively. A peak at 28° is also visible, indicating that GG has some crystalline content.47 In the case of GG-cl-poly(AA), the XRD peak changed toward a higher angle, intensified, and became wider. This indicates that GG-cl-poly(AA) converged toward a more ordered arrangement following grafting with AA.19,46 As a result, it adds to the evidence of crosslinking in gum gellan.
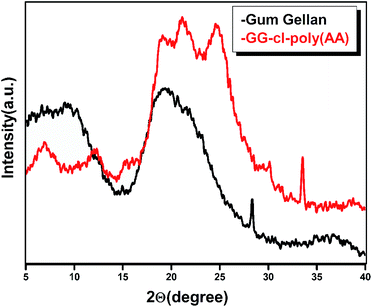 |
| | Fig. 5 XRD pattern of GG and GG-cl-poly(AA). | |
Surface morphological analysis (SEM)
Grafting causes morphological alterations by distorting the size and surface of polysaccharide particles. FE-SEM was used to examine the morphology of gum gellan and GG-cl-poly(AA), as shown in Fig. 6. Their morphology has changed significantly.46 The surface of the GG seems fibrous and has fractures all over. However, GG-cl-poly(AA) appears smoother with rectangular blocks emerging all over the surface due to the creation of covalent bonds between various polymer chains during crosslinking.47,48
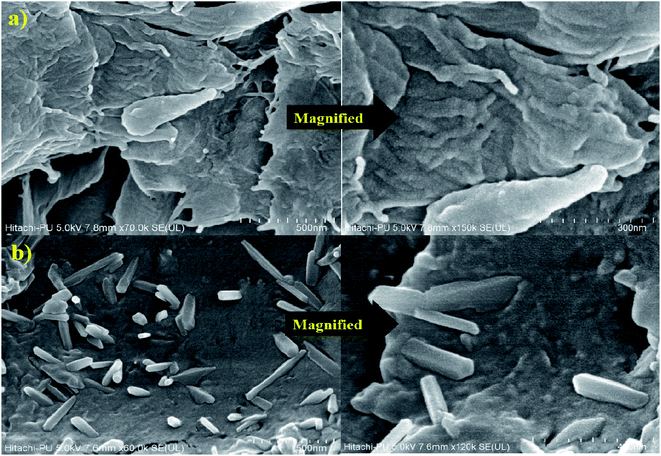 |
| | Fig. 6 SEM images of (a) GG and (b) GG-cl-poly(AA). | |
Swelling behaviour in salt solutions
Swelling behaviour evaluation in salt solutions, particularly in fertilisers employed, is highly important because of the agricultural and horticultural applications of GG-cl-poly(AA).49 The effect of the salt solution on Ps has also been investigated at different salt concentrations (10 mM, 50 mM, 100 mM, and 500 mM) (e.g., sodium). In contrast to the computed values of Ps in distilled water, Ps of the GG-cl-poly(AA) has been found to decrease with an increase in salt solution content, as shown in Fig. 7. This is because of the effect of charge and the cation size on Ps. Monovalent cations such as Na+ can protect the carboxylate anions in the polymeric structure, resulting in a more compact three-dimensional structure due to reduced repulsion between the fixed network charges. The osmotic pressure difference between the hydrogel structure and the exterior solution, as well as the water retention capacity, diminishes as a result.50 When polymers swell in salt solutions, ionic crosslinking occurs largely at their surfaces, leading them to become rubbery and exceedingly rigid. Increased crosslink density and lower swelling capacity result from ionic group complexing. The fact that these hydrogels are smart polymers is reinforced by their salt-dependent activity.51,52 The counterion-induced phase change has been observed in collagen-based hydrogels53 and poly(acrylamide/maleic acid) hydrogels,54 and it should be taken into account when designing hydrogels for practical applications.55 Despite the fact that current research did not involve mixing hydrogels with soil, the results strongly imply that hydrogels could be employed as a soil conditioner in high salinity environments.
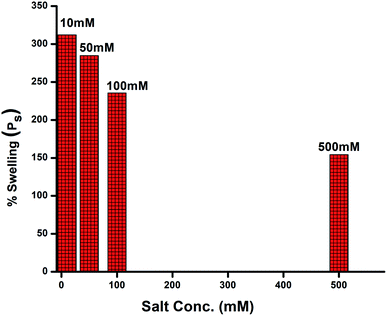 |
| | Fig. 7 Effect of salt concentration on Ps. | |
Water retention
Water retention in different parts of the soil matrix is an important factor for determining whether or not there is enough water for planting or cropping. Cross-linked hydrogels have recently gained favour in agriculture, soil enhancement, and crop development.56 Because of its vast absorption ability, a cross-linked hydrogel network may absorb water; hence, their soil's water-retaining capacity and optimal plant growth under drought-like conditions should be promoted.57 In light of this, the SAH water retention characteristics in various soil samples were investigated by monitoring the weight of the samples every day until a consistent result was achieved. The results of estimating the water evaporation ratio are shown in Fig. 8. The experimental data showed that the water evaporation rate in the soil samples containing hydrogel was less than that of the control. In other words, the synthesized hydrogels can successfully transform arid or drought-prone areas into “green and fertile lands”. The water content of the various soil samples reduces with growing time, as shown in the figure; however, the water falling rate differed depending on whether the soil sample included or did not contain hydrogel. The water evaporation ratio was calculated with and without a cross-linked hydrogel network. Water evaporation was slower in the absorbent-containing clay soil than in the control (Fig. 8a). The clay soil with the hydrogel was able to hold water for up to 20 days, whereas the clay soil monitoring sample only lasted 10 days. The sandy soil with the absorbent maintained water for 18 days (Fig. 8b), but the soil sample without the absorbent lost water in 10 days. The clay and sandy soil mixture with the hydrogel maintained water for 13 days, but the control mixture evaporated completely in 9 days (Fig. 8c). The improved water-holding capacity of the hydrogels has been reported by a few researchers to boost the irrigation requirements of several plants.58,59 For agricultural and horticultural purposes, the developed absorbent can also act as an effective soil moisture retention agent for the delayed release of water molecules.
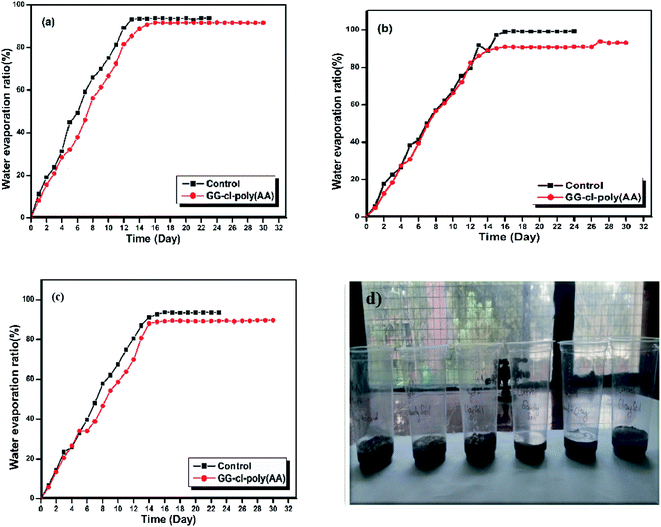 |
| | Fig. 8 Water retention studies of GG-cl-poly(AA) in (a) clay soil, (b) sandy soil, and (c) sand + clay soil. (d) Photograph of GG-cl-poly(AA)-containing soil containers. | |
Biodegradation
Biodegradability with a variable rate of degradation is very important for various scientific applications.60 The biodegradability test of the prepared GG-cl-poly(AA) hydrogel was conducted using soil burial and vermicompost procedures. Time is the element that has played a substantial role in determining the degradability of hydrogels.61 The degradation behaviour of the hydrogels and backbone in moistened soil was measured at a regular time period, as shown in Fig. 9. They showed a maximal rate of disintegration in 15–22 days. In a 9-day soil burial test, the degradation percentage for GG and GG-cl-poly(AA) was calculated to be 64.38 and 63.89, respectively. After 22 days, the degradation percentage was found to be 92.71 and 86.71 concerning GG and GG-cl-poly(AA). The hydrogel utilized was initially translucent with a smooth surface, but when subjected to soil burial investigation, there were changes in the color and morphology, consistent with microbial growth or morphological anomalies during the deterioration phase, as shown in Fig. 9. This confirmed the presence of deteriorated cross-linked hydrogels in the soil burial. This was endorsed by the FTIR spectroscopy. This confirmed the presence of deteriorated cross-linked hydrogels in the soil burial. It has been discovered that calculating the percentage of weight loss is the most effective way for monitoring the biodegradation behavior of materials. The rate of degradation is highly reliant on the several factors that influence microbe proliferation, such as pH, oxygen concentration, temperature, mineral nutrient supply, and humidity.62 The percentage of weight loss increases over time, which could be due to unreacted or low-molecular weight macromers dissociating in the soil during the burial test. The degradation of the hydrogels might result in the breakage of cross-linked poly(AA) chains during bacterial digestion or secretion. The degrading percentage for the GG-cl-poly(AA) network was found to be 86.31 by the vermicomposting method. After 22 days, owing to the disintegration of larger molecules into the smaller ones, it was measured as 89.95 respectively. During visual inspection, the sample colour was translucent, but after compost testing, it turned blackish-brown due to a change in surface morphology caused by bacteria acting on the crosslinked network associated with hydrogel weight loss.63 Gum gellan, however, disintegrated completely after 9 days. The degrading behaviour of the synthesised GG-cl-poly(AA) was revealed in three stages. The deterioration rate was initially slow due to the oxidation of the organic part of the hydrogel. This deterioration has been exacerbated by the imbibition of additional soil microorganisms in the swollen hydrogel network during water absorption, hastening the decay process. The decreased decay rate in phase 2 could be due to the hydrogel's higher water-to-mass ratio, which prevents oxygen from accessing the substrates, thus resulting in an anaerobic environment that inhibits microbial proliferation and hence influences breakdown rate. As seen in Fig. 10, bacteria and erosion break down the hydrogel network in the third stage, allowing oxygen to enter and making the test material more prone to microbial attack and other degrading processes. Biodegradation via soil burial resulted in less weight loss than that of vermicomposting. This could be due to the presence of multiple types of microorganisms in the vermi-compost, which hastens the decomposition process compared to fresh garden soil. Vermicompost also has high degradation rate because of its increased nitrogen, phosphate, and potassium contents, as well as its ability to strengthen soil structure and hold more water. Table 6 compares the degradation behaviour of several hydrogels based on the soil utilized and the number of degradation days.55
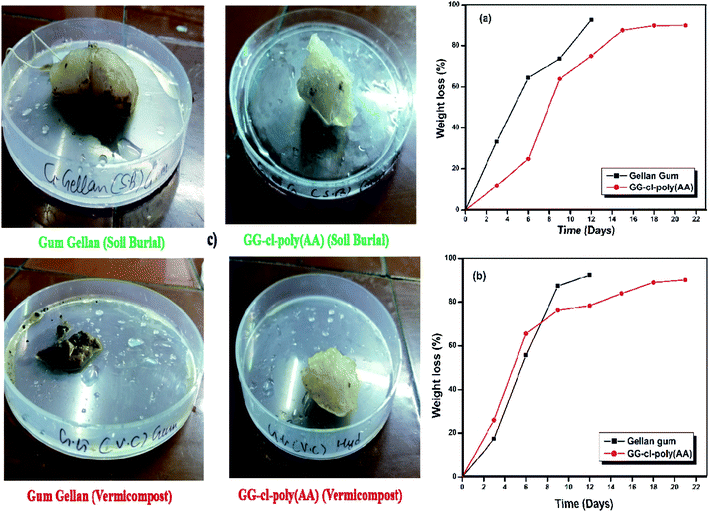 |
| | Fig. 9 Biodegradation studies of GG-cl-poly(AA) using (a) soil burial, (b) vermicompost and (c) photographs of GG and GG-cl-poly(AA) during the biodegradation tests. | |
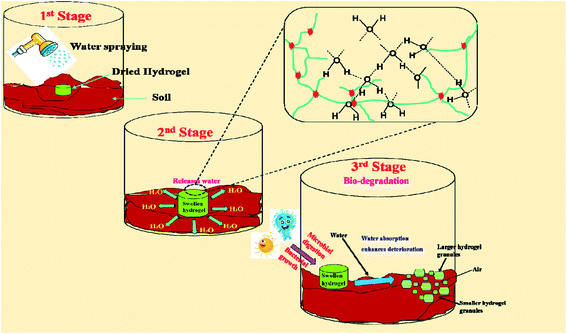 |
| | Fig. 10 Schematic representation of the different phases of biodegradation using the GG-cl-poly(AA) hydrogel in soil. | |
Table 6 Comparison of the biodegradation behaviour of GG-cl-ploy(AA) with other hydrogels in different soil samples
| S. No. |
Hydrogel |
Degradation (%) |
| Soil type |
Degradation (%) |
Soil type |
Degradation (%) |
Total days |
Ref. |
| 1 |
Polyacrylate hydrogel |
Loamy sand |
0.45 |
Loam |
0.82 |
168 |
64 |
| 2 |
Acrylic acid acryl-amide copolymer |
Top soil |
0.3 |
— |
— |
196 |
65 |
| 3 |
CS, gel and PVA based hydrogel (H) |
Sterile soil |
40 |
Inoculated soil |
74 |
28 |
66 |
| 4 |
Inulin loaded hydrogel (HI) |
Sterile soil |
47 |
Inoculated soil |
61 |
28 |
66 |
| 5 |
GT-cl-poly(AA-IPN-MMA) IPN |
Soil burial |
78.83 |
Compost |
91.6 |
539 |
67 |
| 6 |
Av-cl-poly(AA) |
Soil burial |
90 |
Vermi-compost |
93 |
70 |
68 |
| 7 |
Gg-cl-poly(MAA) |
Soil burial |
66 |
— |
— |
60 |
49 |
| 8 |
Gg-cl-poly(MAA-IPN-aniline) |
Soil burial |
86.6 |
— |
— |
60 |
49 |
| 9 |
Gg-cl-poly(MAA) |
— |
— |
Composting |
81.9 |
60 |
69 |
| 10 |
Gg-g-poly(MAA-IPN-ANI) |
— |
— |
Compost |
89.6 |
60 |
69 |
| 11 |
Gt-cl-poly(AA) |
Soil burial |
92.29 |
Compost |
Completely degraded |
77 |
70 |
| 12 |
Hydrogel-IPN |
Soil burial |
81.26 |
Compost |
100 |
77 |
71 |
| 13 |
CH-GEL HPN |
Soil burial |
73 |
Compost |
82.2 |
70 |
72 |
| 14 |
CH-GEL-β-CD HPN |
Soil burial |
75 |
Compost |
83.5 |
70 |
72 |
| 15 |
Gt-cl-poly(AA-ip-AAm) |
Soil burial |
86.03 |
Compost |
Completely degraded |
77 |
73 |
| 16 |
Ggum-cl-poly(IA) |
Soil burial |
70.5 |
Compost |
82.9 |
77 |
74 |
| 17 |
Ggum-cl-poly(IA-IPN-ANI)-neutral |
Soil burial |
78.8 |
Compost |
86.9 |
77 |
74 |
| 18 |
Ggum-cl-poly(IA-IPN-ANI)-acidic |
Soil burial |
80.6 |
Compost |
89.3 |
77 |
74 |
| 19 |
(GrA-Psy)-cl-poly(AA) |
Soil burial |
84.6 |
Compost |
90.4 |
63 |
75 |
| 20 |
Gg-cl-PAAM |
Soil burial |
93 |
— |
— |
60 |
76 |
| 21 |
Ggum-cl-poly(AA-IPN-ANI)-NC |
Soil burial |
78.14 |
Compost |
82.38 |
70 |
77 |
| 22 |
Ggum-cl-poly(AA-IPN-ANI)-AC |
Soil burial |
75.43 |
Compost |
78.61 |
70 |
77 |
| 23 |
Ggum-cl-poly(AA) |
Soil burial |
70.06 |
Compost |
73.67 |
70 |
77 |
| 24 |
BGC |
Soil burial |
85.88 |
Compost |
90.64 |
70 |
78 |
| 25 |
BIPN |
Soil burial |
80.55 |
Compost |
82.38 |
70 |
78 |
| 26 |
GG-cl-poly(AA) |
Soil burial |
86.71 |
Vermi-Compost |
89.95 |
22 |
Present study |
Evidence of biodegradation through FE-SEM and FTIR spectroscopy
A FE-SEM was used to investigate the structural and morphological changes on the surface of the superabsorbent during the degradation process. Before the onset of biodegradation, the superabsorbent surface was smooth and free of continuous debris, as shown in the SEM micrograph (Fig. 6). The severity of morphological damage increased as the biodegradation time passed. In the soil burial and vermicomposting processes, the SEM images of GG-cl-poly(AA) displayed superficial fractures, as shown in Fig. 11. The biodegradation stage of SEM micrographs under soil burial and vermi-compost soil (Fig. 11a and b) reveals the presence of tiny gaps, fractures, and cracks on the surface due to the breakdown of the superabsorbent 3-D framework and the deterioration between the different polymeric crosslinked chains.60 Bacteria become active in humid environments, and the superabsorbent surface penetrates, causing colour darkening. Strong differences between homogeneous and smooth hydrogel surfaces can be seen under SEM microscopy. The surface roughness and porosity increased during biodegradation, as evidenced in SEM images. Porosity, brittleness, size, and many cracks on the superabsorbent increased as a result of enzymatic secretion and microbial attack on the superabsorbent during the vermi-composting process, resulting in increased heterogeneity and irregularity.78 These morphological changes demonstrated that grafting and crosslinking had no effect on the environmentally friendly character of polysaccharides, i.e. GG, at various stages of breakdown.
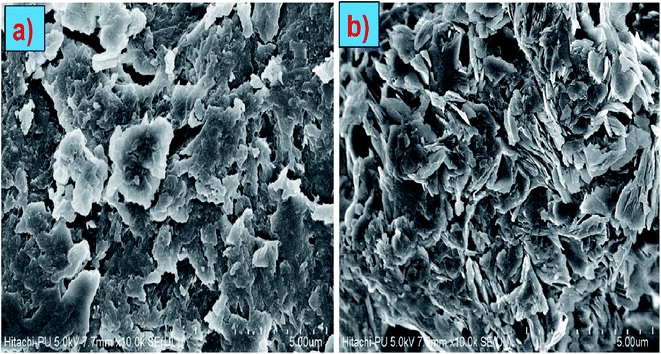 |
| | Fig. 11 SEM images of (a) GG-cl-poly(AA) biodegradation using the soil burial method and (b) GG-cl-poly(AA) biodegradation using the vermicompost method. | |
Fig. 12 shows the FTIR spectra of GG-cl-poly(AA) at various stages of biodegradation utilising composting and soil burial procedures. In the FTIR spectra of GG-cl-poly after the first stage of biodegradation, using both degradation methods, some of the peaks migrated to new positions or had decreased peak intensities (AA). Microbial attack in the vermi-compost and garden soil induced these changes in peak positions, which signalled the onset of crosslink and covalent bond breaking among polymer chains. On the 15th day (stage II), the FTIR spectra of GG-cl-poly(AA) degradation revealed that bands at 510, 1150, 1247, 1710, and 1998 cm−1 were vanished. The degradation of certain components of GG-cl-poly(AA) such as GG and poly(AA) led to the continuing decline and removal of peak intensities.61,78 Hydrolysis and other activities on the polymer's surface were shown to be responsible for the difference in peak position between 1059 cm−1 and 1613 cm−1.61,78 In the last and final stages of biodegradation of GG-cl-poly(AA), the breakage of old bonds and the development of new peaks in the final stage spectra suggested the production of new by-products as a result of microbial action. Visual examination also reveals a color shift from white to light brown (Fig. 10). The degradation process has shown that the synthesized hydrogel has no negative impact on soil fertility, but rather increases organic product in the soil while also assisting in water retention for improved crop production.
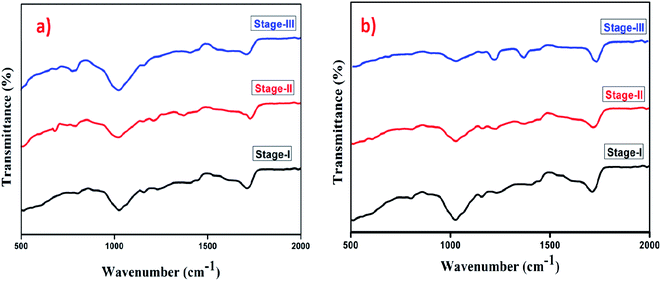 |
| | Fig. 12 FTIR spectra of (a) GG-cl-poly(AA) biodegradation using the soil burial method and (b) GG-cl-poly(AA) biodegradation using the vermicompost method. | |
Conclusion
Via grafting and crosslinking, a novel biodegradable GG-cl-poly(AA) hydrogel has been effectively synthesised. By adjusting the amounts of the initiator, monomer, crosslinker, and solvent, the ANOVA was used to simulate and optimise graft copolymerization to achieve the best percentage swelling. A fractional factorial design followed by an optimal response surface design was proven to be more accurate, less time-consuming, and adaptable. GG-cl-poly(AA) has an extensive network in water due to considerable electrostatic repulsion between anion (COO−) groups. Using this model, the maximum percentage swelling of GG-cl-poly(AA) was observed to be 556%. For maximum percentage swelling, the crosslinker is the most important process variable. The percentage swelling was improved by 30%, with a significant reduction in the initiator concentration (43.8 to 7.3 mM L−1), and the other two process variables were also lowered by 30–40% during the phase-2 design. This makes the superabsorbent more cost-effective for agricultural application. Furthermore, adding GG-cl-poly(AA) into the soil improved water retention and holding capacity for a longer period of time than the natural inclination of soil. As a result, synthesised GG-cl-poly(AA) could be used to increase the moisture content in a variety of soils for agricultural purposes. Vermicompost soil, however, degrades GG-cl-poly(AA) faster than garden soil. In salt solutions of different concentrations, the GG-cl-poly(AA) hydrogel exhibited smart swelling behaviour with a lower swelling ratio. The findings showed that raising the concentration of NaCl lowers the water absorbency. From the research, it can be deduced that the synthesised GG-cl-poly(AA) hydrogel can absorb and retain a significant amount of water inside its structure and can be employed in agriculture.
Conflicts of interest
There are no conflicts to declare.
Acknowledgements
Sonal Choudhary wishes to express gratitude to the Department of Science and Technology (DST) for the INSPIRE Fellowship under grant number IFI80794.
References
- S. P. Wani, J. Rockstrom and T. Y. Oweis, CABI, 2009, 7, 1–310 CAS; W. B. Wang and A. Q. Wang, J. Adv. Mater., 2010, 96, 177–182 Search PubMed.
- L. Xie, M. Liu, B. Ni, X. Zhang and Y. Wang, Chem. Eng. J., 2011, 167(1), 342–348 CrossRef CAS.
- F. L. Buchholz and T. Graham, Mod. Superabsorbent Polym. Technol., 1998, 37, 4267–4274 Search PubMed.
- M. J. Zohuriaan-Mehr and K. Kabiri, Iran. Polym. J., 2008, 17, 451–477 CAS.
- A. Hüttermann, L. J. B. Orikiriza and H. Agaba, Clean: Soil, Air, Water, 2009, 37(7), 517–526 Search PubMed.
- M. Shimao, Curr. Opin. Biotechnol., 2001, 12, 242–247 CrossRef CAS PubMed.
- H. Tian, Z. Tang, X. Zhuang, X. Chen and X. Jing, Prog. Polym. Sci., 2012, 37, 237 CrossRef CAS.
- B. D. Ulery, L. S. Nair and C. T. Laurencin, J. Polym. Sci., Part B: Polym. Phys., 2011, 49(12), 832 CrossRef CAS PubMed.
- H. Mittal, S. B. Mishra, A. K. Mishra, B. S. Kaith and R. Jindal, Int. J. Biol. Macromol., 2013, 58, 37 CrossRef CAS PubMed.
- B. Narjary, P. Aggarwal, A. Singh, D. Chakraborty and R. Singh, Geoderma, 2012, 187, 94–101 CrossRef.
- P. Jansson, B. Lindberg and P. A. Sandford, Carbohydr. Res., 1983, 124, 135–139 CrossRef CAS.
- M. A. O'Neill, R. R. Selvendran and V. J. Morris, Carbohydr. Res., 1983, 124, 123–133 CrossRef.
- J. Silva-Correia, B. Zavan, V. Vindigni, T. H. Silva, J. M. Oliveira, G. Abatangelo and R. L. Reis, Adv. Healthcare Mater., 2013, 2(4), 568–575 CrossRef CAS PubMed.
- E. R. Morris, K. Nishinari and M. Rinaudo, Food Hydrocolloids, 2012, 28(2), 373–411 CrossRef CAS.
- Y. Gong, C. Wang, R. C. Lai, K. Su, F. Zhang and D. Wang, J. Mater. Chem., 2009, 19(14), 1968 RSC.
- N. A. Silva, M. J. Cooke, R. Y. Tam, N. Sousa, A. J. Salgado, R. L. Reis and M. S. Shoichet, Biomaterials, 2012, 33(27), 6345–6354 CrossRef CAS PubMed.
- V. Vijan, S. Kaity, S. Biswas, J. Isaac and A. Ghosh, Carbohydr. Polym., 2012, 90, 496–506 CrossRef CAS PubMed.
- R. C. Sabadini, V. C. Martins and A. Pawlicka, Cellulose, 2015, 22(3), 2045–2054 CrossRef CAS.
- V. S. Pandey, S. K. Verma, M. Yadav and K. Behari, Int. J. Biol. Macromol., 2014, 70, 108–115 CrossRef CAS PubMed.
- S. Choudhary, K. Sharma, V. Kumar, J. K. Bhatia, S. Sharma and V. Sharma, Polym. Bull., 2019, 77(9), 4917–4935 CrossRef.
- J. S. Karthika, B. Vishalakshi and J. Naik, Int. J. Biol. Macromol., 2016, 82, 61–67 CrossRef CAS PubMed.
- M. Khayet, M. N. Abu Seman and N. Hilal, J. Membr. Sci., 2010, 349, 113–122 CrossRef CAS.
- B. T. Lin, M. D. Jean and J. H. Chou, Appl. Surf. Sci., 2007, 253, 3254–3262 CrossRef CAS.
- V. Kumar, V. Rehani and B. S. Kaith, Polym. Eng. Sci., 2019, 59(11), 2323–2334 CrossRef CAS.
- P. Sharma and M. Tailang, Future J. Pharm. Sci., 2020, 6(1), 1–11 CrossRef.
- M. L. K. S. Celebre, M. L. P. Dalida and J. V. D. Perez, Mater. Sci. Forum, 2020, 1005, 101–107 Search PubMed.
- Y. Zhao, L. Fang and T. Tan, J. Appl. Polym. Sci., 2006, 3, 2616–2622 CrossRef.
- F. L. Hong, J. Peng and W. B. Lui, J. Appl. Polym. Sci., 2011, 3, 1797–1804 CrossRef.
- L. Ripoll and Y. Clement, Cosmetics, 2016, 3(4), 38 CrossRef.
- A. K. Sharma, B. S. Kaith, V. Tanwar, J. K. Bhatia, N. Sharma, S. Bajaj and S. Panchal, Int. J. Biol. Macromol., 2019, 129, 214–226 CrossRef PubMed.
- D. Sarmah and N. Karak, J. Appl. Polym. Sci., 2020, 137(13), 48495 CrossRef CAS.
- M. Bai, B. Wilske, F. Buegger, J. Esperschütz, M. Bach, H. G. Frede and L. Breuer, Environ. Sci. Pollut. Res., 2015, 22(7), 5444–5452 CrossRef CAS PubMed.
- A. Pourjavadi, A. M. Harzandi and H. Hosseinzadeh, Eur. Polym. J., 2004, 40, 1363–1370 CrossRef CAS.
- G. Sen, S. Mishra, U. Jha and S. Pal, Int. J. Biol. Macromol., 2010, 47(2), 164–170 CrossRef CAS PubMed.
- G. R. Bardajee, A. Pourjavadi, R. Soleyman and N. Sheikh, Nucl. Instrum. Methods Phys. Res., Sect. B, 2008, 266(18), 3932–3938 CrossRef CAS.
- G. Nandi, P. Patra, R. Priyadarshini, S. Kaity and L. K. Ghosh, Int. J. Biol. Macromol., 2015, 72, 965–974 CrossRef CAS PubMed.
- J. Li, K. Kamath and C. Dwivedi, J. Biomater. Appl., 2001, 15(4), 321–343 CrossRef CAS PubMed.
- P. K. Pandey, A. Srivastava, J. Tripathy and K. Behari, Carbohydr. Polym., 2006, 65, 414–420 CrossRef CAS.
- D. Sarkar, G. Nandi, A. Changder, P. Hudati, S. Sarkar and L. K. Ghosh, Int. J. Biol. Macromol., 2017, 96, 137–148 CrossRef CAS PubMed.
- K. Sharma, B. S. Kaith, V. Kumar, V. Kumar, S. Som, S. Kalia and H. C. Swart, RSC Adv., 2013, 3, 25830–25839 RSC.
- M. Hamcerencu, J. Desbrieres, A. Khoukh, M. Popa and G. Piess, Synthesis and characterization of new unsaturated esters of gellan gum, Carbohydr. Polym., 2008, 71, 92–100 CrossRef CAS.
- O. Novac, G. Lisa, L. Profire, C. Tuchilus and M. I. Popa, Mater. Sci. Eng., C, 2014, 35, 291–299 CrossRef CAS PubMed.
- X. Liang, L. Du, F. Su, H. S. Parekh and W. Su, Magn. Reson. Chem., 2014, 52, 178–182 CrossRef CAS PubMed.
- K. Arun Krishna and B. Vishalakshi, J. Appl. Polym. Sci., 2017, 134(47), 45527 CrossRef.
- R. R. Bhosale, H. V. Gangadharappa, R. A. M. Osmani and D. V. Gowda, Drug Delivery Transl. Res., 2020, 10, 1002–1018 CrossRef CAS PubMed.
- K. Sharma, V. Kumar, B. S. Kaith, V. Kumar, S. Som, S. Kalia and H. C. Swart, RSC Adv., 2014, 4(49), 25637–25649 RSC.
- S. Kaur, R. Jindal and J. Kaur Bhatia, Polym. Eng. Sci., 2018, 58(12), 2293–2303 CrossRef CAS.
- A. Pourjavadi and G. R. Mahdavinia, Turk. J. Chem., 2006, 30, 595 CAS.
- M. Sadeghi, N. Ghasemi and M. Yarahmadi, Biosci., Biotechnol. Res. Asia, 2011, 8, 425–434 CrossRef CAS.
- A. S. G. Magalhães, M. P. Almeida Neto, M. N. Bezerra and J. Feitosa, J. Braz. Chem. Soc., 2013, 24, 304–313 CrossRef.
- A. Pourjavadi and M. Kurdtabar, Eur. Polym. J., 2007, 43, 877–889 CrossRef CAS.
- P. M. Akkaş, M. S. Sarı and O. Güven, Radiat. Phys. Chem., 1999, 55, 717–721 CrossRef.
- N. Thombare, S. Mishra, M. Z. Siddiqui, U. Jha, D. Singh and G. R. Mahajan, Carbohydr. Polym., 2018, 185, 169–178 CrossRef CAS PubMed.
- V. Dhanapal, P. Subhapriya, K. P. Nithyanandam, M. V. Kiruthika, T. Keerthana and G. Dineshkumar, Mater. Today: Proc., 2021, 45, 2491–2497 CAS.
- B. S. Kaith, R. Jindal and G. S. Kapur, Iran. Polym. J., 2013, 22, 561 CrossRef.
- S. A. Shahid, A. A. Qidwai, F. Anwar, I. Ullah and U. Rashid, Molecules, 2012, 17, 9397 CrossRef CAS PubMed.
- K. S. Soppimath, T. M. Aminabhavi, A. R. Kulkarni and W. E. Rudzinsk, J. Controlled Release, 2001, 70, 1 CrossRef CAS PubMed.
- H. Mittal, A. Maity and S. S. Ray, Polym. Degrad. Stab., 2015, 120, 42–52 CrossRef CAS.
- A. Tiwari, J. J. Grailer, S. Pilla, D. A. Steeber and S. Gong, Acta Biomater., 2009, 5, 3441 CrossRef CAS PubMed.
- W. Phetwarotai, P. Potiyaraj and D. Aht-Ong, J. Polym. Environ., 2013, 21, 95 CrossRef CAS.
- K. Sharma, B. S. Kaith, V. Kumar, S. Kalia, V. Kumar and H. C. Swart, Polym. Degrad. Stab., 2014, 107, 166–177 CrossRef CAS.
- B. Wilske, M. Bai, B. Lindenstruth, M. Bach, Z. Rezaie, H. G. Frede and L. Breuer, Environ. Sci. Pollut. Res., 2014, 21(16), 9453–9460 CrossRef CAS PubMed.
- M. Wolter, C. I. D. Wiesche, F. Zadrazil, S. Hey, J. Haselbach and F. Schnug, Landbauforschung Volkenrode, 2002, 52(1), 43–52 CAS.
- J. C. López-Velázquez, R. Rodríguez-Rodríguez, H. Espinosa-Andrews, J. A. Qui-Zapata, S. García-Morales, D. E. Navarro-López, G. Luna-Bárcenas, E. C. Vassallo-Brigneti and Z. Y. García-Carvajal, J. Chem. Technol. Biotechnol., 2019, 94(11), 3495–3504 CrossRef.
- S. Sharma, V. Kumar, D. Pathak, H. Mittal and S. M. Alhassan, J. Appl. Polym. Sci., 2019, 136(28), 47739 CrossRef.
- V. Kumar. Synthesis of Biodegradable Aloevera-acrylic Acid Based Hydrogel with Enhanced Water Retention Capacity and Its Impact on Agriculture, 2021 Search PubMed.
- K. Sharma, B. S. Kaith, S. Kalia, V. Kumar and H. C. Swart, Colloid Polym. Sci., 2015, 293(4), 1181–1190 CrossRef CAS.
- B. S. Kaith, R. Jindal and V. Kumar, Polym. Degrad. Stab., 2015, 115, 24–31 CrossRef.
- V. Kumar, H. Mittal and S. M. Alhassan, Int. J. Biol. Macromol., 2019, 132, 1252–1261 CrossRef PubMed.
- K. Kaur, R. Jindal and D. Jindal, Int. J. Biol. Macromol., 2020, 146, 987–999 CrossRef CAS PubMed.
- B. S. Kaith, V. Kumar and R. Jindal, J. Appl. Biotechnol. Rep., 2016, 9, 74–81 Search PubMed.
- R. Sharma, S. Kalia, B. S. Kaith, D. Pathania, A. Kumar and P. Thakur, Polym. Degrad. Stab., 2015, 122, 52–65 CrossRef CAS.
- P. Wadhera, R. Jindal and R. Dogra, Polym. Eng. Sci., 2020, 60(6), 1231–1243 CrossRef CAS.
- H. Mittal, V. Kumar, S. M. Alhassan and S. S. Ray, Int. J. Biol. Macromol., 2018, 114, 283–294 CrossRef CAS PubMed.
- B. S. Kaith, R. Sharma and S. Kalia, Int. J. Biol. Macromol., 2015, 75, 266–275 CrossRef CAS PubMed.
- B. S. Kaith, U. Shanker and B. Gupta, J. Environ. Manage., 2019, 234, 345–356 CrossRef PubMed.
- R. Abouelwafa, G. A. Baddi, S. Souabi, P. Winterton, J. Cegarra and M. Hafidi, Bioresour. Technol., 2008, 99(18), 8571–8577 CrossRef CAS PubMed.
- B. S. Kaith, R. Jindal and V. Kumar, Polym. Degrad. Stab., 2015, 115, 24–31 CrossRef.
|
| This journal is © The Royal Society of Chemistry 2022 |
Click here to see how this site uses Cookies. View our privacy policy here.  Open Access Article
 c,
Vishal Sharma*a and
Vijay Kumar
 *de
*de


![[double bond, length as m-dash]](https://www.rsc.org/images/entities/char_e001.gif) O stretching.38 The peak at 1026 cm−1 is ascribed to the N–H stretching and bending vibrations.39 Some differences were found in the GG-cl-poly(AA) range relative to gum. The infrared spectra of the grafted hydrogel indicated peak characteristics at 1711 cm−1, attributed to the acrylic acid carbonyl group stretching vibration, and at 1410 cm−1, attributed to the C–O–H bending vibration, both of which promote AA grafting on gellan gum.40 A prominent band detected at 1026 cm−1 for the CH–O–CH2 group confirms the grafting process between the OH group of gellan and the π bond of acrylic acid.41 Absorption peaks at 1413 cm−1 assigned to the –NH in-plane bending vibration of the (MBA) amide group further establish the formation of cross-linked hydrogels.42 The grafting of AA over the native polysaccharide was confirmed by the observation of extra bands and changing intensities.
O stretching.38 The peak at 1026 cm−1 is ascribed to the N–H stretching and bending vibrations.39 Some differences were found in the GG-cl-poly(AA) range relative to gum. The infrared spectra of the grafted hydrogel indicated peak characteristics at 1711 cm−1, attributed to the acrylic acid carbonyl group stretching vibration, and at 1410 cm−1, attributed to the C–O–H bending vibration, both of which promote AA grafting on gellan gum.40 A prominent band detected at 1026 cm−1 for the CH–O–CH2 group confirms the grafting process between the OH group of gellan and the π bond of acrylic acid.41 Absorption peaks at 1413 cm−1 assigned to the –NH in-plane bending vibration of the (MBA) amide group further establish the formation of cross-linked hydrogels.42 The grafting of AA over the native polysaccharide was confirmed by the observation of extra bands and changing intensities.


