DOI:
10.1039/D1RA08724J
(Paper)
RSC Adv., 2022,
12, 8683-8690
Fluorescent sensing platform based on green luminescence carbon dots and AuNPs for clenbuterol detection in pork liver†
Received
30th November 2021
, Accepted 14th March 2022
First published on 21st March 2022
Abstract
In this paper, water-soluble green fluorescent carbon dots (G-CDs) were prepared using p-phenylenediamine and glutathione (GSH) as the precursors. The G-CDs exhibit excellent optical properties, and the maximum emission wavelength is located at 522 nm (under 410 nm excitation), which greatly overlaps with the absorption spectrum of AuNPs. Consequently, an effective “off–on” fluorescent sensing platform involved in G-CDs and AuNPs for detection of clenbuterol (CLB) was constructed. The fluorescence of G-CDs was strongly quenched by AuNPs due to the inner filter effect (IFE). As CLB was introduced, the quenched fluorescence intensity was recovered due to the specific interaction between the AuNPs and CLB. The recovered fluorescence intensity is linear to CLB concentration in the range of 13–270 ng mL−1 with a low detection limit of 3.75 ng mL−1. The prepared sensor has been successfully applied for CLB detection in pork liver and could be utilized in food analysis.
1. Introduction
CLB is a β2-adrenaline agonist and can regulate the flow and redistribution of nutrients by enhancing lipolysis and reducing protein catabolism in animals.1,2 Animal tissues with CLB residues are toxic to visceral organs, such as the liver and kidneys, after being eaten by human beings, leading to palpitations, muscle pain, dizziness, and vomiting. Some severe cases can even be life-threatening.3,4 CLB as a growth promoter has been explicitly banned in animal breeding by many countries.5 Therefore, developing an effective analytical method to accurately and sensitively detect CLB is necessary for food safety and health. To date, CLB can be detected by various analytical methods, including traditional detection based on large-scale equipment, such as high performance liquid chromatography,6 gas chromatography-mass spectrometry,7 liquid chromatography-tandem mass spectrometry,8 capillary electrophoresis technology,9 and related technologies based on immunoassay, such as related enzyme-linked immunoassay methods,10 immune lateral flow chromatography,11 surface enhanced Raman immunoassay,12 and molecularly imprinted polymer methods and other related methods.13 Although these strategies are of high sensitivity and high selectivity, they require expensive instruments or complicated sample preparation procedures and are time consuming and cumbersome for operation.
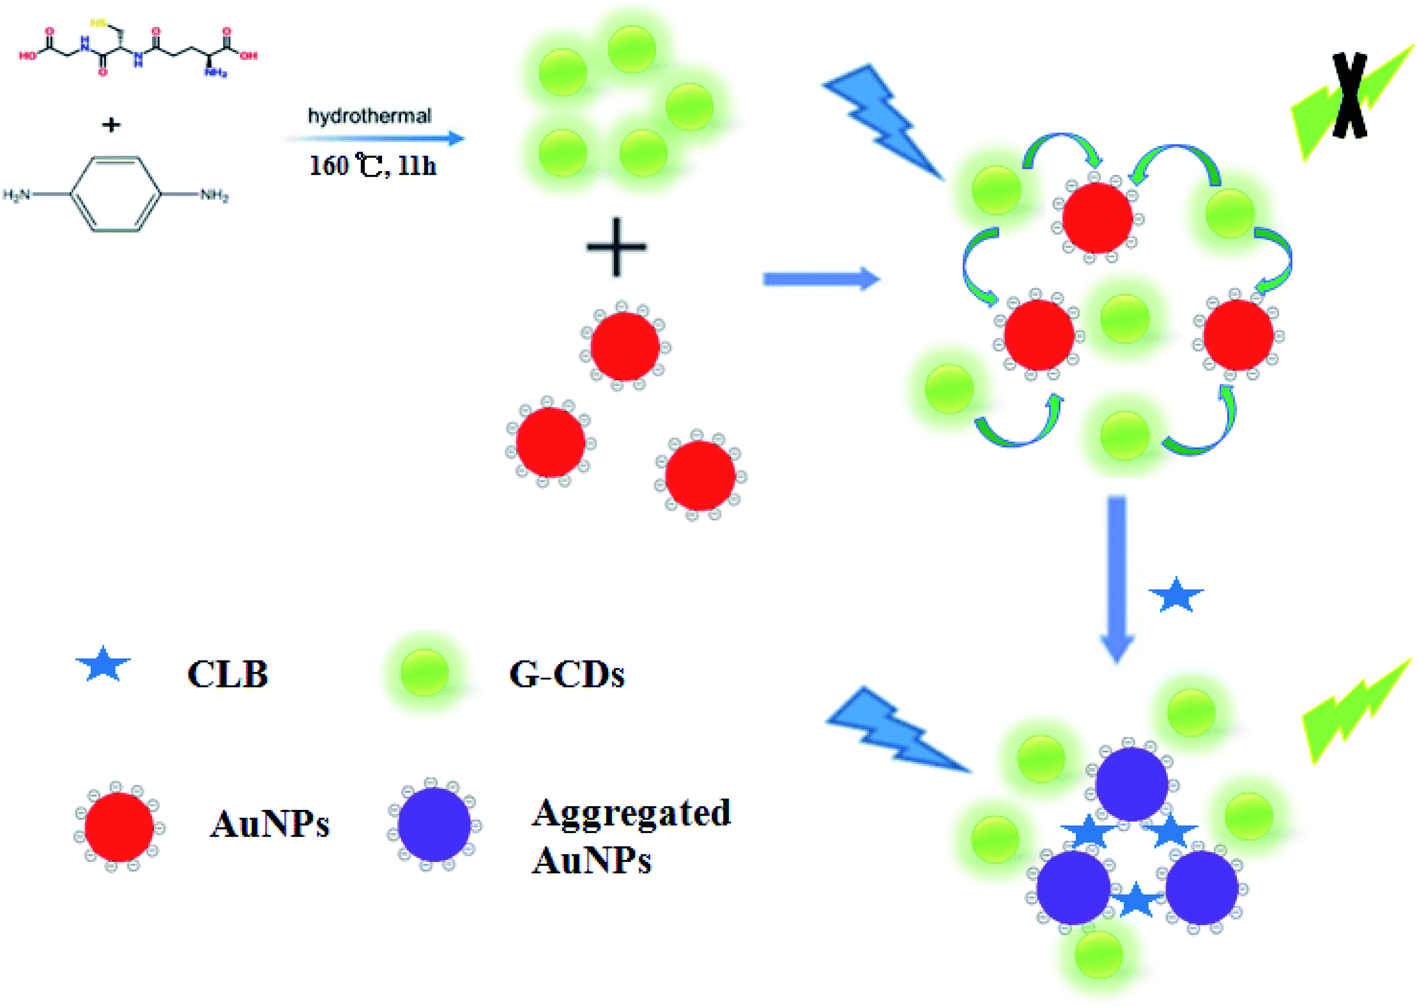
As a new fluorescent nanomaterial, carbon dots (CDs) are featured by good fluorescent properties, small size, low toxicity, good biocompatibility, and low synthesis cost. It is often introduced into fluorescence analysis in order to achieve the high-sensitivity detection of certain biological substances.14–16 However, the luminescence of CDs prepared by most methods is limited in the short wavelength region predominated by blue luminescence.17–19 Long-wavelength emission CDs (green-red emitting CDs) show great application potential in vivo imaging,20 biological diagnosis and treatment,21 and photoelectron22 due to their strong fluorescence penetrating ability and good imaging effects. The preparation of CDs with long-wavelength emission has achieved huge progress. For example, Qu and Sun research group used citric acid as the precursor, dimethylformamide and formamide, respectively as the reaction solvent to obtain long-wavelength emission CDs with high fluorescence quantum yields (QY).23,24 Miao et al. used citric acid and thiourea as precursors through a solvothermal route in acetone solvent to prepared red-emitting sulfur and nitrogen-doped CDs.25 Jia et al. prepared long-wavelength emission CDs by solvothermal process using phenylenediamine as the carbon source and DMF as the reaction solvent and realized GSH detection through colorimetric and fluorescent dual modes.26 Hu et al. prepared Se, N, Cl-doped long-wavelength emission CDs with a QY of 23.6% by hydrothermal treatment of selenourea and o-phenylenediamine in HCl solution.27 These studies have improved the luminescence of CDs through effective conjugate structure regulation and surface modification and developed some strategies for preparing long-wavelength emission CDs. However, some problems remain and must be urgently solved, namely, the low QY in water and the use of organic solvents as the reaction solvent or dispersion medium in the preparation of long-wavelength emission CDs, which makes the CDs has poor solubility in water. These factors severely limit long-wavelength emission CDs further application in the fields of fluorescence sensing and biomarkers. Therefore, the synthesis of long-wavelength emission CDs with high QY using water-based solvents is of theoretical importance. In fact, Zhang et al. have provided a new approach for the sensing application of CDs and a new analytical method for CLB detection.28 Although the luminescence emission of the prepared CDs locates in the blue region, and there is a small overlaps with the absorption band of the AuNPs, the developed method showed some merits including rapidity, simplicity, lost cost, which avoids the tedious experiments. To improve this method further, to prepare CDs with a longer emission wavelength and to enhance the fluorescence quenching efficiency are necessary. This work presents a method for preparing water-soluble high QY G-CDs using p-phenylenediamine and GSH as precursors. The G-CDs has a high QY of up to 47% in the long wavelength region. When excited at 410 nm, the maximum emission wavelength of G-CDs is located at 522 nm, which greatly overlaps with the absorption spectrum of AuNPs. On this basis, an “off–on” fluorescent sensor for detecting CLB is constructed by adopting the G-CDs and AuNPs as the fluorescent sensing platform. As an energy acceptor, AuNPs could obviously quench the fluorescence of G-CDs via IFE. However, when CLB was introduced, CLB with aromatic anilinic NH2 group and aliphatic NH group in its molecule can be adsorbed on the surface of the AuNPs through ionic and coordination bonds, respectively,29,30 resulting in the aggregation of the Au NPs. Therefore, the IFE of AuNPs and G-CDs is destroyed, the fluorescence of G-CDs is recovered, and CLB can be quickly detected. To the best of our knowledge, long-wavelength emission CDs and AuNPs are seldom used for CLB determination based on IFE. Moreover, such a sensor was also applied to detect CLB in spiked real samples and gave satisfactory results.
2. Results and discussion
2.1. Design and synthesis of G-CDs
The G-CDs were successfully prepared by one-step hydrothermal method with GSH and p-phenylenediamine as the raw materials. Different hydrothermal reaction temperatures, times, and amounts of carbon source will exhibit different effects on the optical properties of the synthesized G-CDs. Therefore, the influences of the synthesis conditions on the fluorescence properties of the G-CDs were studied in detail by using the control variable method, including the initial starting material mass ratio (GSH: p-phenylenediamine, short for M), hydrothermal reaction time, and hydrothermal reaction temperature. The QY and the maximum emission wavelength were used to evaluate fluorescent properties of the G-CDs.
The comparison and control of the experiment conditions show that the M of GSH and p-phenylenediamine greatly affected the QY and maximum emission wavelength of G-CDs as shown in Fig. S1A.† The low M value led to a reduction in QY, and the high M value pushed the maximum emission wavelength of the G-CDs toward the blue fluorescence. The reaction temperature is also an essential factor affecting the optical properties of synthesized G-CDs as shown in Fig. S1B.† Extremely high or low reaction temperature is not conductive to synthesizing G-CDs because the raw material will not polymerization under low reaction temperature (lower than 120), and the formation of large-sized G-CDs under high reaction temperature (higher than 200) that resulted in a decrease in the QY. The results show that the G-CDs obtained under 150 °C, 160 °C, and 180 °C have similar maximum emission wavelength. Among which, the G-CDs obtained under 160 °C exhibit the highest QY. Therefore, the effects of different reaction times on the fluorescence properties of the synthesized G-CDs were studied under 160 °C hydrothermal conditions as shown in Fig. S1C.† The fluorescence intensity of the CDs has gradually increased with the hydrothermal reaction time. The Y-CD fluorescence intensity reaches the highest when reacted for 11 h and gradually decreases with prolonging the reaction time. Heating for a long time will lead to excessive carbonization and the formation of by-products.31,32 The following optimized G-CDs syntheses were selected for the comparison of experimental data: the M of glutathione to p-phenylenediamine is 15![[thin space (1/6-em)]](https://www.rsc.org/images/entities/char_2009.gif) :1, the heating temperature is 160 °C, and the hydrothermal reaction time is 11 h. The G-CDs prepared by this method have high QY under long wavelength and relatively uniform particle size. Under the same experiment conditions, the experimental phenomena and products obtained in different batches are comparatively consistent, indicating the great repeatability of this process.
:1, the heating temperature is 160 °C, and the hydrothermal reaction time is 11 h. The G-CDs prepared by this method have high QY under long wavelength and relatively uniform particle size. Under the same experiment conditions, the experimental phenomena and products obtained in different batches are comparatively consistent, indicating the great repeatability of this process.
2.2. Characterization of G-CDs
The morphology and particle size of G-CDs are characterized by TEM. Fig. 1A shows that the synthesized G-CDs are spherical shape with a relatively uniform particle size distribution and good dispersibility. The average diameter is approximately 5 nm. Fig. 1B shows a large number of functional groups on the G-CDs surface. The wide absorption band at 3200 cm−1 indicates the presence of N–H. The peaks at 3072 cm−1 and 2878 cm−1 are attributed to the symmetric and asymmetric stretching vibrations of aliphatic C–H bonds, respectively. The peak at 2604 cm−1 originated from the S–H stretching vibration. The characteristic absorption peak at 1668 cm−1 indicates the presence of C![[double bond, length as m-dash]](https://www.rsc.org/images/entities/char_e001.gif) O groups in the G-CDs. The absorption peaks at 1573 cm−1 and 1392 cm−1 are attributed to CC/N–H and O–H, and the peaks at 1290 cm−1 and 1116 cm−1 indicate the presence of C–N bonds. The above analysis shows that a large number of functional groups containing oxygen, nitrogen, and sulfur are exist in the prepared G-CDs structure. These groups are beneficial to the solubility and stability of G-CDs in the water solution, thereby expanding the practical application of G-CDs.
O groups in the G-CDs. The absorption peaks at 1573 cm−1 and 1392 cm−1 are attributed to CC/N–H and O–H, and the peaks at 1290 cm−1 and 1116 cm−1 indicate the presence of C–N bonds. The above analysis shows that a large number of functional groups containing oxygen, nitrogen, and sulfur are exist in the prepared G-CDs structure. These groups are beneficial to the solubility and stability of G-CDs in the water solution, thereby expanding the practical application of G-CDs.
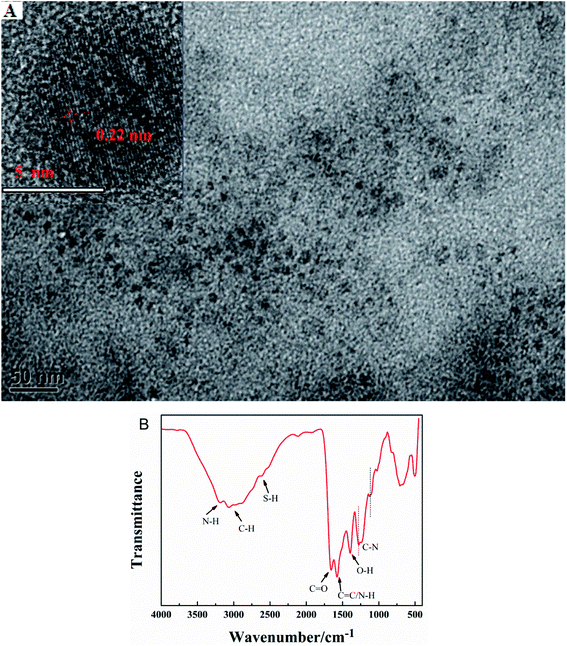 |
| | Fig. 1 TEM image (A) and FTIR spectra (B) of the G-CDs. | |
2.3. Characterization of Au NPs
The as-synthesized AuNPs was characterized by UV-vis absorption spectroscopy and TEM. Fig. S2A† shows that the AuNPs are monodisperse, basically spherical in shape, and the average size is approximately 13 nm. Strong characteristic absorption peak of AuNPs can be found at 525 nm as shown in Fig. S2B.†
2.4. Optical properties of the G-CDs
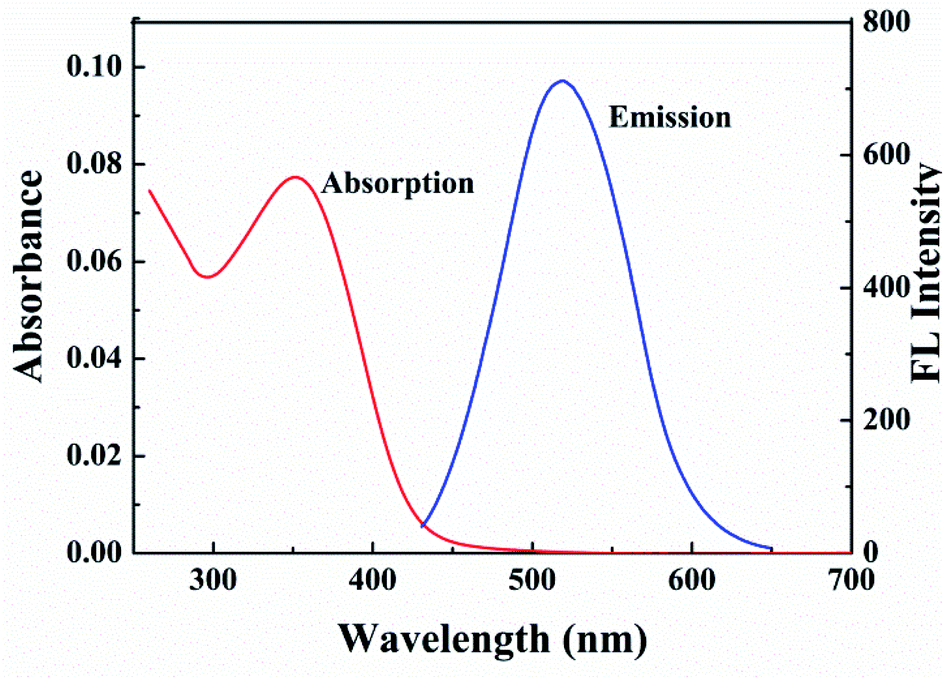
Optical properties of the G-CDs were studied by the UV-vis absorption and fluorescence emission spectra. As shown in Fig. 2, the G-CDs show an obvious absorption peak at approximately 351 nm, which corresponds to the π–π* transition of aromatic skeleton CC.33 Using Tauc plot, the direct band gap (3.07 eV) was calculated from the absorption spectra. It emits green fluorescence (emission wavelength was located at 522 nm) under excitation wavelength of 410 nm. The QY of G-CDs is measured 47% by comparison with rhodamine B in absolute ethanol.34 Such a value is greater than that of previous long-wavelength fluorescence CDs. Fig. S3† is the normalized fluorescence spectra of the G-CDs at different excitation wavelengths. It can be seen that with the increase of the excitation wavelength from 310 to 450 nm, the emission peak of the G-CDs red shifts gradually with the excitation wavelength and is accompanies by an increase at first and then decrease in the fluorescence intensity. The excitation-dependent emission property of the G-CDs is consistent with literature and can be widely found in carbon-based fluorescence nanomaterials. This unique optical phenomenon is mainly attributed to the uneven orbital energy distribution and light selectivity of the defect status of CDs with different sizes.35,36
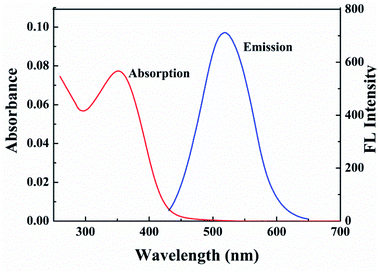 |
| | Fig. 2 UV-vis absorption spectra and fluorescence emission spectra (under 410 nm excitation) of the prepared G-CDs. | |
In next, the effects of solution ionic strength, solution pH, and continuous irradiation time of UV lamp on the fluorescence intensity of the G-CDs were studied. Fig. S4A† shows that NaCl solutions of different concentrations (0–0.5 mol L−1) have almost no effect on the fluorescence intensity of the G-CDs, indicating that the prepared G-CDs has certain application potential in bioimaging and biomolecular detection.
When the pH was changed within 4–9, the fluorescence intensity of the G-CDs remains the same (Fig. S4B†), indicating that the fluorescence of the G-CDs is not dependent on pH in the whole physio–pH ranges. After the prepared G-CDs were irradiated for 120 min by continuous UV light (365 nm), the fluorescence intensity of the G-CDs is only slightly reduced as shown in Fig. S4C.† In addition, the fluorescence intensity of the G-CDs stored in the solid status for a long time is not substantially changed. This result implies that the prepared G-CDs have great fluorescence stability.
2.5. Mechanism of CLB fluorescence assay
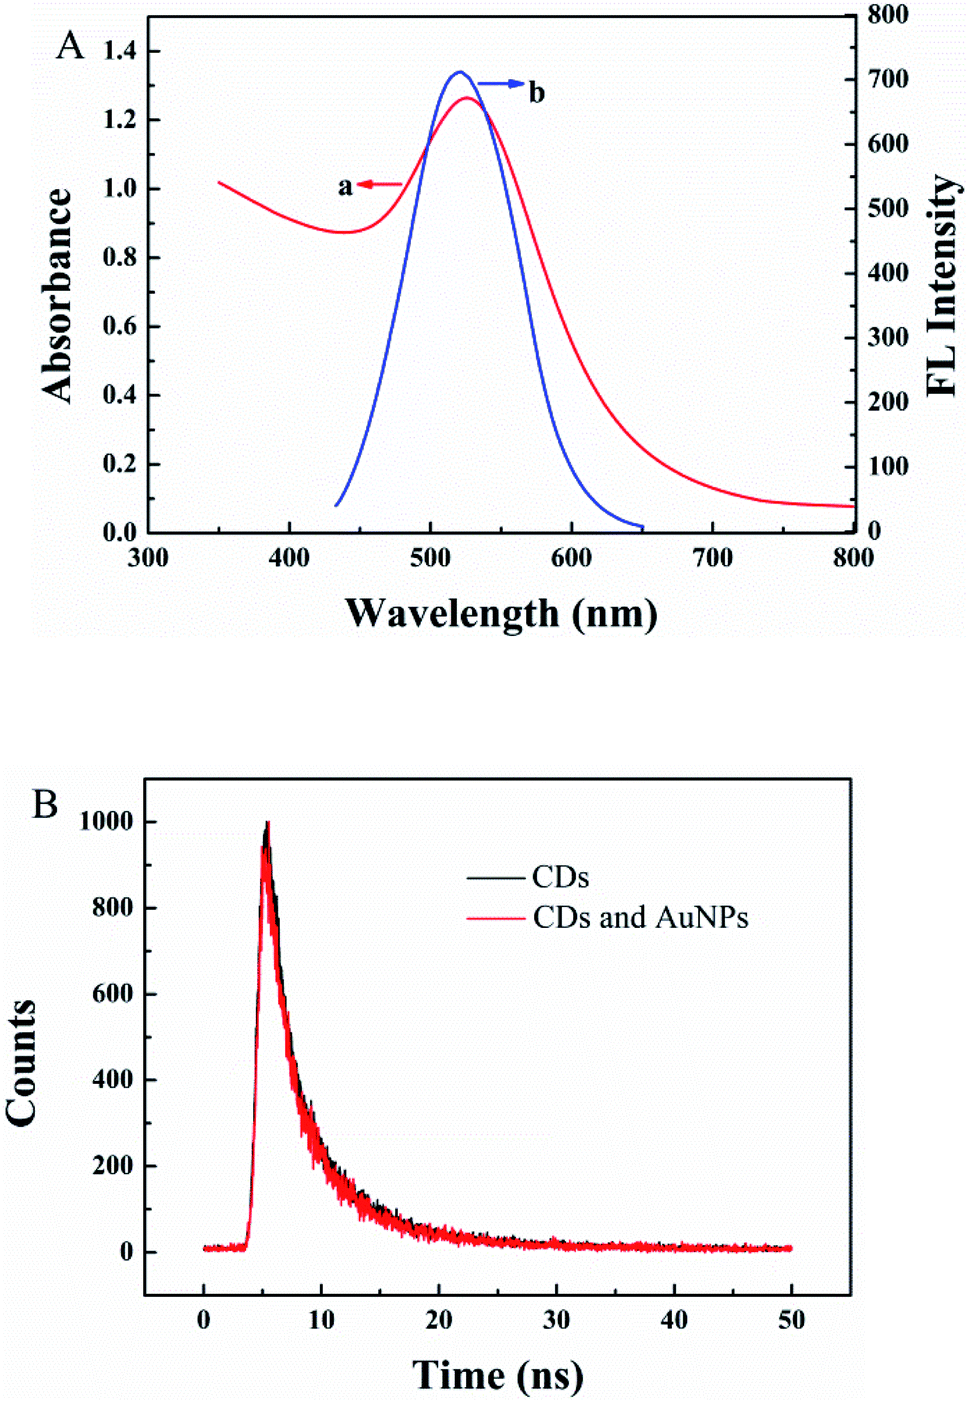
A sensor for CLB detection was constructed based on the IFE between G-CDs and AuNPs. The G-CDs are regarded as the fluorescence probe and the AuNPs as the fluorescence quenching agent. The working principle of the sensor is shown in Scheme 1. The fluorescence of G-CDs was substantially quenched by the AuNPs via IFE. CLB can be adsorbed on the surface of AuNPs through covalent bonding, leading to the aggregation of AuNPs. Therefore, the IFE of the AuNPs on the fluorescence of G-CDs was weakened and the fluorescence of the G-CDs was recovered. The fluorescence spectra of the G-CDs and the absorption spectra of the AuNPs were measured to confirm the fluorescence quenching mechanism. As shown in Fig. 3A, AuNPs show a broad absorption between 350 nm and 600 nm. The maximum absorption peak is approximately 525 nm, which greatly overlaps with the fluorescence emission of G-CDs excited at 410 nm. Therefore, the fluorescence of the G-CDs can be quenched by the AuNPs via IFE or fluorescence resonance energy transfer (FRET). Distinguishing IFE from FRET is difficult. The change in the fluorescence lifetime of the luminophore is essential in distinguishing the two effects. In general, the fluorescence lifetime of the luminophore is changed during FRET and remains the same during the IFE. On the basis of this principle, the fluorescence lifetime of the G-CDs in the presence and absence of AuNPs were further measured. Fig. 3B shows that the average fluorescence lifetime of G-CDs is 4.89 ns without AuNPs and 4.9 ns with AuNPs. The fluorescence lifetimes under the two conditions are basically unchanged. This result indicates that the quenched fluorescence emission of G-CDs by AuNPs was not due to FRET.
 |
| | Scheme 1 Mechanism of the fluorescence detection CLB based on G-CDs and AuNPs via IFE. | |
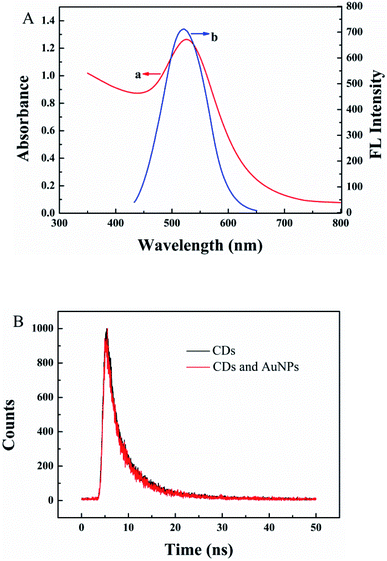 |
| | Fig. 3 (A) UV-vis absorption spectra of AuNPs (a) and fluorescence emission spectra of the G-CDs excited at 410 nm (b). (B) Fluorescence decay plot of the prepared G-CDs in the absence and presence of AuNPs. | |
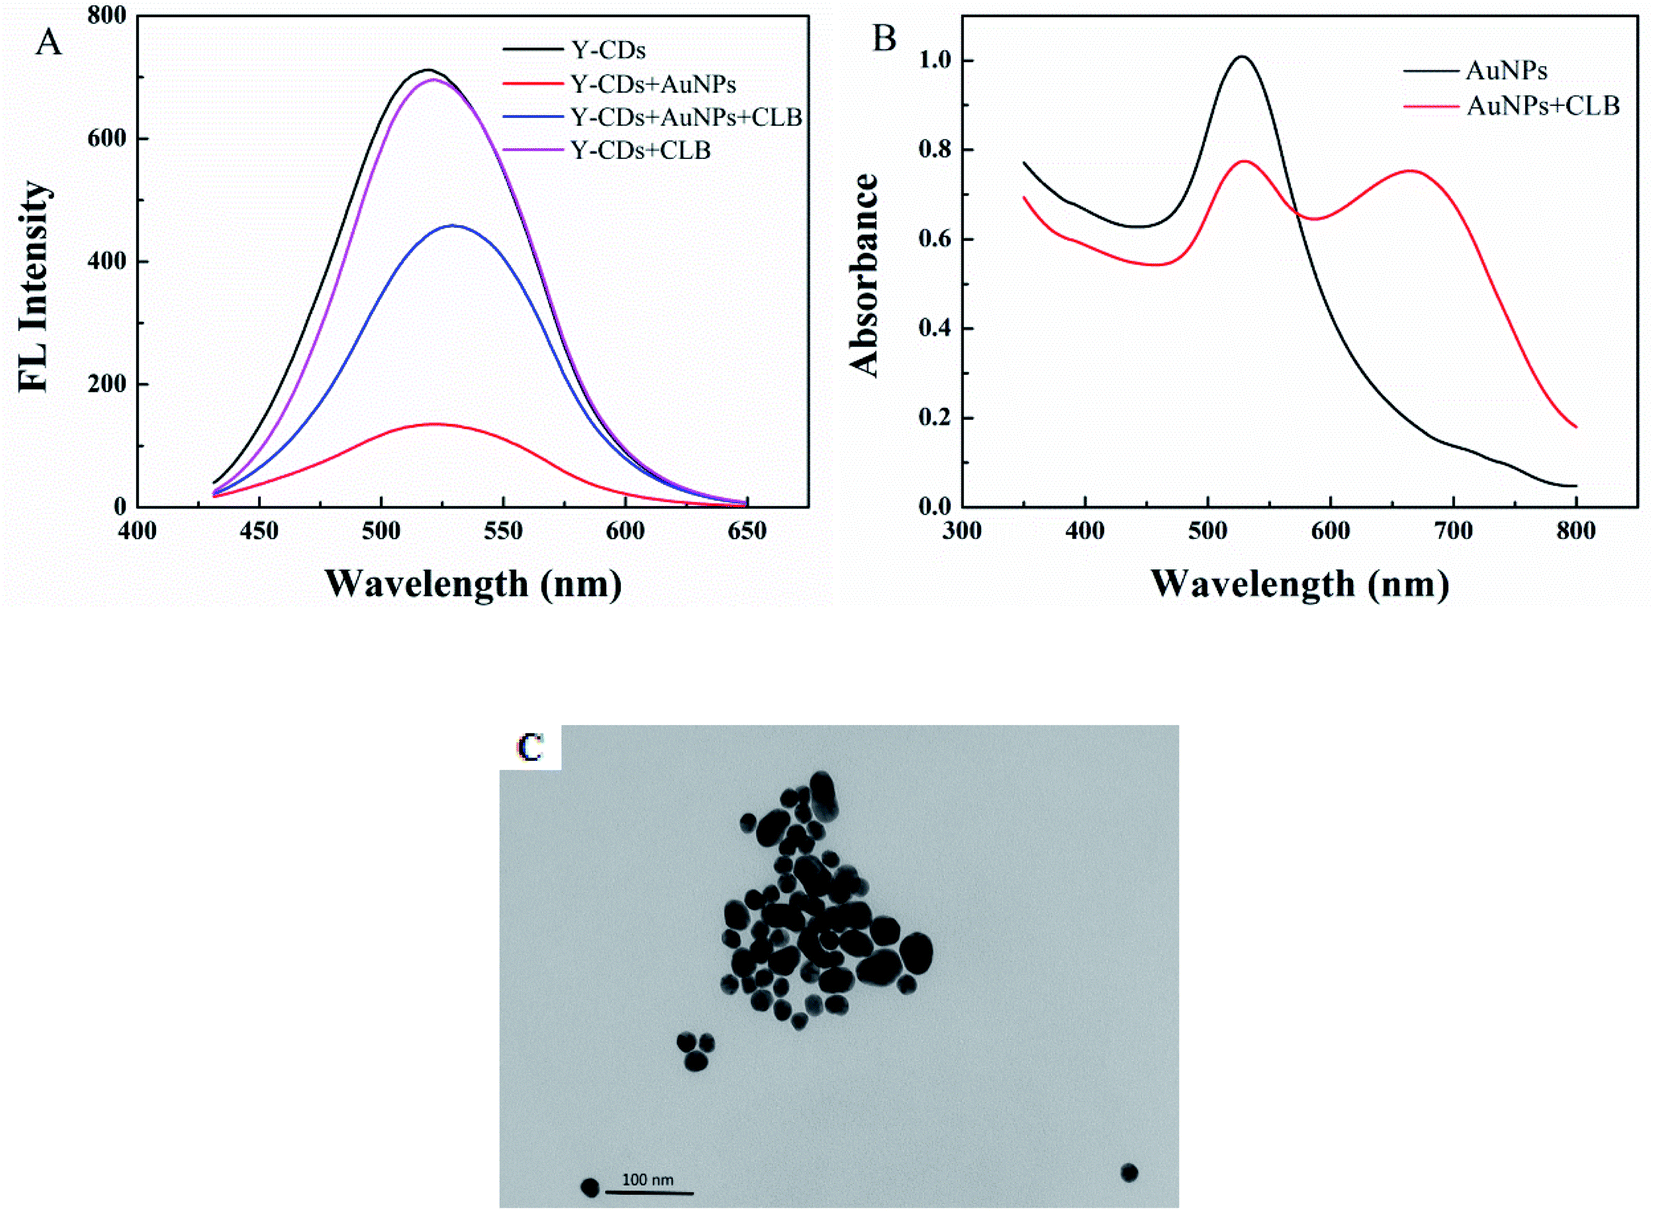
It can be seen from Fig. 4A, there is no obvious difference for the fluorescence intensity of G-CDs with and without CLB, indicating that CLB does not directly interact with the G-CDs. The fluorescence intensity of G-CDs is remarkably reduced when AuNPs were added into the G-CDs solution. However, the quenched fluorescence can be recovered when CLB was added. According to previous works, CLB contains aromatic anilinic –NH2 group and aliphatic –NH– group, owing the effects of ionic and coordination bonds, CLB can be adsorbed on the surface of AuNPs, resulting in the aggregation of the latter.29,30 TEM and UV absorption spectra results further confirm that the aggregation of AuNPs is induced by CLB. As shown in Fig. 4B, a clear absorption peak at 525 nm in UV-vis for AuNPs, after CLB was added into the AuNPs solution, a new absorption peak can be found at approximately 665 nm, which is substantially different from the absorption peak of the AuNPs. This finding indicates that the aggregation of AuNPs is caused by interaction between CLB and AuNPs. The TEM images are consistent with the UV-vis results. In Fig. S2A,† the original AuNPs are well dispersed in aqueous solution, while significant aggregation of AuNPs in the presence of CLB (Fig. 4C). This finding further proves the mechanism of this detection system. Therefore, an effective “off–on” fluorescent sensing platform based on IFE between G-CDs and AuNPs for CLB detection was developed.
 |
| | Fig. 4 (A) Fluorescence spectra of the G-CDs, G-CDs–AuNPs, G-CDs–AuNPs–CLB, and G-CDs–CLB. (B) UV-vis absorption spectra of AuNPs and AuNPs–CLB. (C) TEM image of AuNPs–CLB. | |
2.6. Optimization of experimental conditions
The analytical performance of the developed method is greatly influenced by the experimental factors. Therefore, several assay conditions such as media pH, concentration of AuNPs, and incubation time were optimized. Fig. S5A† shows that the fluorescence intensity of G-CDs is substantially reduced with the increase in AuNPs concentration. When the AuNPs concentration is increased to 3.0 nM, the G-CDs fluorescence quenching efficiency (F − F0)/F was 81%. F and F0 are the fluorescence intensity of the G-CDs solution in the absence and presence of AuNPs, respectively. Such high quenching efficiency is attributed to the greatly overlap of the absorption band of AuNPs with the emission band of the G-CDs, leading to the effective IFE quenching of the G-CDs. Although the AuNPs with high concentrations are effective for fluorescence quenching, 3.0 nM was chosen as the best concentration of the AuNPs to avoid any possible interference. The influence of pH (B–R buffer, pH 4.0–8.0) on the fluorescence recovery of G-CDs–AuNPs–CLB system was also investigated. It can be seen from Fig. S5B† that the recovering efficiency of fluorescence (F1 − F0)/F0 is first increased and then decreased with the increase in pH value and is the highest when pH 6.0. Therefore, B–R with pH 6.0 is the optimal buffer for this experiment. F1 and F0 are the fluorescence intensity of the G-CDs–AuNPs system in the presence and absence of CLB, respectively. Given that IFE is not affected by time, the fluorescence of the G-CDs is immediately quenched after the AuNPs were added to the G-CDs. Therefore, the entire reaction time mainly depends on the interaction between the AuNPs and CLB. The influence of CLB and AuNPs -incubation time on the A525 value of AuNPs was further studied. The results show that the A525 value of AuNPs gradually decreased with time and reached equilibrium after 10 min (Fig. S5C†). Therefore, 10 min was chosen as the optimal incubation time for AuNPs and CLB.
2.7. Quantification of CLB by G-CDs and AuNPs
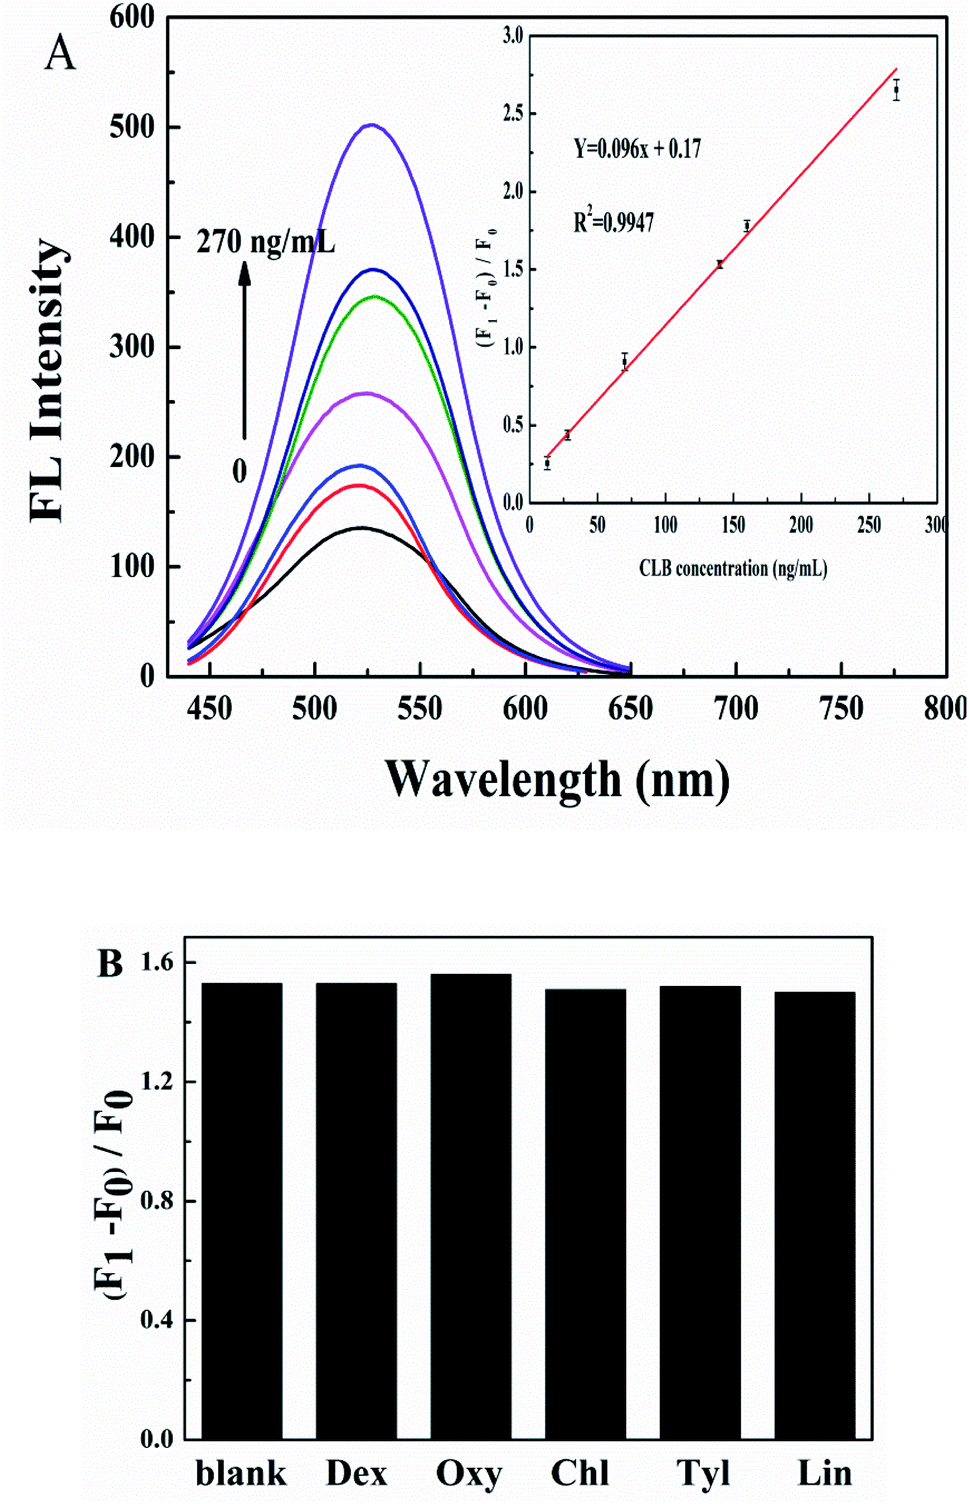
The linear response range of the detection system to CLB was investigated under optimized conditions. As shown in Fig. 5A, the IFE-decreased fluorescence of G-CDs recovers gradually with the increase in CLB concentrations. A good linear relationship was observed between CLB concentration and (F1 − F0)/F0 (F1 and F0 are the fluorescence intensity of G-CDs–AuNPs system in the presence and absence of CLB, respectively) in the range of 13–270 ng mL−1 (inset in Fig. 5A). The linear equation is (F1 − F0)/F0 = 0.096c + 0.17 (R2 = 0.9947), and the detection limit was 3.75 ng mL−1. Compared with other methods for the detection of CLB in the literature was shown in Table 1. It can be seen that compared with the existing methods, a relatively competitive LOD was achieved. Although these existing methods are of the broad linear range, most of them require expensive instruments, time-consuming, and cumbersome for operation, which limit the application of these methods for on-site and real-time determination of CLB. Our method is relatively simple to meet the need of rapid screening for CLB. Interference experiments were conducted on drugs commonly taken during pig growth, such as dexamethasone (Dex), chlortetracycline (Chl), oxytetracycline (Oxy), tylosin (Tyl), and lincomycin (Lin), to verify the selectivity of this method for CLB detection. The results are shown in Fig. 5B, Oxy with the same CLB concentration has no obvious influence on the CLB detection, Dex, Chl, Tyl, and Lin at 10 times the CLB concentration cause negligible fluorescence alterations. Therefore, other common drugs have no interference under CLB detection in pork liver, the sensing platform based on G-CDs and AuNPs is potentially applied for CLB determination.
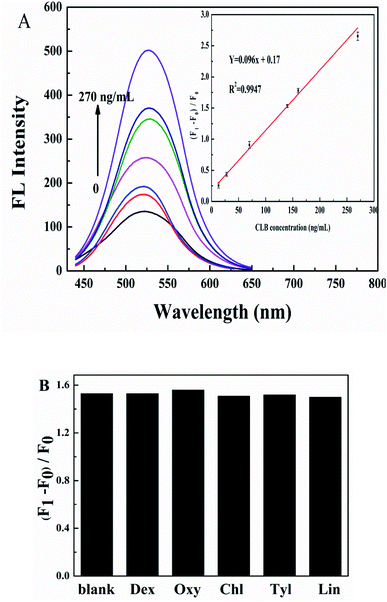 |
| | Fig. 5 (A) Fluorescence spectra of G-CDs with 3.0 nM AuNPs nanosensor in the presence of different CLB at increased concentration: 0, 13, 28, 70, 140, 160, 270 ng mL−1. Inset: calibration plot for CLB. (B) Fluorescence recovered efficiency of G-CDs–AuNPs–CLB in the presence of other substances, the concentration of CLB was set as 140 ng mL−1, B–R buffer pH = 6.0, the Dex, Chl, Tyl, and Lin were 10 times CLB concentration, Oxy was 1 time CLB concentration. | |
Table 1 Detection of CLB using different methods
| Methods |
Liner range (ng mL−1) |
Limit of detection (ng mL−1) |
Reference |
| GC-MS |
2–200 |
2.0 |
7 |
| Capillary electrophoresis |
5–1000 |
2.2 |
9 |
| Immunochromatographic assay |
— |
3.0 |
11 |
| ECD |
31.37–250.96 |
52.1 |
37 |
| Fluorometry/FRET |
200–1800 |
3.96 |
38 |
| G-CDs and Au NPs |
13–270 |
3.75 |
This work |
2.8. Analysis of CLB in pork liver samples
In order to further evaluate the feasibility and applicability of the sensing strategy in the real sample, the detection of pork liver samples were carried out according to the experimental procedure in Sections 2.5 and 2.6. Table 2 showed the analysis results of CLB in the spiked pork liver samples. It can be seen that the recoveries of the three experiments results are within 93.6–104%, indicating that the fluorescence sensor constructed by this method can be used for CLB detection in the pork liver samples.
Table 2 Determination results of CLB in real pork liver samples
| Samples |
Spiked (ng mL−1) |
Found (ng mL−1) |
Recovery (%) |
RSD (%) |
| 1 |
50 |
52.1 |
104 |
3.8 |
| 2 |
80 |
77 |
96.2 |
1.1 |
| 3 |
110 |
103 |
93.6 |
2.6 |
3. Conclusions
The G-CDs were successfully synthesized, and a simple and sensitive fluorescence sensing platform for CLB detection was developed based on the IFE effects between the G-CDs and AuNPs. AuNPs can quench the fluorescence of the G-CDs due to IFE. After CLB, the fluorescence of the G-CDs has gradually recovered because the interaction between CLB and AuNPs inhibits the IFE between the G-CDs and AuNPs. On the basis of this principle, the proposed sensing platform is of sound linear relationship with detection limit of 3.75 ng mL−1. The proposed sensing platform exhibits excellent selectivity and satisfactory accuracy for actual sample detection and thus has a wide application prospect in CLB detection.
Conflicts of interest
The researcher claims no conflicts of interests.
Acknowledgements
This work was supported by the National Natural Science Foundation of China (21773150), the Natural Science Foundation of Shaanxi Province (2018JM2045), the National College Student Innovation and Entrepreneurship Training Program (202110722012), and the Xianyang Normal University Special Research Fund Project (15XSYK038, XSYK2019).
References
- G. Mazzanti, A. D. Sotto, C. Daniele, L. Battinelli, G. Brambilla, M. Fiori, S. Loizzo and A. Loizzo, Food Chem. Toxicol., 2007, 48, 1694–1699 CrossRef.
- A. Aresta, C. D. Calvano, F. Palmisano and C. G. Zambonin, J. Pharmaceut Biomed, 2008, 47, 641–645 CrossRef CAS PubMed.
- G. Degand, A. Bernes-Duyckaerts and G. Maghuin-Rogister, J. Food Chem., 1992, 40, 70–75 CrossRef CAS.
- M. A. Johansson and K. E. Hellenäs, J. Food Sci. Tech., 2004, 39, 891–898 CrossRef CAS.
- Z. Li, Y. Wang, W. Kong, C. Li, Z. Wang and Z. Fu, Biosens. Bioelectron., 2013, 39, 311–314 CrossRef CAS PubMed.
- L. Y. Chang, S. S. Chou and D. F. Hwang, J. Food Drug Anal., 2005, 13, 163–167 CAS.
- D. D. Corcia, V. Morra, M. Pazzi and M. Vincenti, Biomed. Chromatogr., 2009, 24, 358–366 Search PubMed.
- P. A. Guy, M. C Savoy and R. H. Stadler, J. Chromatogr., Biomed. Appl., 1999, 736, 209–219 CrossRef CAS.
- Y. Shi, Y. Huang, J. Duan, H. Chen and G. Chen, J. Chromatogr. A, 2006, 1125, 124–128 CrossRef CAS.
- L. Ma, A. Nilghaz, J. R. Choi, X. Liu and X. Lu, Food Chem., 2018, 246, 437–441 CrossRef CAS.
- C. Zhu, G. Zhao and W. Dou, Sens. Actuators, B, 2018, 266, 392–399 CrossRef CAS.
- D. Yao, C. Li, G. Wen, A. Liang and Z. Jiang, Talanta, 2020, 209, 120529 CrossRef CAS.
- Y. Tang, J. Gao, X. Liu, X. Gao, T. Ma and X. Lu, Food Chem., 2017, 228, 437–441 CrossRef.
- Y. Yang, D. Huo, H. Wu, X. Wang, J. Yang, M. Bian, Y. Ma and C. Hou, Sens. Actuators, B, 2018, 274, 296–303 CrossRef CAS.
- Q. Q. Zhang, B. B. Chen, H. Y. Zou, Y. F. Li and C. Z. Huang, Biosens. Bioelectron., 2018, 100, 148–154 CrossRef CAS PubMed.
- X. Yang, J. Xu, N. Luo, F. Tang, M. Zhang and B. Zhao, Food Chem., 2020, 310, 125832 CrossRef CAS.
- Y. H. Yuan, Z. X. Liu, R. S. Li, H. Y. Zou, M. Lin and C. Z. Huang, Nanoscale, 2016, 8, 6770–6776 RSC.
- Y. Guo, L. Yang, W. Li, X. Wang, Y. Shang and B. Li, Microchim. Acta, 2016, 183, 1409–1416 CrossRef CAS.
- Q. Ye, F. Yan, D. Kong, J. Zhang, X. Zhou, J. Xu and L. Chen, Sens. Actuators, B, 2017, 250, 712–720 CrossRef CAS.
- L. Jiang, H. Ding, M. Xu, X. Hu, S. Li and M. Zhang, Small, 2020, 16, 2000680 CrossRef CAS.
- J. Xia, Y. Kawamura, T. Suehiro, Y. Chen and K. Sato, Drug Discoveries
Ther., 2019, 13, 114–117 CrossRef CAS PubMed.
- S. Lu, G. Xiao, L. Sui, T. Feng, X. Yong and S. Zhu, Angew. Chem., Int. Ed., 2017, 129, 6283–6287 CrossRef.
- S. Qu, D. Zhou, D. Li, W. Ji, P. Jing, D. Han, L. Liu, H. Zeng and D. Shen, Adv. Mater., 2016, 28, 3516–3521 CrossRef CAS PubMed.
- S. Sun, L. Zhang, K. Jiang, A. Wu and H. Lin, Chem. Mater., 2016, 28, 8659–8668 CrossRef CAS.
- X. Miao, X. Yan, D. Qu, D. Li, F. F. Tao and Z. Sun, ACS Appl. Mater. Interfaces, 2017, 9, 18549–18556 CrossRef CAS.
- R. Jia, K. Jin, J. Zhang, X. Zheng, S. Wang and J. Zhang, Sens. Actuators, B, 2020, 321, 128506 CrossRef CAS.
- Y. Hu, Z. Gao and J. Luo, Food Chem., 2021, 335, 127677 CrossRef CAS.
- Y. Liu, Q. Lu, X. Hu, H. Wang, H. Li, Y. Zhang and S. Yang, J. Fluoresc., 2017, 27, 1847–1853 CrossRef PubMed.
- J. Kang, Y. Zhang, X. Li, L. Miao and A. Wu, ACS Appl. Mater. Interfaces, 2016, 9, 1–5 CrossRef CAS.
- J. Xu, J. Li, F. Shen, Y. Luo and C. Sun, Food Chem., 2014, 46, 67–74 CAS.
- J. Hou, W. Wang, T. Zhou, B. Wang, H. Li and L. Ding, Nanoscale, 2016, 8, 11185–11193 RSC.
- Y. Song, S. Zhu, S. Zhang, Y. Fu, L. Wang, X. Zhao and B. Yang, J. Mater. Chem. C, 2015, 3, 5976–5984 RSC.
- S. Zhu, J. Shao, Y. Song, X. Zhao, J. Du, L. Wang and B. Yang, Nanoscale, 2015, 7, 7927–7933 RSC.
- Y. W. Zeng, D. K. Ma, W. Wang, J. J. Chen, L. Zhou, Y. Z. Zheng and S. Huang, Appl. Surf. Sci., 2015, 342, 136–143 CrossRef CAS.
- B. Liu, J. Xie, H. Ma, X. Zhang, Y. Pan and J. Lv, Small, 2017, 13, 1601001 CrossRef PubMed.
- Z. Su, H. Shen, H. Wang, J. Wang, J. Li, G. U. Nienhaus and G. Wei, Adv. Funct. Mater., 2015, 25, 5472–5478 CrossRef CAS.
- B. Bo, X. Zhu, P. Miao, D. Pei, B. Jiang, Y. Shu and G. Li, Talanta, 2013, 113, 36–40 CrossRef CAS PubMed.
- J. Xu, Y. Li, J. Guo, F. Shen, Y. Luo and C. Sun, Food Control, 2014, 46, 67–74 CrossRef CAS.
Footnote |
| † Electronic supplementary information (ESI) available. See DOI: 10.1039/d1ra08724j |
|
| This journal is © The Royal Society of Chemistry 2022 |
Click here to see how this site uses Cookies. View our privacy policy here. 
 Open Access Article
 This Open Access Article is licensed under a Creative Commons Attribution-Non Commercial 3.0 Unported Licence
 *a,
Min Yan Zhenga,
Wei Zhanga and
Dao Dao Hu
*a,
Min Yan Zhenga,
Wei Zhanga and
Dao Dao Hu