 Open Access Article
Preparation and application of polyethyleneimine-modified corncob magnetic gel for removal of Pb(II) and Cu(II) ions from aqueous solution
Zhi Chen *,
Jun Zeng
 ,
Zhi-Bo Zhang
 ,
Zhi-Jie Zhang
 ,
Shan Ma
 ,
Cong-Ming Tang
 and
Jun-Qiang Xu
College of Chemistry and Chemical Engineering, Chongqing University of Technology, Chongqing 400054, P. R. China
First published on 12th January 2022
Abstract
As a biomass resource, corncob is a kind of agricultural by-product with wide sources and low cost. Because its composition contains a large number of functional polymers such as cellulose, chitosan, and semi chitosan, corncob can be chemically modified to prepare a variety of adsorption materials. In this study, a magnetic gel material (PEI-CC@Fe3O4) consisting of corncob modified by glutaraldehyde-crosslinked polyethyleneimine (PEI) was successfully prepared and applied to the adsorption of heavy metal ions in aqueous solutions. The structure, thermal stability, and adsorption of heavy metal ions of the magnetic gel material (PEI-CC@Fe3O4) were characterized by Fourier-transform infrared spectroscopy (FT-IR), X-ray diffraction phase analysis (XRD), scanning electron microscopy (SEM), thermogravimetric analysis (TGA), and X-ray photoelectron spectroscopy (XPS). The results showed that PEI was crosslinked to the corncob through Aldol reaction and Schiff-base reaction. The heavy metal ion adsorption experiment showed that the PEI-CC@Fe3O4 had better adsorption toward divalent copper ions and divalent lead ions at 303 K, and the maximum adsorption capacities reached 459.4 mg g−1 and 290.8 mg g−1, respectively. Moreover, the study of isothermal adsorption and adsorption kinetics shows that the adsorption process is pseudo-second-order kinetics model adsorption, which belongs to Langmuir isothermal adsorption. Such excellent adsorption performance will contribute to the application of corncob biomass materials in industrial polluted wastewater.
1. Introduction
The development of industry has led to the accumulation of heavy metals in sewage.1–3 Heavy metals can cause serious disease if they accumulate in the human body because they are not biodegradable.4–6 To solve this problem, researchers have developed numerous methods to eliminate heavy metal ions.7 These technologies consist of precipitation, adsorption, ion exchange, and so on.8–10 The adsorption method,11 with its practicability, convenience, and environmental friendliness, has become the most frequently employed.12 Of the large amount of agricultural waste generated each year, only a small amount is used for resource recycling, and a larger part is incinerated.13 This not only burdens the environment but also leads to the wastage of many available resources. Corncob is one of the most common agricultural wastes. It's mainly constituted of cellulose, hemicellulose, and lignin. These macromolecules have chemical functional groups14 (for example, hydroxyl, carboxyl, and amino) that have a certain binding capacity with metal ions; therefore, corncob is considered an excellent natural adsorbent material.15 However, owing to the poor adsorption performance of untreated corncob, it needs to be chemically or physically modified to improve its adsorption performance.16 For example, biomass-activated carbon,17 acid–base reagents,18,19 esterification,20 and polymer grafting21 have been used to modify corncobs. The following exhibit that corncob-based adsorbents have a particular talent to transfer most heavy metal ions.22 The elimination result of the modified corncob is best than that of the unmodified corncob.23,24 However, the cell wall structure of biomass greatly reduces the adsorption effect of the constituent functional groups toward heavy metal ions. Thus, it is imperative to exploit a fresh approach to form a corncob base and enhance the adsorption performance of the adsorbent material.Polyethyleneimine (PEI) is consists of a huge figure of free amino groups. Therefore, it can combine with heavy metal ions through electrostatic action or coordination complexation,25–27 thus showing strong adsorption performance. However, PEI cannot be employed as an adsorbent alone because of its perfect water solubility. Thus reducing its direct use as an adsorbent for water treatment.28–30
Therefore, in this study, the glutaraldehyde cross-linker methodology was accustomed to graft PEI onto alkali-pretreated corncobs, and magnetic particles were added to prepare PEI-modified corncob magnetic gel adsorption materials. The adsorption performance and influencing factors of divalent copper ion and divalent lead ion were studied, and the related adsorption mechanism was investigated. This study has certain theoretical and sensible significance for the analysis, development, and adhibition of adsorption materials based on biomass as raw materials.
2. Experimental
2.1 Materials and reagents
The soft and white part of the corncob sponge layer in the middle of the corncob was crushed into the 60-mesh size and dried for later use as the raw material, defined as CC. Polyethyleneimine and sodium sulfite (≥98%, A.R. grade) were purchased from Shanghai Titan Technology Co., Ltd, Shanghai, China. Glutaraldehyde (A.R. grade, ≥50% solution), lead nitrate (A.R. grade, ≥98%), iron(III) chloride hexahydrate (A.R. grade, ≥97%), and copper nitrate (A.R. grade, ≥98%) were purchased from Chengdu Kelon Chemical Reagent Factory, Chengdu, China. All other reagents were purchased as an analytical grade, and all solutions were prepared with deionized water (the electrical resistivity was 18.2 MΩ cm at 25 °C, GWB1T/2T water purification system from Beijing Puxi General Instrument Co., Ltd, Beijing, China).2.2 Preparation of modified corncob gel
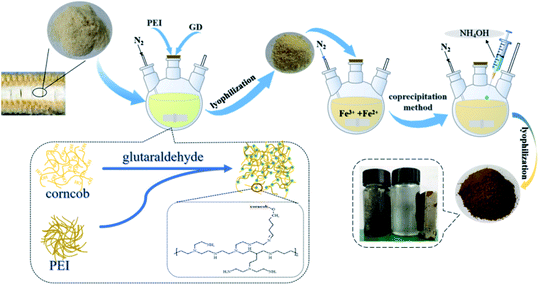
Polyethyleneimine was grafted onto corncob by crosslinking with glutaraldehyde.31 The specific experimental steps are as follows: the corncob was placed into a three-mouth flask containing an appropriate amount of NaOH solution and then sonicated for 30 min. Afterward, the system was stirred for 4 h under nitrogen at 25 °C, and a certain amount of PEI solutions was added dropwise, after which the system was stirred again for 40 min. Finally, an appropriate amount of glutaraldehyde was added for crosslinking. The obtained product, modified corncob gel was washed with water to neutrality, freeze-vacuum-dried (temperature: <−50 °C, vacuum pressure <5 Pa), and pulverized to obtain the PEI-modified corncob gel material, denoted as PEI-CC.2.3 Preparation of modified corncob magnetic gel
Magnetic particles of Fe3O4 were embedded in the gel material through the coprecipitation method.32 First, a solution with Fe3+ was prepared (1.207 g FeCl3·6H2O is placed in a three-necked flask containing 90 mL deionized water). And 0.094 g of anhydrous sodium sulfite was added. Then, add PEI-CC while shaking the mixture under a nitrogen environment for 2 h. After the mixture was heated to 333 K, ammonia was added drop-wise and continuously stirred for one hour. Wash the prepared modified corncob magnetic gel with deionized water to neutrality, and finally, a brown solid powder material was obtained by freeze-vacuum drying, named PEI-CC@Fe3O4. The preparation process and application effect are illustrated in Fig. 1.2.4 Material characterization
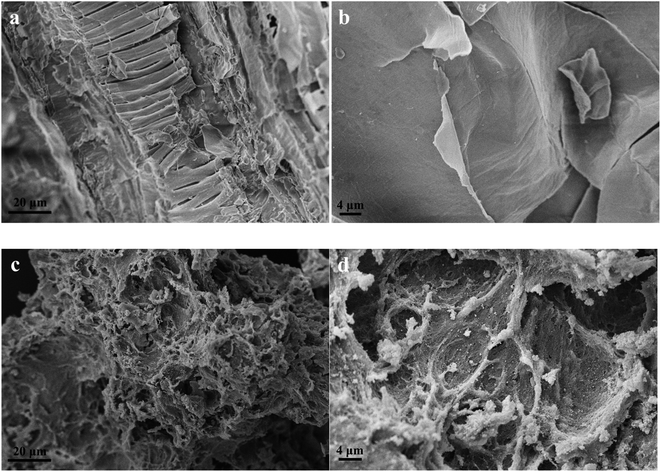
The surface of the sample was gold-sprayed, and the morphology of the PEI-CC@Fe3O4 gel material was observed using scanning electron microscopy (SEM, Zeiss EVO18, Germany). The Fourier-transform infrared spectroscopy (FT-IR, Nicolet iS 50, USA) was exploited to detect the surface groups of gel materials. The thermal stability analysis was conducted using a thermogravimetric analyzer (TGA, Netzsch STA2500, Germany). The crystal structure was characterized via X-ray diffraction phase analysis (XRD, Shimadzu, XRD-7000, JPN). X-ray photoelectron spectroscopy (XPS, Thermo Fisher Scientific K-Alpha, USA) was employed for an XPS energy spectrum test (and the energy standard of charge correction is C 1s = 284.80 eV).2.5 Adsorption experiment
An experiment was done through a batch processing method. Copper nitrate and lead nitrate were added to deionized water to produce divalent copper ion and divalent lead ion stock solution (1000 mg L−1), respectively. The solution was configured to specific concentrations as required.Divalent copper ion and divalent lead ion solutions were placed in 20 mL glass bottles, and the solution pH was adjusted using HCl solution. An amount of PEI-CC@Fe3O4 gel material was joined to the solution. After adsorption in a constant-temperature, shaking box for a certain period, the residual concentration of heavy metal ions was governed by atomic absorption spectrometry. Thus, the adsorption capacity is calculated. The removal rate and the adsorption amount were counted using eqn (1) and (2):
 | (1) |
 | (2) |
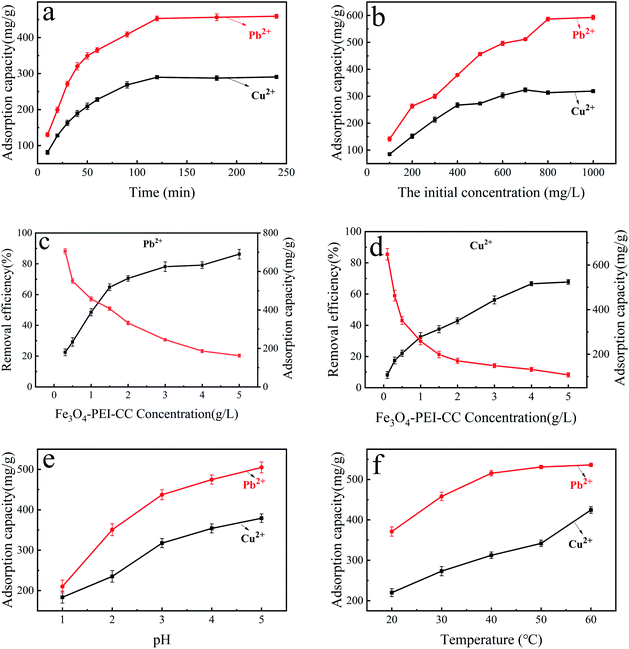
The effect of adsorption time on the divalent copper ion and divalent lead ion removal was determined through batch experiments. Different concentrations of adsorbent (0.3, 0.5, 1, 1.5, 2, 3, 4, 5 g L−1) were added at 303 K, which is to examine the force of concentration on the adsorption of divalent copper ion and divalent lead ion. To research the effect of initial concentrations of divalent copper ion and divalent lead ion, the experiment was carried out with different preliminary concentrations (100–1000 mg L−1). In the experiment, the pH value was adjusted from 1 to 5 to explore the impact of solution pH on adsorption. The influence of adsorption temperature on adsorption was examined by adjusting the temperature (293 K, 303 K, 313 K, 323 K, 333 K).
3. Results and discussion
3.1 Material characterizations
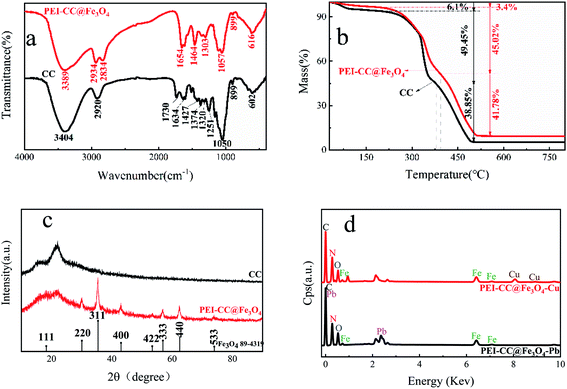
Owing to the superposition of the –OH bond in the PEI-modified corncob and the N–H bond stretching vibration of PEI, the peak of the PEI-CC@Fe3O4 spectrum at 3389 cm−1 was wider and stronger than the corresponding peak of the CC spectrum. Moreover, due to the stretching vibration of the C–N bond, a new peak of 1464 cm−1 appears in the PEI-CC@Fe3O4 spectrum.36,37 The PEI-CC@Fe3O4 spectrum showed no peak at 1730 cm−1, indicating that hemicellulose in the raw material had been degraded. The C![[double bond, length as m-dash]](https://www.rsc.org/images/entities/char_e001.gif) N tensile vibration peak is 1634 cm−1 and 1654 cm−1 in the FT-IR of CC and PEI-CC@Fe3O4.38 This proves that PEI successfully modified the corncob by crosslinking with glutaraldehyde.
N tensile vibration peak is 1634 cm−1 and 1654 cm−1 in the FT-IR of CC and PEI-CC@Fe3O4.38 This proves that PEI successfully modified the corncob by crosslinking with glutaraldehyde.
In general, the oxygen-containing functional groups (carboxyl and hydroxyl) and the introduced amino groups on the corncob are involved in the binding of heavy metal ions, which indicates that the surface complexation may be the adsorption mechanism of the corncob for heavy metal ions.
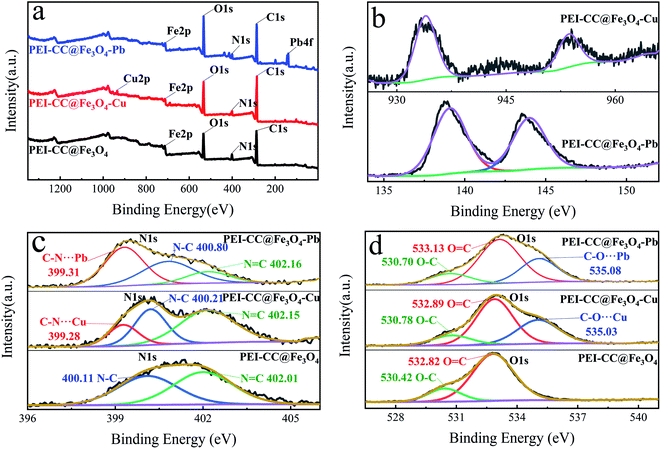
![[double bond, length as m-dash]](https://www.rsc.org/images/entities/char_e001.gif) C42,43 shifted to higher binding energies, and new peaks occurred at 535.03 eV and 535.08 eV. The increase in binding energy after the adsorption of divalent copper ion and divalent lead ion occurred because oxygen atoms shared electrons with Cu and Pb, which lessened the electron density of nitrogen atoms and increased the binding energy. The binding energies peaks of 535.03 eV and 535.08 eV can be blamed on the coordination forms of C–O⋯Cu and C–O⋯Pb.44,45 Similarly, in the N 1s narrow-spectrum before adsorption (Fig. 4d), the characteristic peaks at 400.12 eV and 402.01 eV relate to N–C and N
C42,43 shifted to higher binding energies, and new peaks occurred at 535.03 eV and 535.08 eV. The increase in binding energy after the adsorption of divalent copper ion and divalent lead ion occurred because oxygen atoms shared electrons with Cu and Pb, which lessened the electron density of nitrogen atoms and increased the binding energy. The binding energies peaks of 535.03 eV and 535.08 eV can be blamed on the coordination forms of C–O⋯Cu and C–O⋯Pb.44,45 Similarly, in the N 1s narrow-spectrum before adsorption (Fig. 4d), the characteristic peaks at 400.12 eV and 402.01 eV relate to N–C and N![[double bond, length as m-dash]](https://www.rsc.org/images/entities/char_e001.gif) C, individually, and the binding energies of the two characteristic peaks increased after adsorption. This was because nitrogen atoms shared electrons with Cu and Pb, which lessened nitrogen atom electron cloud density and increased their binding energy. New peaks occurred at 399.28 eV and 399.31 eV, because of the existence of C–NH⋯Pb and C–NH⋯Cu.46,47 During the adsorption course of divalent copper ion and divalent lead ion, strong coordination and complexation occurred between the material and –NH2 and –OH; thus, the introduction of –NH2 in PEI improved the adsorption effect of heavy metals.
C, individually, and the binding energies of the two characteristic peaks increased after adsorption. This was because nitrogen atoms shared electrons with Cu and Pb, which lessened nitrogen atom electron cloud density and increased their binding energy. New peaks occurred at 399.28 eV and 399.31 eV, because of the existence of C–NH⋯Pb and C–NH⋯Cu.46,47 During the adsorption course of divalent copper ion and divalent lead ion, strong coordination and complexation occurred between the material and –NH2 and –OH; thus, the introduction of –NH2 in PEI improved the adsorption effect of heavy metals.
3.2 Divalent copper ion and divalent lead ion adsorption experiment
Increasing the solution's pH, the adsorption ability of PEI-CC@Fe3O4 toward divalent lead ion increased to 505 mg g−1, while the adsorption capability of PEI-CC@Fe3O4 toward divalent copper ion swelled to 379.2 mg g−1. The reason is the competitive adsorption of high concentration H+ and heavy metal ions will occur at a lower pH. Therefore, H+ occupies the active site on the PEI-CC@Fe3O4 surface, and adsorption of H+ on heavy metal ions would generate electrostatic repulsion, thereby hindering the adsorption. Second, the amino and hydroxyl groups on the PEI-CC@Fe3O4 surface were highly protonated at lower pH, which also affects the ability of the groups in PEI-CC@Fe3O4 to coordinate with heavy metal ions. Increasing the pH, H+ concentration goes down, protonation of amino groups and hydroxyl groups weakened, the electrostatic repulsion decreased, and the adsorption resistance of heavy metal ions dwindled, thereby raising the adsorption capacity.
3.3 Adsorption isotherm
Adsorption isotherm of metal ions is usually described by the Langmuir equation (eqn (3)) and Freundlich equation (eqn (4)), given by
 | (3) |
 | (4) |
 | (5) |
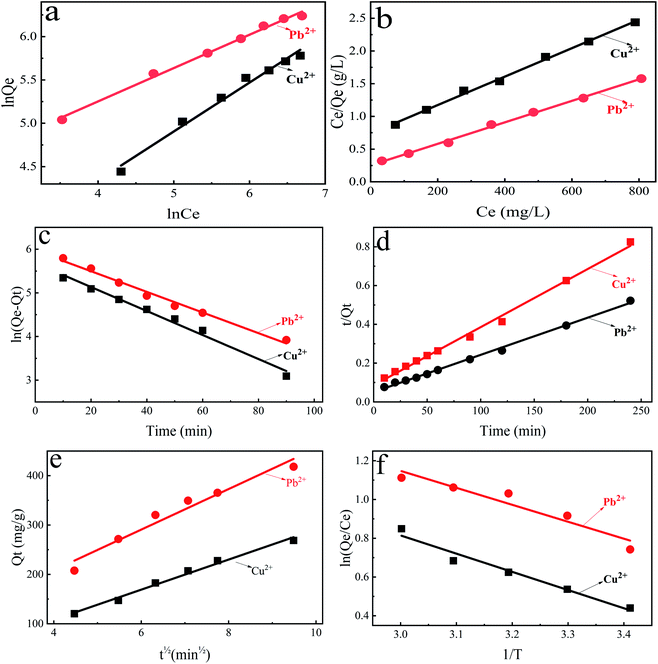
The adsorption isotherm models of Langmuir and Freundlich were used to fit the adsorption data of divalent copper ion and divalent lead ion isotherms (Fig. 6a and b). The fitted data are presented in Table 1.
| Metal ion | Freundlich | Langmuir | ||||
|---|---|---|---|---|---|---|
| KF (mg1−1/n L1/n g−1) | n | R2 | Qm (mg g−1) | KL (L mg−1) | R2 | |
| Cu2+ | 8.036 | 1.77 | 0.9849 | 460.83 | 2.94 × 10⁻³ | 0.9965 |
| Pb2+ | 41 | 2.6 | 0.9945 | 609.76 | 6.51 × 10⁻³ | 0.9977 |
As shown in Table 1, R2 of both models is greater than 0.99, but Langmuir isothermal adsorption model fits the data better than Freundlich isothermal adsorption model. Therefore, the adsorption process of divalent copper ion and divalent lead ion by PEI-CC@Fe3O4 be able to better described by the Langmuir equation. The premise of the Langmuir isothermal adsorption model is that the monolayer adsorption takes place on the material surface, while chemical adsorption occurs in monolayer adsorption. Therefore, the mechanism of PEI-CC@Fe3O4 adsorption toward divalent copper ion and divalent lead ion was mainly chemical adsorption.
In the adsorption course, RL can settle the degree of interaction between adsorbed material and metal ions. RL > 1 indicates that the adsorption is disadvantageous; when RL = 1, the amount of adsorption material is linearly correlated to the adsorption capacity of metal ions. When 0 < RL < 1, adsorption of metal ions is favorable. When RL is equal to 0, the adsorption procedure of the adsorbent on metal ions is irreversible when 0 < RL < 1, adsorption of metal ions is favorable; when RL = 0, the adsorption process of metal ions is irreversible. RL can be computed from eqn (5).
Calculated RL values of adsorbed divalent copper ion and divalent lead ion are between 0 and 1 (0.33 and 0.18, respectively). This shows that the PEI-modified corncob magnetic gel adsorption material is beneficial to the adsorption of divalent copper ion and divalent lead ion. Moreover, the RL value corresponding to the adsorption of divalent lead ion was less than that of divalent copper ion; thus, the measure of divalent lead ion adsorbed by PEI-CC@Fe3O4 was greater than divalent copper ion, which also agrees with experimental facts.
3.4 Adsorption kinetics
The experimental results of PEI-CC@Fe3O4 adsorption toward divalent copper ion and divalent lead ion over time are fitted by the pseudo-first-order kinetic equation (eqn (6)) and pseudo-second-order kinetic equation (eqn (7)).
ln(Qe,exp − Qt) = ln![[thin space (1/6-em)]](https://www.rsc.org/images/entities/char_2009.gif) Qe,cal − k1t, Qe,cal − k1t,
| (6) |
 | (7) |
| Qt = kp·t1/2+ C, | (8) |
The pseudo-second-order kinetic model can well-mannered communicate the adsorption of divalent copper ion and divalent lead ion by PEI-CC@Fe3O4 (R2 > 0.99). The specific data is in Table 2. The saturated adsorption capacity calculated by the pseudo-second-order kinetics model is more conform to the actual situation. It is indicated PEI-CC@Fe3O4 mainly adsorbed divalent copper ion and divalent lead ion through chemical adsorption.
| Metal ion | Pseudo-first-order kinetic model | Pseudo-second-order kinetic model | |||||
|---|---|---|---|---|---|---|---|
| Qe,exp (mg g−1) | Qe,cal (mg g−1) | K1 (min−1) | R2 | Qe,cal (mg g−1) | K2 (g mg−1 min−1) | R2 | |
| Cu2+ | 290.8 | 294.23 | 0.0275 | 0.988 | 333.33 | 1.05 × 10⁻⁴ | 0.995 |
| Pb2+ | 459.4 | 391.20 | 0.0237 | 0.988 | 520.83 | 7.22 × 10⁻⁵ | 0.997 |
The adsorption reaction process is generally divided into three steps: external diffusion, internal diffusion, and chemical adsorption. External diffusion is mainly caused by the rapid and full shaking of the solution, while in internal diffusion, the solute diffuses into the inside through the pores of material, and the internal diffusion will be accompanied by the progress of chemical adsorption. Usually, the adsorption rate-control step is determined by the latter two steps. By fitting the experimental data (Fig. 6e), we can determine the key rate-controlling steps. The fitting formula is shown in eqn (8).
The larger the Kp value, the easier it is for the adsorbate to diffuse inside the adsorbent. If the origin is on a line describing the relationship between Qt and t1/2, then internal diffusion is a rate-controlled process.
As presented in Table 3, the internal diffusion rate constant kp of divalent copper ion is smaller than divalent lead ion, indicating that divalent lead ion diffused more easily in the adsorbent material than divalent copper ion. The fitting line does not cross the origin, indicating that the rate control process is not internal diffusion. Therefore, the adsorption of divalent copper ion and divalent lead ion by PEI-CC@Fe3O4 was mainly by chemical adsorption, while internal diffusion was secondary.
| Internal diffusion | |||
|---|---|---|---|
| kp | C (mg g−1) | R2 | |
| Cu2+ | 26.98 | 10.23 | 0.98 |
| Pb2+ | 40.81 | 33.33 | 0.95 |
3.5 Adsorption thermodynamics
The adsorption thermodynamics of PEI-CC@Fe3O4 gel adsorption material can be expressed by the following equations:
 | (9) |
| ΔG = ΔH − TΔS, | (10) |
According to temperature change data, the results of PEI-CC@Fe3O4 adsorption toward divalent copper ion and divalent lead ion were fitted (Fig. 6f).
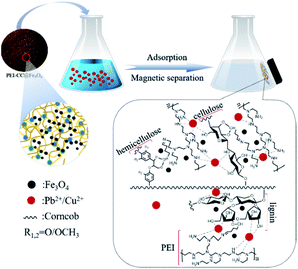
Adsorption thermodynamics of divalent copper ion and divalent lead ion adsorption on the PEI-CC@Fe3O4 were investigated at 308 K (Table 4). For the adsorption of divalent copper ion and divalent lead ion, the ΔG values at dissimilar temperatures were less than zero. This indicates that the adsorption of divalent copper ion and divalent lead ion by PEI-CC@Fe3O4 was spontaneous. The absolute value of ΔG increases with the increase of temperature. The results show that with the increase of temperature, the higher the driving force behind the reaction process, the easier the adsorption. This is consistent with the endothermic reaction of the adsorption process (ΔH > 0) and the explanation that high temperature is beneficial to adsorption. Moreover, ΔS > 0 indicates that the disorder of solid–liquid level increases. Fig. 7 illustrates the interaction mechanism between metal ions and PEI-CC@Fe3O4.
| T (K) | ΔG (kJ mol−1) | ΔS [J (mol−1 K−1)] | ΔH (kJ mol−1) | ||||
|---|---|---|---|---|---|---|---|
| 293.15 | 303.15 | 313.15 | 323.15 | 333.15 | |||
| Cu2+ | −1.04 | −1.35 | −1.65 | −1.95 | −2.25 | 30.20 | 7.81 |
| Pb2+ | −1.92 | −2.23 | −2.55 | −2.86 | −3.17 | 31.36 | 7.27 |
4. Conclusion
In this study, a PEI-modified corncob magnetic gel material was prepared using agricultural waste corncob as the raw material, PEI as a modifier, glutaraldehyde as a crosslinking agent, and Fe3O4 as magnetic particles. Experiments showed that the PEI-CC@Fe3O4 has nice adsorption enactment toward divalent copper ion and divalent lead ion in wastewater and that it is a better adsorption material for wastewater containing heavy metals. Moreover, the addition of magnetic particles could improve the separation efficiency after the adsorption material adsorbs the metal ions so that the material can be recycled more conveniently and cost savings are higher.The adsorption process of PEI-CC@Fe3O4 is more in line with the quasi-second-order kinetic model, indicating that chemisorption was dominant. The internal diffusion parameters were also explored, and discovering the internal diffusion rate constant kp of divalent copper ion was smaller than that of the divalent lead ion. Indicating that divalent lead ion could more easily diffuse into the adsorbent material than divalent copper ion, and the rate-controlling stage was not internal diffusion. Therefore, the adsorption of divalent copper ion and divalent lead ion by this material is mainly by chemical adsorption, while internal diffusion is secondary.
The Langmuir and the Freundlich adsorption isotherm model were exploited to fitting the isotherms of the adsorption of divalent copper ion and divalent lead ion by the modified corncob. The Langmuir adsorption isotherm model had a better linear fit. The thermodynamic parameters show that under the research conditions, the elimination of divalent copper ion and divalent lead ion by the PEI-CC@Fe3O4 material was spontaneous and endothermic.
Conflicts of interest
There are no conflicts to declare.Acknowledgements
The authors are grateful for the financial support from the Chongqing Municipal Education Commission (KJQN201801112) and the Chongqing Municipal Science & Technology Commission (cstc2019jcyj-msxmX0232).References
- M. E. Lee, J. H. Park and J. W. Chung, J. Environ. Manage., 2019, 236, 118–124 CrossRef CAS PubMed.
- G. K. Dutta and N. Karak, RSC Adv., 2019, 9, 20829–20840 RSC.
- R. Foroutan, S. J. Peighambardoust, S. Hemmati, A. Ahmadi, E. Falletta, B. Ramavandi and C. L. Bianchi, RSC Adv., 2021, 11, 27309–27321 RSC.
- J. Gao, K. Y. Wang and T.-S. Chung, J. Membr. Sci., 2020, 603, 118022 CrossRef CAS.
- Q. Liu, G.-L. Zang and Q. Zhao, RSC Adv., 2021, 11, 25880–25891 RSC.
- P. T. Tho, H. T. Van, L. H. Nguyen, T. K. Hoang, T. N. Ha Tran, T. T. Nguyen, T. B. Hanh Nguyen, V. Q. Nguyen, H. Le Sy, V. N. Thai, Q. B. Tran, S. M. Sadeghzadeh, R. Asadpour and P. Q. Thang, RSC Adv., 2021, 11, 18881–18897 RSC.
- J. Zhang, H. Chen, Z. Chen, J. He, W. Shi, D. Liu, H. Chi, F. Cui and W. Wang, RSC Adv., 2016, 6, 59292–59298 RSC.
- N. F. Campos, G. A. J. C. Guedes, L. P. S. Oliveira, B. M. V. Gama, D. C. S. Sales, J. M. Rodríguez-Díaz, C. M. B. M. Barbosa and M. M. M. B. Duarte, J. Environ. Chem. Eng., 2020, 8, 104232 CrossRef CAS.
- H. Demiral and C. Güngör, J. Cleaner Prod., 2016, 124, 103–113 CrossRef CAS.
- N. A. Fakhre and B. M. Ibrahim, J. Hazard. Mater., 2018, 343, 324–331 CrossRef CAS PubMed.
- R. Baby, B. Saifullah and M. Z. Hussein, Sci. Rep., 2019, 9, 18955 CrossRef CAS PubMed.
- H. Wang, X. Lai, W. Zhao, Y. Chen, X. Yang, X. Meng and Y. Li, RSC Adv., 2019, 9, 21996–22003 RSC.
- H. O. Chukwuemeka-Okorie, P. N. Ekemezie, K. G. Akpomie and C. S. Olikagu, Front. Chem., 2018, 6, 273 CrossRef PubMed.
- N. V. Sych, S. I. Trofymenko, O. I. Poddubnaya, M. M. Tsyba, V. I. Sapsay, D. O. Klymchuk and A. M. Puziy, Appl. Surf. Sci., 2012, 261, 75–82 CrossRef CAS.
- J. Zhao, L. Yu, F. Zhou, H. Ma, K. Yang and G. Wu, RSC Adv., 2021, 11, 8025–8032 RSC.
- S. Vafakhah, M. E. Bahrololoom, R. Bazarganlari and M. Saeedikhani, J. Environ. Chem. Eng., 2014, 2, 356–361 CrossRef CAS.
- J. K. Nduka, Int. J. Chem. Eng., 2012, 2012, 1–7 CrossRef.
- R. Leyva-Ramos, L. E. Landin-Rodriguez, S. Leyva-Ramos and N. A. Medellin-Castillo, Chem. Eng. J., 2012, 180, 113–120 CrossRef CAS.
- Z. Liu, Y. Sun, X. Xu, X. Meng, J. Qu, Z. Wang, C. Liu and B. Qu, Bioresour. Technol., 2020, 306, 123154 CrossRef CAS PubMed.
- G. Tan, H. Yuan, Y. Liu and D. Xiao, J. Hazard. Mater., 2010, 174, 740–745 CrossRef CAS PubMed.
- Y. Shi, T. Zhang, H. Ren, A. Kruse and R. Cui, Bioresour. Technol., 2018, 247, 370–379 CrossRef CAS PubMed.
- A. Zheng, K. Zhao, L. Li, Z. Zhao, L. Jiang, Z. Huang, G. Wei, F. He and H. Li, J. Energy Inst., 2018, 91, 676–682 CrossRef CAS.
- S. Chen, Q. Yue, B. Gao, Q. Li and X. Xu, Chem. Eng. J., 2011, 168, 909–917 CrossRef CAS.
- J. L. Liu, W. C. Qian, J. Z. Guo, Y. Shen and B. Li, Bioresour. Technol., 2021, 320, 124374 CrossRef CAS PubMed.
- J. Tang, L. Xiang, J. Fan, Z. Cui and H. Wu, Environ. Earth Sci., 2018, 77, 441 CrossRef.
- S. Tangtubtim and S. Saikrasun, Appl. Surf. Sci., 2019, 467–468, 596–607 CrossRef CAS.
- J. Wang, Q. Xie, A. Li, X. Liu, F. Yu and J. Ji, Water Sci. Technol., 2020, 81, 1114–1129 CrossRef CAS PubMed.
- B. Qiu, J. Guo, X. Zhang, D. Sun, H. Gu, Q. Wang, H. Wang, X. Wang, X. Zhang, B. L. Weeks, Z. Guo and S. Wei, ACS Appl. Mater. Interfaces, 2014, 6, 19816–19824 CrossRef CAS PubMed.
- X. Wang, J. Feng, Y. Cai, M. Fang, M. Kong, A. Alsaedi, T. Hayat and X. Tan, Sci. Total Environ., 2020, 708, 134575 CrossRef CAS PubMed.
- S. Wong, H. H. Tumari, N. Ngadi, N. B. Mohamed, O. Hassan, R. Mat and N. A. Saidina Amin, J. Cleaner Prod., 2019, 206, 394–406 CrossRef CAS.
- F. Bucatariu, C. A. Ghiorghita, M. M. Zaharia, S. Schwarz, F. Simon and M. Mihai, ACS Appl. Mater. Interfaces, 2020, 12, 37585–37596 CrossRef CAS PubMed.
- P. Kulal and V. Badalamoole, Int. J. Biol. Macromol., 2020, 156, 1408–1417 CrossRef CAS PubMed.
- H. Ma, J. B. Li, W. W. Liu, M. Miao, B. J. Cheng and S. W. Zhu, Bioresour. Technol., 2015, 190, 13–20 CrossRef CAS PubMed.
- C. Duan, X. Meng, C. Liu, W. Lu, J. Liu, L. Dai, W. Wang, W. Zhao, C. Xiong and Y. Ni, Carbohydr. Polym., 2019, 222, 115042 CrossRef CAS PubMed.
- R. Fonseca-Correa, L. Giraldo and J. C. Moreno-Piraján, J. Anal. Appl. Pyrolysis, 2013, 101, 132–141 CrossRef CAS.
- H. Lin, S. Han, Y. Dong and Y. He, Appl. Surf. Sci., 2017, 412, 152–159 CrossRef CAS.
- Y. Xiong, X. Cui, D. Wang, Y. Wang, Z. Lou, W. Shan and Y. Fan, Mater. Sci. Eng., C, 2019, 99, 1115–1122 CrossRef CAS PubMed.
- S. Sadeghi, H. R. Zakeri, M. H. Saghi, S. K. Ghadiri, S. S. Talebi, M. Shams and G. L. Dotto, Environ. Sci. Pollut. Res., 2021, 28, 3556–3565 CrossRef CAS PubMed.
- X. Huang, L. Wang, J. Zhang, X. Du, S. Wu, H. Wang and X. Wei, Int. J. Biol. Macromol., 2020, 163, 1915–1925 CrossRef CAS PubMed.
- M. Liu, L. Jia, Z. Zhao, Y. Han, Y. Li, Q. Peng and Q. Zhang, Chem. Eng. J., 2020, 390, 124667 CrossRef CAS.
- L. Qiao, S. Li, Y. Li, Y. Liu and K. Du, J. Cleaner Prod., 2020, 253, 120017 CrossRef CAS.
- A. L. Popovic, J. D. Rusmirovic, Z. Velickovic, Z. Radovanovic, M. Ristic, V. P. Pavlovic and A. D. Marinkovic, Int. J. Biol. Macromol., 2020, 156, 1160–1173 CrossRef CAS PubMed.
- Y. Yan, Y. Wang, J. Wu, Z. Wang, X. Shen, Q. Sun and C. Jin, Int. J. Biol. Macromol., 2019, 141, 369–377 CrossRef CAS PubMed.
- S. Deng and Y. P. Ting, Water Res., 2005, 39, 2167–2177 CrossRef CAS PubMed.
- Y. He, S. Han, H. Lin and Y. Dong, Water, Air, Soil Pollut., 2020, 231, 137 CrossRef CAS.
- D. M. Guo, Q. D. An, Z. Y. Xiao, S. R. Zhai and D. J. Yang, Carbohydr. Polym., 2018, 202, 306–314 CrossRef CAS PubMed.
- S. Zhang, Z. Wang, H. Chen, C. Kai, M. Jiang, Q. Wang and Z. Zhou, Appl. Surf. Sci., 2018, 440, 1277–1285 CrossRef CAS.
| This journal is © The Royal Society of Chemistry 2022 |

