 Open Access Article
Enhanced phosphate removal with fine activated alumina synthesized from a sodium aluminate solution: performance and mechanism
Guoyu Wu ab,
Guihua Liu
 *a,
Xiaobin Lia,
Zhihong Penga,
Qiusheng Zhou
 a and
Tiangui Qia
aSchool of Metallurgy and Environment, Central South University, Changsha 410083, Hunan, China. E-mail: liugh303@csu.edu.cn
bChangchun Gold Research Institute Co., Ltd, Changchun 130012, Jilin, China
First published on 4th February 2022
Abstract
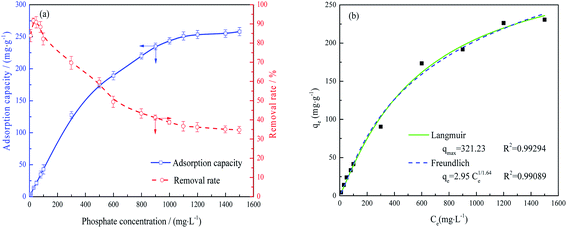
Fine activated alumina (FAA) acting as an adsorbent for phosphate was synthesized from an industrial sodium aluminate solution based on phase evolution from Al(OH)3 and NH4Al(OH)2CO3. This material was obtained in the form of γ-Al2O3 with an open mesoporous structure and a specific surface area of 648.02 m2 g−1. The phosphate adsorption capacity of the FAA gradually increased with increases in phosphate concentration or contact time. The maximum adsorption capacity was 261.66 mg g−1 when phosphate was present as H2PO4− at a pH of 5.0. A removal efficiency of over 96% was achieved in a 50 mg L−1 phosphate solution. The adsorption of phosphate anions could be explained using non-linear Langmuir or Freundlich isotherm models and a pseudo-second-order kinetic model. Tetra-coordinate AlO4 sites acting as Lewis acids resulted in some chemisorption, while (O)nAl(OH)2+ (n = 4, 5, 6) Brønsted acid groups generated by the protonation of AlO4 or AlO6 sites in the FAA led to physisorption. Analyses of aluminum-oxygen coordination units using Fourier transform infrared and X-ray photoelectron spectroscopy demonstrated that physisorption was predominant. Minimal chemisorption was also verified by the significant desorption rate observed in dilute NaOH solutions and the high performance of the regenerated FAA. The high specific surface area, many open mesopores and numerous highly active tetra-coordinate AlO4 sites on the FAA all synergistically contributed to its exceptional adsorption capacity.
1. Introduction
Wastewater containing high concentrations of phosphate as a pollutant can be generated as a result of papermaking, the use of phosphorus-based fertilizers and the surface treatment of metals. This is problematic because excessive amounts of phosphate in aquatic systems lead to serious water pollution effects, such as eutrophication and algae bloom.1 Traditionally, phosphate has been removed from wastewater by chemical precipitation, crystallization, ion exchange, electrostatic techniques, hydrobiological processes and adsorption.2–4 Among these, adsorption methods have been widely adopted because of their operational simplicity, and excellent treatment efficient, and the adsorbents can be regenerated in some cases. The adsorbents used to date include natural minerals, industrial slag and synthetic materials. However, the use of natural minerals such as bentonite, attapulgite and kaolin or industrial slag (such as red mud) are limited by the low adsorption capacity of these substances (8–56 mg g−1), the large amount of sludge they generate and the potential for secondary pollution. In addition, synthetic inorganic adsorbents (including iron oxide, titanium oxide, cerium oxide, water talc, and calcined layered materials) are difficult to prepare and are also not readily regenerated. Activated alumina, serving as a replacement for α-Al2O3, is considered a promising inorganic adsorbent because it provides numerous active sites for highly efficient phosphate adsorption and is also inexpensive, stable and environmentally-friendly.5–8 As a consequence of these attributes, the use of activated alumina has been widely studied. Even so, conventional fine activated alumina (FAA) with a medium particle size of d(50) > 1 μm has been found to exhibit a low adsorption capacity (30.2 mg g−1) as a result of its minimal specific surface area (less than 300 m2 g−1).9 Therefore, both nano-Al(OH)3 and nano-AlOOH have been used as precursor to synthesize nano-alumina as a means of increasing the specific surface area, leading to an improved values from 300 to 600 m2 g−1.10 The phosphate adsorption capacity of this nanoscale material was determined to be 31.1–102 mg g−1 when applied to solutions containing phosphate concentrations ranging from 50 to 1400 mg L−1. However, the preparation of the nano-alumina from aluminum-bearing salts (Al2(SO4)3 Al(NO3)3, AlCl3) and aluminum alkoxides (Al(OR)3) as raw materials is difficult because the resulting nanoparticles tend to undergo significant aggregation and because a considerable amount of saline wastewater is produced in conjunction with the use of alkaline reagents. By contrast, gibbsite or boehmite precipitated from industrial sodium aluminate solution generated in alumina refineries is remarkably inexpensive and has a minimal negative environmental impact because this process allows the sodium aluminate solution to be recycled and does not generate wastewater.11 This method therefore represents a green, economical approach to synthesizing FAA having a high specific surface area (>300 m2 g−1) as an alternative to nano-alumina.To date, various isotherm and kinetic models have been employed to assess phosphate removal mechanisms. Specifically, the Langmuir, Freundlich, Tempkin, and Dubinin–Radushkevich isotherm models have all been applied to assess the adsorption of phosphate anions on alumina surfaces.12–14 In addition, pseudo-first-order, pseudo-second-order and Elovich kinetic models have also been adopted.15 Simulations of the distribution of various phosphate and Al3+ species in solution at different pH values have indicated that AlPO4 might be formed on alumina surfaces.3,16–18 Furthermore, Fourier-transform infrared (FTIR) spectroscopy, X-ray photoelectron spectroscopy (XPS) and zeta potential measurements have all been used to study the interactions between phosphate anions and alumina as well as to examine physisorption or chemisorption processes.19 Nevertheless, the interactions of phosphate anions with FAA have not determined.
The adsorption properties of activated alumina are primarily the result of active sites on the material. Compared with α-Al2O3, which is inert and almost completely composed of hexa-coordinated AlO6, various other aluminum–oxygen coordination units (AlOx where x = 4 or 5) may occur in the activated alumina, leading to catalytic activity.20 These observations may assist in determining the mechanism by which this material removes phosphate from wastewater and may also help to optimize the process. Therefore, in addition to distribution of Al–O units, the interactions between phosphate anions and AlO4, AlO5 and AlO6 units in activated alumina are expected to affect adsorption properties.
The present work evaluated the phosphate removal performance of FAA and explored the associated mechanism. FAA having a high specific surface area was prepared by phase evolution from gibbsite and characterized with regard to its particle size distribution (PSD) and using X-ray diffraction (XRD), N2 adsorption–desorption isotherms analyses and scanning electron microscopy (SEM). The phosphate adsorption isotherm and kinetics of this material were then studied based on batch experiments while the removal mechanism was investigated using zeta potential measurements, FTIR spectroscopy and XPS. The resulting data were used to determine the AlO4 and AlO6 distribution in the FAA before and after phosphate adsorption as a means of evaluating the adsorption mechanism. The data from this work offer an improved understanding of the adsorption properties of the activated alumina and could lead to optimization of phosphate removal from wastewater with this material.
2. Materials and experiment
2.1 Synthesis of FAA with high specific surface area
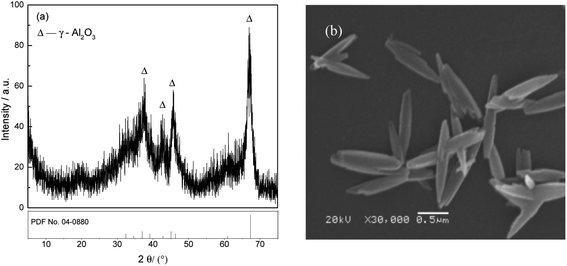
The adsorbent FAA was prepared according to our previous work21 as follows: 15 mL of industrial sodium aluminate solution (CNa2O = 2.26 mol L−1, CAl2O3 = 1.57 mol L−1) and 400 mL of deionized water were added into a round flask, and 25 mL of H2O2 (10 wt%) was then added at 5 mL min−1 to generate Al(OH)3 seed in vigorous agitation (1000 rpm), followed by precipitation of the Al(OH)3 at 50 °C for 60 min. The fine Al(OH)3 was filtered and washed with boiling deionized water. Afterwards, the fine Al(OH)3 was placed into a flask containing 100 mL of (NH4)2CO3 (1.54 mol L−1) solution and 100 mL of deionized water. Meanwhile, ammonia (30 wt%) was added to adjust the solution pH to 10.0 with continuously stirring for 24 h to ensure the fine Al(OH)3 transformed into NH4Al(OH)2CO3. The resultant NH4Al(OH)2CO3 were washed with deionized water until neutral pH (∼7.0), and air-dried at 60 °C for 12 h. Finally, the XRD pattern and SEM image of the γ-Al2O3 (PDF No. 04-0880) used in this work are provided in Fig. 1. The XRD data indicate that received in a poor crystal for the dispersing diffraction peaks after NH4Al(OH)2CO3 was roasted at 450 °C for 180 min. The average crystallite size in the sample was calculated using the Scherrer equation based on the (100) peak in the XRD pattern and determined to be 6.689 nm.22 Meanwhile, the SEM image demonstrates that the FAA particles were in the form of short fibers having long spindle-like morphologies, with lengths of approximately 1.50 μm and diameters of approximately 0.25 μm (Fig. 1(b)). This image confirms that the γ-Al2O3 comprised a fine powder formed by the agglomeration of a large number of nanoparticles.Fig. 2(a) presents the N2 adsorption–desorption isotherms obtained from this material, which exhibit hysteresis loops in the relative pressure range of 0.4 < P/P0 < 0.7 and P/P0 > 0.9. There loops are attributed to capillary condensation. These isotherms curve are generally consistent with the type IV category and have type H1 hysteresis loops according to the IUPAC classification system, and these results indicate that narrow slit-like open mesopores were primarily contained in the FAA.21 Furthermore, the Brunauer–Emmett–Teller surface area of the FAA reached up to 648.02 m2 g−1, and so was slightly higher than the values reported for nano-alumina prepared from aerogels or chemical evaporation and was significantly more than the values of 100 to 400 m2 g−1 determined for superfine alumina with a d(50) of 0.5 μm.23,24 Fig. 2(b) shows that the material contained meso-pore and macro-pore with sizes in the ranges of 30–40 nm and 150–600 nm, respectively. The numerous meso-pores and smaller number of macro-pores in the FAA would be expected to promote its functioning as an adsorbent by providing pathways for the efficient transport of molecules.25
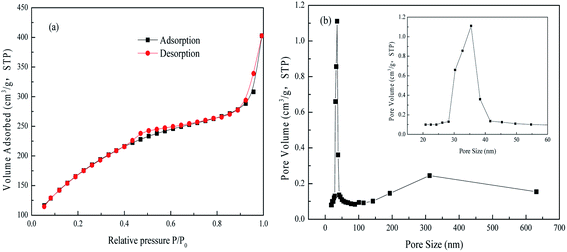 | ||
| Fig. 2 N2 adsorption–desorption isotherms (a) and pore diameter distribution curve (b) from the FAA. | ||
2.2 Adsorption of phosphate
In each adsorption trial, 0.2 g FAA and 100 mL of a phosphate solution were transferred into a flask and adjusted to a pH of 5.0 by the addition of HCl (0.10 M) or NaOH (0.10 M) solutions. The phosphate removal experiments were carried out at 25 °C while stirring each solution at 150 rpm. The desorption and regeneration of test specimens in dilute NaOH solutions were also performed to verify that the FAA had the properties required for commercial applications. In these trials, a 0.2 g quantity of the used FAA was added to 100 mL of a solution containing NaOH at various concentrations and stirred at 150 rpm for 600 min at a temperature of 25 °C. Sample was sucked from flask to determine concentration of phosphate in solution, adsorption capacity qt (eqn (1)) and removal rate r (%) (eqn (2)) were then calculated on basis of variation in phosphate concentration.
 | (1) |
 | (2) |
2.3 Characterization and methods
The phase evolution of alumina-bearing substance was identified by XRD (TTR-III, Rigaku Co., Japan) using Cu kα radiation at a scanning rate of 10° min−1. PSD was finished by using Mastersizer-2000 (Mastersizer-2000, Malvern, UK) after samples were dispersed into deionized water. N2 adsorption–desorption isotherms were collected at liquid-nitrogen on a Micromeritics ASAP 2020 HD88 (USA). The specific surface area of FAA was calculated by following the multipoint Brunauer–Emmett–Teller (BET) procedures. The Barrett–Joyner–Halenda (BJH) model applied to the desorption branch of the isotherm provided information on the pore size distribution. The morphological structure of the FAA was observed by using SEM (JSM-6360LV, JEOL, Japan).Meanwhile, the point of zero charge (PZC) was analyzed by using zetasizer Nano S90 (Malvern, UK) at 25 °C. Variation in Al–O coordination of FAA before and after the adsorption of phosphate were analyzed using a Fourier transform infrared spectroscopy (Nicolet 6700 FT-IR, USA) within the range of 500–4000 cm−1 and X-ray photoelectron spectrometer (XPS, ESCALAB 250Xi, USA),26 respectively. In addition, phosphate concentration was determined by the molybdate blue spectrophotometric method.18
3. Results and discussion
3.1 Removal of phosphate with FAA
An adsorption model that explains this behavior is evidently required to understand the phosphate adsorption mechanism on FAA. Non-linear Langmuir isotherm and Freundlich isotherm were applied to describe the equilibrium adsorption model expressed as follows eqn (3) and (4).16,17
 | (3) |
| qe = KF·Ce1/n | (4) |
The data in Fig. 4(a) were fit using non-linear Langmuir and Freundlich isothermal adsorption models, as shown in Fig. 4(b), with R2 values of greater than 0.99. These results suggest that both monolayer and multilayer adsorption occurred on the surface of the activated alumina. Table 1 provides the maximum adsorption capacities reported for various activated alumina. It is evident that the present FAA, which contained numerous open mesopores (Fig. 2), had the highest capacity for phosphate, even as the fine powder. These data also indicate that the adsorption capacity of such materials does not increase linearly with specific surface area. That is, the adsorption capacity values obtained from the batch experiments may also have been determined by the surface properties and the extent of Al–O coordination in the FAA.
| Adsorbent | Specific surface area | Adsorption capacity/mg g−1 | pH | Ref. |
|---|---|---|---|---|
| Aluminum oxide | 1.1 μm, 295.3 m2 g−1 | 30.2 | 9.7 | Kawasaki et al.9 |
| Nano-alumina | <50 nm, >40 m2 g−1 | 6.25 | 2.0 | Mor et al.28 |
| Commercial Al2O3 | 395.6 nm | 14.80 | — | Zhang et al.13 |
| Acid-activated neutralized red mud | — | 492.46 | Jie et al.16 | |
| Activated aluminum oxide | 298.3 m2 g−1 | 20.88 | — | Xie et al.18 |
| Activated alumina pellet | Diameters of 2 mm | 49.67 | — | Choi et al.29 |
| Zeolite pellet | Diameters of 2 mm | 111.49 | — | Choi et al.29 |
| Activated aluminium oxide | 0.3–1 mm, 230–300 m2 g−1 | 7.9 | 8.2 | Genz et al.30 |
| Activated alumina | — | 53.7 | 6.4 | Shin et al.31 |
| Al impregnated SBA-15 | — | 81.9 | 6.4 | Shin et al.31 |
| Steel-making slag | — | 215.7 | — | Jha et al.32 |
| FAA | 0.545 μm, 648.02 m2 g−1 | 261.66 | 5.0 | This work |
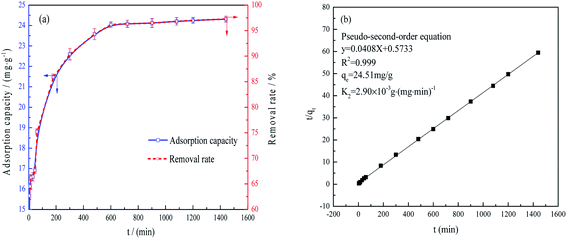
Fig. 5(b) demonstrates that the data were in good agreement with the pseudo-second-order model,33,34 such that fitting the values gave an R2 of 0.999. This result suggests that chemisorption was the rate-determining step and that various diffusion processes (such as surface, liquid membrane and internal diffusion) were all involved.35
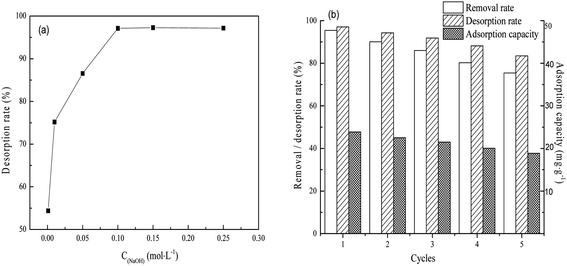
As shown in Fig. 6(a), 97.12% of the phosphate could be removed from the FAA after use by immersion in 0.1 mol L−1 NaOH. This result is primarily ascribed to the physisorption properties and open pore structure of the FAA (Fig. 2(b)). This high desorption rate implies that the regenerated FAA could be reused with suitable performance and Fig. 6(b) shows the phosphate removal rate, desorption rate and adsorption capacity data during numerous recycling trials with the same sample. After the FAA was regenerated four times, it exhibited a removal rate that was 82% of the initial value. After five cycles, 75.7% of the original adsorption capacity was still obtained. These results confirm that the FAA exhibited excellent performance in terms of phosphate removal.
3.2 Zeta potential and surface structure of the FAA after phosphate adsorption
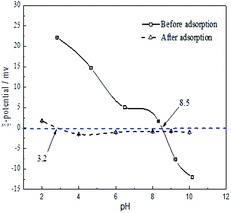 | ||
| Fig. 7 Zeta potential of the FAA before and after phosphate adsorption as function of pH temperature 25 °C, FAA: 2 g L−1 in deionized water. | ||
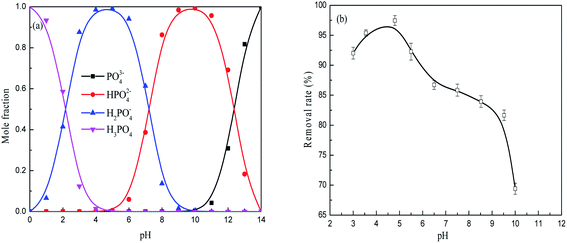
As shown in Fig. 7, the zeta potential of the FAA decreased with increases in pH both before and after the adsorption of phosphate. The zero charge pH values of the material before and after adsorption were 8.5 and 3.2, respectively. Therefore, reductions in the zeta potential were responsible for the decreased adsorption efficiency at higher pH values seen in Fig. 3(b), meaning that electrostatic interactions decreased or repulsive forces increased. The alumina was observed to have a positive charge at a pH of 5.0 (originating from Al(OH)3 in negative charge) that would be expected to favor the electrostatic adsorption of phosphate anions.36 The positive charge on the material resulted from the surface protonation of Al(III) atoms in the form of (O)nAl(OH)2+ (n = 4, 5 or 6), which was caused by tetra-coordinated AlO4 or penta-coordinated AlO5 and saturated hexa-coordinated AlO6 in the FAA. As a consequence of the phosphate anions adsorbed on the surface of the alumina, the zeta potential of the specimen was remarkably reduced and pH was found to have a minimal effect on zeta potential after adsorption. This finding implies that tetra-coordinated AlO4 or penta-coordinated AlO5 in the FAA acted as Lewis acids and both readily reacted with H2PO4− anions at a pH of 5.0, and that the protonation of Al(III) atoms acting as Brønsted acids provided further interactions with these anions.
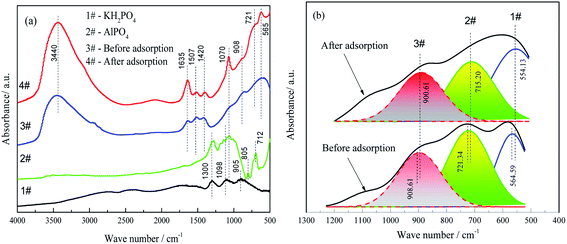
Furthermore, AlO4 and less than 5% AlO5 coexist in γ-Al2O3 compared with α-Al2O3 which is made of AlO6.38,39 The AlO4 sites primarily determined the degree of chemisorption by the FAA. Fig. 8(b) shows the results of FTIR peak fittings at 554, 715 and 900 cm−1 while Table 2 summarizes the variations in the areas of the peaks related to AlO4 and AlO6.
| No. | Band assignment | ν40,41 (cm−1) | Peak W1 before adsorption (cm−1) | Peak W2 after adsorption (cm−1) | ΔW = W2 − W1 (cm−1) | Area (A1) before adsorption (%) | Area (A2) after adsorption (%) | ΔA = A1 − A2 (%) |
|---|---|---|---|---|---|---|---|---|
| a W – wave number, ΔW – difference of the peak wave number; ΔA – difference of the peak area. | ||||||||
| 1# | Al–O stretch (AlO6) | 523 | 564.59 | 554.13 | 10.46 | 25.27 | 33.31 | +8.04 |
| 2# | Al–O stretch (AlO4) | 734 | 721.34 | 715.20 | 6.14 | 43.22 | 36.44 | −6.78 |
| 3# | Al–O stretch (AlO4) | 852 | 908.61 | 900.61 | 8.00 | 31.51 | 30.25 | −1.26 |
The peaks at 554.13, 715.20 and 900.61 cm−1 were assigned to the stretching vibrations of Al–O bonds in AlO6 and AlO4, respectively.42 The adsorption of phosphate by the FAA decreased the AlO4 peak area but increased that of the AlO6 peak. These data suggest that the reaction of AlO4 sites with the H2PO4− anions, electrostatic interaction of AlO4 and AlO6 after protonation with H2PO4−, respectively.
| No. | Al 2p/P 2p | Position (eV) | Position before adsorption (eV) | Position after adsorption (eV) | ΔW = W2 − W1 (eV) | Area (A1) before adsorption (%) | Area (A2) after adsorption (%) | ΔA = A1 − A2 (%) |
|---|---|---|---|---|---|---|---|---|
| a W – peak position, ΔW – difference of the peak position; ΔA – difference of the peak area. | ||||||||
| 1# | Al–O (AlO4) | 74.13 | 74.38 | 74.36 | 0.02 | 57.48 | 42.48 | −15.00 |
| 2# | Al–O (AlO6) | 75.43 | 75.48 | 75.55 | 0.07 | 42.52 | 57.52 | +15.00 |
| 3# | H2PO4− | 134.2 | — | 134.19 | 0.01 | — | 61.83 | — |
| 4# | H3PO4 or AlPO4 | 133.4 | — | 135.23 | 1.83 | — | 38.17 | — |
Spectrum #2 in Fig. 9(a) demonstrates the presence of elemental phosphorous on the FAA surface after adsorption based on the action of AlO4 Lewis acid sites that reacted with H2PO4− to generate Al–O–P groups (see also spectrum #4) in Fig. 8(a).44 The results in Fig. 9(b) and Table 3 show that the AlO6 peak area increased by 15% while the AlO4 peak area decreased by 15% after adsorption, which is consistent with the FTIR results in Fig. 8(b) and Table 2. These data provide evidence that physisorption was primarily responsible for the removal of phosphate along with some chemisorption. Both the FTIR and XPS results also show differences in the mass-based proportions of AlO4 and AlO6. From these differences, it is evident that phosphate anions were mainly adsorbed on the FAA surface, meaning that the high specific surface area and open mesopores of this material contributed to its high adsorption capacity.
The P 2p XPS spectrum obtained from the FAA after phosphate adsorption is shown in Fig. 9(c) and summarized in Table 3. The peak at a binding energy of 134.2 eV was assigned to H2PO4− and demonstrates the electrostatic interaction between this anion and (O)nAl(OH)2+ (n = 4, 5 or 6) sites acting as Brønsted acids, by which physisorption took place.12 The peak at 133.4 eV corresponds to H3PO4 or AlPO4 and resulted from the chemisorption of H2PO4− on AlO4 sites.45,46
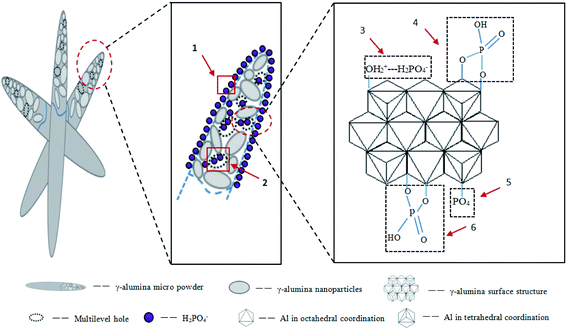
The plentiful open mesopores in the FAA provided a high specific surface area and the γ-Al2O3 contained numerous AlO4 units acting as Lewis acids. The positive charges on the alumina also promoted interactions between the FAA surface and phosphate anions, while the formation of AlPO4 improved the adsorption of phosphate. All these phenomena synergistically contributed to the high adsorption capacity of the FAA. Fig. 10 shows that anion diffusion over the FAA surface and through a liquid membrane, as well as internal diffusion, were responsible for the removal of phosphate (see also Fig. 5(b)). In future work, the effects of other anions on phosphate removal and degradation of the FAA after regeneration will be studied.
4. Conclusions
(1) FAA having a d(50) value of 0.545 μm was prepared from an industrial sodium aluminate solution by the phase transition of Al(OH)3 and NH4Al(OH)2CO3. The FAA comprised small nanocrystallites containing numerous open mesopores and so had a large specific surface area of 648.02 m2 g−1. H2PO4− was found to be the predominant phosphate anion in solution at a pH of 5.0 and the zeta potential of the FAA was determined to decrease significantly with increases in pH before the adsorption of phosphate. After phosphate adsorption, pH had a minimal effect on the zeta potential of the material.(2) Increases in the phosphate concentration or extending the adsorption duration improved the extent of phosphate uptake by the FAA. The maximum adsorption capacity of the material was 261.66 mg g−1 from a solution having a phosphate concentration of 1000 mg L−1 at a pH of 5.0. The phosphate adsorption data could be accurately fit using non-linear Langmuir and Freundlich isotherm models assuming monolayer and multilayer adsorption. More than 96% of the phosphate in a 50 mg L−1 solution could be adsorbed and the adsorption kinetics followed a pseudo-second-order model with chemisorption as the rate-determining step. Regenerated FAA continued to exhibit high performance after immersion in a dilute NaOH solution.
(3) Phosphate removal was primarily via physisorption although some chemisorption also occurred. The number of tetra-coordinated AlO4 sites in the FAA was greatly decreased following the adsorption of H2PO4− while the concentration of hexa-coordinated AlO6 sites was increased. The high specific surface area, numerous open mesopores and plentiful tetra-coordinated AlO4 sites on the FAA all contributed in a synergistic manner to its high adsorption capacity.
Conflicts of interest
On behalf of my co-authors, I declare that this work has neither been published previously nor under consideration for publication elsewhere. All authors have revised the manuscript and approved to submit to your journal. Meanwhile, there are no conflicts of interest.Acknowledgements
The authors gratefully acknowledge the financial support from the National Natural Science Foundation of China (No. 51874366).References
- S. Tian, P. Jiang, P. Ning and Y. Su, Chem. Eng. J., 2009, 151(1), 141–148 CrossRef CAS.
- T. Li, T. Liao, X. Su, X. Yu, B. Han, Y. Zhu and Y. Zhang, Water Res. Technol., 2018, 4, 1671–1684 RSC.
- J. Diao, L. Shao, D. Liu, Q. Yong, W. Tan, W. Liang and B. Xie, JOM, 2018, 70(10), 1–6 CrossRef.
- Z. Zha, Y. Ren, S. Wang, Q. Zhuang, Y. Lei, P. Cheng, Y. Han and M. Wang, RSC Adv., 2018, 8(34), 19326–19334 RSC.
- I. W. Almanassra, G. Mckay, V. Kochkodan, M. A. Atieh and A. A. Tareq, J. Chem. Eng., 2021, 409, 128211 CrossRef CAS.
- C. Lu, K. Klementiev, T. Hassenkam, W. Qian, J. Ai and H. Hansen, J. Chem. Eng., 2021, 422(23), 130009 CrossRef CAS.
- N. M. Del, C. Galindo, R. Barillon, E. Halter and B. Madé, J. Colloid Interface Sci., 2010, 342(2), 437–444 CrossRef PubMed.
- X. F. Hu, Y. Q. Liu, Z. Tang, G. C. Li, R. Y. Zhao and C. G. Liu, Mater. Res. Bull., 2012, 47(12), 4271–4277 CrossRef CAS.
- N. Kawasaki, F. Ogata, K. Takahashi, M. Kabayama, K. Kakehi and S. Tanada, J. Health Sci., 2008, 54(3), 324–329 Search PubMed.
- C. L. Lu, J. G. Lv, L. Xu, X. F. Guo, W. H. Hou, Y. Hu and H. Huang, Nanotechnol, 2009, 20(21), 215604 CrossRef CAS PubMed.
- G. H. Liu, G. Y. Wu, W. Chen, X. B. Li, Z. H. Peng, Q. S. Zhou and T. G. Qi, Hydrometallurgy, 2018, 176, 253–259 CrossRef CAS.
- S. Mor, K. Chhoden, P. Negi and K. Ravindra, Environmental Nanotechnology Monitoring and Management, 2016, 7, 15–23 CrossRef.
- L. Zhang, S. Hong, J. He, F. Gan and Y. S. Ho, Clean: Soil, Air, Water, 2010, 38(9), 831–836 CAS.
- E. W. Shin, J. S. Han, M. Jang, S. H. Min, J. K. Park and R. M. Rowell, Environ. Sci. Technol., 2004, 38(3), 912–917 CrossRef CAS PubMed.
- Ahamad, R. Singh, I. Baruah, H. Choudhury and M. R. Sharma, Groundwater for Sustainable Development, 2018, 7, 452–458 CrossRef.
- Jie, X. Cong, P. Zhang, E. Hoffmann, G. M. Zeng, Y. Liu, W. Fang, Y. Wu and H. B. Zhang, Appl. Surf. Sci., 2015, 356(30), 128–134 CrossRef.
- K. Zhang, L. V. Dyk, D. He, J. Deng and H. Zhao, Green Process. Synth., 2021, 10(1), 349–360 CrossRef.
- J. Xie, Y. Lin, C. Li, D. Wu and H. Kong, Powder Technol., 2015, 269, 351–357 CrossRef CAS.
- S. Gypser, F. Hirsch, A. M. Schleicher and D. Freese, J. Environ. Sci., 2018, 70(8), 175–189 CrossRef CAS PubMed.
- D. Kang, X. Yu, M. Ge, M. Lin, X. Yang and Y. Jing, Chem. Eng. J., 2018, 345, 252–259 CrossRef CAS.
- G. Y. Wu, G. H. Liu, X. B. Li, Z. H. Peng, Q. S. Zhou and T. G. Qi, RSC Adv., 2019, 9, 5628–5638 RSC.
- W. Q. Huang, G. H. Liu, T. G. Qi, X. B. Li, Q. S. Zhou and Z. H. Peng, CrystEngComm, 2020, 22, 6983 RSC.
- C. L. Lu, J. G. Lv, L. Xu, X. F. Guo, W. H. Hou, Y. Hu and H. Huang, Nanotechnol, 2009, 20(21), 215604 CrossRef CAS PubMed.
- X. Fei and W. Li, Mater. Lett., 2010, 64, 1858–1860 CrossRef.
- E. Im, H. J. Seo, I. K. Da, H. C. Dong and M. D. Geon, J. Chem. Eng., 2021, 416(19), 129147 CrossRef CAS.
- W. Q. Huang, G. H. Liu, X. B. Li, T. G. Qi, Q. S. Zhou and Z. H. Peng, J. Alloys Compd., 2020, 824, 153905 CrossRef CAS.
- X. Yang, D. Wang, Z. Sun and H. Tang, Colloids Surf., A, 2007, 297(1–3), 84–90 CrossRef CAS.
- S. Mor, K. Chhoden, P. Negi and K. Ravindra, Environ. Nanotechnology, Monitoring & Management, 2016, 7, 15–23 Search PubMed.
- J. W. Choi, S. Y. Lee, S. H. Lee, J. E. Kim, K. Y. Park, D. J. Kim and S. W. Hong, Water, Air, Soil Pollut., 2012, 223(6), 2881–2890 CrossRef CAS.
- A. Genz, A. Kornmüller and M. Jekel, Water Res., 2004, 38(16), 3523–3530 CrossRef CAS PubMed.
- E. W. Shin, J. S. Han, M. Jang, S. H. Min, J. K. Park and R. M. Rowell, Environ. Sci. Technol., 2004, 38, 912–917 CrossRef CAS PubMed.
- V. K. Jha, Y. Kameshima, A. Nakajima and K. Okada, J. Hazard. Mater., 2008, 156(1–3), 156–162 CrossRef CAS PubMed.
- M. Özacar, Adsorption J. international adsorption Soc., 2003, 9(2), 125–132 CrossRef.
- B. Kostura, H. Kulveitovã and J. Lesko, Water Res., 2005, 39, 1795–1802 CrossRef CAS PubMed.
- M. Pan, X. Lin, J. Xie and X. Huang, RSC Adv., 2017, 7, 4492–4500 RSC.
- X. Yang and B. Al-Duri, J. Colloid Interface Sci., 2005, 287, 25–34 CrossRef CAS PubMed.
- S. Gypser, F. Hirsch, A. M. Schleicher and D. Freese, J. Environ. Sci., 2018, 70, 178–192 Search PubMed.
- L. H. Chagas, G. Carvalho, R. Gil, S. S. X. Chiaro, A. A. Leitão and R. Diniz, Mater. Res. Bull., 2014, 49, 216–222 CrossRef CAS.
- C. Pecharromán, I. Sobrados, J. E. Iglesias, T. Gonzalez-Carreno and J. Sanz, J. Phys. Chem. B, 1999, 103, 6160–6170 CrossRef.
- T. Meher, A. K. Basu and S. Ghatak, Ceram. Int., 2005, 31, 831–838 CrossRef CAS.
- P. Tarte, Spectrochim. Acta, Part A, 1967, 23, 2127–2143 CrossRef CAS.
- T. T. Zheng, Z. X. Sun, X. F. Yang and A. Holmgren, J. Chem. Central, 2012, 6(1), 26–36 CrossRef CAS PubMed.
- N. Y. Zhu, T. M. Yan, J. Qiao and H. L. Cao, Chemosphere, 2016, 164, 32–40 CrossRef CAS PubMed.
- Roy, D. Wisser, M. Rivallan, M. C. Valero, T. Corre, O. Delpoux, G. D. Pirngruber and G. Lefèvre, J. Phys. Chem. C, 2021, 125, 10909–10918 CrossRef CAS.
- Y. Yao, B. Gao, J. Chen and L. Yang, Environ. Sci. Technol., 2013, 47, 8700–8708 CrossRef CAS PubMed.
- A. Hühn, D. Wisser, M. C. Valero, T. Roy, M. Rivallan, L. Catita, A. Lesage, C. Michel and P. Raybaud, ACS Catal., 2021, 11, 11278–11292 CrossRef.
| This journal is © The Royal Society of Chemistry 2022 |

