 Open Access Article
Effect of organic-modified nickel phyllosilicate on the non-isothermal cure kinetics and flame retardancy properties of epoxy composites
Yu-xuan Xu ,
Xing-guo Zhao,
Xiang Dong and
Guang-long Dai*
School of Safety Science and Engineering, Anhui University of Science and Technology, Huainan 232001, PR China. E-mail: gldai@aust.edu.cn
First published on 15th February 2022
Abstract
In this study, silane agents were employed as organic silicon to synthesize organic-modified nickel phyllosilicates (NiPS), which were then introduced into epoxy resin (EP) to yield composites. The effects of these organic-modified NiPS on the curing behavior and flammability of epoxy composites were then investigated carefully. Though the added NiPS resulted in the initial temperature shifts to high temperature, the whole curing temperature ranges for EP composites became narrow regarding pure EP. Simultaneously, the activation energy of curing was also decreased, implying the lowered energetic barrier during the whole curing process. For all investigated samples, the overall reaction orders varied negligibly, and the predicted curves fitted well with the DSC thermograms. Finally, the positive influence derived from the presence of these organic-modified NiPS on the enhancement of self-extinguishing ability and limited oxygen index were also discussed, and the solid phase flame retardant mechanism was proposed.
1. Introduction
Epoxy resin (EP) is one of the most outstanding and useful thermosetting polymers due to its excellent tensile strength, high adhesion strength, low shrinkage, good chemical resistance. So they are widely used as matrix resins for advanced composites, protective coatings, structural adhesives and encapsulation materials for electronic components.1,2 To provide a promising approach for EP composites with many attractive properties, various nanoparticles of inorganic fillers have been applied to modify the EP. Among the potential additives, layered silicates have gained increasing attention due to the potential of obtaining improved properties in terms of stiffness, strength, fire retardancy, thermal stability and shrinkage.3–7 The properties of the layered silicate epoxy composites strongly depend on the formation of the crosslinked molecular structure, which is often influenced by the curing kinetics that involves various chemical reactions. Therefore, it is essential to investigate the curing kinetics of the EP composites. Considering the curing reaction process of thermosetting resins is complicated and involves many complex chemical reactions (transition from liquid to gel to solid, initiation, chain growth and formation of crosslinks, termination of the reaction, diffusion), an effective analytical technique for the determination of the curing kinetics is needed. Differential scanning calorimetry (DSC) is the widely applied technique for studying the kinetics of the curing reaction of EP with the basic assumption that the rate of the heat is proportional to the rate of the curing reaction. As a result, an exothermic curve, as well as kinetic parameters, can be gotten.Nickel phyllosilicate (NiPS) is a kind of layered silicate that processes the typical lamellar structure, which can be divided into two types. For the first type, the layered structure mainly consists of nickel octahedral coordination and one sheet containing linked [SiO4] tetrahedral units, its structure type called 1![[thin space (1/6-em)]](https://www.rsc.org/images/entities/char_2009.gif) :
:![[thin space (1/6-em)]](https://www.rsc.org/images/entities/char_2009.gif) 1. The second category of layered presents the sandwich-like structure with one nickel–oxygen octahedral sheet between two sheets of the silicon–oxygen tetrahedron, which is named the 2
1. The second category of layered presents the sandwich-like structure with one nickel–oxygen octahedral sheet between two sheets of the silicon–oxygen tetrahedron, which is named the 2![[thin space (1/6-em)]](https://www.rsc.org/images/entities/char_2009.gif) :
:![[thin space (1/6-em)]](https://www.rsc.org/images/entities/char_2009.gif) 1 structure. Considering the promising lamellar structure, research on NiPS is growing significantly by academia and industries.8,9 To data, NiPS has become increasingly attractive due to the facile synthesizing routes and adjustable interlayer groups, that provide NiPS with many excellent properties and a wide range of applications.10,11 Our previous research has investigated the influence of NiPS on the thermal stability, flame retardancy and tribology properties of the EP composites, respectively.12–14 Furthermore, based on a series of systematic investigates and analyses, it was found that the organic modified NiPS plays a key role in enhancing the tribological properties.15 However, the curing kinetics study of the organic modified NiPS epoxy composites is limited, and systematic and in-depth investigation needs to be done. To the best of our knowledge, no reports are focused on the curing kinetics of the EP/NiPS composites.
1 structure. Considering the promising lamellar structure, research on NiPS is growing significantly by academia and industries.8,9 To data, NiPS has become increasingly attractive due to the facile synthesizing routes and adjustable interlayer groups, that provide NiPS with many excellent properties and a wide range of applications.10,11 Our previous research has investigated the influence of NiPS on the thermal stability, flame retardancy and tribology properties of the EP composites, respectively.12–14 Furthermore, based on a series of systematic investigates and analyses, it was found that the organic modified NiPS plays a key role in enhancing the tribological properties.15 However, the curing kinetics study of the organic modified NiPS epoxy composites is limited, and systematic and in-depth investigation needs to be done. To the best of our knowledge, no reports are focused on the curing kinetics of the EP/NiPS composites.
This present work aims at investigating the effect of organic modified NiPS on the cure kinetics of the epoxy resin. For this purpose, non-isothermal DSC measurement has been carried out to reveal the cure behavior of these EP/NiPS composites and a two-parameter (m, n) autocatalytic model (Šesták–Berggren equation) was used to model the kinetics of the whole curing reactions. In addition, the influence of these organic-modified NiPS particles on the flammability of EP composites was performed using limited oxygen index and UL-94 vertical burning tests, and the positive influence of organic-modified NiPS was also discussed in detail.
2. Experimental section
2.1 Synthesis of NiPS
The preparation of organic modified NiPS has been reported in our previous work.152.2 Characterization
A differential scanning calorimeter (DSC, DSC-60A, Shimadzu, Japan) was used to investigate the curing behaviors of EP/NiPS composites. Briefly a sample of about 3–4 mg was added to aluminum pans and subjected with heating rates at 5, 10, 15, 20 K min−1 under a nitrogen atmosphere (high purity nitrogen, 50 mL min−1). The measurements were carried out with an empty aluminum pan as a reference from 303 up to 550 K. The morphological structure of residual char of EP/NiPS composites were performed using a FlexSEM 1000 scanning electron microscopy (SEM), the residual char samples were coated with a thin layer of gold. The limiting oxygen index (LOI) was tested on an HC-2 oxygen index instrument according to the standards of GB/T 2406.2-2009 and UL-94 vertical burning was evaluated on a CFZ-2-type vertical burning tester based on GB/T 2408-2008. The sample dimensions were 100 × 6.5 × 3 mm3 and 100 × 13 × 3 mm3, respectively.3. Results and discussion
3.1 Curing kinetics analyzed of EP/NiPS composites by DSC
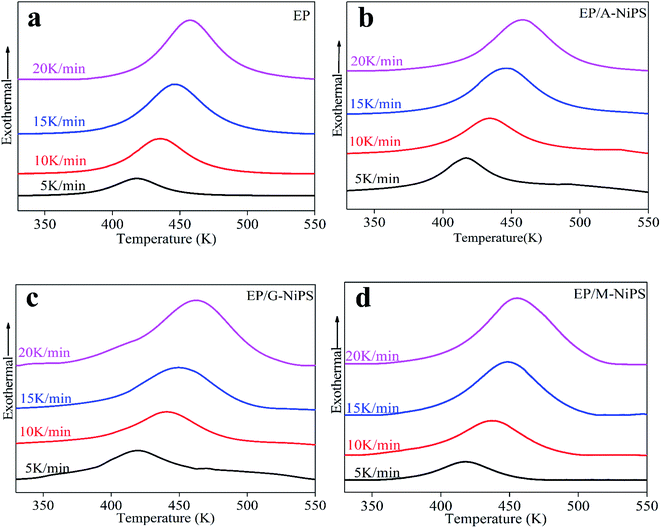
| System | β (K min−1) | Ti (K) | TP (K) | Tf (K) | Mean H (J g−1) |
|---|---|---|---|---|---|
| EP | 5 | 315.1 | 417.9 | 510.8 | 75.2 |
| 10 | 331.4 | 435.5 | 532.8 | ||
| 15 | 341.7 | 446.2 | 534.6 | ||
| 20 | 351.9 | 453.1 | 549.6 | ||
| EP/A-NiPS | 5 | 354.2 | 414.0 | 495.1 | 82.0 |
| 10 | 365.2 | 433.2 | 503.0 | ||
| 15 | 359.7 | 445.0 | 517.6 | ||
| 20 | 359.2 | 454.0 | 529.9 | ||
| EP/G-NiPS | 5 | 342.1 | 419.9 | 464.8 | 70.0 |
| 10 | 349.7 | 441.9 | 502 | ||
| 15 | 352.3 | 450.6 | 517.7 | ||
| 20 | 369.0 | 462.7 | 524.0 | ||
| EP/M-NiPS | 5 | 343.9 | 417.6 | 477.2 | 54.6 |
| 10 | 345.2 | 438.0 | 503.3 | ||
| 15 | 359.2 | 448.9 | 518.1 | ||
| 20 | 371.7 | 455.3 | 529.1 |
As illustrated in Fig. 1, all epoxy formulations present analogous heat flow curves with a single exotherm peak, due to the addition reaction of epoxy with amine.6 Notable, the curing peaks for those EP/NiPS composites broaden and become abrupt gradually following thermal hysteresis, indicating the curing reaction is rate-dependent. With increasing the heating rates, the exotherm peak gradually shifts to a higher temperature region and the maximum heat flow increase for all samples, because the lower reaction rate provides enough reaction time for crosslinking. By increasing the heating rates, the reaction time became shortened and the DSC curve shifts to a high-temperature region to compensate for the reduced reaction time of the EP/NiPS composites. Besides, it is interesting to note that the curing temperature range (Tf–Ti) of the organic modified NiPS is narrower than EP, meaning better curing and more stability of EP/NiPS composites during the process for making of specimens.16
Compared to EP, it is observed that the Ti of EP/A-NiPS increases with the slight decrease in Tp, corroborating the initial retardation effect follows by the acceleration effect on the curing reaction. Meanwhile the mean ΔH increases with the value of 82.0 J g−1. Generally, lower Tp and high ΔH are simultaneously observed in the promoted curing system.17 The above results show that the extent of cure for EP/A-NiPS was the largest than neat EP.18
It is noticeable that by impregnating the G-NiPS and M-NiPS inside the EP matrix, the Ti is slightly increased and the Tp shifts to a high-temperature region at all heating rates, suggesting higher temperature for EP/G-NiPS and EP/M-NiPS curing process. It is also worth noting that the mean ΔH of M-NiPS reached the lowest value of 54.6 J g−1 compared with all control samples. In other words, the addition of M-NiPS has the ability to make the curing reaction more gentle with less heat released during the curing process. This should be conducive to the shaping of large-scale EP composites with high quality.
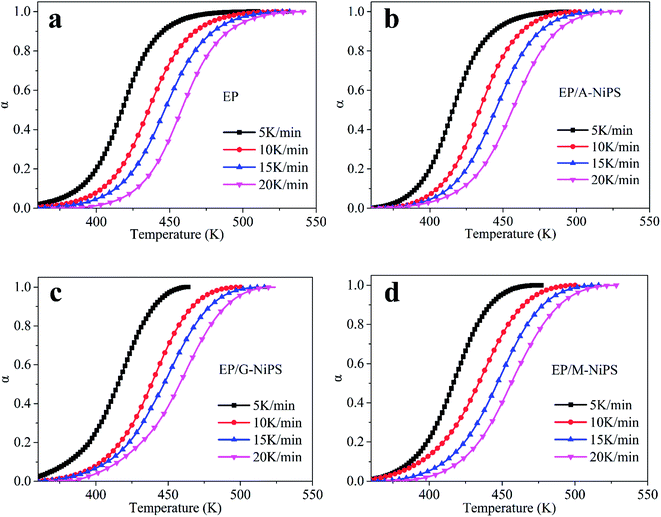
By integrating the DSC curves, the degree of conversion (α), at any curing temperature can be obtained and it is generally expressed as follows:
 | (1) |
In the aforementioned research, as the A-NiPS, G-NiPS and M-NiPS are introduced, the curing temperature range (Tf–Ti) become narrower than neat EP implies the better cure state, while the decrease in curing enthalpy is thought to be caused by the inhibitory effect derived from NiPS, resulting in poor cure state. With this contradictory result, evaluating how the A-NiPS, G-NiPS and M-NiPS impact the curing process of EP seems difficult. Thus, a step of quantitative analysis of the curing kinetics is required to further elucidate the influence of the organic-modified NiPS on the curing behavior.
 | (2) |
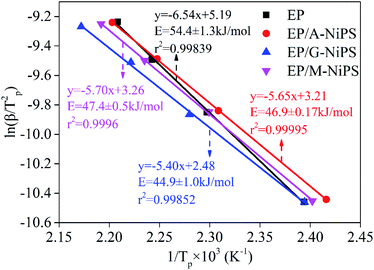
Fig. 3 depicts the plots of the relationship between ln(β/Tp2) versus 1/Tp. A good linear relationship can be observed for these plots with the absolute values of Pearson's correlation coefficient (R) higher than 0.998, implying this approach is useful and accurate. The neat EP demonstrates the obtained E value of 54.4 ± 1.3 kJ mol−1 is the highest and located in the common range of 50–70 kJ mol−1 for the typical epoxy-amino reaction system.22 The addition of A-NiPS, G-NiPS and M-NiPS lead to declined E values of 46.9 ± 0.17 kJ mol−1, 44.9 ± 1.0 kJ mol−1 and 47.4 ± 0.5 kJ mol−1, respectively, indicating the addition of A-NiPS, G-NiPS and M-NiPS decreases the activation energy barrier of EP during the curing process, making the occurrence of cure easier. Notably, the addition of G-NiPS further decreases the E compared with A-NiPS and M-NiPS, which might be attributed to the positive effect of the epoxide groups intercalant to promote the curing reaction of EP/G-NiPS composite. As mentioned above, adding organic-modified NiPS into the epoxy-amino system could lower the energy barrier effectively. In other words, the existence of organic-modified NiPS has the function of promoting the curing reaction as a synergistic hardener in the epoxy-amino system.
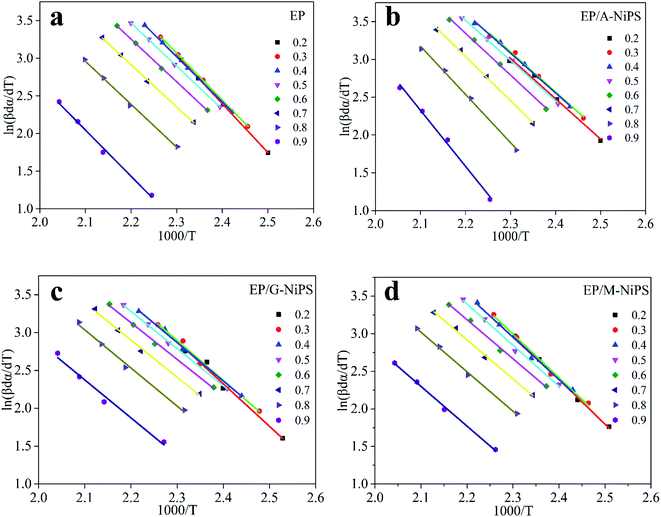
Considering that the activation energy value calculated by the Kissinger approach is just the apparent E for the whole curing process. It is difficult to provide the activation energy against the instantaneous conversion. Thus, the model-free advanced iso-conversion curing kinetic analysis approach should be used to investigate the relationship between the conversion and the reactivation energy.21,23 What is more, some researchers refer that the activation energy does not remain constant during the whole curing process and it is expected to gradually modify by the fractional of conversion in curing reaction.18 As mentioned previously, the Starink method (integral iso-conversational approach) and the Friedman method (differential iso-conversational approach) can be adapted to estimate the activation energy of the EP/NiPS composites. Furthermore, Starink's method captures much attention which ascribed to the fact that this approach is more accurate and reliable than other iso-conversional methods in estimating the activation energy,24,25 and its expressed as it follows:26
 | (3) |
![[thin space (1/6-em)]](https://www.rsc.org/images/entities/char_2009.gif) β/Tf1.92) against 1000/Tf over a certain range of conversion.
β/Tf1.92) against 1000/Tf over a certain range of conversion.
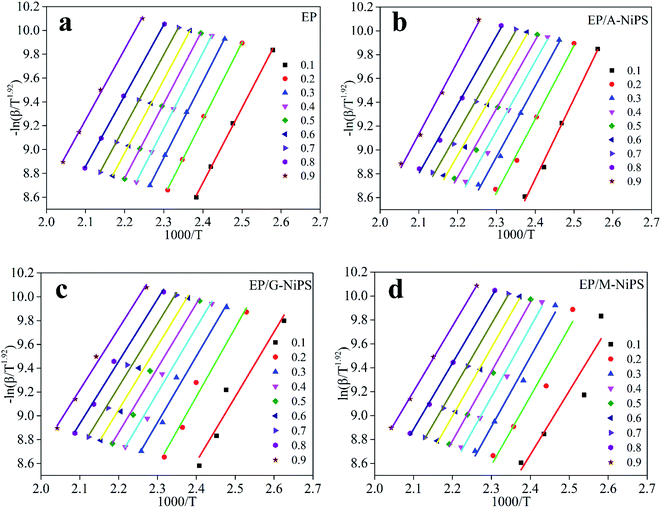
Fig. 4 exhibits the Starink plots of (−ln![[thin space (1/6-em)]](https://www.rsc.org/images/entities/char_2009.gif) β/Tf1.92) versus 1000/Tf of neat EP, EP/A-NiPS, EP/G-NiPS and EP/M-NiPS systems for different values of conversion and heating rates, and the linear fit relationship shows well. Then, the Ea can be calculated and summarized in Table 2.
β/Tf1.92) versus 1000/Tf of neat EP, EP/A-NiPS, EP/G-NiPS and EP/M-NiPS systems for different values of conversion and heating rates, and the linear fit relationship shows well. Then, the Ea can be calculated and summarized in Table 2.
| α | Activation energy (kJ mol−1) | |||||||
|---|---|---|---|---|---|---|---|---|
| The Starink method | The Friedman method | |||||||
| EP | EP/A-NiPS | EP/G-NiPS | EP/M-NiPS | EP | EP/A-NiPS | EP/G-NiPS | EP/M-NiPS | |
| 0.2 | 53.7 | 51.3 | 48.0 | 47.78 | 53.9 | 44.4 | 46.6 | 49.6 |
| 0.3 | 53.4 | 49.5 | 46.2 | 48.5 | 51.7 | 44.1 | 43.8 | 48.1 |
| 0.4 | 52.8 | 48.5 | 45.6 | 48.5 | 49.9 | 43.8 | 42.2 | 46.9 |
| 0.5 | 51.9 | 47.7 | 44.9 | 48.1 | 47.6 | 44.3 | 40.8 | 45.5 |
| 0.6 | 51.1 | 47.2 | 44.5 | 47.4 | 47.1 | 46.0 | 40.3 | 43.2 |
| 0.7 | 50.2 | 47.3 | 44.1 | 46.6 | 46.6 | 48.7 | 40.8 | 43.1 |
| 0.8 | 49.4 | 47.9 | 43.5 | 45.9 | 47.4 | 53.0 | 41.9 | 43.7 |
| Mean | 51.8 | 48.5 | 45.3 | 47.6 | 49.2 | 46.3 | 42.4 | 45.7 |
It should be noted that the calculated Ea in the region of 0.8 < α and α < 0.2 is not reliable. This is attributed to the fact that curing kinetic parameters are easily affected by a minor error during the baseline deduction procedure.5,27 It can be clearly observed that the Ea for EP, EP/G-NiPS and EP/M-NiPS display the analogous variation trends during the range of degree of conversion from 0.2 to 0.8.
For EP, the Ea range changes small during the curing reaction. The gradual decrease tendency of Ea before α ≤ 0.8 should be ascribed to the fact that the dominant addition reaction between epoxy and amine (mainly primary amine and secondary amine) can largely accelerate the epoxy–amine reaction.19 Specifically, in the early stage of the curing process, where the epoxy system at a low temperature, the primary and secondary amine reacts with epoxy is somewhat difficult, so the Ea is slightly high. With the increase of temperature, hydroxy bonds are generated during the curing process. After α = 0.8, the Ea was almost stable which attributed to that the transition from chemical control to a diffusion control with higher cross-link density. At the end stage of the curing process, the higher density crosslinking or gelation constrains the motion of chains results in the decrease of free volume which makes the curing reaction more difficult.4,19
In the case of EP/A-NiPS, the Ea gradually dropped up to α = 0.6 and then remain constant up to α = 0.7. The higher activation energy may be attributed to the initial viscosity values of EP/A-NiPS increased at the early stage of conversion. With the increase in conversion (0.2 < α ≤ 0.6), the decline of the activation energy is more obvious which can be attributed to the amine group existing in A-NiPS can participate in the formation of cross-linking structure in the epoxy system. Moreover, the proton H+ provided by the NH3+ existing in the A-NiPS can initiate the polymerization. When proton H+ is captured by the epoxide ring, an activated formed exist during the curing process. This kind of activated form can react with additional epoxide groups due to the promoting effect of the proton H+. The increasing trend of Ea suggests that EP/A-NiPS is controlled by a chemical crosslinking reaction at the first stage, and then it gradually turns to diffusion control that ascribed to an increase of system viscosity.
With the addition of G-NiPS into the EP matrix, the Ea is greatly lowered at the beginning of the curing process. With the relative conversion increasing, the Ea of the curing system decreases gradually. Similar phenomena are also reported by Gao et al.28 Notably, the mobility of the epoxide groups in GPTMS is stronger than those in EP chains, thus, the G-NiPS is more reactive than EP when reacting with DDM.29 As a result, G-NiPS can lowest the Ea of the curing system effectively. Besides, the hydroxy groups attached to the surface of G-NiPS still have catalytic effects during the curing process.
As for M-NiPS, there is no functional group in MPTS that can react with the epoxide group, so M-NiPS does not participate in the curing reaction. When 0.2 ≤ α ≤ 0.4, a progressive increase in the Ea. This phenomenon can be ascribed to the increased system viscosity, which interrupts the curing reaction. As the temperature rises, the increasing –OH can promote the epoxy–amine reaction and the Ea decrease gradually.
The Ea is unstable in the whole curing process for the curing systems. So, the mean activation energy calculated in the conversion range of α = 0.2–0.8 to was employed to represent the Ea estimated by the Starink method. The mean Ea was 51.8 kJ mol−1, 48.5 kJ mol−1, 45.3 kJ mol−1 and 47.6 kJ mol−1 for EP, EP/A-NiPS, EP/G-NiPS and EP/M-NiPS, respectively. From this data, a conclusion can be drawn that A-NiPS, G-NiPS and M-NiPS have a promoted effect on curing reactions. Among which the G-NiPS has the lowest Ea because the epoxide groups in G-NiPS have the highest reactive.
The Friedman method is a kind of differential method that did not need any mathematical approximation. Given this, the Friedman method should be more accurate and reliable than the integral method.30 The basic differential expression is usually drawn following eqn (4), which involves a nature logarithm of both heating rate and mass conversion rate as a function of reciprocal temperature.31
 | (4) |
According to eqn (4), the Ea can be obtained by the slope of the linear fit through the plotting ln[β·dα/dT] against 1000/T for each value of the conversion.
The plot of the ln[β·dα/dT] versus 1000/T for the EP/NiPS composites over a wide range of conversions are illustrated in Fig. 5. Moreover, the linear relation shown indicates that the Friedman method is suitable for these EP composites. And the Ea over the whole range of conversion is summarized in Table 2.
The values produced by the Friedman method are lower than the Kissinger method. Similar phenomena are also reported by Zhang et al.32 and Alonso et al.33 This can be ascribed to the fact that the Friedman method uses the curing rate in the calculation process which reflects the state of the curing process at a given cure degree, so it is more sensitive to the experimental noise, resulting in the data being less stable.26 However, the Starink method reflects the history of the whole curing process, and it produces many reliable values. Besides, the Starink method uses a temperature approximation equation, in which the initial cure temperature integral is neglected, resulting in a discrepancy between the Friedman and Starink methods at the beginning of the curing.32
However, both two methods reveal the same trend of mean Ea for neat EP, EP/A-NiPS, EP/G-NiPS and EP/M-NiPS, of which the mean various of Ea are 51.8 kJ mol−1, 48.5 kJ mol−1, 45.3 kJ mol−1 and 47.6 kJ mol−1 obtained from the Starink method, and 49.2 kJ mol−1, 46.3 kJ mol−1, 42.4 kJ mol−1, and 45.7 kJ mol−1 derived from Friedman method, respectively. Besides, the estimated Ea by the Kissinger method is also consistent with the above trend. Thus, both three approaches can be used to detect the Ea, but the Starink method is the most reliable approach than the Kissinger method and Friedman method.
To investigate the reaction order of the EP/NiPS composites, the Crane equation is employed to calculate the kinetics order.34
 | (5) |
Owning to  the Crane equation can be simplified as follows:
 | (6) |
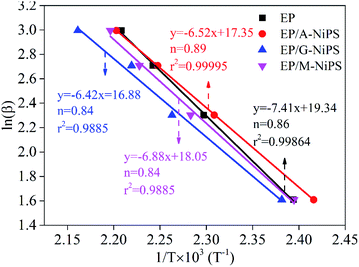
Fig. 6 shows the linear fit plots of ln![[thin space (1/6-em)]](https://www.rsc.org/images/entities/char_2009.gif) β versus 1000/Tp for neat EP, EP/A-NiPS, EP/G-NiPS and EP/M-NiPS, respectively. The deduced equations y = −7.411x + 19.34, y = −6.52x + 17.35, y = −6.42x + 16.88 and y = −6.88x + 18.05 for neat EP, EP/A-NiPS, EP/G-NiPS and EP/M-NiPS, respectively. Thus, the obtained reaction order was 0.86, 0.89, 0.84 and 0.84, respectively. It is easily observed that the reaction order for the EP composites followed first-order kinetics, which means the addition of the organic modified NiPS does not change the reaction order.
β versus 1000/Tp for neat EP, EP/A-NiPS, EP/G-NiPS and EP/M-NiPS, respectively. The deduced equations y = −7.411x + 19.34, y = −6.52x + 17.35, y = −6.42x + 16.88 and y = −6.88x + 18.05 for neat EP, EP/A-NiPS, EP/G-NiPS and EP/M-NiPS, respectively. Thus, the obtained reaction order was 0.86, 0.89, 0.84 and 0.84, respectively. It is easily observed that the reaction order for the EP composites followed first-order kinetics, which means the addition of the organic modified NiPS does not change the reaction order.
Once the Ea has been estimated, the fitful kinetic model and the curing reaction rate equation should be determined. The Málek method was utilized to guide the appropriate curing reaction model and corresponding kinetic parameters through the characteristic functions of y(α) and z(α).5,35
 | (7) |
 | (8) |
 | (9) |
The normalized value of both y(α) and z(α) functions were used to select the kinetic model to characterize the cure reaction and it's was obtained by the following equations:
 | (10) |
 | (11) |
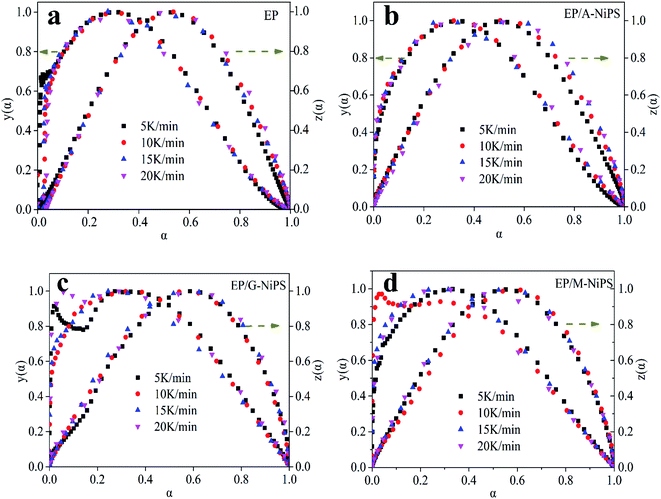
The suitable kinetic model can be determined with the shape and the maximum values of both normalized y(α) and z(α), then the kinetic parameters such as n and m can be obtained. Fig. 7 exhibits the normalized y(α) and z(α) versus the fraction conversion of EP/NiPS composites with the various heating rates. The peak values of normalized y(α), normalized z(α) and dα/dt were indicated as αM, α∞p, and αp and listed in Table 3. According to the judging standard of the Málek method (0 < αM < α∞p, and α∞p ≠ 0.632 at various heating rates), the SB(m, n) model can be used to describe the non-isothermal curing kinetics of EP/NiPS systems.5,35 This model can be expressed as follows:
 | (12) |
 | (13) |
| Systems | β (K min−1) | aM | α∞p | ap | n | m | ln![[thin space (1/6-em)]](https://www.rsc.org/images/entities/char_2009.gif) A A |
|---|---|---|---|---|---|---|---|
| EP | 5 | 0.307 | 0.521 | 0.501 | 1.850 | 0.789 | 16.266 |
| 10 | 0.297 | 0.534 | 0.511 | 1.818 | 0.775 | 16.281 | |
| 15 | 0.295 | 0.535 | 0.502 | 1.899 | 0.810 | 16.312 | |
| 20 | 0.300 | 0.578 | 0.514 | 1.887 | 0.805 | 17.272 | |
| Mean | 0.299 | 0.542 | 0.507 | 1.864 | 0.795 | 16.283 | |
| EP/A-NiPS | 5 | 0.343 | 0.519 | 0.506 | 1.623 | 0.777 | 13.571 |
| 10 | 0.321 | 0.504 | 0.485 | 1.482 | 0.709 | 13.427 | |
| 15 | 0.291 | 0.565 | 0.522 | 1.427 | 0.683 | 13.373 | |
| 20 | 0.340 | 0.555 | 0.538 | 1.321 | 0.633 | 13.189 | |
| Mean | 0.324 | 0.535 | 0.512 | 1.463 | 0.700 | 13.390 | |
| EP/G-NiPS | 5 | 0.278 | 0.590 | 0.563 | 0.866 | 0.260 | 11.413 |
| 10 | 0.343 | 0.572 | 0.540 | 0.935 | 0.281 | 11.384 | |
| 15 | 0.241 | 0.581 | 0.539 | 1.041 | 0.313 | 11.541 | |
| 20 | 0.061 | 0.603 | 0.568 | 0.911 | 0.274 | 11.373 | |
| Mean | 0.231 | 0.587 | 0.553 | 0.938 | 0.282 | 11.428 | |
| EP/M-NiPS | 5 | 0.327 | 0.535 | 0.535 | 0.952 | 0.218 | 12.150 |
| 10 | 0.031 | 0.591 | 0.555 | 0.982 | 0.225 | 12.090 | |
| 15 | 0.260 | 0.562 | 0.526 | 1.022 | 0.234 | 12.175 | |
| 20 | 0.298 | 0.525 | 0.515 | 1.102 | 0.252 | 12.234 | |
| Mean | 0.229 | 0.553 | 0.533 | 1.014 | 0.232 | 12.162 |
Take the logarithm of two sides for eqn (12) and it can be expressed by eqn (14).
 | (14) |
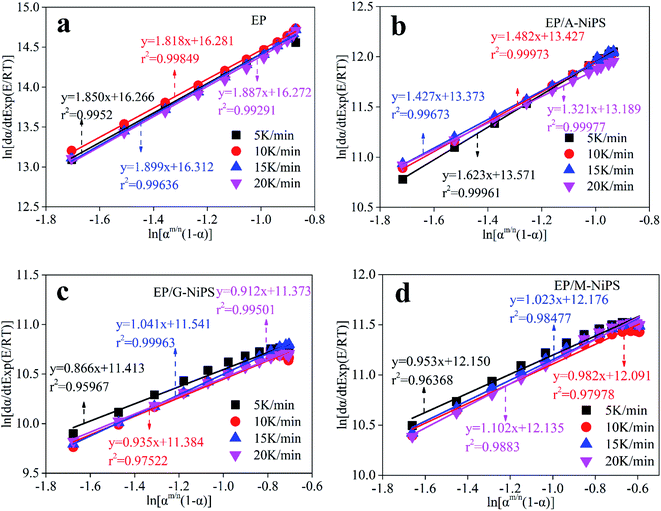
The linear plots of ln[(dα/dt) exp(χ)] versus ln[αp(1 − α)] for epoxy system is shown in Fig. 8. According to eqn (14), n and ln![[thin space (1/6-em)]](https://www.rsc.org/images/entities/char_2009.gif) A can be calculated by intercept and slope, respectively. M can be determined by multiplying n and αM(1 − αM) together. The results are listed in Table 3. It is presented that the Málek method can obtain the unique rate equation without the uncertainty in kinetic parameters during the non-isothermal curing reaction.5,37 Besides, due to 0 < m < n, the autocatalytic reaction acted a dominant role in the whole curing process.
A can be calculated by intercept and slope, respectively. M can be determined by multiplying n and αM(1 − αM) together. The results are listed in Table 3. It is presented that the Málek method can obtain the unique rate equation without the uncertainty in kinetic parameters during the non-isothermal curing reaction.5,37 Besides, due to 0 < m < n, the autocatalytic reaction acted a dominant role in the whole curing process.
The apparent dynamic equations for the curing equations of neat EP, EP/A-NiPS, EP/G-NiPS and EP/M-NiPS systems can be obtained by substituting the above kinetic parameter (n, m as well as ln![[thin space (1/6-em)]](https://www.rsc.org/images/entities/char_2009.gif) A) into eqn (12).
A) into eqn (12).
EP
EP/A-NiPS
EP/G-NiPS
EP/M-NiPS
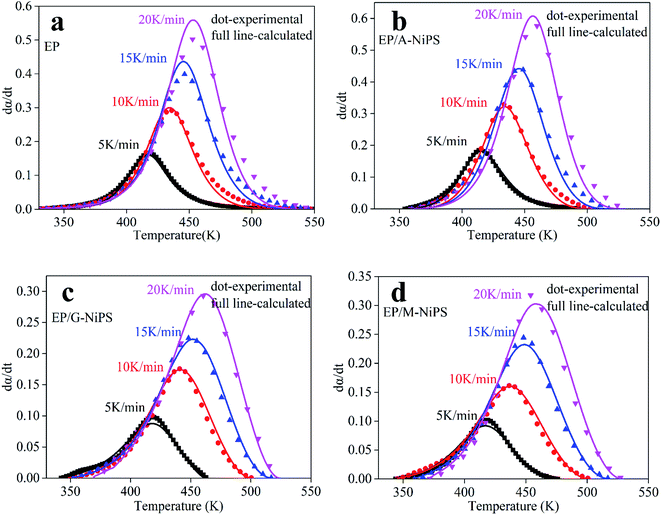
The calculated data obtained by SB(m, n) is evaluated by comparing with the experimental data of the dα/dt versus T curves. Compared results for EP, EP/A-NiPS, EP/G-NiPS and EP/M-NiPS are presented in Fig. 9, respectively. The comparison results suggest that the SB model derived from the Málek method can describe the whole curing process of EP/NiPS systems at different heating rates, suggesting that the autocatalytic kinetic model is well suited for the kinetic analysis of all these EP/NiPS curing systems.
3.2 Flammability of EP composites
The Limiting Oxygen Index (LOI) and vertical burning test (UL-94) measurements are usually applied to evaluate the combustion behaviors of EP composites, and the related data and corresponding photos are illustrated in Table 4 and Fig. 10, respectively. Neat EP is a combustion material and the LOI value is only 23.8%. During the combustion process, pure EP fiercely burns accompanied by lots of ignited dripping and cannot self-extinguish, as well as releases a large amount of toxic smoke (Fig. 11a). After the first ignition, neat EP burns continuously with a total combustion time of 214 s with no char layer forms at the end. Thus, pure EP fails to pass the UL-94 test. With the addition of 5.0 wt% A-NiPS, the LOI value of EP/A-NiPS marginally increases to 27.1%, which means that the oxygen concentration (approximately 21.0%) in the air cannot support the candle-like fire spread of this composite. After the first ignition, the burning time of EP/A-NiPS is 89 s with no dripping behavior (Fig. 11b). These results demonstrate that the flame retardancy of EP/A-NiPS is improved. Notably, with the incorporation of 5.0 wt% G-NiPS, the LOI of EP/G-NiPS reaches 27.5% and can self-extinguish rapidly with the total burning time of 43 s, significantly decreasing compared with that of pure EP (Fig. 11c). When 5.0 wt% M-NiPS is added, the LOI reaches 27.3%, and the burning time is 118 s (Fig. 11d).| Samples | LOI (%) | UL-94 | ||
|---|---|---|---|---|
| Ignition of cotton | Dripping | Burning time (s) | ||
| EP | 23.8 | Yes | Heavy | 214 |
| EP/A-NiPS | 27.1 | No | No | 89 |
| EP/G-NiPS | 27.5 | No | No | 43 |
| EP/M-NiPS | 27.3 | No | No | 122 |
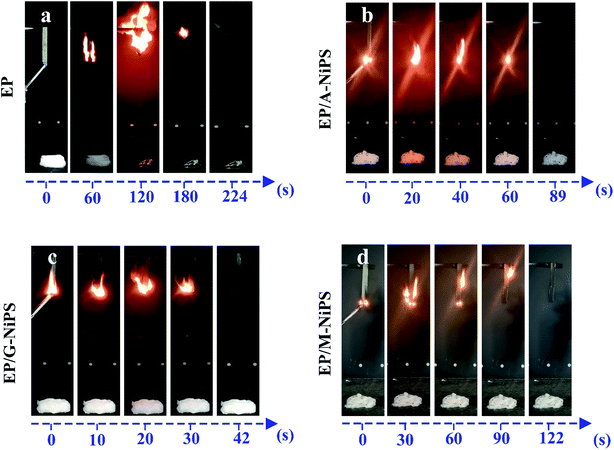 | ||
| Fig. 10 Digital photos of EP (a), EP/A-NiPS (b), EP/G-NiPS (c) and EP/M-NiPS (d) during the UL-94 test at different time. | ||
Compared with pure EP, EP/A-NiPS, EP/G-NiPS and EP/M-NiPS have higher LOI values, shorter self-extinguishing time with no dripping, which indicates the incorporation of A-NiPS, G-NiPS as well as M-NiPS, can ameliorate the flame retardancy of EP composites effectively. This phenomenon can be ascribed to the barrier formation and increased melt viscosity of EP/NiPS composites, retarding the flame spread and flammability.38 Although the EP/NiPS composites show relatively higher LOI values, they fail to pass the UL-94 test, i.e., all the formulations show the same results (N.R.). This phenomenon is mainly due to the purpose of the LOI test focusing on the ignitability while UL-94 stresses the resistance of fire spreading higher heat back.
The morphology of the outer surface char residues of EP composites after the LOI test was analyzed by SEM and presented in Fig. 11. Neat EP is a non-charring polymer with limited char formation, which was not sufficient to protect the underlying matrix during the whole combustion process. Enormous pores from the residue char were observed by SEM. Therefore, heat and combustible volatiles easily pierce the char layer and enter the flame zone. By contrast, the char layer of EP composites considerably differed from that of the aforementioned sample. As shown in Fig. 11b–d, a firm and compact ceramic layer are formed on the char surface. This morphology suggested that NiPS can promote EP to form an effective char layer and work as a protective barrier that can avoid the feedback of heat, oxygen diffusion between the condensed and gas phase, and subsequent decomposition, thus enhancing flame retardancy. This can be attributed to the decomposition of silane groups attached to the NiPS, which forms a silicon-rich residue during the combustion.39 Besides, the char is also promoted by NiPS itself due to the Brønsted and Lewis acid sites present on the lattice.40 Comparing the char morphologies of EP/NiPS composites, the char obtained from the EP/G-NiPS has a more compact structure compared the those of the EP/A-NiPS and EP/M-NiPS samples, more effectively limiting the heat and oxygen transfer to the underlying matrix. This phenomenon is in line with the LOI and UL-94 results, suggesting EP/G-NiPS has the highest flame retardancy compared with the control samples. This is because G-NiPS can migrate to the burning surface faster than the control samples and form an effective barrier. The flammability test of EP composites revealed that the addition of A-NiPS, G-NiPS, as well as M-NiPS, can ameliorate the flame retardancy of EP composites effectively.
4. Conclusion
In this study, the cure behavior of neat EP, EP/A-NiPS, EP/G-NiPS and EP/M-NiPS were investigated by non-isothermal DSC. It was found that the presence of A-NiPS, G-NiPS and M-NiPS exhibited a stronger effect in accelerating the curing reaction. Besides, the activation energy obtained by the Kissinger method, the Starink method and the Friedman method exhibited the same trend. Furthermore, the curing kinetics for the EP/NiPS composites were described by the autocatalytic equation of the SB model. In detail, the SB model can describe the cure kinetics quite well, which means the autocatalytic reaction mechanism acted a major role in the whole curing reaction at various heating rates. At last, the effects of these organic-modified NiPS on the flammability of EP composites were investigated carefully. The result shows that the incorporated NiPS could improve the flame retardancy of EP, enhancing the self-extinguishing ability with high LOI values.Conflicts of interest
The author declares no conflicts of interest.Acknowledgements
The authors gratefully acknowledge the Anhui Province Natural Science Foundation (2008085QE269) and Natural Science Research Project of Universities in Anhui Province (KJ2020A0326).References
- Y. G. Hsu, K. H. Lin, T. Y. Lin, Y. L. Fang, S. C. Chen and Y. C. Sung, Properties of epoxy-amine networks containing nanostructured ether-crosslinked domains, Mater. Chem. Phys., 2012, 132, 688–702 CrossRef CAS.
- F. L. Jin, X. Li and S. J. Park, Synthesis and application of epoxy resins: a review, J. Ind. Eng. Chem., 2015, 29, 1–11 CrossRef CAS.
- E. Esmizadeh, G. Naderi, A. A. Yousefi and C. Milone, Investigation of curing kinetics of epoxy resin/novel nanoclay–carbon nanotube hybrids by non-isothermal differential scanning calorimetry, J. Therm. Anal. Calorim., 2016, 126, 771–784 CrossRef CAS.
- S. K. Sahoo, S. Mohanty and S. K. Nayak, A study on effect of organo modified clay on curing behavior and thermo-physical properties of epoxy methyl ester based epoxy nanocomposite, Thermochim. Acta, 2015, 614, 163–170 CrossRef CAS.
- Q. Bi, L. Ha, Q. Zhang, P. Wang, P. Xu and Y. Ding, Study on the effect of amino-functionalized alumina on the curing kinetics of epoxy composites, Thermochim. Acta, 2019, 678, 178302 CrossRef.
- A. M. Shanmugharaj and S. H. Ryu, Study on the effect of aminosilane functionalized nanoclay on the curing kinetics of epoxy nanocomposites, Thermochim. Acta, 2012, 546, 16–23 CrossRef CAS.
- X. Yue, C. Li, Y. Ni, Y. Xu and J. Wang, Flame retardant nanocomposites based on 2D layered nanomaterials: a review, J. Mater. Sci., 2019, 54, 13070–13105 CrossRef CAS.
- F. Adam and T. S. Chew, A Facile Template-Free Room Temperature Synthesis of Mesoporous Wormlike Nickel Phyllosilicate, Open Colloid Sci. J., 2012, 5, 1–4 CrossRef CAS.
- J. M. Alencar, F. J. V. E. Oliveira, C. Airoldi and E. C. Silva Filho, Organophilic nickel phyllosilicate for reactive blue dye removal, Chem. Eng. J., 2014, 236, 332–340 CrossRef CAS.
- Z. F. Bian and S. Kawi, Preparation, characterization and catalytic application of phyllosilicate: a review, Catal. Today, 2020, 339, 3–23 CrossRef CAS.
- C. X. Gui, S. M. Hao, Y. Liu, J. Qu, C. Yang, Y. Yu, Q. Q. Wang and Z. Z. Yu, Carbon nanotube@layered nickel silicate coaxial nanocables as excellent anode materials for lithium and sodium storage, J. Mater. Chem. A, 2015, 3, 16551–16559 RSC.
- J. N. Yang, Y. Liu, Y. X. Xu, S. B. Nie and Z. Y. Li, Property investigations of epoxy composites filled by nickel phyllosilicate-decorated graphene oxide, J. Mater. Sci., 2020, 55, 10593–10610 CrossRef CAS.
- S. Nie, D. Jin, Y. Xu, C. Han and J. N. Yang, Effect of a flower-like nickel phyllosilicate-containing iron on the thermal stability and flame retardancy of epoxy resin, J. Mater. Res. Technol., 2020, 9, 10189–10197 CrossRef CAS.
- J. N. Yang, Z. Y. Li, Y. X. Xu, S. B. Nie and Y. Liu, Effect of nickel phyllosilicate on the morphological structure, thermal properties and wear resistance of epoxy nanocomposites, J. Polym. Res., 2020, 27, 274 CrossRef CAS.
- J. N. Yang, Y. X. Xu, S. B. Nie, X. S. Feng and L. Jiang, Effect of organic-modified nickel phyllosilicates on the tribological, mechanical and thermal properties of epoxy composites, J. Mater. Res. Technol., 2021, 14, 692–702 CrossRef CAS.
- Y. Yang, W. Li, K. Chen, W. Gan and C. Wang, Epoxy terminated polysiloxane blended with diglycidyl ether of bisphenol-A. 1: curing behavior and compatibility, J. Appl. Polym. Sci., 2018, 135, 46891 CrossRef.
- M. Abdalla, D. Dean, P. Robinson and E. Nyairo, Cure behavior of epoxy/MWCNT nanocomposites: the effect of nanotube surface modification, Polymer, 2008, 49, 3310–3317 CrossRef CAS.
- Y. Fu and W. H. Zhong, Cure kinetics behavior of a functionalized graphitic nanofiber modified epoxy resin, Thermochim. Acta, 2011, 516, 58–63 CrossRef CAS.
- L. Li, H. Zou, M. Liang and Y. Chen, Study on the effect of poly(oxypropylene)diamine modified organic montmorillonite on curing kinetics of epoxy nanocomposties, Thermochim. Acta, 2014, 597, 93–100 CrossRef CAS.
- J. Hu, J. Shan, J. Zhao and Z. Tong, Water resistance and curing kinetics of epoxy resins with a novel curing agent of biphenyl-containing amine synthesized by one-pot method, Thermochim. Acta, 2015, 606, 58–65 CrossRef CAS.
- P. Zhang, S. A. Ali Shah, F. Gao, H. Sun, Z. Cui, J. Cheng and J. Zhang, Latent Curing Epoxy Systems with Reduced Curing Temperature and Improved Stability, Thermochim. Acta, 2019, 676, 130–138 CrossRef CAS.
- S. Vyazovkin, A. Mititelu and N. Sbirrazzuoli, Kinetics of Epoxy–Amine Curing Accompanied by the Formation of Liquid Crystalline Structure, Macromol. Rapid Commun., 2003, 24, 1060–1065 CrossRef CAS.
- S. Vyazovkin, Advanced Isoconversional Method, J. Therm. Anal., 1997, 49, 1493–1499 CrossRef CAS.
- J. Zhang, H. Dong, L. Tong, L. Meng, Y. Chen and G. Yue, Investigation of curing kinetics of sodium carboxymethyl cellulose/epoxy resin system by differential scanning calorimetry, Thermochim. Acta, 2012, 549, 63–68 CrossRef CAS.
- Y. Kai and M. Gu, Fabrication, Morphology and Cure Behavior of Triethylenetetramine-Grafted Multiwalled Carbon Nanotube/Epoxy Nanocomposites, Polym. J., 2009, 41, 752–763 CrossRef.
- M. J. Starink, The determination of activation energy from linear heating rate experiments: a comparison of the accuracy of isoconversion methods, Thermochim. Acta, 2003, 404, 163–176 CrossRef CAS.
- N. Esmaeili, M. Vafayan, A. Salimi and M. J. Zohuriaanmehr, Kinetics of curing and thermo-degradation, antioxidizing activity, and cell viability of a tannic acid based epoxy resin: from natural waste to value-added biomaterial, Thermochim. Acta, 2017, 655, 21–33 CrossRef CAS.
- J. Gao, D. Kong and S. Li, Nonisothermal Cocuring Behavior and Kinetics of Epoxy Resin/3-Glycidyloxypropyl-POSS With MeTHPA, Polym. Compos., 2010, 31, 60–67 CrossRef CAS.
- W. Hao, J. Hu, L. Chen, J. Zhang, L. Xing and W. Yang, Isoconversional analysis of non-isothermal curing process of epoxy resin/epoxide polyhedral oligomeric silsesquioxane composites, Polym. Test., 2011, 30, 349–355 CrossRef CAS.
- S. Michael and S. Markus, Kinetic Prediction of Fast Curing Polyurethane Resins by Model-Free Isoconversional Methods, Polymers, 2018, 10, 698 CrossRef PubMed.
- A. Pratap, T. L. S. Rao, K. N. Lad and H. D. Dhurandhar, Isoconversional vs. Model fitting methods - a case study of crystallization kinetics of a Fe-based metallic glass, J. Therm. Anal. Calorim., 2007, 89, 399–405 CrossRef CAS.
- C. Zhang, W. K. Binienda, L. Zeng, X. Ye and S. Chen, Kinetic study of the novolac resin curing process using model fitting and model-free methods, Thermochim. Acta, 2011, 523, 63–69 CrossRef CAS.
- M. V. Alonso, M. Oliet, J. García, F. Rodríguez and J. Echeverría, Gelation and isoconversional kinetic analysis of lignin–phenol–formaldehyde resol resins cure, Chem. Eng. J., 2006, 122, 159–166 CrossRef CAS.
- H. N. Minh, N. T. Chinh, T. T. T. Van and T. Hoang, Ternary nanocomposites based on epoxy, modified silica, and tetrabutyl titanate: morphology, characteristics, and kinetics of the curing process, J. Appl. Polym. Sci., 2019, 136, 47412 CrossRef.
- F. Román, Y. Calventus, P. Colomer and J. M. Hutchinson, Identification of nanostructural development in epoxy polymer layered silicate nanocomposites from the interpretation of differential scanning calorimetry and dielectric spectroscopy, Thermochim. Acta, 2012, 541, 76–85 CrossRef.
- G. I. Senum and R. T. Yang, Rational approximation of the integral of the arrhenius function, J. Therm. Anal., 1977, 11, 445–447 CrossRef.
- H. L. Ma, X. Zhang, F. F. Ju and S. B. Tsai, A Study on Curing Kinetics of Nano-Phase Modified Epoxy Resin, Sci. Rep., 2018, 8, 3045 CrossRef PubMed.
- M. Bartholmai and B. Schartel, Layered silicate polymer nanocomposites: new approach or illusion for fire retardancy? Investigations of the potentials and the tasks using a model system, Polym. Adv. Technol., 2004, 15, 355–364 CrossRef CAS.
- G. H. Hsiue, W. Wu-jing and C. Feng-chin, Synthesis, characterization, thermal and flame-retardant properties of silicon-based epoxy resins, J. Appl. Polym. Sci., 1999, 73, 1231–1238 CrossRef CAS.
- P. Kiliaris and C. D. Papaspyrides, Polymer/layered silicate (clay) nanocomposites: an overview of flame retardancy, Prog. Polym. Sci., 2010, 35, 902–958 CrossRef CAS.
| This journal is © The Royal Society of Chemistry 2022 |

