 Open Access Article
Structural effect of Ni/TiO2 on CO methanation: improved activity and enhanced stability†
Jie Zhang,
Xinyu Jia and
Chang-jun Liu *
*
School of Chemical Engineering and Technology, Tianjin University, Tianjin 300072, China. E-mail: cjL@tju.edu.cn; Tel: +86 22 27406490
First published on 23rd December 2021
Abstract
CO methanation over a supported Ni catalyst has attracted increasing attention for its applications in synthetic natural gas production, CO removal for ammonia synthesis and fuel cells, among others. However, the deactivation of the Ni catalyst caused by sintering and carbon deposition hinders further application of the Ni catalyst. The activity of Ni catalysts needs further improvement as well. In this work, the structural effect of the Ni/TiO2 catalyst on CO methanation was investigated. A plasma decomposition, initiated at room temperature and operated around 150 °C, of the nickel precursor was applied to prepare the catalyst. Compared to the thermally decomposed Ni/TiO2 catalyst, the plasma-decomposed catalyst shows improved activity with enhanced stability. The catalyst characterization shows that the plasma-decomposed Ni/TiO2 catalyst possesses smaller Ni particle size and higher Ni dispersion, resulting in improved coke resistance and enhanced anti-sintering ability for CO methanation. The present study confirms that a catalyst with good activity for CO methanation possesses good activity for CO2 methanation as well, if the CO2 methanation takes the CO methanation pathway.
1. Introduction
CO methanation, known as the Sabatier reaction, has been recently applied for the production of synthetic natural gas,1,2 an important process for clean coal utilization. It has been used to remove trace CO for the production of ammonia and fuel cells. The investigation of CO methanation is also fundamentally important for CO2 methanation since CO2 methanation may take the pathway of CO methanation via the dissociation of carbon dioxide to CO.3 A good CO2 methanation catalyst should firstly have excellent activity in CO methanation if it takes the CO methanation pathway.4,5 With increasing concerns regarding CO2 utilization in the emission control of greenhouse gases, storage of renewable hydrogen and in life cycle systems in space stations, the study of CO methanation is now even more important.3–6Due to their relatively high activity and relatively low price, oxide-supported Ni catalysts have been extensively applied for CO2 reforming of methane,7,8 methane decomposition,9 and CO1,2,10–12 and CO2 methanation.3–6 However, carbon formation and sintering cause the deactivation of Ni catalysts for CO methanation.13,14 In addition, the low-temperature activity of the supported Ni catalysts for CO methanation still needs to be improved. The high reaction temperature causes more carbon formation;15 therefore, a low temperature reaction is also required to limit the carbon formation. Previous studies have confirmed that a strong Ni–support interaction with a small nickel particle size or high dispersion of nickel not only enhances the anti-sintering ability and coke resistance16–19 but also improves activity.20 Various promoters have been used to limit the Ni catalyst size for improved catalytic properties.21,22 The catalyst preparation method has a significant effect. Tao et al.23 found that the decreased polarity of the impregnation solvent enhanced the Ni–support interaction and resulted in high catalyst dispersion. Qin et al.20 employed a hydrolysis–precipitation technique to prepare a Ni/Al2O3 catalyst. A high Ni dispersion was achieved even with 40 weight percentage of NiO, which caused a good activity with enhanced stability. Zhao et al.24 reported an alloying method to limit the Ni catalyst size for enhanced activity and coke resistance toward CO methanation. Shinde and Madras25 performed a sonochemical treatment of a Ni/TiO2 catalyst precursor and got a highly active and stable CO methanation catalyst. The low temperature plasma decomposition26–28 of a nickel precursor was also found by our group4,29,30 and others12,18,19,31 to be an effective method of making a Ni catalyst with a strong Ni–support interaction, high dispersion and improved activity and excellent carbon resistance for CO methanation. The oxide support is important to achieve a strong Ni–support interaction with small catalyst size. Among the oxide supports reported previously, TiO2 is an excellent one with a strong Ni–TiO2 interaction and high coke resistance property for CO methanation.15,25,32–34 Previously, our group applied the low temperature plasma decomposition of a nickel precursor to prepare the Ni/TiO2 catalyst for CO2 methanation.35 An enhanced activity with high CH4 selectivity was achieved.35 It was confirmed that the plasma-prepared Ni/TiO2 catalyst takes the CO methanation pathway for CO2 methanation. Further investigation36 showed that the carbon species from CO decomposition on the plasma prepared Ni/TiO2 catalyst possessed excellent reactivity towards hydrogen. This suggests that the plasma-prepared Ni/TiO2 catalyst may have excellent carbon resistance for CO methanation. However, it is unclear how the plasma-prepared Ni/TiO2 catalyst behaves during CO methanation. In this work, we confirm the excellent carbon resistance of the plasma-prepared Ni/TiO2 catalyst for CO methanation with improved activity and enhanced stability. The results obtained well explain the observed enhanced activity of the plasma-prepared Ni/TiO2 catalyst for CO2 methanation, which takes the pathway of CO methanation.35
2. Experimental
2.1. Catalyst preparation
The Ni/TiO2 catalysts were prepared via the incipient wetness impregnation method. The TiO2 powder (Tianjin Da Mao Chemical Reagent) was impregnated with an aqueous solution of Ni(NO3)2·6H2O (Tianjin Kemiou Chemical Reagent). The obtained sample was then aged at room temperature for 12 h. After drying at 110 °C for another 12 h, the nickel precursor was decomposed by two different methods. One method was to calcinate the impregnated sample at 700 °C for 2 h. This temperature was decided according to an experimental study on the effect of calcination temperature on the catalyst activity, which was highest at 700 °C. The obtained sample was denoted as NiO/TiO2–C. The other method was to decompose the nickel precursor by dielectric barrier discharge (DBD) plasma in argon for 1 h (at 3 min intervals, 20 times). The acquired sample was assigned as NiO/TiO2–P. DBD plasma is a conventional low temperature plasma phenomenon. It has been commercially employed for ozone generation, UV lighting, surface treatment and many other applications. Before the reaction, the catalyst was reduced by hydrogen at an elevated temperature. The reduced NiO/TiO2–C was assigned as Ni/TiO2–C, while the reduced NiO/TiO2–P was named as Ni/TiO2–P. The Ni loadings of Ni/TiO2–C and Ni/TiO2–P measured by ICP-MS were 10.0 wt% and 10.3 wt%, respectively.The DBD plasma setup used in this work has been described in our previous publications.28,30,35,37 In brief, two steel plate electrodes, with a diameter of 50 mm, are covered by two quartz plates (90 mm in diameter and 2.5 mm in thickness). The width of the discharge gap, which is the distance between the two quartz plates, is 8 mm. A specific amount of sample powder (0.5 g) was placed on the lower quartz plate. The DBD plasma was generated by a high voltage generator (CTP-2000 K; Corona Laboratory, Nanjing, China), which can supply a voltage from 0 to 30 kV with a sinusoidal waveform at a frequency of about 22 kHz. The average voltage was 14 kV. The average input power was 200 W. The DBD plasma decomposition was operated at atmospheric pressure and a temperature around 150 °C, measured by infrared imaging (Ircon, 100PHT).
2.2. Characterization
Thermogravimetric analysis (TGA) with differential scanning calorimetry (DSC) was carried out on a Netzsch STA 449 F3 system under flowing air at 100 ml min−1 with a heating rate of 10 °C min−1 (from 35 °C to 800 °C).The X-ray diffraction (XRD) patterns of the catalysts were recorded by a Rigaku D/max-2500 diffractometer equipped with a Ni-filtered Cu Kα radiation source (λ = 1.54056 Å), operated at 40 kV and 200 mA. Diffraction data were collected at a scanning speed of 8°/min over a 2θ range of 20° to 90°.
The specific surface area (SBET), pore volume and pore size distribution were determined by N2 adsorption/desorption isotherms at 77 K measured on an AUTOSORB-1-C instrument (Quantachrome).
X-ray photoelectron spectroscopy (XPS) analyses were carried out on a Thermo ESCALAB 250Xi spectrometer using Al Kα (hυ = 1486.6 eV) radiation. The binding energies measured were calibrated with the C1s peak (284.8 eV) as a reference.
Transmission electron microscopy (TEM) analyses were performed on a Philips Tecnai G2 F20 system equipped with an energy-dispersive X-ray spectrometer (EDX) operated at 200 kV. Dark-field scanning STEM imaging (EDS) and element mapping were acquired to investigate the distribution of elements in the samples.
2.3. Activity test
CO methanation was carried out in a quartz tubular fixed-bed reactor horizontally placed in a furnace under atmospheric pressure. The catalyst (50 mg) with SiC (150 mg) was loaded in the reactor. Before the reaction, the catalyst was heated to 500 °C (10 °C min−1) in argon (20 ml min−1) and reduced by pure hydrogen (30 ml min−1) for 1 h at the same temperature. Then the reactor was cooled down to 200 °C with flowing argon (20 ml min−1). A total flow rate of 50 ml min−1 (CO![[thin space (1/6-em)]](https://www.rsc.org/images/entities/char_2009.gif) :
:![[thin space (1/6-em)]](https://www.rsc.org/images/entities/char_2009.gif) H2
H2![[thin space (1/6-em)]](https://www.rsc.org/images/entities/char_2009.gif) :
:![[thin space (1/6-em)]](https://www.rsc.org/images/entities/char_2009.gif) N2 = 1
N2 = 1![[thin space (1/6-em)]](https://www.rsc.org/images/entities/char_2009.gif) :
:![[thin space (1/6-em)]](https://www.rsc.org/images/entities/char_2009.gif) 6
6![[thin space (1/6-em)]](https://www.rsc.org/images/entities/char_2009.gif) :
:![[thin space (1/6-em)]](https://www.rsc.org/images/entities/char_2009.gif) 3) feed gas was fed into the reactor at a gas hourly space velocity (GHSV) of 60
3) feed gas was fed into the reactor at a gas hourly space velocity (GHSV) of 60![[thin space (1/6-em)]](https://www.rsc.org/images/entities/char_2009.gif) 000 cm3 gcat−1 h−1. The effluent gases were analyzed online by a GC-6890D Agilent gas chromatograph equipped with a thermal conductivity detector (TCD) and a Porapak Q column. Nitrogen was chosen as an internal standard. A reaction temperature range of 200–450 °C was applied. The above-mentioned temperatures are all temperatures of the constant temperature zone of the electrical furnace, measured by a thermocouple. At each temperature point, the effluent was analyzed 3 times within 30 minutes. An average composition was finally used. The conversion of carbon monoxide and the yield of methane were calculated by the following equations:
000 cm3 gcat−1 h−1. The effluent gases were analyzed online by a GC-6890D Agilent gas chromatograph equipped with a thermal conductivity detector (TCD) and a Porapak Q column. Nitrogen was chosen as an internal standard. A reaction temperature range of 200–450 °C was applied. The above-mentioned temperatures are all temperatures of the constant temperature zone of the electrical furnace, measured by a thermocouple. At each temperature point, the effluent was analyzed 3 times within 30 minutes. An average composition was finally used. The conversion of carbon monoxide and the yield of methane were calculated by the following equations:Where XCO is the conversion of carbon monoxide (%), YCH4 is the yield of methane (%), and F is the volume flow rate of CO or CH4.
3. Results and discussion
3.1. Catalytic activity of CO methanation
Fig. 1 shows the CO conversion and CH4 yield of Ni/TiO2–C and Ni/TiO2–P. As the temperature increases, the CO conversion and CH4 yield are gradually increased. The plasma decomposed catalyst shows significantly improved CO conversion with higher CH4 yield. For example, at 350 °C, CO conversion reaches 97.1% over Ni/TiO2–P. However, it is only 7.7% over Ni/TiO2–C. Even a temperature increase to 450 °C resulted in the CH4 yield over Ni/TiO2–C being 40% lower than that of Ni/TiO2–P. The result confirms that the plasma-prepared catalyst has significantly improved activity.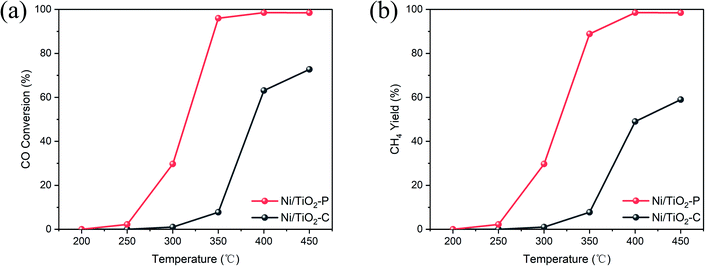 | ||
Fig. 1 (a) CO conversion and (b) CH4 yield over the Ni/TiO2–P and Ni/TiO2–C catalysts. Reaction conditions: H2/CO molar ratio of 6 and GHSV of 60![[thin space (1/6-em)]](https://www.rsc.org/images/entities/char_2009.gif) 000 cm3 gcat−1 h−1. 000 cm3 gcat−1 h−1. | ||
3.2. Catalyst characterization
Fig. 2 shows the XRD patterns of the TiO2 support, NiO/TiO2, Ni/TiO2 and the used Ni/TiO2 catalysts. All the samples show titanium dioxide is principally in the phase of anatase (JCPDS 21-1272). The NiO/TiO2 samples show peaks at 37.2° and 43.3°, which can be assigned to NiO (111) and NiO (200), respectively (JCPDS 47-1049). From the sharp peaks of NiO/TiO2–C, it can be seen that the NiO particle of NiO/TiO2–C is larger than that of NiO/TiO2–P. Ni (111) and Ni (200) peaks at 44.5° and 51.8°, respectively, (JCPDS 04-0850) can be clearly observed on the reduced samples. The peak of Ni (111) in Ni/TiO2–C is much stronger and sharper than that of Ni/TiO2–P. The particle size on the basis of the Ni (111) peak, calculated by the Scherrer equation, is summarized in Table 1. Obviously, the average Ni particle size of Ni/TiO2–C is larger than that of Ni/TiO2–P. The Ni dispersion is estimated from XRD, shown in Table 1. The Ni dispersion (DNi) for Ni/TiO2–P is larger than Ni/TiO2–C. This proves that plasma decomposition reduces the Ni particle size with high dispersion, as previously reported.35,36 This result is consistent with the result of TEM analyses, as discussed below. The BET surface area of the TiO2 support is 13.2 m2 g−1. After Ni loading, there is no obvious change in surface area. It is 14.1 m2 g−1 for Ni/TiO2–C and 15.1 m2 g−1 for Ni/TiO2–P. Not much difference in the pore volume and pore size of the TiO2 and Ni/TiO2 samples was observed (Table S1†).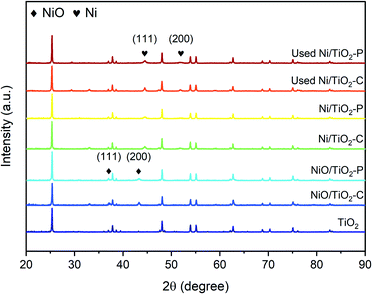 | ||
| Fig. 2 XRD patterns of the TiO2 support, NiO/TiO2, Ni/TiO2 and the used Ni/TiO2 catalysts after the stability tests. | ||
| Sample | dNia (nm) | dNib (nm) | DNic (%) |
|---|---|---|---|
| a The average size of Ni particles (dNi) was calculated by the Scherrer equation based on the XRD diffraction peak of Ni (111).b The average size of Ni particles (dNi) was derived from TEM measurement.c Ni dispersion (DNi) is estimated from XRD (see the ESI for details). | |||
| Ni/TiO2–C | 20.4 | 21.8 | 4.96 |
| Ni/TiO2–P | 16.2 | 12.4 | 6.25 |
| Used Ni/TiO2–C | 31.6 | 36.7 | 3.20 |
| Used Ni/TiO2–P | 16.7 | 12.8 | 6.06 |
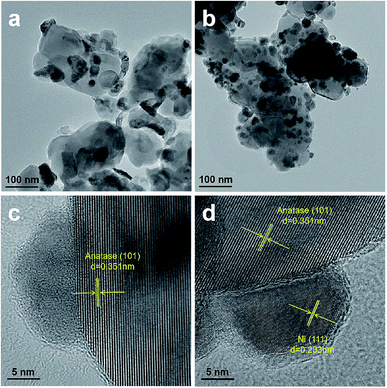
Fig. 3 shows the TEM images of Ni/TiO2–C and Ni/TiO2–P. As shown in Fig. 3(a and b), Ni/TiO2–P has better Ni dispersion and smaller Ni particle size than Ni/TiO2–C, as confirmed by XRD analyses. The Ni particle sizes of Ni/TiO2–C and Ni/TiO2–P are estimated from TEM, shown in Table 1. Moreover, it is difficult to find the clear lattice fringe of nickel in Ni/TiO2–C through the high-resolution TEM image (Fig. 3(c)). By contrast, as shown in Fig. 3(d), the distinct lattice fringe of Ni (111) is easily observed. This reflects that high temperature thermal treatment can cause the aggregation of the nickel precursor with irregular crystal structure. The same phenomenon has also been observed with the other plasma-prepared Ni catalysts, supported by ZrO2,4 SiO2![[thin space (1/6-em)]](https://www.rsc.org/images/entities/char_2009.gif) 16,30,37 and others.27,28 These two samples have clear lattice fringes of anatase (101), which is consistent with the XRD analyses.
16,30,37 and others.27,28 These two samples have clear lattice fringes of anatase (101), which is consistent with the XRD analyses.
Dark-field STEM analysis and corresponding element mapping were conducted to acquire the elemental distribution of Ni and Ti in all the Ni/TiO2 samples. As shown in Fig. 4, Ti of two samples is well-distributed throughout the whole sample. The plasma-prepared catalyst has better element distribution of Ni than Ni/TiO2–C. This further confirms that plasma preparation leads to higher Ni dispersion. The Ni 2p3/2 spectrum of the Ni/TiO2–P catalyst shows a more intensive peak compared to Ni/TiO2–C, as shown in Fig. S1.† This also demonstrates a higher Ni dispersion on the surface. In addition to the metallic nickel species, the XPS spectra present some Ni2+ species, which were caused by air exposure.
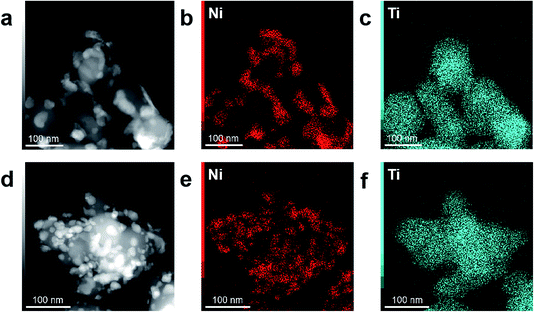 | ||
| Fig. 4 Dark-field STEM images and corresponding element maps of (a–c) Ni/TiO2–C and (d–f) Ni/TiO2–P. | ||
3.3. Stability
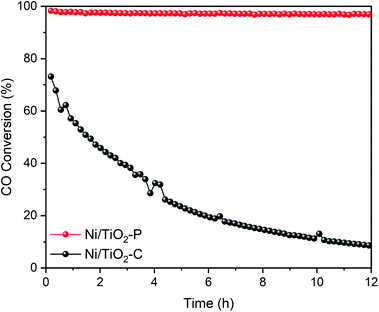
12 hour stability tests of the Ni/TiO2–P and Ni/TiO2–C catalysts were investigated at 400 °C. As shown in Fig. 5, Ni/TiO2–P exhibits superior stability. The CO conversion only shows a 1.35% decrease. In contrast, the CO conversion of Ni/TiO2–C shows a sharp decline from 73.15% to 8.61% with time. A significantly enhanced stability has been achieved over Ni/TiO2–P.The sintering of the catalyst and carbon deposition are the two main reasons for the deactivation of the Ni catalyst for CO methanation. TEM and TGA-DSC were used to analyse the states of the used catalysts after the stability tests. As exhibited in Fig. 6(a), the Ni particles become larger on Ni/TiO2–C. This suggests serious nickel sintering. In comparison, the nickel particles are evenly distributed on the carrier without obvious aggregation over Ni/TiO2–P (Fig. 6(b)). The plasma prepared catalyst after the stability test clearly shows the lattice fringe of Ni (111) (Fig. 6(d)), while it is difficult to find the lattice fringe of Ni on Ni/TiO2–C (Fig. 6(c)). Fig. 2 also shows the XRD patterns of the used Ni/TiO2 catalysts after the stability tests. The XRD analyses support the results of the TEM analyses. After the stability test, the average Ni size of Ni/TiO2–C increases from 21.8 nm to 36.7 nm, while it only changes from 12.4 nm to 12.8 nm over Ni/TiO2–P (Table 1). The plasma-decomposed Ni catalyst possesses intense Ni–support interaction, which can effectively prevent the agglomeration of Ni particles.4,27–29,38 This suggests that enhanced stability has been achieved for CO methanation over Ni/TiO2–P.
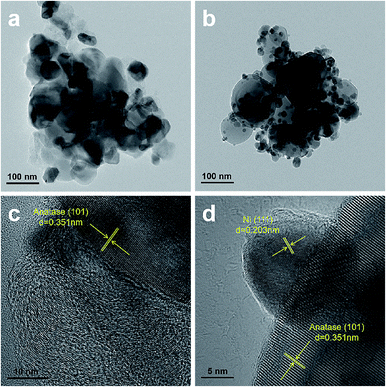 | ||
| Fig. 6 TEM and high-resolution TEM images of (a and c) Ni/TiO2–C and (b and d) Ni/TiO2–P after the stability tests. | ||
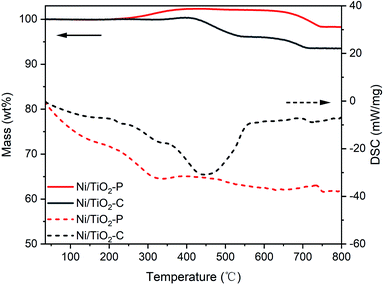
From the TGA-DSC analyses (Fig. 7), there is almost no weight loss over the used Ni/TiO2–P catalyst, indicating that no significant carbon deposition occurs after the reaction. The weight increase of the two samples, started from 230 °C to 400 °C, is assigned to the oxidation of Ni. The weight increase for the used Ni/TiO2–P is much higher than that for the used Ni/TiO2–C from 230 °C to 400 °C. This suggests that there are more active nickel species in the used Ni/TiO2–P catalyst. The exothermic peak over Ni/TiO2–C, centered at 450 °C, is attributed to the oxidation of carbon. As shown in Fig. 6(a and c), the carbon species are mainly composed of amorphous carbon. There is no obvious exothermic peak for the oxidation of carbon over Ni/TiO2–P. Only a slight mass loss is observed from the TG curve. The carbon yield, estimated from the weight changes between the maximum and minimum values of the TG curves from 200 °C to 600 °C, is 0.34% over the used Ni/TiO2–P, while it is 4.38% over the used Ni/TiO2–C. This confirms that more carbon is formed on Ni/TiO2–C, leading to the catalyst deactivation. Between 600 °C and 800 °C, the weight loss in the TG curves can be attributed to the phase transition of the TiO2 support (Fig. S2†).
Previous studies have confirmed that the small size16–19 and Ni (111)36 of the Ni catalyst lead to excellent coke resistance for CO methanation. The plasma prepared catalyst possesses smaller Ni catalyst size with the exposed Ni (111) plane. This causes an improved stability of the catalyst for CO methanation.
3.4. Discussion
The experimental studies here, as discussed above, show that the catalyst preparation methodology has a significant effect on the catalyst structure and thereby on the catalytic activity and stability. Under the influence of plasma, the decomposition of nickel nitrate on the TiO2 support occurs through reactions with highly energetic electrons and excited species, leading to fast nucleation but slow crystal growth because of the low bulk temperature operation of the plasma decomposition. Such decomposition by the highly energetic electrons and excited species favours the formation of the catalyst with Ni(111) as the principally exposed facet, while the low temperature operation of the plasma decomposition results in a catalyst of smaller size. The supported Ni catalyst with smaller size and Ni(111) shows improved activity for CO methanation. The enhanced stability is caused by the intense Ni–support interaction.From the DRIFT spectra of CO hydrogenation, as reported in our previous study on CO2 methanation,35 Ni/TiO2–P takes the direct CO hydrogenation pathway for CO methanation. However, Ni/TiO2–C adsorbs CO weakly and takes the formate pathway for CO methanation.35 As mentioned in the introduction, the investigation of CO methanation is fundamentally important for CO2 methanation if CO2 methanation takes the pathway of CO methanation via the dissociation of carbon dioxide to CO.3 This means that a good CO2 methanation catalyst should have good activity for CO methanation as well if it takes the CO methanation pathway.3,4 We have previously confirmed that the DBD plasma decomposition of the nickel precursor, followed by thermal hydrogen reduction (in the absence of the plasma), leads to ZrO2 and CeO2-supported Ni catalysts with improved low temperature activity for CO methanation4,29 as well as CO2 methanation.39,40 The present work further shows the viability of the plasma decomposition of the nickel precursor for the creation of the supported Ni catalyst with improved activity and enhanced stability for CO methanation with the use of neither additional promoters nor complex supporting materials. The plasma-decomposed Ni catalysts provide us with excellent model catalysts for the study of the structural effect on the activity and stability of methanation. These studies clearly show that CO methanation is a structure-sensitive reaction over the supported Ni catalysts. The present study will be helpful for the future development of Ni catalysts for CO methanation.
4. Conclusions
In this work, DBD plasma was applied for the decomposition of nickel nitrate on a TiO2 support. It is again confirmed that plasma decomposition is an excellent alternative to the thermal decomposition of the catalyst precursor. Plasma decomposition results in a highly dispersed Ni/TiO2 catalyst with exposed Ni (111). The plasma-decomposed Ni/TiO2 catalyst results in the generation of highly reactive carbon species towards CO methanation, which further leads to an excellent balance between the carbon generation from CO dissociation and the hydrogenation of the generated carbon to methane. This causes superior carbon resistance as confirmed by the small amount of carbon formed on the plasma-prepared Ni/TiO2 catalyst. A significantly improved activity with excellent stability is thus achieved on the plasma-prepared Ni/TiO2 catalyst for CO methanation. The enhanced stability is caused by the intense Ni–support interaction.The present study also confirms our previous prediction that the plasma-prepared Ni/TiO2 catalyst has improved activity for CO methanation if CO2 methanation takes the pathway of CO methanation.35 By the present study, we can be sure that the plasma-decomposed Ni catalyst provides an excellent model for the study of the structural effect on the activity and stability of methanation. The present study also clearly shows that CO methanation over a supported Ni catalyst is a structure-sensitive reaction. Therefore, the preparation methodology has a significant effect on the catalytic properties.
Author contributions
Jie Zhang: conceptualization, methodology, formal analysis, investigation, visualization, writing – original draft. Xinyu Jia: methodology, formal analysis. Chang-jun Liu: resources, investigation, supervision, writing – review & editing.Conflicts of interest
There are no conflicts to declare.Acknowledgements
This work was supported by the National Natural Science Foundation of China (No. 21536008 and 21621004).References
- J. Gao, Q. Liu, F. Gu, B. Liu, Z. Zhong and F. Su, RSC Adv., 2015, 5, 22759–22776 RSC
.
- M. Tao, C. Zhou, Y. Shi, X. Meng, J. Gu, W. Gao and Z. Xin, RSC Adv., 2020, 10, 20852–20861 RSC
.
- Y. Wang, L. R. Winter, J. G. Chen and B. Yan, Green Chem., 2021, 23, 249–267 RSC
.
- X. Jia, X. Zhang, N. Rui, X. Hu and C.-j. Liu, Appl. Catal., B, 2019, 244, 159–169 CrossRef CAS
.
- W. Xu, M. Dong, L. Di and X. Zhang, Nanomater, 2019, 9, 1432 CrossRef CAS PubMed
.
- S. Tada, T. Shimizu, H. Kameyama, T. Haneda and R. Kikuchi, Int. J. Hydrogen Energy, 2012, 37, 5527–5531 CrossRef CAS
.
- A. S. Al-Fatesh, R. Kumar, S. O. Kasim, A. A. Ibrahim, A. H. Fakeeha, A. E. Abasaeed, R. Alrasheed, A. Bagabas, M. L. Chaudhary, F. Frusteri and B. Chowdhury, Catal. Today, 2020, 348, 236–242 CrossRef CAS
.
- Y. Dai, R. Zou, T. Ba, J. Zhang and C.-j. Liu, J. CO2 Util., 2021, 51, 101647 CrossRef CAS
.
- A. H. Fakeeha, A. S. Al-Fatesh, B. Chowdhury, A. A. Ibrahim, W. U. Khan, S. Hassan, K. Sasudeen and A. E. Abasaeed, Chin. J. Chem. Eng., 2018, 26, 1904–1911 CrossRef CAS
.
- Y. Han, Y. Quan, J. Zhao and J. Ren, Int. J. Hydrogen Energy, 2020, 45, 29917–29928 CrossRef CAS
.
- J. Wang, N. Yao, B. Liu, J. Cen and X. Li, Chem. Eng. J., 2017, 322, 339–345 CrossRef CAS
.
- Y. S. Mok, H. C. Kang, H. J. Lee, D. J. Koh and D. N. Shin, Plasma Chem. Plasma Process., 2010, 30, 437–447 CrossRef CAS
.
- A. Muñoz-Murillo, L. M. Martínez T, M. I. Domínguez, J. A. Odriozola and M. A. Centeno, Appl. Catal., B, 2018, 236, 420–427 CrossRef
.
- X. Lin, L. Lin, K. Huang, X. Chen, W. Dai and X. Fu, Appl. Catal., B, 2015, 168–169, 416–422 CrossRef CAS
.
- J. Barrientos, M. Lualdi, R. Suárez París, V. Montes, M. Boutonnet and S. Järås, Appl. Catal., A, 2015, 502, 276–286 CrossRef CAS
.
- X. Yan, Y. Liu, B. Zhao, Z. Wang, Y. Wang and C.-j. Liu, Int. J. Hydrogen Energy, 2013, 38, 2283–2291 CrossRef CAS
.
- H. Wang, K. Xu, X. Yao, D. Ye, Y. Pei, H. Hu, M. Qiao, Z. H. Li, X. Zhang and B. Zong, ACS Catal., 2018, 8, 1207–1211 CrossRef CAS
.
- B. Zhao, Z. Chen, Y. Chen and X. Ma, Int. J. Hydrogen Energy, 2017, 42, 27073–27083 CrossRef CAS
.
- P. Li, M. Zhu, J. Dan, L. Kang, L. Lai, X. Cai, J. Zhang, F. Yu, Z. Tian and B. Dai, Chem. Eng. J., 2017, 326, 774–780 CrossRef CAS
.
- Z. Qin, H. Ban, X. Wang, Z. Wang, Y. Niu, Y. Yao, J. Ren, L. Chang, M. Miao, K. Xie and C. Li, Catal. Lett., 2021, 151, 2647–2657 CrossRef CAS
.
- Q. Liu, Z. Zhong, F. Gu, X. Wang, X. Lu, H. Li, G. Xu and F. Su, J. Catal., 2016, 337, 221–232 CrossRef CAS
.
- Q. Liu, F. Gu, J. Gao, H. Li, G. Xu and F. Su, J. Energy Chem., 2014, 23, 761–770 CrossRef
.
- M. Tao, X. Meng, Y. Lv, Z. Bian and Z. Xin, Fuel, 2016, 165, 289–297 CrossRef CAS
.
- B. Zhao, P. Liu, S. Li, H. Shi, X. Jia, Q. Wang, F. Yang, Z. Song, C. Guo, J. Hu, Z. Chen, X. Yan and X. Ma, Appl. Catal., B, 2020, 278, 119307 CrossRef CAS
.
- V. M. Shinde and G. Madras, AIChE J., 2014, 60, 1027–1035 CrossRef CAS
.
- H. Chen, Y. Mu, S. Xu, S. Xu, C. Hardacre and X. Fan, Chin. J. Chem. Eng., 2021, 28, 2010–2021 CrossRef
.
- L. Di, J. Zhang, X. Zhang, H. Wang, H. Li, Y. Li and D. Bu, J. Phys. D: Appl. Phys., 2021, 54, 333001 CrossRef CAS
.
- Z. Wang, Y. Zhang, E. C. Neyts, X. Cao, X. Zhang, B. W. L. Jang and C.-j. Liu, ACS Catal., 2018, 8, 2093–2110 CrossRef CAS
.
- X. Jia, N. Rui, X. Zhang, X. Hu and C.-j. Liu, Catal. Today, 2019, 334, 215–222 CrossRef CAS
.
- X. Yan, Y. Liu, B. Zhao, Y. Wang and C. J. Liu, Phys. Chem. Chem. Phys., 2013, 15, 12132–12138 RSC
.
- L. Bian, L. Zhang, Z. Zhu and Z. Li, Mol. Catal., 2018, 446, 131–139 CrossRef CAS
.
- S. Tada, R. Kikuchi, K. Wada, K. Osada, K. Akiyama, S. Satokawa and Y. Kawashima, J. Power Sources, 2014, 264, 59–66 CrossRef CAS
.
- K. Urasaki, Y. Tanpo, Y. Nagashima, R. Kikuchi and S. Satokawa, Appl. Catal., A, 2013, 452, 174–178 CrossRef CAS
.
- S. Yin, L. Zhu, Y. Liu, X. Wang, Y. Liu and S. Wang, Chem. Res. Chin. Univ., 2018, 34, 296–301 CrossRef CAS
.
- R. Zhou, N. Rui, Z. Fan and C.-j. Liu, Int. J. Hydrogen Energy, 2016, 41, 22017–22025 CrossRef CAS
.
- R. Zhou, X. Cao, X. Jia, J. Wang and C.-j. Liu, Chem. Eng. Sci., 2019, 194, 22–28 CrossRef CAS
.
- X. Guo, Y. Sun, Y. Yu, X. Zhu and C.-j. Liu, Catal. Commun., 2012, 19, 61–65 CrossRef CAS
.
- X. Yan, B. Zhao, Y. Liu and Y. Li, Catal. Today, 2015, 256, 29–40 CrossRef CAS
.
- X. Zhang, N. Rui, X. Jia, X. Hu and C.-j. Liu, Chin. J. Catal., 2019, 40, 495–503 CrossRef CAS
.
- N. Rui, X. Zhang, F. Zhang, Z. Liu, X. Cao, Z. Xie, R. Zou, S. D. Senanayake, Y. Yang, J. A. Rodriguez and C.-J. Liu, Appl. Catal., B, 2021, 282, 119581 CrossRef CAS
.
Footnote |
| † Electronic supplementary information (ESI) available. See DOI: 10.1039/d1ra08021k |
| This journal is © The Royal Society of Chemistry 2022 |


