
 Open Access Article
 This Open Access Article is licensed under a Creative Commons Attribution-Non Commercial 3.0 Unported Licence
L-Cysteine modified metal–organic framework as a chiral stationary phase for enantioseparation by capillary electrochromatography†
Gao Lidia,
Hu Xingfanga,
Qin Shili *a,
Chu Hongtaoa,
Zhao Xuana and
Wang Bingbingb
*a,
Chu Hongtaoa,
Zhao Xuana and
Wang Bingbingb
aCollege of Chemistry and Chemical Engineering, Qiqihar University, Qiqihar, Heilongjiang 161006, China. E-mail: qinshili1103@163.com; Tel: +86 0452 2738214
bCollege of Food and Bioengineering, Qiqihar University, Qiqihar 161006, China
First published on 21st February 2022
Abstract
A new kind of chiral zirconium based metal–organic framework, L-Cys-PCN-222, was synthesized using L-cysteine (L-Cys) as a chiral modifier by a solvent-assisted ligand incorporation approach and utilized as the chiral stationary phase in the capillary electrochromatography system. L-Cys-PCN-222 was characterized by X-ray diffraction, thermogravimetric analysis, X-ray photoelectron spectroscopy, Fourier-transform infrared spectra, nitrogen adsorption/desorption, circular dichroism spectrum, zeta-potential and so on. The results revealed that L-Cys-PCN-222 had the advantages of good crystallinity, high specific surface area (1818 m2 g−1), thermal stability and chiral recognition performance. Meanwhile, the L-Cys-PCN-222-bonded open-tubular column was prepared using L-Cys-PCN-222 particles as the solid phase by ‘thiol–ene’ click chemistry reaction and characterized by scanning electron microscopy, which proved the successful bonding of L-Cys-PCN-222 to the column inner wall. Finally, the stability, reproducibility and chiral separation performance of the L-Cys-PCN-222-bonded OT column were measured. Relative standard deviations (RSD) of the column efficiencies for run-to-run, day-to-day, column-to-column and runs were 1.39–6.62%, and did not obviously change after 200 runs. The enantiomeric separation of 17 kinds of chiral compounds including acidic, neutral and basic amino acids, imidazolinone and aryloxyphenoxypropionic pesticides, and fluoroquinolones were achieved in the L-Cys-PCN-222-bonded OT column. These results demonstrated that the chiral separation system of the chiral metal–organic frameworks (CMOFs) coupled with capillary electrochromatography has good application prospects.
Introduction
Chirality is a common phenomenon in nature.1–3 The separation of enantiomers is crucial and challenging in the field of separation science because the pharmacological and biological interactions of enantiomers are completely different and most enantiomers have only one with chemical and/or biological activity, while the other is either without or with limited activity of the desired enantiomers.4–6 In some countries, the production of the desired enantiomer is a legal issue, when conversion from the racemate to the desired enantiomers is feasible, industrial production capacity can be increased but the unwanted enantiomer is considered as an impurity which is equivalent to “enantiomer ballast” gradually accumulating and causing pollution to the environment.7As we know, amino acids are important components of peptides and proteins in living organisms. Most of them exist as L-type molecules, while D-type molecules are not easily metabolized. When the human body consumes excessive amounts of D-amino acids, they will not only cause inadequate nutrition, but may also be life-threatening, causing illnesses such as Alzheimer's disease, schizophrenia, etc.8–10 In the agricultural field, chiral pesticides are about 30% of the pesticides currently in use.11 Because of their lower cost and more complex composition, their development and production usually does not go through strict routine testing.12 With the increasing use of pesticide racemates, more harmful chemicals have been introduced into the ecological environment, resulting in various environmental problems.13 In the pharmaceutical field, nearly half of clinical drugs are chiral and only about 25% are administered as pure enantiomers.14 One of the isomers of some racemic drugs may have no pharmacological effect or may even have toxic side effects, for example “thalidomide”.15 It can be seen that the chiral problem is not only a chemical problem, but also a scientific problem closely relating to research fields such as biology, agronomy, pharmacy and medicine. Therefore, it is of great significance to establish a simple, efficient and universal chiral separation and analysis method for the development of pure chiral compounds and the quality control of their production processes.
The most effective methods for enantioseparation are chromatography, including gas chromatography (GC),16 high performance liquid chromatography (HPLC),17 supercritical fluid chromatography (SFC),18 capillary electrophoresis (CE),19 capillary electrochromatography (CEC),20 etc. Among them, CEC is a powerful separation technique that combines the high selectivity of HPLC and the high separation efficiency of CE.
The core of CEC technology is a chromatographic column including three types of packed column, a monolithic column and an open-tube (OT) column. Among them, the OT column is becoming an attractive and growing mode due to its inherent advantages of easy preparation, high efficiency, no plug effect, no Joule heating effect and no bubble effect as well as no need to precisely optimize the mixing ratio of polymer and porogen, and so on.21–23 Nevertheless, the OT column has the disadvantages of a relatively low column capacity and phase ratio.24 Therefore, the discovery of novel stationary phase materials with a large specific surface area and porous modifiability, such as chiral metal–organic frameworks (CMOFs), is one of the current research hotspots to overcome these limitations.25–27
In recent years, CMOFs have been explored for chiral separation by electrochromatography although their number is few. Ye28 synthesized homochiral MOF ([Zn2(D-Cam)2(4,4′-bpy)]n) as the chiral stationary phase (CSP) for CEC and carried out enantioseparation of phenylalanine and tyrosine, the results showed that the CSP had low resolution and selectivity for the analytes. Ding29 fabricated a pepsin-immobilized ZIF-8-poly(GMA-co-EDMA) monolithic column via layer-by-layer self-assembly and although six chiral basic drugs were successfully separated within 15 min, the preparation process of the capillary column was complicated, the migration time of the analytes was long, and all the baseline separations were not obtained for half the chiral drugs. The other Zn-based CMOFs30–32 were also applied for the separation of chiral drugs by CEC, they all showed excellent chiral selectivity, but they had deficiencies with a narrower application range. In addition, a great deal of effort has been made to explore CMOF [In3O(obb)3(HCO2)(H2O)] as CSP and successfully separate chiral alcohols and chiral drugs by the Xie group.33,34 However, it was found that the preparation of CMOF was very cumbersome and time-consuming up to 5 days. Therefore, the design and preparation of CMOFs with multi-function, high efficiency and universality in a relatively short time is challenging and promising for enantioseparation. Zr-based MOFs are readily accommodated as the chromatographic solid phase due to their high chemical and thermal stability, high surface area and low toxicity.35,36 So far, there have been few reports about chiral Zr-based MOFs as a chromatographic solid phase,37 and this work is the first to design and prepare chiral Zr-based MOFs for enantioseparation by OT-CEC.
Herein, a homogeneous CMOFs, L-Cys-PCN-222, was prepared with PCN-222 as the framework and L-cysteine (L-Cys) as a chiral modified ligand by solvent-assisted ligand incorporation (SALI). The bonded OT column was obtained with L-Cys-PCN-222 as CSP by the ‘thiol–ene’ click chemistry reaction, and it was applied for enantioseparation of natural amino acids (acidic, neutral and basic), pesticides (imidazolinone and aryloxyphenoxypropionic) and drugs (fluoroquinolones).
Experimental section
Chemicals and materials
Tetra(4-carboxyphenyl) porphine (TCPP) was purchased from Shanghai Tengqian Biological Technology Co. Ltd, zirconium oxychloride octahydrate (ZrOCl2·8H2O), trifluoroacetic acid (TFA) and benzoic acid (BA) were obtained from Aladdin Industrial Co. (Shanghai, China), 3-(methacryloyloxy) propyl trimethoxy silane (γ-MPS) and azobisisobutyronitrile (AIBN) were purchased from Acros Chemical Co. (NJ, USA), and amino acid racemates (purity > 98%) and L-type amino acids were from Sinopharm Chemical Reagent Co. Ltd (Shanghai, China). Chiral drugs and pesticides were obtained from the Pharmaceutical Products Development Institute (Beijing, China) and Wuhan Senditai Technology Co. Ltd (Wuhan, China), respectively. The fused-silica capillary tube (75 μm i.d. and 375 μm o.d.) was purchased from Yongnian Optical Fiber Factory (Hebei, China). All reagents were of analytical grade except chromatographic grade reagents used in the CEC system.Instruments
All the CEC experiments were performed on an Agilent 7100 CE system (Agilent Technologies, Waldbronn, Germany) equipped with a diode array detector. A scanning electron microscope (SEM) equipped with energy-dispersive X-ray spectrum (EDS) (S-4300 Hitachi, Japan) was used to observe the surface morphology and determine the element distribution of PCN-222 and L-Cys-PCN-222-bonded OT column prepared. X-ray photoelectron spectroscopy (XPS) (ESCALAB 250 Xi, USA) was used to detect the chemical composition and evaluate the chemical bonding states. Fourier-transform infrared (FT-IR) spectra were measured with SpectrumOne FT-IR spectrometer (PE Co, USA). The crystal structure and phase purity of synthetic materials were characterized by X-ray diffraction (XRD, D8 Bruker AXS, Germany). Nitrogen adsorption/desorption (Brunauer–Emmett–Teller [BET]) analysis was carried out at 77 K with a surface area and porosity analyzer (Conta, USA). Thermogravimetric analysis (TGA) was carried out under a nitrogen atmosphere at a heating rate of 10 °C min−1 from room temperature to 1000 °C (TA Instruments, USA). Circular dichroism spectrum (CD) was recorded on the J-800 Spectral Polarimeter (Jasco, Japan). Zeta-potential (zeta) was measured in the aqueous dispersion of the solid particles using a zeta sizer instrument (Nano ZS 90, Malvern, UK).Synthesis of L-Cys-PCN-222
PCN-222 was synthesized based on the previous report.38 L-Cys-PCN-222 synthesis proceeded as follows: 45 mg (0.0188 mmol) PCN-222 was loaded into a 10 mL vial and mixed with the amount of L-Cys dissolved in 3.0 mL N,N-dimethyl formamide (DMF). The reaction flask was heated in a water bath for 24 h after sealing. The supernatant of the reaction mixture was decanted, and the residuals were in sequence washed with H2O, DMF and acetone three times in order to remove the unreacted substances, then collected by centrifugation (4000 rpm × 5 min) and dried in a 60 °C vacuum oven overnight. The final product of L-Cys-PCN-222 was obtained and the synthetic scheme is shown in Fig. 1. | ||
| Fig. 1 The synthetic scheme of L-Cys-PCN-222 by SALI. | ||
Preparation of the L-Cys-PCN-222-bonded OT column
The L-Cys-PCN-222-bonded OT column was prepared by a ‘thiol–ene’ click reaction involving three steps. The first step was that the bare capillary was pretreated.39 Secondly, the pretreated capillary was rinsed with γ-MPS acetone solution (v/v = 1/2) for 30 min, sealed at both ends and treated in a water bath for 24 h at 40 °C. The inner wall of the capillary was modified by a layer of γ-MPS with free C![[double bond, length as m-dash]](https://www.rsc.org/images/entities/char_e001.gif) C groups by a dehydration–condensation reaction, then rinsed with methanol for 15 min to flush out the residuals, and dried by a nitrogen stream. Finally, 15 mg L-Cys-PCN-222, 2 mg AIBN and 1 mL DMF were mixed and sonicated for 10 min, and the resulting mixture was poured into the modified capillary, incubated in a 60 °C water bath for 24 h after both ends of the capillary were sealed with rubber. A L-Cys-PCN-222-bonded OT column was obtained (Fig. 2), the residues were rinsed with methanol for 15 min, and further dried with N2 for subsequent use.
C groups by a dehydration–condensation reaction, then rinsed with methanol for 15 min to flush out the residuals, and dried by a nitrogen stream. Finally, 15 mg L-Cys-PCN-222, 2 mg AIBN and 1 mL DMF were mixed and sonicated for 10 min, and the resulting mixture was poured into the modified capillary, incubated in a 60 °C water bath for 24 h after both ends of the capillary were sealed with rubber. A L-Cys-PCN-222-bonded OT column was obtained (Fig. 2), the residues were rinsed with methanol for 15 min, and further dried with N2 for subsequent use.
 | ||
| Fig. 2 The preparation scheme of the L-Cys-PCN-222-bonded OT column. | ||
Electrochromatographic conditions
The L-Cys-PCN-222-bonded OT column (40 cm total length, 26.5 cm effective length) was installed on the CE instrument. It was rinsed with ultrapure water and 20 mmol L−1 phosphate buffer (pH = 3.0–10.0) for 5 min before use, respectively. The sample was injected into the L-Cys-PCN-222-bonded OT column by 50 mbar × 3 s, and separated immediately by applying an operating voltage of 15 kV at 20 °C. The electroosmotic flow marker used was 5.0 mg mL−1 thiourea. The sample solutions (5.0 mg mL−1) were prepared by first dissolving 25.0 mg of each analyte in a small volume of methanol, and then diluting to 5.0 mL with ultrawater. All solutions and phosphate buffer including the test sample were filtered through a 0.45 μm pore size polyethersulfone membrane, and the detection was set at the specific wavelength of each analyte.Results and discussion
Influence factors of L-Cys-PCN-222 synthesis
To best separate chiral compounds, it is significantly important to obtain the largest bonding amount of L-Cys under the condition of maintaining the crystallinity of PCN-222 in L-Cys-PCN-222. The single factor analysis method was used to investigate the influence of the reaction temperature (50 °C, 60 °C, 70 °C, and 80 °C) and the molar ratio of PCN-222 to L-Cys (1![[thin space (1/6-em)]](https://www.rsc.org/images/entities/char_2009.gif) :1, 1:5, 1:10, and 1:15) on L-Cys-PCN-222.
:1, 1:5, 1:10, and 1:15) on L-Cys-PCN-222.
As shown in Fig. S1,† the diffraction peak intensity of L-Cys-PCN-222 synthesized under different temperatures was first enhanced then weakened with the increase of reaction temperature, and L-Cys-PCN-222 obtained the highest purity phase when the reaction temperature was 60 °C. So 60 °C was collected as the optimal reaction temperature. As the molar ratio of PCN-222 to L-Cys increased, the binding ratio of each Zr6 cluster to the L-Cys ligand also increased, and the binding ratio was unchanged from 1:10 to 1:15, indicating that 1:10 was the best molar ratio for the synthesis of L-Cys-PCN-222 (Table S1†).
Characterization of L-Cys-PCN-222
The chemical composition of L-Cys-PCN-222 prepared was investigated by the FT-IR spectra (Fig. 3). The broad band at 3400 cm−1 could be assigned to the stretching vibrations of N–H and O–H of L-Cys and PCN-222. C–H vibration bands related to benzene were detected at 2837–2965 cm−1; the symmetrical and asymmetrical stretching vibration of the carboxylate groups were observed at 1602 cm−1 and 1415 cm−1, respectively. Also, the bands at 857 cm−1 and 775 cm−1 in the finger region could be allocated to the aromatic skeleton vibration of benzene ring in TCPP; the presence of FT-IR bands at 477 cm−1 and 2552 cm−1 indicated the introduction of Zr–O and S–H in L-Cys-PCN-222 after the reaction. The hydrogen-bonded OH⋯NH2 vibrations at 3180 cm−1 in the L-Cys spectrum were absent40 in the case of L-Cys-PCN-222. | ||
| Fig. 3 The FT-IR spectra of PCN-222, L-Cys-PCN-222 and L-Cys. | ||
The morphology and structure of the L-Cys-PCN-222 architectures were studied using SEM. Fig. 4 shows typical images of L-Cys-PCN-222 by heating a solution of PCN-222 and L-Cys (the molar ratio of PCN-222 to L-Cys = 1:10) in DMF at 60 °C for 24 h. Particles like ellipsoids with lengths of 500–800 nm and widths of about 200 nm were obtained (Fig. 4b). The particles of L-Cys-PCN-222 prepared through SALI had a similar size and shape to PCN-222 except that their surface became rough (Fig. 4a and b), which may be due to the introduction of L-Cys into the coordination of the Zr–OH in PCN-222. In addition, the chemical composition of L-Cys-PCN-222 was determined by the element mapping spectrum of EDS, which indicated that there were Zr and S elements with uniform distribution in L-Cys-PCN-222 (Fig. 4c and d). The results further clarified that L-Cys was successfully connected to PCN-222.
 | ||
| Fig. 4 SEM images of (a) PCN-222 and (b) L-Cys-PCN-222, and EDS patterns of (c) Zr and (d) S elements in L-Cys-PCN-222, respectively. | ||
The crystal structure and phase purity of L-Cys-PCN-222 were also characterized by XRD, as shown in Fig. 5. The main diffraction peaks (2θ = 2.4°, 4.8°, 6.6°, 7.1°, 8.2°, 9.7° and 9.9°) were sharp in the XRD pattern of L-Cys-PCN-222 indicating its high crystallinity. Meanwhile, all of the diffraction peaks were identical to those of the reported PCN-222 and the simulated PCN-222.41,42 The particular connection pattern of L-Cys resulted in the reduction of the diffraction peak along the [1 0 0] direction, but did not alter its peak shape, indicating that the introduction of L-Cys did not lead to an obvious phase transformation. The results from the XRD patterns also indicated that the obtained L-Cys-PCN-222 was a pure phase since no impurity peaks were detected.
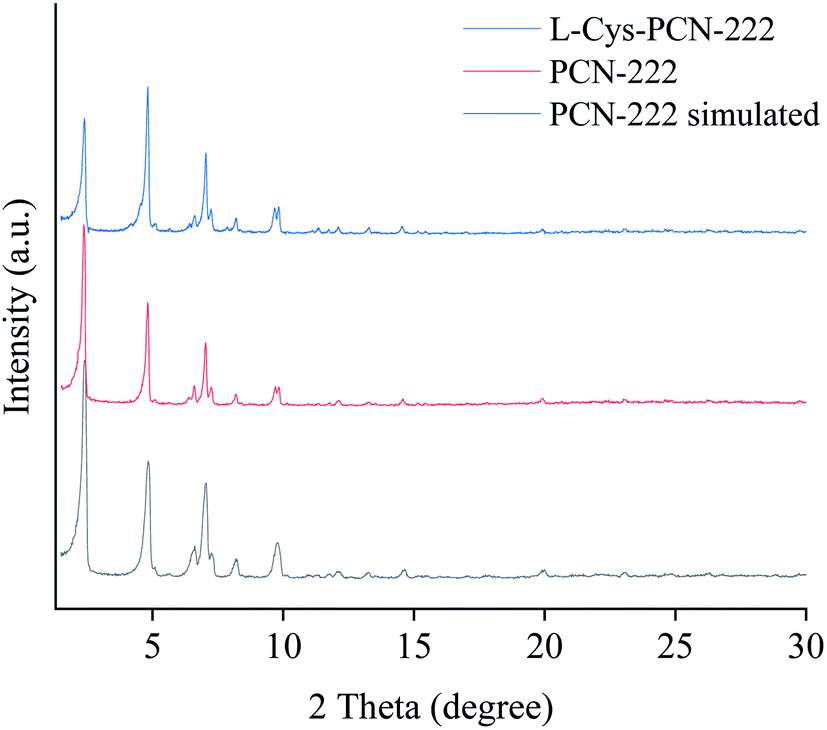 | ||
| Fig. 5 X-ray diffractions of L-Cys-PCN-222, PCN-222 and PCN-222 simulated. | ||
The XPS from 100 to 1300 eV depicted a characteristic binding energy signature of PCN-222 containing Zr 3d, C 1s, N 1s, and O 1s (Fig. 6a). While L-Cys-PCN-222 added a new binding energy characteristic of S 2p (Fig. 6b), which could be attributed to the binding energies of 162.58 eV and 167.78 eV corresponding to the –SH group in L-Cys-PCN-222 (Fig. 6b inset). These results indicated the successful introduction of L-Cys into PCN-222 structure and further verified the conclusions from FT-IR and EDS. The molar ratio of S and Zr6 could be calculated from the data in Table S1.† The approximate 3.8 L-Cys ligands per Zr6 cluster were incorporated in L-Cys-PCN-222, it was slightly lower than the theoretical maximum possible incorporation ratio of four ligands per Zr6 cluster owing to steric hindrance.43,44
 | ||
| Fig. 6 XPS spectra of (a) PCN-222 and (b) L-Cys-PCN-222. Inset: enlargement of the areas from 174 eV to 158 eV. | ||
Nitrogen adsorption–desorption curves at 77 K and the pore size distribution of PCN-222 and L-Cys-PCN-222 were shown in Fig. 7. The surface areas of PCN-222 and L-Cys-PCN-222 were 2304 m2 g−1 and 1818 m2 g−1, respectively. A typical type-IV isotherm for L-Cys-PCN-222 was observed, which was indicative for the materials with a mesopore structure.45,46 The density functional theory (DFT) pore size distribution analysis of PCN-222 and L-Cys-PCN-222 showed that the pore volume of the hexagonal channels dropped from 0.46 cm3 g−1 to 0.35 cm3 g−1, and the two main pore sizes decreased from 1.4 and 3.2 nm to 1.0 and 2.3 nm, respectively (Fig. 7, inset), which confirmed that the modification process of L-Cys took place inside the PCN-222 pores.
 | ||
| Fig. 7 Nitrogen sorption isotherms measured at 77 K. Inset: differential pore size plots of PCN-222 and L-Cys-PCN-222; Ads = adsorption and Des = desorption. | ||
TGA measurement was carried out to evaluate the thermal stability and mass ratios of different components. As shown in Fig. 8, when the temperature was lower than 50 °C, water from the surface of the grains was detached with 1.1% weight loss.47 In the range of 50–150 °C, water from the interior of the pores was removed, also being called “loosely bound MOF” water, with a weight loss ratio of 5.3%.47 Excluding the above lost weight described, the rest was the actual weight of L-Cys-PCN-222. Afterwards, the weight loss at 150–450 °C mainly corresponded to the coordinated water of L-Cys-PCN-222 and the carboxyl and phenyl groups in the TCPP ligands.38,48,49 Decomposition of the porphyrin ring was attributed to the loss beyond 430 °C, leaving behind ZrO2.38 Compared with the TGA curve of PCN-222, the weight loss difference from 200 °C to 430 °C might be assigned to the decomposition of L-Cys existing in L-Cys-PCN-222,50 and the weight loss ratio of L-Cys was 16%. After deducting the non-coordinating water and L-Cys, the remaining weight was 76% of PCN-222. It was found that the molar ratio of the Zr6 clusters to L-Cys in L-Cys-PCN-222 was approximately 1:4, which matched the results from the XPS analysis. Moreover, TGA data showed that L-Cys-PCN-222 possessed a relatively lower thermal stability than PCN-222, which mainly depended on the weak stability of the incorporated L-Cys ligand.44
 | ||
| Fig. 8 The TGA curves of PCN-222 and L-Cys-PCN-222. | ||
In order to verify the optical activity of L-Cys-PCN-222, it was characterized by CD (Fig. 9). L-Cys-PCN-222 had a positive Cotton effect at 230 nm and 300 nm, where the optical activity of L-Cys was retained and red-shifted at 230 nm. The transition band at 300 nm may be attributable to the coordination of Zr and S which resulted in the charge–transfer transition of σS → Zr 3d. In summary, it was shown that L-Cys-PCN-222 formed a single rotation structure, exhibiting obvious optical rotation.
 | ||
| Fig. 9 CD spectrum of L-Cys and L-Cys-PCN-222. | ||
Zeta potential could characterize the charge on the surface of the material, which was very important for the analysis of the enantioseparation mechanism. From Fig. 10, the pH point of zero charge (PZC) of L-Cys-PCN-222 was about pH = 5.0 which was consistent with the isoelectric point of L-Cys where the positive and negative charges on the surface of L-Cys-PCN-222 were equal, showing overall electrical neutrality. When the pH was less than 5.0, the –NH of the porphyrin ring in the TCPP center and –NH2 of –Cys bound with the H+ to form –NH2+ and –NH3+, which made L-Cys-PCN-222 positively charged. When the pH was more than 5.0, H+ was electrolyzed mainly through –NH2+ and –NH3+, and a small amount of Zr–OH on the surface of L-Cys-PCN-222 was dissociated into Zr–O−, resulting in L-Cys-PCN-222 being negatively charged. Most CMOFs show only one kind of charge, which limits the type of CEC separation. Therefore, L-Cys-PCN-222 was more suitable as CSP for separation of the chiral compounds with different charges in the electrical properties.
 | ||
| Fig. 10 Zeta potential curves of PCN-222 and L-Cys-PCN-222. | ||
Characterization of the L-Cys-PCN-222-bonded OT column
 | ||
| Fig. 11 SEM images of the cross section of the L-Cys-PCN-222-bonded OT column; (a) the bare column (×1.0k); (b–d) L-Cys-PCN-222-bonded OT column (×1.0k, ×3.0k and ×20.0k). | ||
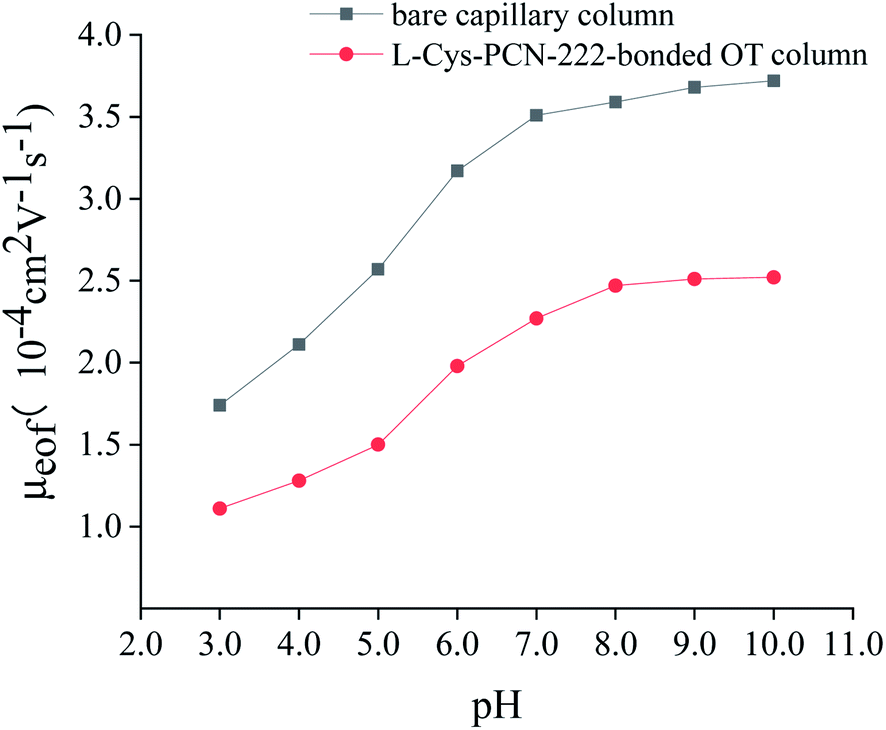 | ||
| Fig. 12 The effect of phosphate buffer pH on EOF. Experimental conditions: thiourea as the EOF marker; 20 mM of phosphate buffer (pH = 3.0–10.0); and detection wavelength, 200 nm. | ||
111 plates per m, exhibiting a satisfactory reproducibility. The lifetime of the L-Cys-PCN-222-bonded OT column depended on the durability of CSP. It was assessed by RSD for 200 consecutive injections. Migration time of thiourea changed slightly from the 1st operation to the 200th and the column efficiency showed no decrease significantly (RSD = 2.73%). These results indicated that the L-Cys-PCN-222-bonded OT column had high stability and a longer lifetime because L-Cys-PCN-222 was introduced to the inner wall of the capillary through chemical bonds.
| Types and numbers (n) | Average column efficiency (plates per m) | RSD (%) of column efficiency |
|---|---|---|
| a Experimental conditions: 20 mM of phosphate buffer (pH = 7.0); thiourea as the EOF marker; and detection wavelength, 200 nm. | ||
| Run-to-run (n = 5) | 40111 |
1.39 |
| Day-to-day (n = 5) | 41506 |
2.37 |
| Column-to-column (n = 5) | 42175 |
6.62 |
| Runs (n = 200) | 42892 |
2.73 |
Enantioseparation of the L-Cys-PCN-222-bonded OT column
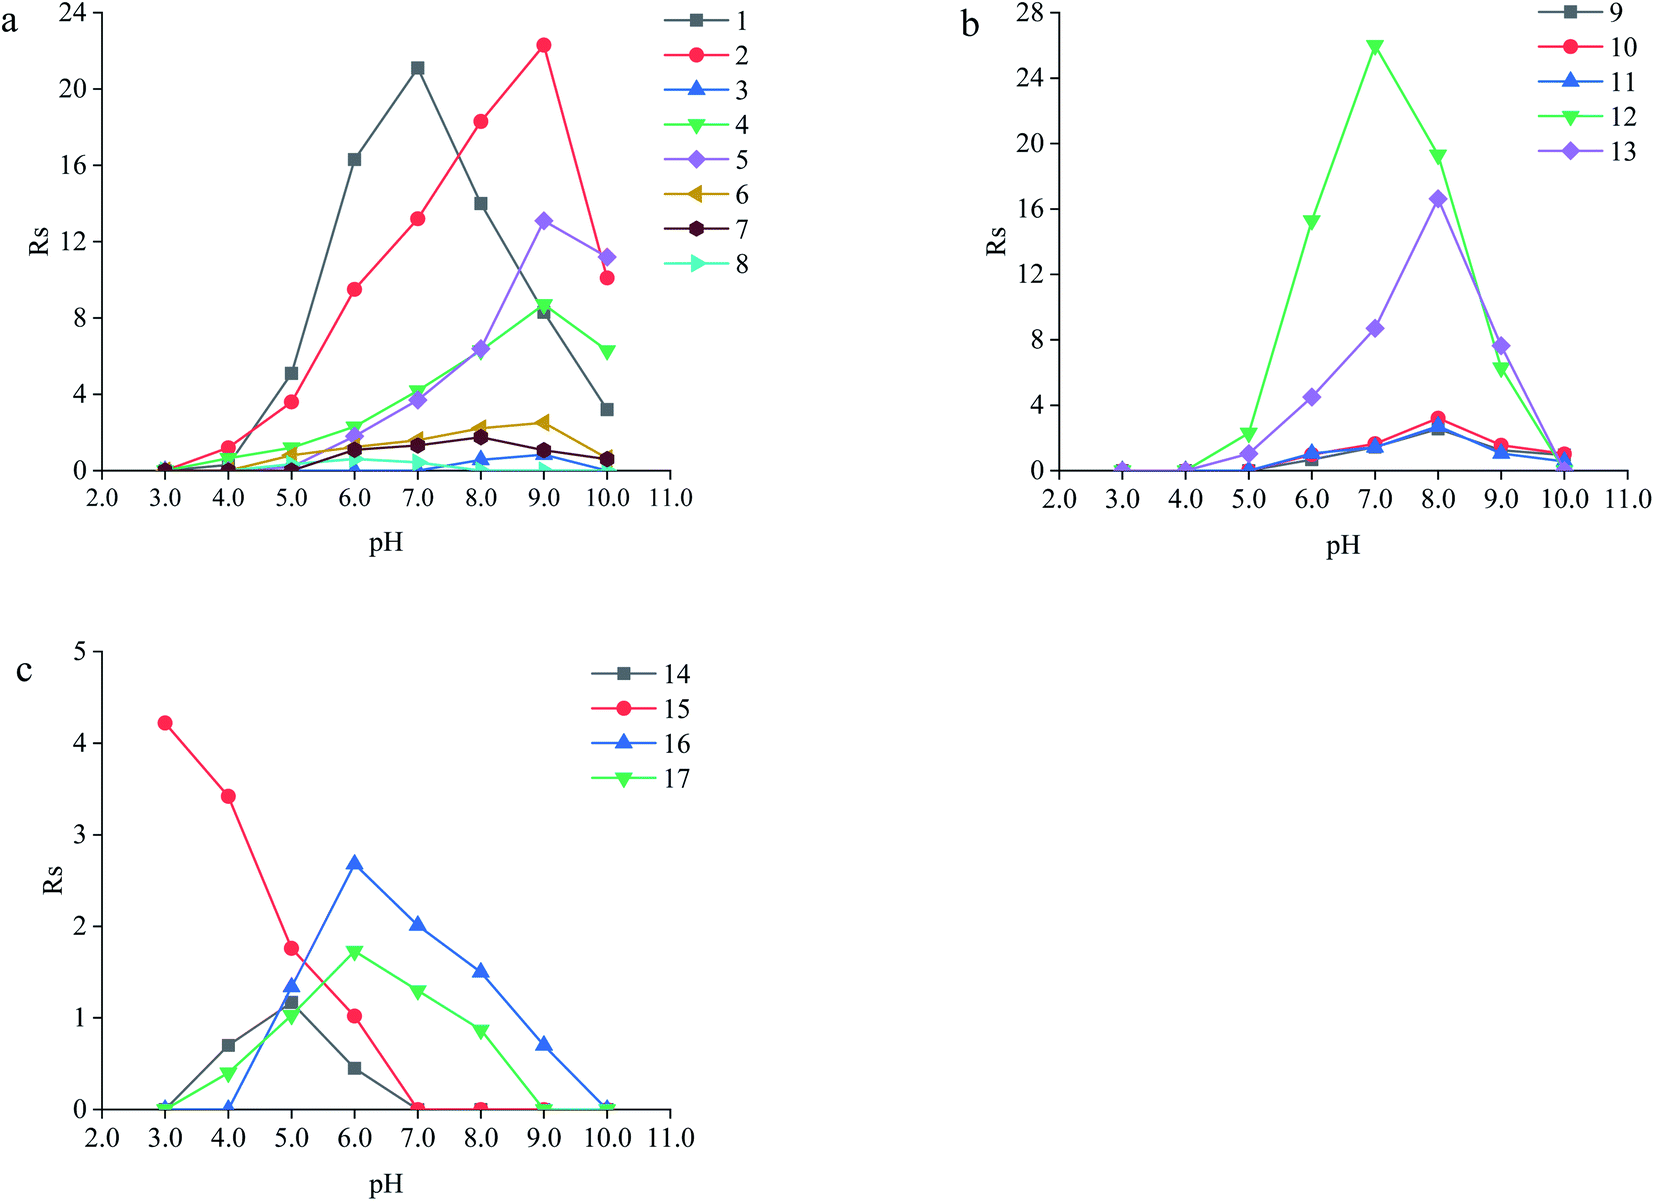 | ||
| Fig. 13 Effect of pH on the Rs of the analytes. (a) Amino acids: (1) serine, (2) threonine, (3) methionine, (4) aspartic acid, (5) glutamic acid, (6) lysine, (7) arginine and (8) histidine; (b) herbicide pesticides: (9) imazethapyr, (10) imazameth, (11) imazamox, (12) diclofop and (13) quizalofop-p-ethyl; (c) fluoroquinolone drugs: (14) lomefloxacin hydrochloride, (15) gatifloxacin, (16) flumequine and (17) ofloxacin. Experimental conditions: 20 mM of phosphate buffer (pH = 3.0–10.0); and detection wavelength, the specific wavelength of each analyte. | ||
| Types | Analytes | Structuresa | pI or pKa | Molecular volume (Å3) | Rs | αb | Optimum pH | |
|---|---|---|---|---|---|---|---|---|
| a Represents chiral carbon.b Represents selectivity factor (a) for chiral compounds studied on L-Cys-PCN-222-bonded OT column, a = t2/t1, t1 and t2 were the migration time of the less and more retained enantiomers, respectively. | ||||||||
| Amino acids | Neutral | Serine |  |
5.68 | 4.9 × 6.4 × 7.5 | 21.1 | 1.66 | 7.0 |
| Threonine |  |
5.6 | 5.3 × 6.0 × 7.6 | 22.3 | 2.45 | 9.0 | ||
| Methionine |  |
5.74 | 5.0 × 7.1 × 10.8 | 0.84 | 1.07 | 9.0 | ||
| Acidic | Aspartic acid |  |
2.85 | 5.1 × 6.9 × 8.9 | 8.71 | 2.80 | 9.0 | |
| Glutamic acid |  |
3.15 | 5.1 × 7.2 × 8.8 | 13.1 | 2.96 | 9.0 | ||
| Basic | Lysine |  |
9.6 | 5.2 × 7.1 × 10.2 | 2.51 | 1.42 | 9.0 | |
| Arginine |  |
10.76 | 5.7 × 7.5 × 10.3 | 1.75 | 1.38 | 8.0 | ||
| Histidine | 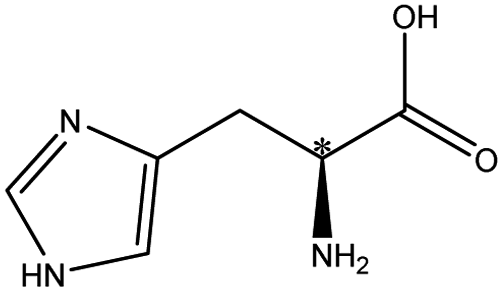 |
7.6 | 5.7 × 7.0 × 6.9 | 0.61 | 1.10 | 6.0 | ||
| Imidazolinones pesticides | Imazethapyr |  |
— | 6.8 × 8.3 × 14.4 | 2.56 | 1.51 | 8.0 | |
| Imazameth | 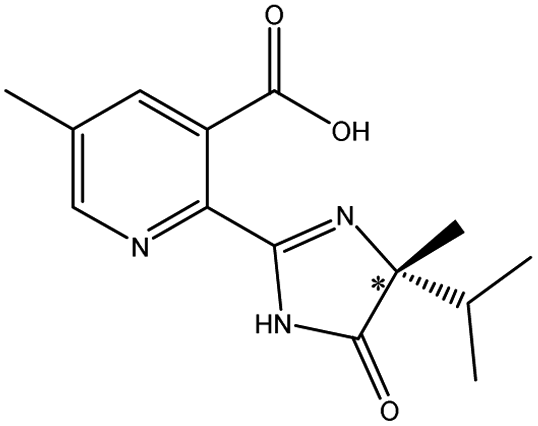 |
— | 6.8 × 8.3 × 13.1 | 3.21 | 1.96 | 8.0 | ||
| Imazamox |  |
3.3 | 6.8 × 8.3 × 15.2 | 2.72 | 2.27 | 8.0 | ||
| Aryloxyphenoxypropionic pesticides | Diclofop |  |
— | 6.9 × 9.0 × 4.7 | 26.0 | 3.25 | 7.0 | |
| Quizalofop-p-ethyl |  |
— | 6.4 × 7.3 × 16.6 | 16.6 | 2.71 | 8.0 | ||
| Fluoroquinolones | Lomefloxacin hydrochloride |  |
7.14 | 6.6 × 9.2 × 19.6 | 1.17 | 1.07 | 5.0 | |
| Gatifloxacin |  |
7.55 | 6.6 × 9.2 × 14.7 | 4.22 | 2.25 | 3.0 | ||
| Flumequine | 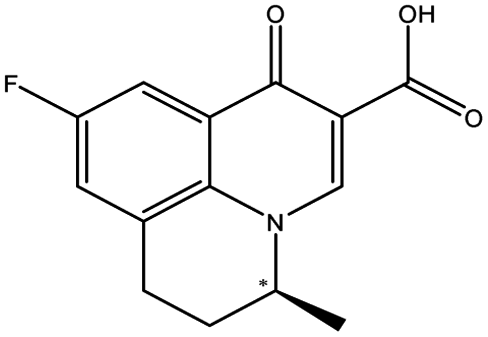 |
6.37 | 5.1 × 9.6 × 11.1 | 2.68 | 2.20 | 6.0 | ||
| Ofloxacin |  |
7.14 | 6.1 × 9.5 × 15.7 | 1.73 | 1.17 | 6.0 | ||
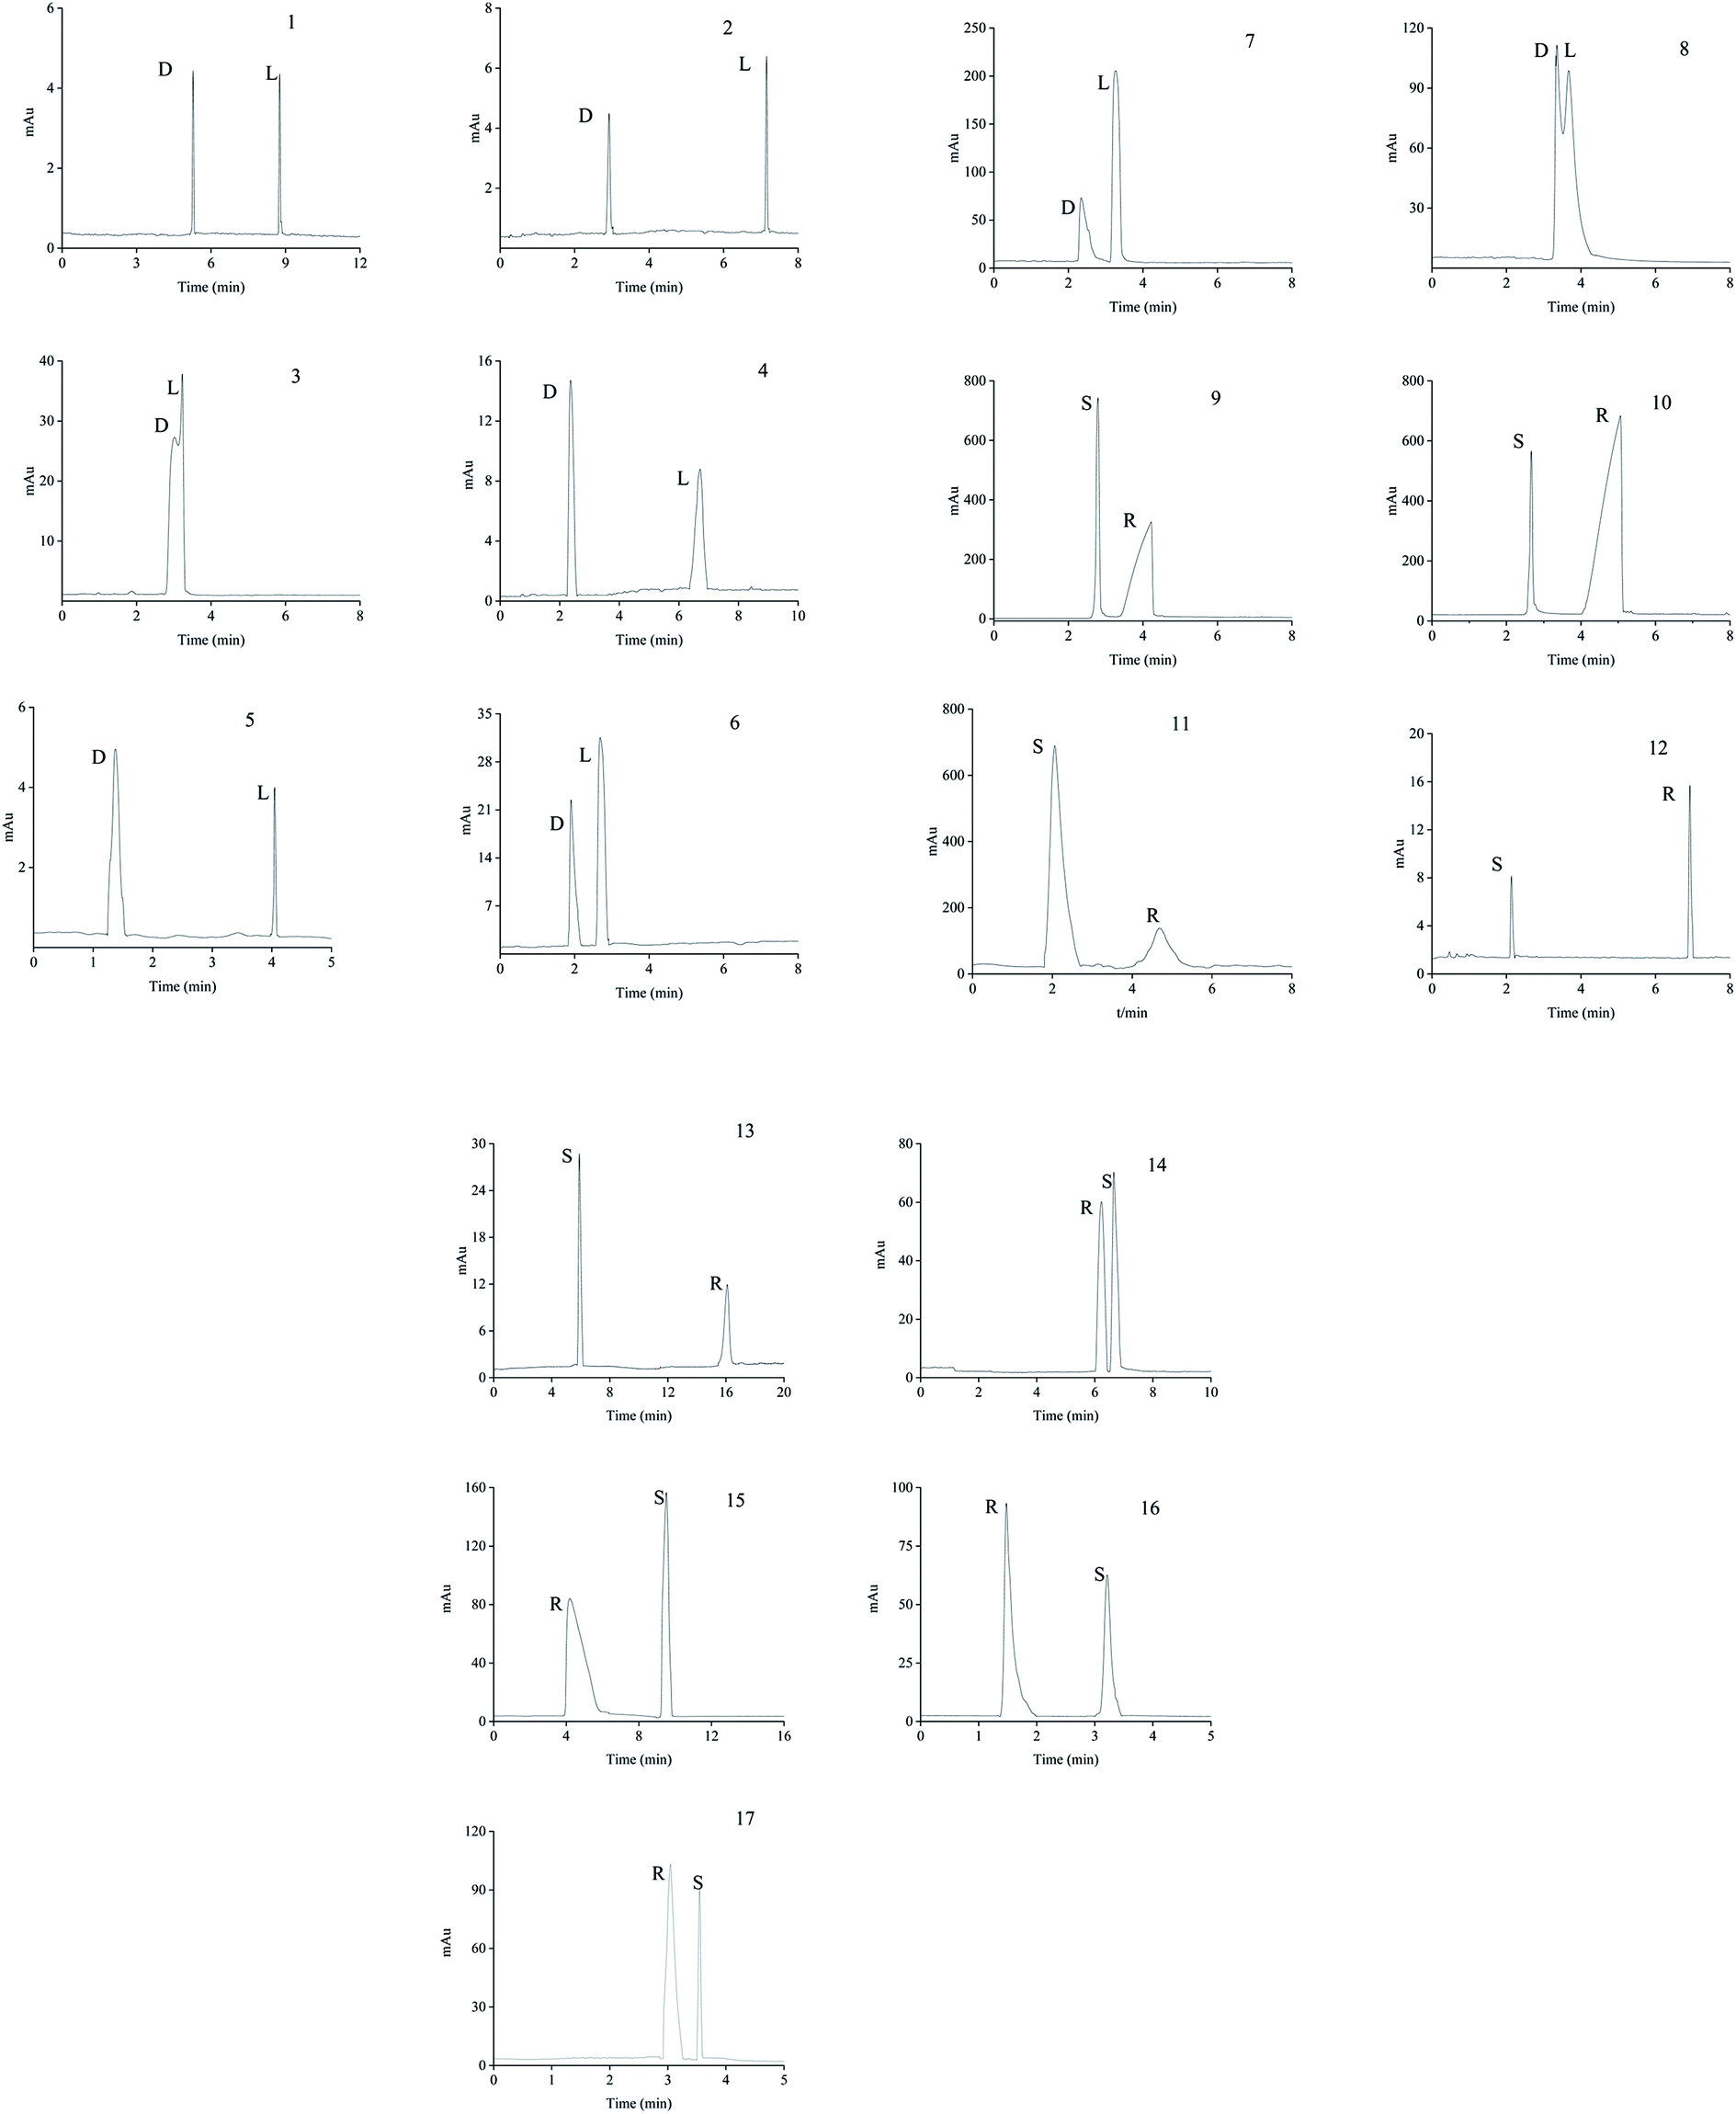 | ||
| Fig. 14 Typical enantioseparation chromatograms of the analytes. (1) serine, (2) threonine, (3) methionine, (4) aspartic acid, (5) glutamic acid, (6) lysine, (7) arginine, (8) histidine, (9) imazethapyr, (10) imazameth, (11) imazamox, (12) diclofop, (13) quizalofop-p-ethyl, (14) lomefloxacin hydrochloride, (15) gatifloxacin, (16) flumequine and (17) ofloxacin. Experimental conditions: 20 mM of phosphate buffer at the optimum pH value of each analyte; and detection wavelength, the specific wavelength of each analyte. | ||
The neutral amino acids (except for methionine) showed the highest resolution and the longest migration time among the three types of amino acids, which might be the result of the comprehensive function of many interaction forces. One was electrostatic repulsion between them and the negatively charged CSP because they were predominantly anionic at pH > pI. One was the various hydrogen bonds mainly formed by –OH and –NH2 of the amino acids molecules with the porphyrin linker.57,58 The last one was the molecular sieve effect of the solid phase due to the smallest molecular sizes of serine and threonine among the amino acids studied, which could be the most important interaction leading to their longest migration time.59 In comparison, although a weaker hydrogen bond existed between the –NH2 of methothionine and the porphyrin ring, the baseline separation was not reached because of the strong repulsive interaction of methothionine and L-Cys in the pores of CSP caused by their hydrophobicity. The acidic amino acids were negatively electric at the optimal pH = 9.0 and had electrostatic repulsion with negatively charged CSP. However, the two –COO− groups on the acidic amino acids competed with the –COO− groups on the porphyrin ligands to coordinate on the –OH on the Zr6 cluster. It was well known that the coordination force was larger than the electrostatic force, which was the reason why the acidic amino acids could achieve preeminent separation. The basic amino acids were positively electric and formed a weak electrostatic attraction with the negatively charged CSP on the surface of the column wall at pH < pI. Because of the larger molecular volume of arginine (5.7 Å × 7.5 Å × 10.3 Å) and lysine (5.2 Å × 7.1 Å × 10.2 Å) which caused greater electrostatic attraction near the chiral site in the pore (23 Å), their isomers were better separated. In contrast, the molecular size of histidine (5.7 Å × 7.0 Å × 6.9 Å) was too small to be enantioseparated although its imidazole group formed conjugated π bonds with the benzene ring and porphyrin ring on CSP.
The different substituents at the 5 position of the pyridine moiety of the imidazolinone herbicides determined the enantioseparation performance. Although the substituent was away from the chiral center and did not alter the spatial conformation, the substituent produced distinct differences in the retention and separation factors.60 The alkoxyl group of imazamox was an electron withdrawing group, which reduced the polarity of the pyridine ring, while the alkyl group of imazethapyr was opposed, these results showed that the alkoxyl group possibly increased the dipole–dipole interaction with CSP. The absolute value of the dihedral angle for the imazamox was greater than that for the imazethapyr,60 which indicated the greater distortion of the aromatic heterocycles outside the plane of the imidazolinone ring. It is therefore possible that one of the reasons for the higher separation factor of imazamox stems from its particular conformation. The steric hindrance effect in the structure of imazameth was small, which might make it easier for chiral carbon to enter the pore and interact with chiral sites, so that the resolution was the largest in imidazolinone herbicides. Aryloxyphenoxypropionic herbicides contained CO, a benzene ring and a chlorine atom, in which CO could form dipole–dipole interaction with CO of CSP, the benzene ring had π–π interaction with porphyrin ring of CSP, and CO could form hydrogen bonds with –NH and H atom of CSP. This also explained why CSP induced aryloxyphenoxypropionic herbicides had better enantiomeric separation to a certain extent.
Except for fluoromequine which belongs to an acidic compound, the other fluoroquinolones were amphoteric electrolytes containing both acidic (carboxylic) and basic (amino) functionalities61 (Table 2). At low pH < pI (pKa), the molecules of the fluoroquinolone drugs were positively charged, which could produce electrostatic interaction with CSP. It was noticeable that most of the other chromatographic columns failed to provide enantioseparation of lomefloxacin hydrochloride which may be due to the remoteness of the chiral center from the carboxylic acid group,62 the as-prepared L-Cys-PCN-222-bonded OT column, however, made it achieve outstanding separation (α = 1.07), which further verified that the CSP had superior chiral selectivity. Moreover, ofloxacin and flumequine have a fused tricyclic ring in their chemical structure,63 this kind of rigid structure involves a certain hindrance effect. Interactions such as hydrogen bonds between the fluorine atom in the molecule of the fluoroquinolones and CSP, π bonds between benzene rings etc., played an important role in the enantioselectivity and enantioseparation of the fluoroquinolones.
Conclusions
In summary, the chiral L-Cys-PCN-222-bonded OT column was successfully prepared and characterized for the first time. Enantioseparation of 17 kinds of chiral compounds was achieved including amino acids, imidazolinone and aryloxycarboxylic acid pesticides as well as fluoroquinolones by CEC. The L-Cys-PCN-222-bonded OT column showed better reproducibility and stability and had a higher column efficiency and longer lifetime, which indicated that the innovative Zr-based stationary phase was promising for enantioseparation in chromatographic separation fields.Conflicts of interest
There are no conflicts to declare.Acknowledgements
We gratefully acknowledge the support of Young Creative Program of the Fundamental Research Funds of Heilongjiang Provincial Education Department (No. 135509206) and the 2013 Annual Bilingual Education Project for the University Teachers of Heilongjiang Province.References
- S. Pizzarello and A. L. Weber, Science, 2004, 303, 1151 CrossRef CAS PubMed.
- M. X. Zhang, G. Y. Qing and T. L. Sun, Chem. Soc. Rev., 2012, 41, 1972–1984 RSC.
- M. M. Li, G. Y. Qing, M. X. Zhang and T. L. Sun, Sci. China: Chem., 2014, 57, 540–551 CrossRef CAS.
- G. F. Liu, D. Zhang and C. L. Feng, Angew. Chem., Int. Ed., 2014, 53, 7789–7793 CrossRef CAS PubMed.
- X. Hang, J. J. Huang, C. Yuan, Y. Liu and Y. Cui, J. Am. Chem. Soc., 2018, 140, 892–895 CrossRef PubMed.
- W. X. Chang, J. Y. Nie, Z. Yan, Y. J. Wang and S. Farooq, J. Agric. Food Chem., 2019, 67, 6708–6715 CrossRef CAS PubMed.
- Z. A. Alothman, A. Y. Badjah, K. M. Alsheetan, M. Suhail and I. Ali, J. Chromatogr. B: Anal. Technol. Biomed. Life Sci., 2021, 1166 Search PubMed.
- A. Giuffrida, G. Maccarrone, V. Cucinotta, S. Orlandini and A. Contino, J. Chromatogr. A, 2014, 1363, 41–50 CrossRef CAS PubMed.
- C. Furman, M. Howsam and E. Lipka, TrAC, Trends Anal. Chem., 2021, 141, 116287 CrossRef CAS.
- S. Saleem, F. Shaukat, A. Gul, M. Arooj and A. Malik, Int. J. Health Sci., 2017, 11, 63–68 Search PubMed.
- L. Bielska, S. E. Hale and L. Skulcova, Sci. Total Environ., 2021, 750, 141600 CrossRef CAS PubMed.
- E. M. Ulrich, C. N. Morrison, M. R. Goldsmith and W. T. Foreman, Rev. Environ. Contam. Toxicol., 2012, 217, 1–74 CAS.
- M. E. D. Merino, C. Lancioni, J. M. Padro and C. B. Castells, J. Chromatogr. A, 2020, 1624, 461240 CrossRef CAS PubMed.
- G. Gubitz and M. G. Schmid, J. Chromatogr. A, 2008, 1204, 140–156 CrossRef PubMed.
- C. Y. Lin, C. C. Liu, Y. Y. Chen, K. Y. Chiu, J. D. Wu, B. L. Lin, C. H. Wang, Y. F. Chen, S. H. Chang and Y. C. Chang, ACS Appl. Mater. Interfaces, 2021, 13, 1152–1157 CrossRef CAS PubMed.
- S. Y. Zhang, C. X. Yang, W. Shi, X. P. Yan, P. Cheng, L. Wojtas and M. J. Zaworotko, Chem, 2017, 3, 281–289 CAS.
- R. S. Hegade, M. De Beer and F. Lynen, J. Chromatogr. A, 2017, 1515, 109–117 CrossRef CAS PubMed.
- C. West, TrAC, Trends Anal. Chem., 2019, 120, 115648 CrossRef CAS.
- S. Y. Deng, J. M. Pan, M. Wang, Y. K. Huang and Z. N. Xia, Talanta, 2020, 220, 121419 CrossRef CAS PubMed.
- R. B. Yu and J. P. Quirino, TrAC, Trends Anal. Chem., 2019, 118, 779–792 CrossRef CAS.
- Z. Y. Gu, J. Q. Jiang and X. P. Yan, Anal. Chem., 2011, 83, 5093–5100 CrossRef CAS PubMed.
- B. Behnke, J. Johansson, E. Bayer and S. Nilsson, Electrophoresis, 2000, 21, 3102–3108 CrossRef CAS PubMed.
- R. L. C. Voeten, I. K. Ventouri, R. Haselberg and G. W. Somsen, Anal. Chem., 2018, 90, 1464–1481 CrossRef CAS PubMed.
- F. M. Tarongoy, P. R. Haddad and J. P. Quirino, Electrophoresis, 2018, 39, 34–52 CrossRef CAS PubMed.
- X. Zhao, Y. X. Wang, D. S. Li, X. H. Bu and P. Y. Feng, Adv. Mater., 2018, 30, 1705189 CrossRef PubMed.
- J. R. Li, J. Sculley and H. C. Zhou, Chem. Rev., 2012, 112, 869–932 CrossRef CAS PubMed.
- W. M. Xuan, C. F. Zhu, Y. Liu and Y. Cui, Chem. Soc. Rev., 2012, 41, 1677–1695 RSC.
- N. S. Ye, J. C. Ma, J. X. An, J. Li, Z. M. Cai and H. Zong, RSC Adv., 2016, 6, 41587–41593 RSC.
- W. Ding, T. Yu, Y. X. Du, X. D. Sun, Z. J. Feng, S. Y. Zhao, X. F. Ma, M. X. Ma and C. Chen, Microchim. Acta, 2020, 187, 51 CrossRef CAS PubMed.
- Z. T. Li, Z. K. Mao, W. Zhou and Z. L. Chen, Anal. Chim. Acta, 2020, 1094, 160–167 CrossRef CAS PubMed.
- T. T. Wang, Y. Wang, Y. L. Zhang, Y. H. Cheng, J. N. Ye, Q. C. Chu and G. F. Cheng, J. Chromatogr. A, 2020, 1625, 461284 CrossRef CAS PubMed.
- Z. X. Fei, M. Zhang, J. H. Zhang and L. M. Yuan, Anal. Chim. Acta, 2014, 830, 49–55 CrossRef CAS PubMed.
- Z. X. Fei, M. Zhang, S. M. Xie and L. M. Yuan, Electrophoresis, 2014, 35, 3541–3548 CrossRef CAS PubMed.
- S. M. Xie, M. Zhang, Z. X. Fei and L. M. Yuan, J. Chromatogr. A, 2014, 1363, 137–143 CrossRef CAS PubMed.
- S. Daliran, M. G. Miri, A. R. Oveisi, M. Khajeh, S. Navalon, M. Alvaro, M. Ghaffari-Moghaddam, H. S. Delarami and H. García, ACS Appl. Mater. Interfaces, 2020, 12, 25221–25232 CrossRef CAS PubMed.
- Y. Bai, Y. B. Dou, L. H. Xie, W. Rutledge, J. R. Li and H. C. Zhou, Chem. Soc. Rev., 2016, 45, 2327–2367 RSC.
- M. X. Ma, J. Zhang, P. P. Li, Y. X. Du, J. Gan, J. X. Yang and L. Zhang, Microchim. Acta, 2021, 188, 1–11 CrossRef PubMed.
- B. L. Bonnett, E. D. Smith, M. De La Garza, M. Cai, J. V. Haag, J. M. Serrano, H. D. Cornell, B. Gibbons, S. M. Martin and A. J. Morris, ACS Appl. Mater. Interfaces, 2020, 12, 15765–15773 CrossRef CAS PubMed.
- Y. J. Li, C. H. Song, L. Y. Zhang, W. B. Zhang and H. G. Fu, Talanta, 2010, 80, 1378–1384 CrossRef CAS PubMed.
- J. C. Dobrowolski, M. H. Jamroz, R. Kolos, J. E. Rode and J. Sadle, Chemphyschem, 2007, 8, 1085–1094 CrossRef CAS PubMed.
- W. Morris, B. Volosskiy, S. Demir, F. Gandara, P. L. McGrier, H. Furukawa, D. Cascio, J. F. Stoddart and O. M. Yaghi, Inorg. Chem., 2012, 51, 6443–6445 CrossRef CAS PubMed.
- D. W. Feng, Z. Y. Gu, J. R. Li, H. L. Jiang, Z. W. Wei and H. C. Zhou, Angew. Chem., Int. Ed., 2012, 51, 10307–10310 CrossRef CAS PubMed.
- A. J. Howarth, C. T. Buru, Y. Y. Liu, A. M. Ploskonka, K. J. Hartlieb, M. McEntee, J. J. Mahle, J. H. Buchanan, E. M. Durke, S. S. Al-Juaid, J. F. Stoddart, J. B. DeCoste, J. T. Hupp and O. K. Farha, Chem.–Eur. J., 2017, 23, 214–218 CrossRef CAS PubMed.
- P. Deria, W. Bury, J. T. Hupp and O. K. Farha, Chem. Commun., 2014, 50, 1965–1968 RSC.
- J. K. Zareba, M. Nyk and M. Samoc, Cryst. Growth Des., 2016, 16, 6419–6425 CrossRef CAS.
- J. S. Oh, Y. You, K. C. Park, G. Gupta, D. K. Kang and C. Y. Lee, Dyes Pigm., 2019, 170, 107576 CrossRef CAS.
- S. Carrasco, A. Sanz-Marco and B. Martin-Matute, Organometallics, 2019, 38, 3429–3435 CrossRef CAS.
- E. Y. Jeong, A. Burri, S. Y. Lee and S. E. Park, J. Mater. Chem., 2010, 20, 10869–10875 RSC.
- Y. X. Ye, C. J. Huang, J. Yang, Y. S. Li, Q. X. Zhuang and J. L. Gu, Microporous Mesoporous Mater., 2019, 284, 36–42 CrossRef CAS.
- M. Basik, M. Mobin and M. Shoeb, Sci. Rep., 2020, 10, 279 CrossRef CAS PubMed.
- C. J. Wang, L. Zhang, X. L. Li, A. J. Yu and S. S. Zhang, Talanta, 2020, 218, 121155 CrossRef CAS PubMed.
- S. M. Xie, X. H. Zhang, B. J. Wang, M. Zhang, J. H. Zhang and L. M. Yuan, Chromatographia, 2014, 77, 1359–1365 CrossRef CAS.
- S. M. Xie, Z. J. Zhang, Z. Y. Wang and L. M. Yuan, J. Am. Chem. Soc., 2011, 133, 11892–11895 CrossRef CAS PubMed.
- M. Zhang, Z. J. Pu, X. L. Chen, X. L. Gong, A. X. Zhu and L. M. Yuan, Chem. Commun., 2013, 49, 5201–5203 RSC.
- T. Ikai and Y. Okamoto, Chem. Rev., 2009, 109, 6077–6101 CrossRef CAS PubMed.
- W. H. Pirkle and T. C. Pochapsky, Chem. Rev., 1989, 89, 347–362 CrossRef CAS.
- O. C. Choon and G. A. Rodley, Inorg. Chim. Acta, 1983, 79, 166–167 CrossRef.
- J. M. Rivera and M. Rivera, J. Porphyrins Phthalocyanines, 2020, 24, 1215–1223 CrossRef CAS.
- X. Q. Zhang, Q. Han and M. Y. Ding, RSC Adv., 2015, 5, 1043–1050 RSC.
- W. J. Lao and J. Gan, J. Chromatogr. A, 2006, 1117, 184–193 CrossRef CAS PubMed.
- I. Ali, M. Suhail and L. Asnin, J. Sep. Sci., 2017, 40, 2863–2882 CrossRef CAS PubMed.
- M. N. Rebizi, K. Sekkoum, N. Belboukhari, A. Cheriti and H. Y. Aboul-Enein, J. Chromatogr. Sci., 2018, 56, 835–845 CAS.
- J. Grellet, B. Ba and M. C. Saux, J. Biochem. Biophys. Methods, 2002, 54, 221–233 CrossRef CAS PubMed.
Footnote |
| † Electronic supplementary information (ESI) available. See DOI: 10.1039/d1ra07909c |
| This journal is © The Royal Society of Chemistry 2022 |