 Open Access Article
Creative Commons Attribution 3.0 Unported Licence
DFT-based study of the structural, optoelectronic, mechanical and magnetic properties of Ti3AC2 (A = P, As, Cd) for coating applications
R. M. Arif Khalila,
Muhammad Iqbal Hussain *ab,
Nadia Luqmana,
Fayyaz Hussain*a,
Anwar Manzoor Ranaa,
Muhammad Saeed Akhtar*b and
Rana Farhat Mehmoodc
aMaterials Simulation Research Laboratory (MSRL), Department of Physics, Bahauddin Zakariya University, Multan, 60800, Pakistan. E-mail: miqbal@ue.edu.pk; fayyazhussain248@yahoo.com
bDepartment of Physics, University of Education, Lahore, 54000, Pakistan. E-mail: saeed.akhtar@ue.edu.pk
cDepartment of Chemistry, University of Education, Lahore, 54000, Pakistan
First published on 3rd February 2022
Abstract
The first-principles approach has been used while employing the Perdew–Burke–Ernzerhof exchange-correlation functional of generalized gradient approximation (PBE-GGA) along with the Hubbard parameter to study the structural, optoelectronic, mechanical and magnetic properties of titanium-based MAX materials Ti3AC2 (A = P, As, Cd) for the first time. As there is no band gap found between the valence and conduction bands in the considered materials, these compounds belong to the conductor family of materials. A mechanical analysis carried out at pressures of 0 GPa to 20 GPa and the calculated elastic constants Cij reveal the stability of these materials. Elastic parameters, i.e., Young's, shear and bulk moduli, anisotropy factor and Poisson's ratio, have been investigated in the framework of the Voigt–Reuss–Hill approximation. The calculated values of relative stiffness are found to be greater than ½ for Ti3PC2 and Ti3AsC2, which indicates that these compounds are closer to typical ceramics, which possess low damage tolerance and fracture toughness. Optical parameters, i.e., dielectric complex function, refractive index, extinction coefficient, absorption coefficient, loss function, conductivity and reflectivity, have also been investigated. These dynamically stable antiferromagnetic materials might have potential applications in advanced electronic and magnetic devices. Their high strength and significant hardness make these materials potential candidates as hard coatings.
1. Introduction
Recently, MAX phases have captured the attention of a lot of researchers due to the discovery of MXenes,1–5 which are a novel 2D material made from transition metal carbides and nitrides. MXenes offer higher shielding effectiveness due to their moderate electrical conductivity and can be obtained by the selective etching of the A-layer from a MAX material.6,7 MXenes have the capability to provide perfect guidance to design shielding materials for electromagnetic interference,8 and can be used as an electrode material to enhance the capacitance of super-capacitors.9 The family of MAX materials exhibiting properties of metals and ceramics simultaneously was first reported in the early 1960s by Nowtony and co-workers. Later, in 1996, Barsoum et al. discovered a fascinating MAX material, titanium silicon carbide T3SiC2.10–13 Titanium-based MAX materials like Ti3SiC2, Ti3AlC2 and Ti2AlC have demonstrated unique properties such as high temperature strength, low density and good oxidation resistance.14,15 Moreover, lithium-based MAX materials like Li2Ti3O7, LiNiO2, LixCoO2, and LixTiO2 have extraordinary technological applications.16,17MAX materials are denoted as Mn+1AXn, where M represents a transition metal, A represents an element from groups XIII–XVI, X is either carbon or nitrogen and n may vary from 1–3.18,19 MAX compounds are categorized in distinct phases, namely, 211, 312 and 413, with respect to the value of n.20 The foremost distinction among MAX alloys depends upon the number of inserting A layers per M layers.21 Mechanically, MAX compounds are different from MX carbides and nitrides.22 The incredible characteristics of MAX phases solely depend on M–X bonds with covalent–metallic nature, and are extremely strong when compared with M–A bonds.23 Ti3AlC2 from the Ti–Al–C family is a very interesting MAX material due to its greatly tailorable properties.24 Experimental and computational investigations to explore the properties of MAX phase materials have been reported. Various MAX materials like Ti3SiC2, Zr2AlC2, V2AlC, V4AlC3−x, V12Al3C8, Mo2TiAlC2, Mo2Ti2AlC3, Ti3AlC2, Ti2InC, Zr2InC and Hf2InC have demonstrated unique and promising structural, mechanical, electrical and optical properties.25–31 MAX phases have great importance in shielding and coating applications, such as the in situ growth of MAX phase coatings on carbonised wood and their terahertz shielding properties,32 exfoliation and defect control of the two-dimensional few-layer MXene Ti3C2Tx for electromagnetic interference shielding coatings,33 highly conductive and scalable Ti3C2Tx-coated fabrics for efficient electromagnetic interference shielding,34 “beyond Ti3C2Tx: MXene for electromagnetic interference shielding”35 and MAX phase-based electroconductive coating for high-temperature oxidizing environment.36
As per the literature, there is no experimental or computational study reported till date on the novel Ti3AC2 (A = P, As, Cd) combination of titanium-based MAX materials. Since MAX phases have great importance in shielding and coating applications, as discussed above, this challenge has motivated us to computationally inspect the structural, optoelectronic, mechanical and magnetic properties of these compounds for the first time using an ab initio approach, where calculations have been performed using the CASTEP simulation code.
2. Computational methodology
The first-principles simulation was performed opting for the plane wave pseudo-potential based on DFT,37 as employed in the CASTEP code.38 The structural parameters were investigated by considering electron–ion interactions with a cut-off energy of 600 eV using norm conserving pseudo-potentials.39,40 A Monkhorst–Pack grid of 10 × 10 × 2 was chosen to model the Brillouin zone (BZ).41 For settling down ionic positions, the conjugate gradient method was used.42 The structural parameters of the system in anticipation of Hellmann–Feynman forces were found to be significantly less than 0.02 eV Å−1 in an energy convergence criterion of 1 × 10⁻⁵ eV.43 The PBE-GGA functional in addition to the Hubbard parameter U was utilized, particularly to evaluate the electronic and magnetic properties of the system.44,45 The values of U for Ti and Cd atoms were opted as 2.5 eV and 2.0 eV, respectively. The U-values opted for these calculations are taken from the standard parameterization, as mentioned in the CASTEP code. Optical and mechanical properties were calculated under the umbrella of Kramer–Kronig relations46,47 and the Voigt–Reuss–Hill approximation.48,49 To determine the thermal stability of Ti3AC2 (A = P, As, Cd), phonon frequencies have been illustrated while utilizing density functional perturbation theory.503. Results and discussions
3.1. Structural and electronic properties
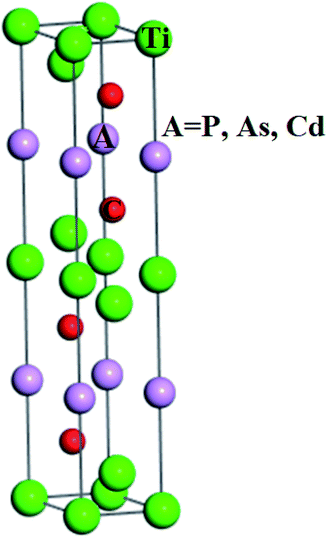
The structural investigations revealed that Ti3AC2 (A = P, As, Cd) exhibited a hexagonal crystal structure with the point group (D6h, 6/mmm, 6/m 2/m 2/m) and space group (P63/mmc, P![[6 with combining macron]](https://www.rsc.org/images/entities/char_0036_0304.gif) c2c). Interestingly, the structure of Ti3AC2 (A = P, As, Cd) is found to be similar to many MAX materials, such as Ti3SiC2 and Ti3GeC2,24,51 with its lattice parameters given in Table 1. The Wyckoff positions of Ti, A and C atoms are located at 2a, 2b and 4f, respectively, as shown in Fig. 1.
c2c). Interestingly, the structure of Ti3AC2 (A = P, As, Cd) is found to be similar to many MAX materials, such as Ti3SiC2 and Ti3GeC2,24,51 with its lattice parameters given in Table 1. The Wyckoff positions of Ti, A and C atoms are located at 2a, 2b and 4f, respectively, as shown in Fig. 1.
| Material | a (Å) | c (Å) | c/a | V (Å3) | E0 (Ry) |
|---|---|---|---|---|---|
| Ti3PC2 | 3.149 | 16.798 | 5.33 | 144.284 | −11![[thin space (1/6-em)]](https://www.rsc.org/images/entities/char_2009.gif) 919.74 919.74 |
| Ti3AsC2 | 3.149 | 16.798 | 5.33 | 144.284 | −19![[thin space (1/6-em)]](https://www.rsc.org/images/entities/char_2009.gif) 595.75 595.75 |
| Ti3CdC2 | 3.167 | 18.906 | 5.969 | 164.276 | −32![[thin space (1/6-em)]](https://www.rsc.org/images/entities/char_2009.gif) 935.30 935.30 |
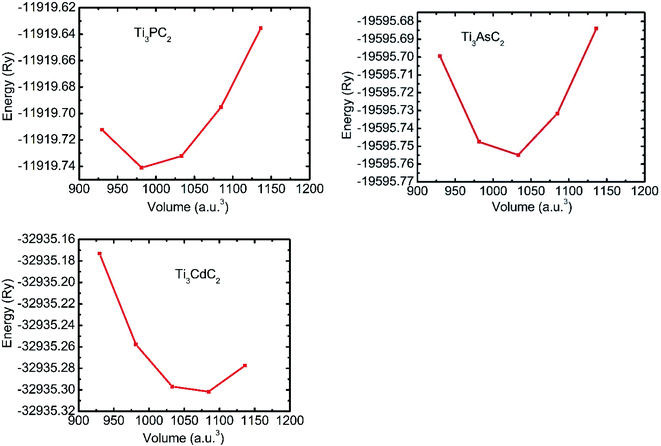
The search for geometric optimization and structural stability is the initial step in any first-principles simulation. For this reason, energy versus volume graphs for each Ti3AC2 (A = P, As, Cd) material are plotted in Fig. 2, and the data is fitted rendering to the rule of energy of state (EOS) owing to Birch–Murnaghan.52 The calculated formation energy of the considered Ti3AC2 (A = P, As, Cd) materials is negative, which indicates the structural stability of these MAX materials.53 The negative ground state energy values for Ti3AC2 (A = P, As, Cd) at static equilibrium are found to be −11![[thin space (1/6-em)]](https://www.rsc.org/images/entities/char_2009.gif) 919.74 Ry, −19
919.74 Ry, −19![[thin space (1/6-em)]](https://www.rsc.org/images/entities/char_2009.gif) 595.75 Ry and −32
595.75 Ry and −32![[thin space (1/6-em)]](https://www.rsc.org/images/entities/char_2009.gif) 935.30 Ry, respectively.
935.30 Ry, respectively.
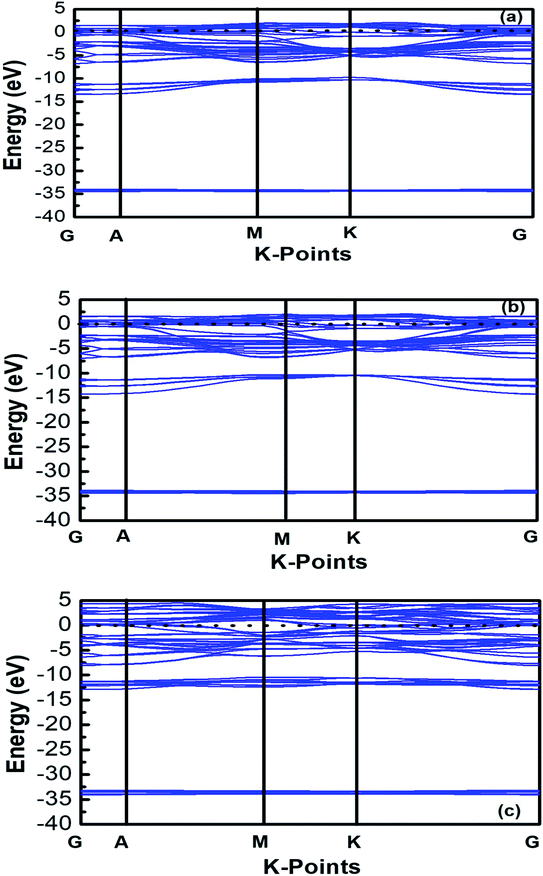
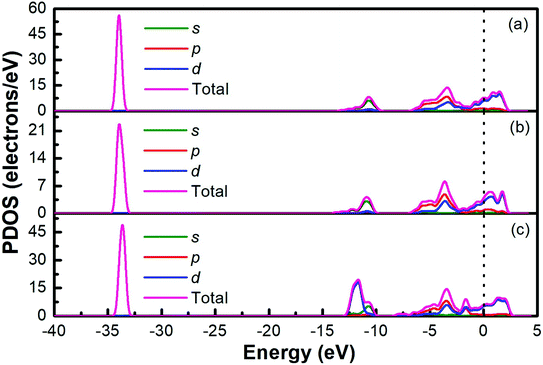
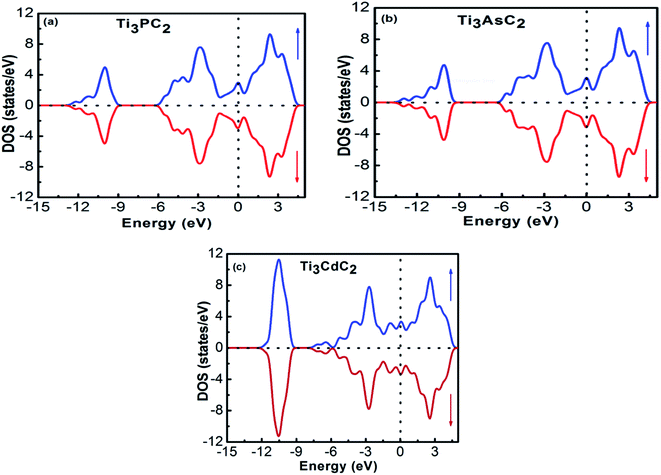
The band structures of Ti3AC2 (A = P, As, Cd) have been anticipated within the 1st Brillouin zone (BZ) along with high symmetry lines from the calculated structural parameters. Fig. 3 depicts the electronic band structures of Ti3PC2, Ti3AsC2 and Ti3CdC2, and reveals the metallic behaviour of these compounds. As a matter of fact, no band gap has appeared across the Fermi level (EF), and the electronic states of valence and conduction bands are overlapping. Such metallic behaviour of the Ti3AC2 compounds is quite analogous to a few already reported materials with MAX phases.54,55 Ti3AC2 (A = P, As, Cd) can offer excellent electrical, thermal and metallic conductivity. The total density of states (TDOS) of Ti3PC2, Ti3AsC2 and Ti3CdC2 determined at EF revealed that these materials exhibit 5.87, 6.22 and 2.95 states per eV, respectively, as depicted in Fig. 4 along with the PDOS. Moreover, it has been observed that the value of TDOS for Ti3AsC2 is slightly greater than those of Ti3PC2 and Ti3CdC2, indicating the more conductive nature of this compound. The occupied valence states of Ti3PC2, Ti3AsC2 and Ti3CdC2 are observed to be at −6.13, −6.00 and −8.35 eV, respectively, with respect to the EF, as shown in Fig. 3.
Fig. 4(a) demonstrates the partial density of states (PDOS) for Ti3PC2. Hybridization in the valence band from −11.6 to −9.7 eV occurs due to the 3s states of P and 2s states of C. The hybridization between the 3d states of Ti, 3p states of P and C in the valence band from −4.2 to −2.0 eV resulted in raising the top of the valence band towards the EF. As for the conduction band, the contribution of the 3d states of Ti near the EF appears as a higher density of states in the region from 1.4 to 2.8 eV. Fig. 4(b) demonstrates the PDOS for Ti3AsC2. Hybridization of the s states of As and C appeared from −10.6 to 9.6 eV. The top of the valence band rises towards the EF due to the mix p states of As, C and the d states of Ti in the valence band from −3.6 to −1.6 eV. The maximum density of states in the conduction band appears due to the 3d states of Ti from 1.9 to 2.7 eV. Fig. 4(c) shows that the hybridization in Ti3CdC2 resulted from the 2s states of C with the 3p and 3d states of Ti from −11.5 to −9.5 eV. The maximum density of states within the valence band appears due to the 3d states of Cd from −12.6 to −10.7 eV. The interaction between the s and p states of Ti and C from −7.9 to −5.8 eV raises the valence band towards the EF. The strong hybridization between the 3d states of Ti and 2p states of C from −4.2 to −2.4 eV is evidence for Ti–C covalent bonds in Ti3CdC2. The maximum density of states in the conduction band from 1.5 to 2.4 eV appeared due to the 3d states of Ti.56
3.2. Optical and dynamical properties
3.2.1.1 Complex dielectric function. The complex dielectric constant is an energy dependent function that has major contributions towards the optical properties of materials. It has real (ε1(ω)) and imaginary parts (ε2(ω)) that provide information regarding the polarization/dispersion and absorption of light, respectively, in relation to the electronic band structure of materials. In Fig. 5(a), behaviour of the real part of the dielectric constant is depicted as a function of energy with static values of 182, 242 and 72 for Ti3PC2, Ti3AsC2 and Ti3CdC2, respectively. For all compounds, the real part of the dielectric function extends towards negative values for higher energies, showing the metallic behaviour of the compounds. Fig. 5(b) shows the behaviour of the imaginary part of the dielectric function for Ti3PC2, Ti3AsC2 and Ti3CdC2 with static values of 57, 76 and 12 at 0 eV, respectively. The imaginary part also demonstrated the metallic behaviour of the MAX compounds.
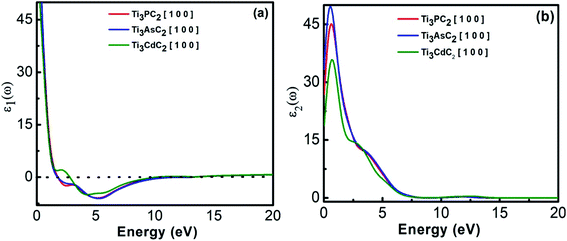 | ||
| Fig. 5 (a) Real dielectric function and (b) imaginary dielectric function of Ti3AC2 (A = P, As, Cd). | ||
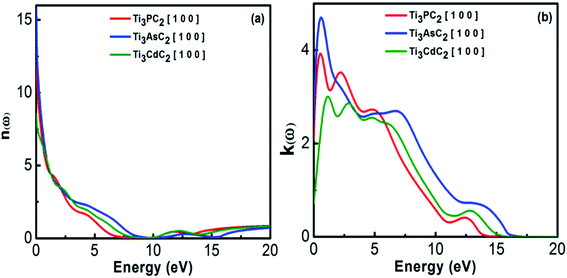
3.2.1.2 Refractive index and extinction coefficient. The refractive index represents the phase velocity and the extinction coefficient describes the absorption losses when EM radiation passes through the material. Fig. 6(a) shows the variation in refractive index for Ti3PC2, Ti3AsC2 and Ti3CdC2 as a function of photon energies. It has been observed that Ti3AsC2 demonstrates the maximum value of refractive index among the studied compounds due to considerable interaction between the valence electrons and incident photons. This interaction ultimately resulted in polarization within the material.58
Fig. 6(b) represents the static values of the extinction coefficient calculated for Ti3CdC2, Ti3PC2 and Ti3AsC2, which are found to be 0.7, 2 and 2.4, respectively. Ti3PC2 shows two strong peaks at 0.5 and 2.2 eV, Ti3AsC2 only shows a single peak at 0.7 eV, and Ti3CdC2 shows two peaks at 1.2 and 2.9 eV. The extinction coefficients for the three considered materials follow a decreasing trend for energies ranging from 5 to 20 eV. Among these three materials, the values of the extinction coefficients allude to the fact that Ti3AsC2 absorbs more radiation as compared to Ti3PC2 and Ti3CdC2.
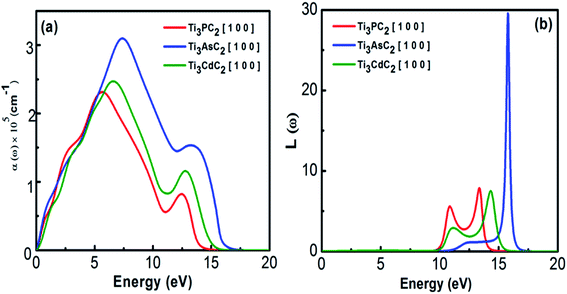
3.2.1.3 Absorption coefficient and energy loss function. It is well known that the absorption coefficient of any material dictates the amount of photon energy absorbed. Instead of absorption, the extinction coefficient helps to estimate the conversion efficiency of many optical materials for applications in solar devices.59 The absorption spectra of Ti3PC2, Ti3AsC2 and Ti3CdC2, as shown in Fig. 7(a), reveal the metallic behaviour of the compounds due to the absorption of incident photons of all energies. A sharp increasing trend in the absorption coefficient has been observed from almost 5 eV, and at energies about 14 eV, it decreases drastically. Ti3AsC2 exhibits maximum absorption as a result of transitions from the p state of As and the 3d state of Ti60 when compared with Ti3PC2 and Ti3CdC2. The sudden drop of absorption above 13 eV might lead to plasma resonance.
The loss function describes the plasma resonance frequencies that appear due to effects like dispersion, heating and scattering. At plasma frequencies, the loss function demonstrates its maximum value. Fig. 7(b) shows the loss functions and bulk plasma frequencies for Ti3PC2, Ti3AsC2 and Ti3CdC2 to be 7.8 (13.3 eV), 29 (15.7 eV) and 7.3 (14.3 eV), respectively. At higher frequencies, the loss function for Ti3CdC2 attains its minimum value; hence, this compound could be a suitable dielectric material. If the plasma frequencies are slightly lower than that of the incident photons, the compounds are considered transparent.59
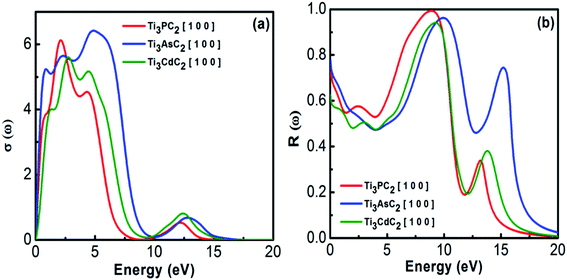
3.2.1.4 Optical conductivity and reflectivity. Optical conductivity describes the conductivity of EM radiation with a threshold frequency through the material's surface by inter- and intra-band transitions. It approximately follows a similar trend as that for the absorption spectra of MAX materials. Fig. 8(a) depicts the optical conductivity of the Ti3AC2 (A = P, As, Cd). The optical conductivity fluctuates between 0.2 to 7.0 eV, and attains its maximum value, i.e., 2.1, 2.4 and 2.7 eV for Ti3PC2, Ti3AsC2 and Ti3CdC2, respectively, followed by a sharp decrease and a dip between 9 and 10 eV.
Reflectivity helps to explain the surface behavior of MAX materials. Reflectivity is a ratio of the energy possessed by incident photons to that of reflected photons. Maximum reflectivity is observed specifically in the UV and in the moderate IR regions. In the visible region, the considered MAX materials offer 44% reflectivity and are potential candidates to reduce solar heating.54 The static values of reflectivity for Ti3PC2, Ti3AsC2 and Ti3CdC2 are found to be 0.75, 0.78 and 0.63, respectively, at an incident energy of 0 eV, as shown in Fig. 8(b). A sharp increasing trend in reflectivity towards its corresponding maximum values at 8.9 eV (0.99), 10 eV (0.99), and 9.2 eV (0.94) has been observed. Afterwards, sharp and spiky dips appeared around 12 eV followed by further enhancement in the reflectivity values.
As there are 12 atoms in Ti3AC2 (A = P, As, Cd), resulting in 36 phonon branches or modes of vibration, three modes at zero frequency are recognized as acoustic modes and the remaining 33 modes are called optical modes of vibration. From these 33 optical modes of vibration, 12 modes are found to be Raman active, 9 modes are IR active and 12 calculated modes are found to be inactive modes. Our calculated total modes for the Ti3AC2 (A = P, As, Cd) phases are consistent with a previous theoretical study of the lattice dynamics of Al-containing carbides M3AlC2 (M = Ti, V, Ta).61 However, a select 7 (out of 12) Raman and 6 (out of 9) IR active modes for each phase are given in Table 2, and the remaining Raman and IR active modes can be called degenerate modes, as mentioned above. These compounds are found to be dynamically stable because no imaginary frequency or soft mode51,57 appears at the gamma (Γ) point. The calculated symmetries and phonon frequencies for the considered compounds, i.e., Ti3AC2 (A = P, As, Cd), are listed in Table 2. For these compounds, the modes of vibration are categorized by irreducible representations62 of the point group symmetry D6h 6/mmm and the space group symmetry P63/mmc in the hexagonal phase of the crystal structure. The highest frequencies of the Raman modes are observed at 621, 656 and 644 cm−1, while the highest IR modes are observed at 542, 569 and 603 cm−1 for Ti3PC2, Ti3AsC2 and Ti3CdC2, respectively. The modes in the range of frequency between 175 cm−1 to 546 cm−1 are due to the similar motion of Ti and C atoms in all the structures. The highest frequency modes are due to the motion of carbon atoms. The low frequency Raman modes around 98 cm−1 are due to the motion of the heavy atoms Ti and As in the Ti3PC2 and Ti3AsC2 phases, respectively. However, the low frequency Raman modes at 55 cm−1 are due to the motion of the Cd atom in the Ti3CdC2 system.
| Compounds | Raman | Irreducible representation | IR | Irreducible representation |
|---|---|---|---|---|
| Ti3PC2 | 97.954 | E2g | 224.587 | E1u |
| 175.920 | E1g | 281.274 | E1u | |
| 257.668 | A1g | 327.291 | A2u | |
| 282.717 | E2g | 427.818 | A2u | |
| 549.843 | E2g | 505.430 | A2u | |
| 557.923 | E1g | 542.772 | E1u | |
| 621.215 | A1g | — | — | |
| Ti3AsC2 | 97.666 | E2g | 165.367 | E1u |
| 195.099 | E1g | 254.128 | A2u | |
| 210.859 | E2g | 264.557 | E1u | |
| 292.288 | A1g | 387.196 | A2u | |
| 586.373 | E2g | 545.675 | A2u | |
| 590.789 | E1g | 569.994 | E1u | |
| 656.223 | A1g | — | — | |
| Ti3CdC2 | 54.925 | E2g | 82.951 | E1u |
| 172.088 | E1g | 133.859 | A2u | |
| 175.877 | E2g | 279.249 | E1u | |
| 244.316 | A1g | 357.470 | A2u | |
| 598.555 | E1g | 540.045 | A2u | |
| 599.4584 | E2g | 603.724 | E1u | |
| 644.810 | A1g | — | — |
3.3. Mechanical properties
After experiencing external stress, a material's response may correspond to its elastic properties, i.e., bond strength and mechanical stability. The mechanical properties of Ti3AC2 (A = P, As, Cd) at various pressure values, i.e., 0 GPa, 5 GPa and 10 GPa, are listed in Tables 3 and 4. Shear deformation can illustrate the ductility of a material.63 Hooke's law, fitted to shapeless crystals, has been used in the framework of the robust CASTEP simulation code along with the stress–strain behavior in order to calculate the elastic parameters. As reported, the strain pattern of the materials can be reduced significantly for crystals with a low symmetry having mutually independent elastic constants.64| Compounds | Pressure (GPa) | C11 | C12 | C13 | C33 | C44 |
|---|---|---|---|---|---|---|
| Ti3PC2 | 0 | 318 | 237 | 58 | 382 | 197 |
| 5 | 335 | 105 | 63 | 365 | 118 | |
| 10 | 297 | 95 | 111 | 348 | 184 | |
| Ti3AsC2 | 0 | 340 | 62 | 79 | 368 | 146 |
| 5 | 343 | 67 | 84 | 367 | 148 | |
| 10 | 347 | 71 | 80 | 376 | 147 | |
| Ti3CdC2 | 0 | 354 | 135 | 211 | 265 | 140 |
| 5 | 355 | 135 | 202 | 263 | 137 | |
| 10 | 392 | 125 | 240 | 256 | 176 |
| Compounds | E (GPa) | B (GPa) | G (GPa) | G/B | B/G | B/C44 (GPa) | υ | A | α |
|---|---|---|---|---|---|---|---|---|---|
| Ti3PC2 | 275 | 157 | 114 | 0.7 | 1.37 | 0.79 | 0.2 | 1.3 | 1.3 |
| 282 | 155 | 118 | 0.8 | 1.31 | 0.82 | 0.2 | 0.8 | 1.0 | |
| 286 | 151 | 121 | 0.8 | 1.27 | 0.82 | 0.2 | 1.7 | 0.1 | |
| Ti3AsC2 | 326 | 162 | 140 | 0.9 | 1.16 | 1.10 | 0.2 | 1.1 | 0.8 |
| 327 | 166 | 140 | 0.8 | 1.19 | 1.12 | 0.2 | 1.1 | 0.8 | |
| 327 | 166 | 141 | 0.9 | 1.18 | 1.12 | 0.2 | 1.1 | 0.9 | |
| Ti3CdC2 | 206 | 217 | 77 | 0.4 | 2.82 | 1.55 | 0.3 | 2.8 | 1.2 |
| 184 | 211 | 68 | 0.3 | 3.10 | 1.54 | 0.3 | 2.5 | 1.4 | |
| 186 | 229 | 68 | 0.2 | 4.40 | 1.30 | 0.4 | 4.1 | 2.5 |
The elastic constants of the considered MAX materials satisfy Born's criterion57 with positive values, leading to the assessment that these materials are mechanically stable. The anisotropy factor for the hexagonal phase of MAX materials is defined as Kc/Ka = (C11 + C12 − 2C13)/(C33 − C13), where Kc and Ka are the compressibility coefficients along the c- and a-axes, respectively. Bulk and shear moduli are used to determine the hardness,65 whereas Young's modulus is used to estimate the stiffness of solid materials.56 The elastic constants of the considered MAX materials reveal their anisotropic nature. Table 4 summarizes the mechanical properties of the MAX materials using the Voigt–Reuss–Hill approximation.66–68
The Young's (E), bulk (B) and shear (G) moduli can be expressed as follows:
 | (1) |
 | (2) |
 | (3) |
The values of Young's modulus follow the trend of Ti3AsC2 > Ti3PC2 > Ti3CdC2, revealing that Ti3AsC2 is a bit stiffer than the Ti3PC2 and Ti3CdC2 compounds. The values of the bulk modulus follow the trend of Ti3CdC2 > Ti3AsC2 > Ti3PC2. The calculated value for shear modulus follows the order of Ti3AsC2 > Ti3PC2 > Ti3CdC2. In solids, Pugh's ratios B/G and G/B decide the brittle or ductile nature of materials. If B/G > 1.75 and B/G < 0.5, then the material is considered ductile; otherwise, it is brittle.52,58 According to Pugh's criteria, Ti3PC2 and Ti3AsC2 possess a brittle nature, while Ti3CdC2 is found to be a ductile material. The value of the machinability index69,70 follows the order of Ti3CdC2 > Ti3AsC2 > Ti3PC2.
Poisson's ratio υ, the shear anisotropy factor A and the linear compressibility coefficient can be calculated using the expressions given below:
 | (4) |
 | (5) |
 | (6) |
Poisson's ratio determines the degree of covalent bonding in materials.51 It has a value of 0.25 for ionic materials and 0.1 for covalent materials. Table 4 shows that Poisson's ratios for the studied MAX materials are around 0.25; therefore, the materials exhibit ionic character. The anisotropy factor helps to understand the isotropic or anisotropic nature of materials. If its value is 1, then the material is considered isotropic; otherwise, it is an anisotropic material.51 In the current study, the MAX materials are observed to be anisotropic, and might have potential applications in crystal physics and engineering sciences.71 Table 4 reveals that the considered MAX materials exhibit large linear compressibility (α) along the a-axis instead of along the c-axis.51
Furthermore, according to mechanics, for a classical spring, a relation between load and deformation is defined by Hooke's law.73 It is assumed here that a similar relation exists for chemical bonds in a solid, and so bond stiffness can be utilized to characterize and quantify bond strength. Specifically, the bond length d as a function of pressure P can be estimated using lattice parameters and internal coordinates. As variation in P causes changes in the bond strength, the relative bond lengths (d/d0), where d0 denotes the bond length at 0 GPa, should be linked to P by a quadratic curve74 obeying eqn (7), shown below. The slope of such a curve is defined as 1/k, where k represents the bond stiffness.73
| d/d0 = C0 + C1P + C2P2 | (7) |
 | (8) |
Fig. 9(a)–(c) displays the behavior of normalized bond lengths calculated for Ti3AC2 (A = P, As, Cd) as a function of pressure from 0 GPa to 20 GPa. The declining patterns of all bonds on increasing pressure fortify our general viewpoint that bond strength increases if pressure grows systematically. Table 5 presents the various bond lengths of the considered materials, i.e., Ti3AC2 (A = P, As, Cd), calculated at a diverse range of pressures, ranging from 0 GPa to 20 GPa. As expected, the variation of bond strength in the Ti3AC2 (A = P, As, Cd) compounds follows the universal change of electronic configuration due to the increase of the atomic radii of the A elements, i.e., P → Cd. The results reveal that the bond length decreases with increasing pressure. In addition to this, C–Ti bonds are found to be stiffer than P–Ti bonds, while P–Ti bonds are stronger than As–Ti and Cd–Ti bonds in the Ti3AC2 (A = P, As, Cd) family. Since shorter bond lengths lead to strong bonding, the M–C slabs possess stronger bonds as compared to bonds in the M–A slabs. It should be noted that at 0 GPa, the C1–Ti4 bond (2.10523 Å) is 3.2% shorter than its counter bond C2–Ti1 (2.18472 Å) in Ti3PC2. This implies that the C1–Ti4 bond is stronger. Similar analyses on the A elements (A = P, As, Cd) reflect that the P1–Ti6 bond (2.48509 Å) is 3.0% and 19.9% shorter than the As1–Ti3 (2.56021 Å) and Cd1–Ti6 bonds (2.97993 Å), respectively, indicating that the P1–Ti6 bond is comparatively stronger than its counterparts, i.e., As1–Ti3 and Cd1–Ti6. Table 6 discloses that the P2–Ti5 bond possesses a larger magnitude of bond stiffness, i.e., 654 GPa, compared to that of the As2–Ti5 bond (552 GPa) but less than the bond stiffness calculated for Cd2–Ti5 (1193 GPa). Moreover, Table 6 lists the coefficients of the second order polynomial fit of relative bond lengths as a function of pressure for Ti3PC2, Ti3AsC2 and Ti3CdC2. Here it is noteworthy that the negative magnitudes of coefficient C1 and positive magnitudes for C2 reveal an increase in the deformation resistance to compression with increasing pressure. This result is obvious from Fig. 9, which illustrates the decreasing trend of bond length. However, some negative values of coefficient C2 demonstrate that an increase in the deformation resistance to compression with increasing pressure is relatively slow, as noticed particularly for the Ti2–Ti6 bond. In addition, it can be noticed that the relative stiffness (i.e., the ratio of the bond stiffness of the weakest bond to that of the strongest bond) is greater than ½ for Ti3PC2 and Ti3AsC2 but lower than ½ for the Ti3CdC2 compound (Table 6). This means that Ti3PC2 and Ti3AsC2 are closer to typical ceramics, which possess low damage tolerance and fracture toughness.72,75 However, in the case of the Ti3CdC2 compound, a few unusual properties might be expected, such as its unusual stiffness of 4526 GPa for the Ti2–Ti6 bond.
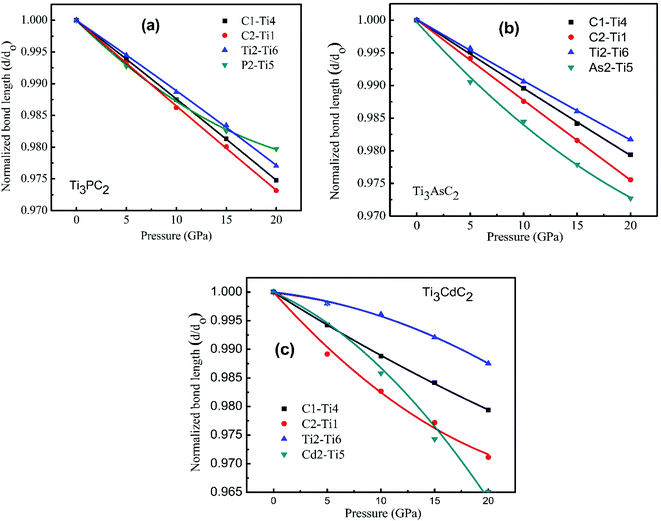 | ||
| Fig. 9 Normalized bond length as a function of the external pressure from 0 to 20 GPa for (a) Ti3PC2, (b) Ti3AsC2 and (c) Ti3CdC2. | ||
| Composite | Bonds | Bond length (Å) | |||||||
|---|---|---|---|---|---|---|---|---|---|
| 0 GPa | 5 GPa | 10 GPa | 15 GPa | 20 GPa | |||||
| Ti3PC2 | C1–Ti4 | C3–Ti6 | C4–Ti5 | C2–Ti3 | 2.10523 | 2.09254 | 2.07887 | 2.06590 | 2.05216 |
| C2–Ti1 | C3–Ti2 | C4–Ti1 | C1–Ti2 | 2.18472 | 2.17020 | 2.15462 | 2.14117 | 2.12606 | |
| P2–Ti5 | P1–Ti6 | P1–Ti3 | P2–Ti4 | 2.48509 | 2.46707 | 2.45412 | 2.44168 | 2.43469 | |
| Ti2–Ti6 | Ti1–Ti5 | Ti2–Ti4 | Ti1–Ti3 | 2.95598 | 2.93971 | 2.92247 | 2.90698 | 2.88810 | |
| Ti3AsC2 | C4–Ti5 | C3–Ti6 | C1–Ti4 | C2–Ti3 | 2.08396 | 2.07373 | 2.06221 | 2.05094 | 2.04105 |
| C3–Ti2 | C2–Ti1 | C1–Ti2 | C4–Ti1 | 2.17351 | 2.16077 | 2.14650 | 2.13346 | 2.12038 | |
| Ti5–As2 | Ti3–As1 | Ti4–As2 | Ti6–As1 | 2.56021 | 2.53600 | 2.52040 | 2.50360 | 2.49036 | |
| Ti2–Ti6 | Ti2–Ti4 | Ti1–Ti5 | Ti1–Ti3 | 2.92168 | 2.90907 | 2.89415 | 2.88085 | 2.86834 | |
| Ti3CdC2 | C4–Ti5 | C1–Ti4 | C3–Ti6 | C2–Ti3 | 2.05013 | 2.03233 | 2.02117 | 2.01164 | 2.00185 |
| C2–Ti1 | C3–Ti2 | C4–Ti1 | C1–Ti2 | 2.17539 | 2.15182 | 2.13769 | 2.12577 | 2.11256 | |
| Ti1–Ti5 | Ti2–Ti6 | Ti2–Ti4 | Ti1–Ti3 | 2.89483 | 2.89334 | 2.88362 | 2.87191 | 2.85867 | |
| Ti4–Cd2 | Ti6–Cd1 | Ti5–Cd2 | Ti3–Cd1 | 2.97993 | 2.97423 | 2.93767 | 2.90332 | 2.87595 | |
| Composite | Bonds | C1 × 10−3 | C2 × 10−5 | k (GPa) | Relative stiffness |
|---|---|---|---|---|---|
| Ti3PC2 | C1–Ti4 | −1.220 | −0.190 | 820 | 0.88 |
| C2–Ti1 | −1.360 | 0.124 | 735 | 0.79 | |
| Ti2–Ti6 | −1.070 | −0.335 | 935 | 1.00 | |
| P2–Ti5 | −1.530 | 2.590 | 654 | 0.70 | |
| Ti3AsC2 | C1–Ti4 | −1.070 | 0.128 | 935 | 0.90 |
| C2–Ti1 | −1.240 | 0.072 | 806 | 0.77 | |
| Ti2–Ti6 | −0.959 | 0.178 | 1043 | 1.00 | |
| As2–Ti5 | −1.810 | 2.310 | 552 | 0.53 | |
| Ti3CdC2 | C1–Ti4 | −1.180 | 0.774 | 847 | 0.19 |
| C2–Ti1 | −2.090 | 3.350 | 478 | 0.11 | |
| Ti2–Ti6 | −0.221 | −2.010 | 4525 | 1.00 | |
| Cd2–Ti5 | −0.838 | −4.850 | 1193 | 0.26 |
3.4. Magnetic properties
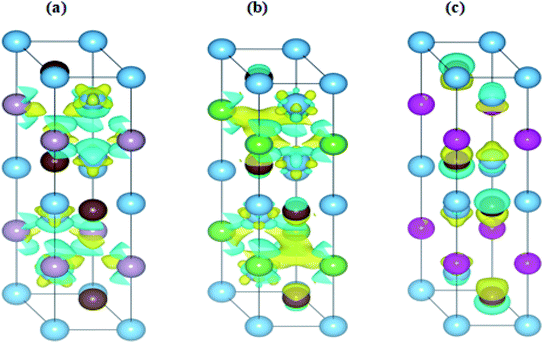
The interaction of the constituent elements of a solid and the crystal fields produces significant effects, which are duly recognized as magnetism.76 To account for these effects in the considered MAX compounds, the DFT + U functional was implemented. Regarding this, the spin-polarized DOS of Ti3PC2, Ti3AsC2 and Ti3CdC2 were estimated and are shown in Fig. 10(a)–(c). The Fermi level was adjusted at 0 eV. It is observed that the spin up ↑ states are exact replicas of the spin down ↓ states in each studied compound, assuring the antiferromagnetic behavior of these materials. Moreover, due to such a symmetric behavior of the spin up ↑ and spin down ↓ states, the net magnetic moment for all compounds is observed to be zero. The existence of few states at the EF further endorses the metallic nature of the compounds. It is important to mention here that prior to this study, neither theoretical nor experimental observations regarding the magnetic properties of these materials have been reported.In Fig. 11(a)–(c), the charge difference calculation (isosurface charge density) plots clearly demonstrate the charge accumulation (yellow color) and charge depletion (cyan color). It has also been noticed from the charge density plots that most of the charge is either accumulated or depleted in between the interlayers and on the Ti atoms in the case of the Ti3PC2 and Ti3AsC2 composites, while in the case of Ti3CdC2, an inadequate amount of charge is accumulated and depleted on the C atoms. These results illustrate the antiferromagnetic behavior of the studied compounds.
4. Conclusions
In the present article, a DFT-based first-principles study has been carried out to investigate the structural, optoelectronic, mechanical and magnetic properties of Ti3AC2 (A = P, As, Cd). As no significant band gap exists between the valence and conduction bands, this fact depicts that the considered materials behave like conductors. The presence of DOS around the EF describes the contribution of Ti 3d states to the conduction mechanism. The results pertaining to the elastic behavior indicated that these materials are not only thermally stable but mechanically stable as well. As per the data from Pugh's ratio, Ti3PC2 and Ti3AsC2 demonstrate a brittle nature, while Ti3CdC2 is ductile in nature. The values of relative stiffness greater than ½ reveal that Ti3PC2 and Ti3AsC2 are closer to typical ceramics, which possess low damage tolerance and fracture toughness. The magnitude of reflectivity reveals that these materials can be potential candidates for coating various devices to prevent solar heating. Moreover, the studied materials are dynamically stable and exhibit antiferromagnetic behavior. Henceforth, these MAX materials with hexagonal phases would be very appropriate potential candidates for coating applications.Conflicts of interest
There are no conflicts to declare.References
- Y. Gogotsi and B. Anasori, J. Am. Ceram. Soc., 2019, 13, 8491–8494 CAS.
- M. Ghidiu, S. Kota, V. Drozd and M. W. Barsoum, Sci. Adv., 2018, 4(1), 2–7 Search PubMed.
- F. Shahzad, M. Alhabeb, C. B. Hatter, B. Anasori, S. M. Hong, C. M. Koo and Y. Gogotsi, Suppl. Mater., 2016, 353(6304), 1137–1140 CAS.
- L. Zhanga, W. Sua, H. Shub, T. Lüa, L. Fua, K. Songc, X. Huangc, J. Yud, C. T. Lind and Y. Tange, Ceram. Int., 2019, 45, 11468–11474 CrossRef.
- M. Khazaeia, A. Mishrab, N. S. Venkataramananc, A. K. Singhb and S. Yunokia, Curr. Opin. Solid State Mater. Sci., 2019, 23, 164–178 CrossRef.
- G. Rehman, S. A. Khan, R. Ali, I. Ahmad, L. Y. Gan and B. Amin, J. Appl. Phys., 2019, 126, 143101–143110 CrossRef.
- J. Li, X. Li and B. V. D. Bruggen, Environ. Sci.: Nano, 2020, 7, 1–16 RSC.
- A. Iqbal, F. Shahzad, K. Hantanasirisaku, M. K. Kim, J. Kwon, J. Hong, H. Kim, D. Kim, Y. Gogotsi and C. M. Koo, Science, 2020, 369, 446–450 CrossRef CAS PubMed.
- X. Zang, J. Wang, Y. Qin, T. Wang, C. He, Q. Shao, H. Zhu and N. Cao, Nano-Micro Lett., 2020, 12, 1–24 CrossRef PubMed.
- M. W. Barsoum, Prog. Solid State Chem., 2000, 28, 201–281 CrossRef CAS.
- P. Finkel, M. W. Barsoum and T. El-Raghy, J. Appl. Phys., 2000, 87(4), 1701–1703 CrossRef CAS.
- D. T. Cuskelly, E. R. Richards, E. H. Kisi and V. J. Keast, J. Solid State Chem., 2015, 230, 418–425 CrossRef CAS.
- X. He, Y. Bai, Y. C. Zhou and M. W. Barsoum, Acta Mater., 2011, 59, 5523–5533 CrossRef CAS.
- X. He, Y. Bai, Y. C. Zhou, Y. Sun, M. Li and M. W. Barsoum, Comput. Mater. Sci., 2010, 49, 691–698 CrossRef CAS.
- G. Hug, Phys. Rev. B: Condens. Matter Mater. Phys., 2006, 74, 184113–184117 CrossRef.
- J. Y. Wang and Y. C. Zhou, Phys. Rev. B: Condens. Matter Mater. Phys., 2004, 69, 144108–144113 CrossRef.
- P. Eklund, J. P. Palmquist, J. H. wing, D. H. Trinh, T. El-Raghy, H. Hogberg and L. Hultman, Acta Mater., 2007, 55, 4723–4729 CrossRef CAS.
- M. W. Barsoum and M. Radovic, Annu. Rev. Mater. Res., 2011, 41, 195–227 CrossRef CAS.
- D. A. H. Hanaor, L. Hud, W. H. Kan, G. Proust, M. Foley, I. Karaman and M. Radovic, Mater. Sci. Eng., A, 2016, 672, 247–256 CrossRef CAS.
- Y. Bai, N. Srikanth, C. K. Chua and K. Zhou, Crit. Rev. Solid State Mater. Sci., 2017, 44, 56–107 CrossRef.
- J. P. Palmquist, S. Li, P. O. A. Persson, J. Emmerlich, O. Wilhelmsson, H. Högberg, M. I. Katsnelson, B. Johansson, R. Ahuja, O. Eriksson, L. Hultman and U. Jansson, Phys. Rev. B: Condens. Matter Mater. Phys., 2004, 70, 1–13 CrossRef.
- M. Magnuson and M. Mattesini, Thin Solid Films, 2017, 621, 108–130 CrossRef CAS.
- P. Eklund, M. Beckers, U. Jansson, H. Högberg and L. Hultman, Thin Solid Films, 2010, 518, 1851–1878 CrossRef CAS.
- Y. C. Zhou, X. H. Wang, Z. M. Sun and S. Q. Chen, J. Mater. Chem., 2001, 11, 2235–2339 RSC.
- T. E. Raghy and M. W. Barsoum, J. Am. Ceram. Soc., 1999, 82(10), 2849–2854 CrossRef.
- T. Lapauwa, K. Lambrinoub, T. Cabioc, J. Halimd, J. Lud, A. Pesachf, O. Rivinf, O. Ozeri, E. N. Caspif, L. Hultmand, P. Eklund, J. Rosénd, M. W. Barsoum and J. Vleugels, J. Eur. Ceram. Soc., 2016, 36, 1847–1853 CrossRef.
- J. Etzkorn, M. Ade and H. Hillebrecht, Inorg. Chem., 2007, 46, 7646–7653 CrossRef CAS PubMed.
- B. Anasori, M. Dahlqvist, J. Halim, E. J. Moon, j. Lu, B. C. Hosler, E. N. Caspi, S. J. May, L. Hultman, P. Eklund, J. Rosen and M. W. Barsoum, J. Appl. Phys., 2015, 118, 094304–094314 CrossRef.
- A. Mockute, M. Dahlqvist, L. Hultman, P. O. A. Persson and J. Rosen, J. Mater. Sci., 2013, 48, 3686–3691 CrossRef CAS.
- Y. Xu, X. Bai, X. Zha, Q. Huang, J. He, K. Luo, Y. Zhou, T. C. Germann, J. S. Francisco and S. Du, J. Chem. Phys., 2015, 143, 114701–114707 CrossRef PubMed.
- X. He, Y. Bai, Y. Li, C. Zhub and M. Li, Solid State Commun., 2009, 149, 564–566 CrossRef CAS.
- J. Huang, H. Wand, M. LIb, Y. Zang, J. Zaua, X. LI, W. Shui, Y. LI, X. Fan, Q. Wend, X. Xiaod and Q. Huang, J. Adv. Ceram., 2021, 10(5), 1–8 Search PubMed.
- K. Rajavel, X. Yu, P. Zhu, Y. Hu, R. Sun and C. Wong, Langmuir, 2014, 30(2), 592–601 CrossRef CAS PubMed.
- S. Uzun, M. Han, C. J. Strobel, K. Hantanasirisakul, A. Goad, G. Dion and Y. Gogotsi, Carbon, 2021, 174, 382–389 CrossRef CAS.
- M. Han, C. E. Shuck, R. Rakhmanov, D. Parchment, B. Anasori, C. M. Koo, G. Friedman and Y. Gogosti, ACS Nano, 2020, 14, 5008–5016 CrossRef CAS PubMed.
- T. A. Prikhna, O. P. Ostash, A. S. Kuprin, V. Y. Podhurska, T. B. Serbenyuk, E. S. Gevorkyan, M. Rucki, W. Zurowski, W. Kucharczyk, V. B. Sverdun, M. V. Karpets, S. S. Ponomaryov, B. D. Vasyliv, V. E. Moshchil and M. A. Bortnitskaya, Compos. Struct., 2021, 277, 114649 CrossRef.
- W. khon and L. J. sham, Phys. Rev., 1965, 140(4A), A1133–A1138 CrossRef.
- S. J. Clark, M. D. Segall, C. J. Pickard, P. J. Hasnip, M. I. J. Probert, K. Refson and M. C. Payne, Z. Kristallogr., 2005, 220, 567–570 CAS.
- N. Troullier and J. L. Martins, Phys. Rev. B: Condens. Matter Mater. Phys., 1991, 43, 1993–2006 CrossRef CAS PubMed.
- D. R. Hamann, Phys. Rev. B: Condens. Matter Mater. Phys., 1989, 40, 2980–2987 CrossRef PubMed.
- H. J. Monkhorst and J. D. Pack, Phys. Rev. B: Solid State, 1976, 13(12), 5188–5192 CrossRef.
- T. H. Fischer and J. Almlof, J. Phys. Chem., 1992, 96, 9768–9774 CrossRef CAS.
- R. P. Feynmann, Forces in Molecules, Phys. Rev., 1939, 56, 340–343 CrossRef.
- J. P. Perdew and M. E. K. Burke, J. Chem. Phys., 1996, 105, 9982–9985 CrossRef CAS.
- H. Hsu, P. Blaha, M. Cococcioni and R. M. Wentzcovitch, Phys. Rev. Lett., 2011, 106, 118501–118504 CrossRef PubMed.
- R. D. L. Kronig, J. Opt. Soc. Am., 1926, 12(6), 547–557 CrossRef CAS.
- K. Xiong, J. Robertson and S. J. Clark, Appl. Phys. Lett., 2006, 89, 022907 CrossRef.
- D. Mainprice and M. Humbert, Surv. Geophys., 1994, 15, 575–592 CrossRef.
- M. Hadi, M. Roknuzzaman, A. Chroneos, S. Naqib, A. Islam, R. Vovk and K. Ostrikov, Comput. Mater. Sci., 2017, 137, 318–326 CrossRef CAS.
- X. Gonze and C. Le, Phys. Rev. B: Condens. Matter Mater. Phys., 1997, 55, 10355–10368 CrossRef CAS.
- A. Candan, S. Akbudak, Ş. Uğurc and G. Uğurc, J. Alloys Compd., 2019, 771, 664–673 CrossRef CAS.
- M. W. Qureshi, X. Ma, G. Tang and R. Paudel, Materials, 2020, 13, 5148 CrossRef CAS PubMed.
- M. Nadeem, M. Haseeb, A. Hussain, A. Javed, M. A. Rafiq, M. Ramzan, M. N. Rasul and M. Azhar Khan, J. Mater. Res. Technol., 2021, 15, 521–532 CrossRef.
- M. T. Nasir, M. A. Hadi, S. H. Naqib and F. Parvin, Int. J. Mod. Phys. B, 2014, 28(32), 1–16 CrossRef.
- Y. Mo, P. Rulis and W. Y. Ching, Phys. Rev. B: Condens. Matter Mater. Phys., 2012, 86, 1–10 CrossRef.
- M. S. Ali, M. A. Rayhan, M. A. Ali, R. Parvin and A. K. M. A. Islam, J. Sci. Res., 2016, 8(2), 109–117 CrossRef CAS.
- M. I. Hussain, R. M. A. Khalil, F. Hussain, M. Imran, A. M. Rana and S. Kim, Mater. Sci. Semicond. Process., 2020, 113, 105064–105069 CrossRef CAS.
- M. I. Hussain, R. M. A. Khalil, F. Hussain, A. M. Rana and M. Imran, J. Mol. Graphics Modell., 2020, 99, 1–11 CrossRef PubMed.
- M. A. Hadi, M. Roknuzzaman, F. Parvin, S. H. Naqib, A. K. M. A. Islam and M. Aftabuzzaman, J. Sci. Res., 2014, 6(1), 11–27 CrossRef.
- M. T. Nasir and A. K. M. A. Islam, Comput. Mater. Sci., 2012, 65, 365–371 CrossRef CAS.
- Y. Bai, X. He and R. Wang, J. Raman Spectrosc., 2015, 46(9), 784–794 CrossRef CAS.
- R. M. A. Khalil, F. Hussain, A. M. Rana, M. Imran and G. Murtaza, Phys. E, 2019, 106, 338–345 CrossRef.
- M. T. Nasir and A. K. M. A. Islam, Comput. Mater. Sci., 2012, 65, 365–371 CrossRef CAS.
- Y. Li, Y. Gao, B. Xiao, T. Mina, Y. Yanga, S. Maa and D. Yia, J. Alloys Compd., 2011, 509, 5242–5249 CrossRef CAS.
- M. Peng, R. Wang, Y. Wu, A. Yang and Y. Duan, Vacuum, 2021, 110715 Search PubMed.
- W. Voigt, Lehrbuch der Kristallphysik, B. G. Teubner, Leipzig, Berlin, 1928 Search PubMed.
- A. Reuss, Z. Angew. Math. Mech., 1929, 9, 49–58 CrossRef CAS.
- R. Hill, Proc. Phys. Soc., 1952, 65, 349354 Search PubMed.
- Z. Sun, D. Music, R. Ahuja and J. M. Schneider, Phys. Rev. B: Condens. Matter Mater. Phys., 2005, 71, 193402–193403 CrossRef.
- X. Q. Chen, H. Niu, D. Li and Y. Li, Intermetallic, 2011, 19, 1275–1281 CrossRef CAS.
- M. Roknuzzaman, M. A. Hadi, M. J. Abden, M. T. Nasir, A. K. M. A. Islam, M. S. Ali, K. Ostrikov and S. H. Naqib, Comput. Mater. Sci., 2016, 113, 148–153 CrossRef CAS.
- Y. Bai, X. Qi, A. Duff, N. Li, F. Kong, X. He, R. Wang and W. E. Lee, Acta Mater., 2017, 132, 69–81 CrossRef CAS.
- Y. Bai, X. Qi, X. He, D. Sun, F. Kong, Y. Zheng, R. Wang and A. L. Duff, J. Am. Ceram. Soc., 2019, 102, 3715–3727 CrossRef CAS.
- Y. Bai, X. He, Y. Sun, C. Zhu, M. Li and L. Shi, Solid State Sci., 2010, 12, 1220–1225 CrossRef CAS.
- L. F. He, Z. J. Lin, J. Y. Wang, Y. W. Bao, M. S. Li and Y. C. Zhou, Synthesis and characterization of bulk Zr2Al3C4 ceramic, J. Am. Ceram. Soc., 2007, 90(11), 3687–3689 CrossRef CAS.
- R. M. A. Khalil, F. Hussain, M. I. Hussain, A. Parveen, M. Imran, G. Murtaza, M. A. Sattar, A. M. Rana and S. Kim, J. Alloys Compd., 2020, 827, 154255–154257 CrossRef CAS.
| This journal is © The Royal Society of Chemistry 2022 |

