
 Open Access Article
 This Open Access Article is licensed under a Creative Commons Attribution-Non Commercial 3.0 Unported Licence
An effective and recyclable decolorization method for polysaccharides from Isaria cicadae Miquel by magnetic chitosan microspheres†
Bingbing Yu‡
a,
Yao Chen‡c,
Lijun Zhu‡c,
Mengmeng Bana,
Li Yanga,
Yeda Zenga,
Shijie Lic,
Chunzhi Tangc,
Danyan Zhang *a and
Xiaoqing Chen*b
*a and
Xiaoqing Chen*b
aSchool of Pharmaceutical Sciences, Guangzhou University of Chinese Medicine, Guangzhou 510006, Guangdong, PR China. E-mail: danyan64@163.com
bThe First Affiliated Hospital of Guangzhou University of Chinese Medicine, Guangzhou 510405, Guangdong, China. E-mail: chenxiaoqing86@163.com
cClinical Medical College of Acupuncture Moxibustion and Rehabilitation, Guangzhou University of Chinese Medicine, Guangzhou 510006, Guangdong, PR China
First published on 24th January 2022
Abstract
The purpose of this research was to develop an efficient and non-destructive method for decolorizing of polysaccharides extracted from Isaria cicadae Miquel by magnetic chitosan microspheres (MCM). The optimum decolorization parameters were achieved by response surface methodology as follows: the MCM amount was 8.0%, the adsorption temperature was 48 °C, the adsorption time was 82 min and the pH was 7. Under these optimal conditions, the Dr%, Rr%, and Kc were 90.31 ± 0.12%, 95.40 ± 0.11% and 19.66 ± 0.49, respectively. MCM adsorption of pigment molecules was a spontaneous and endothermic process that could be fitted with the pseudo-second-order equation and the Freundlich equation. Besides, the adsorption mechanism could be controlled by multiple-diffusion steps, including film diffusion and intra-particle diffusion. Furthermore, MCM is a recyclable material. Adsorption with MCM is a promising method to remove pigment molecules of polysaccharide, it may replace the traditional decolorization method.
1. Introduction
Polysaccharide is one of the substances that maintain life activities,1 existing in animals, plants, algae and fungi.2 Nowadays, much research has proved that entomogenous fungi (such as Cordyceps sinensis) are rich in polysaccharides, and their bioactivities are closely related to polysaccharides.3,4 Isaria cicadae Miquel (I. cicadae) is an entomogenous fungi, and has a long history of application in functional food and medicine in traditional Chinese medicine. It has been reported that I. cicadae possesses a variety of pharmacological activities, such as antitumor, antioxidation, and immunomodulatory activity.5 In addition, in previous studies, we found that I. cicadae is rich in polysaccharides.6 However, in the extraction process, we found that Isaria cicadae Miquel polysaccharides (ICMP) contains a lot of pigments. These pigments contaminate the ion exchange column and cause a lot of waste.7 At the same time, the in-depth research and further application of ICMP are also restricted due to the influence of pigments on its biological activity. Therefore, it is very important to decolorize before separating and purifying polysaccharides.Several typical and traditional decolorization methods are wildly used in the field of polysaccharides, such as activated carbon adsorption and hydrogen peroxide oxidation.8,9 Unfortunately, low selectivity of activated carbon leads to high loss rate of polysaccharide.7 The separation of activated carbon by filtration or centrifugation is very tedious and may also result in the loss of polysaccharide. The structure and some functional groups of polysaccharide will be destroyed under the oxidation of hydrogen peroxide. Besides, the strong oxidizing properties of H2O2 will lead to the complete loss of the antioxidant capacity of polysaccharide.10 Although macroporous resin has a good decolorization effect, there are many types and the screening process is complicated. Therefore, an efficient and non-destructive decolorization method needs to be developed urgently.
Magnetic chitosan microsphere (MCM), a kind of high polymer material, has good adsorption properties for dyes, proteins and metal ions due to lots of primary amino and hydroxyl groups.11 Furthermore, MCM has the characteristics of metal ion adsorption and magnetic material for easy magnetic separation and recovery,12 which overcome the disadvantage of traditional decolorization methods. In our previous study, MCM was synthesized and applied to deproteinization of polysaccharide. Meanwhile, MCM was characterized by scanning electron microscopy and other techniques.13 We found that MCM is a magnetic microsphere with smooth surface and diameter of 2–6 μm. It mainly contains C, O and Fe, and has good deproteinization effect.13 MCM is non-toxic, biocompatible, hydrophilic and biodegradable. It has been used in the treatment of environmental pollutants, biotechnology, biomedicine and other fields. However, to the best of our knowledge, there is no report about the MCM used in decolorization of polysaccharide.
In this research, a new method of removing pigments by MCM in the field of polysaccharide decolorization was developed. Firstly, parameters influencing decolorization efficiency were optimized by response surface method. Then we studied the adsorption kinetics and adsorption thermodynamics models. Finally, under the optimal condition, the desorption and regeneration capacity were measured. In addition, the polysaccharide before and after decolorization were characterized.
2. Experimental
2.1 Materials and reagents
The I. cicadae was purchased from Qingping Herbal Medicine market (Guangzhou, China). Chitosan (degree of deacetylation was 95%, viscosity was 100–200 mPa s) and Fe3O4 (average particle diameter: 20 nm) was obtained from Aladdin Chemical Co., Ltd. (Shanghai, China). Ethanol absolute, acetic acid, petroleum ether, paraffin liquid, Span 80, Tween 80, n-butanol and sodium hydroxide (NaOH) were obtained from Zhiyuan Chemical Reagents Co., Ltd. (Tianjin, China). Glutaric dialdehyde was obtained from Kermel Chemical Reagents Co., Ltd. (Tianjin, China). Hydrochloric acid was obtained from Guangzhou Chemical Reagent Factory (Guangzhou, China). Deionized water was prepared by Aquaplore Water Purification system (Aquaplore, DE, USA). The reagents used in the experiment were analytical grade unless otherwise specified.2.2 Preparation of ICMP and MCM
The ICMP was extracted by water and precipitated by ethanol according to the reported method,6 and the protein was removed using the Sevag reagent.14 MCM was prepared by the microemulsion process which our previously reported.13 In brief, chitosan was dissolved in 3% acetic acid, and then Fe3O4 was added under high-speed stirring, and mix well as the aqueous phase. The aqueous phase was mixed with the oil phase, and then the crosslinking agent was added. The pH value was adjusted to 9, and the MCM was obtained after washing and drying.2.3 Analytical methodology
| Dr (%) = (AD0 − AD1)/AD0 × 100% | (1) |
| Rr (%) = AR1/AR0 × 100% | (2) |
| Kc = Dr (%)/(100 − Rr (%)) | (3) |
2.4 Adsorption experiment
| Factors | Unit | Symbols | Level of factors | ||
|---|---|---|---|---|---|
| −1 | 0 | 1 | |||
| Amount of MCM | % | A | 6.0 | 8.0 | 10.0 |
| Adsorption temperature | °C | B | 40.0 | 50.0 | 60.0 |
| Adsorption time | min | C | 60.0 | 80.0 | 100.0 |
| pH | — | D | 6.0 | 7.0 | 8.0 |
| No. | A | B | C | D | Kc |
|---|---|---|---|---|---|
| 1 | −1 | −1 | 0 | 0 | 16.1931 |
| 2 | 0 | −1 | 1 | 0 | 17.8333 |
| 3 | 0 | 1 | 1 | 0 | 13.9689 |
| 4 | 0 | 1 | −1 | 0 | 14.4795 |
| 5 | −1 | 0 | −1 | 0 | 14.2447 |
| 6 | 1 | 0 | 0 | 1 | 7.31365 |
| 7 | 1 | 0 | −1 | 0 | 13.113 |
| 8 | 0 | 0 | 0 | 0 | 19.2376 |
| 9 | 0 | −1 | −1 | 0 | 14.2202 |
| 10 | 0 | 0 | −1 | −1 | 13.2757 |
| 11 | 0 | −1 | 0 | −1 | 12.136 |
| 12 | −1 | 0 | 0 | −1 | 10.2699 |
| 13 | −1 | 1 | 0 | 0 | 10.5673 |
| 14 | 0 | 0 | 0 | 0 | 19.7802 |
| 15 | 0 | 0 | 0 | 0 | 20.053 |
| 16 | 0 | 0 | 0 | 0 | 19.597 |
| 17 | 0 | 1 | 0 | −1 | 12.5896 |
| 18 | 0 | 0 | 1 | 1 | 9.68682 |
| 19 | 0 | 0 | 1 | −1 | 12.4086 |
| 20 | 0 | 0 | 0 | 0 | 19.4093 |
| 21 | 1 | 0 | 1 | 0 | 15.9765 |
| 22 | 0 | 1 | 0 | 1 | 8.6802 |
| 23 | 1 | −1 | 0 | 0 | 12.1425 |
| 24 | −1 | 0 | 1 | 0 | 13.5912 |
| 25 | 0 | 0 | −1 | 1 | 9.9243 |
| 26 | 1 | 0 | 0 | −1 | 13.9154 |
| 27 | −1 | 0 | 0 | 1 | 10.1126 |
| 28 | 1 | 1 | 0 | 0 | 15.1809 |
| 29 | 0 | −1 | 0 | 1 | 11.5109 |
2.5 Adsorption studies
2.6 Desorption and regeneration experiments
After the process of static adsorption under optimum conditions was finished, the MCM were separated from ICMP solution with magnet and immersed in 0.5 M NaOH solution for repeated washing until the solution was colorless. Next, repeatedly wash the MCM with distilled water until the solution is neutral. Afterwards, MCM were activated by soaked in 0.2% glutaraldehyde solution for 30 min. Activated MCM were used to desorption and regeneration assay. The cycles of desorption and regeneration were carried out for 6 times. Pigment adsorption rate of polysaccharide were determined as described in Section 2.3.2.7 Comparison of characterization of samples before and after decolorization with MCM
The ICMP sample solution was characterized by UV-vis spectroscopy and FT-IR (Nicolet iS50, Thermo Fisher, USA) as reported methods.18 In order to obtain concentration of total carbohydrates, Vis spectra in the 400–600 nm was determined after sulfuric acid phenol coloration. In addition, the ICMP sample solutions before and after decolored by MCM were photographed by a Canon SX70 HS digital camera.2.8 Statistical analysis
All data were expressed as means ± standard deviation (SD) and statistical analyses were conducted by SPSS (Statistical Product and Service Solutions, Version 18.0, SPSS Inc., Chicago, IL, USA). Statistical difference was existed if P < 0.05.3. Results and discussion
3.1 Single factor effect on decolorization efficiency
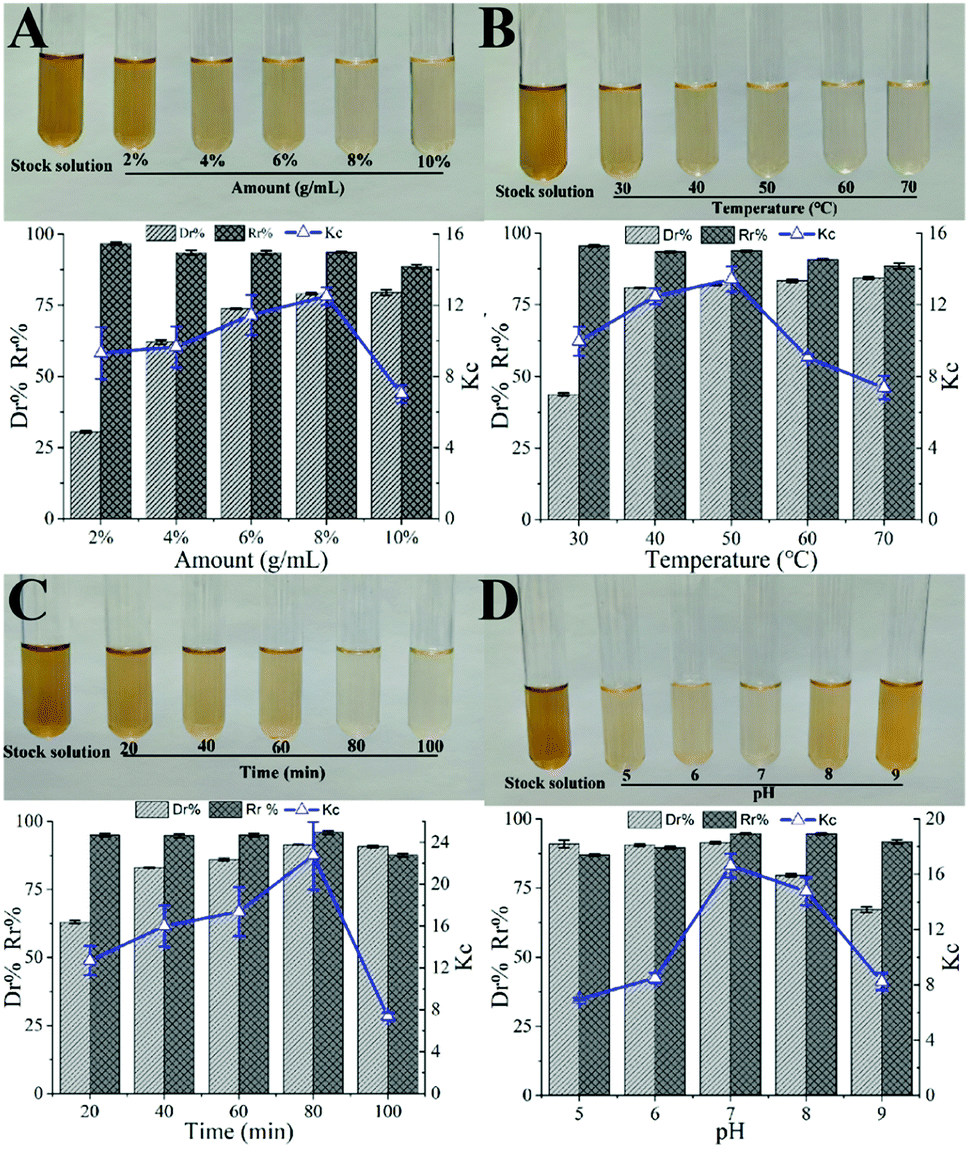 | ||
| Fig. 1 Effects of different amount of MCM (A), adsorption temperature (B), adsorption time (C) and pH value (D) on the efficiency of decolorization (n = 3). | ||
3.2 Optimization of decolorization conditions
| Y = 19.62 + 0.22A − 0.71B + 0.35C − 1.45D + 2.17AB + 0.88AC − 1.61AD − 1.03BC − 0.82BD + 0.16CD − 3.37A2 − 2.51B2 − 2.11C2 − 5.97D2 |
The results of ANOVA study, which used to evaluate the significance of the regression equation in model are shown in Table 3. The F-value of model was 79.55 (P < 0.01) which can be confirmed that the model is highly significant. The “Lack of Fit P-value” of 0.1005 (P > 0.05) indicated that the lack of fit is not significant relative to the pure error. The value of Pred R-squared (0.9333) is in reasonable agreement with the value of Adj R-squared (0.9752). In this case, the results also shown that B, C, D, AB, AC, AD, BC, BD, A2, B2, C2, D2 are significant model terms (P < 0.05).
| Source | SS | DF | MS | F-value | P-value | Significance |
|---|---|---|---|---|---|---|
| a R2 = 0.9876, Radj2 = 0.9752, “**” was very significant (P < 0.01), “*” was significant (P < 0.05), SS denotes sum of squares; DF denotes degree of freedom; MS denotes mean square. | ||||||
| Model | 346.29 | 14 | 24.74 | 79.55 | <0.0001 | ** |
| A | 0.59 | 1 | 0.59 | 1.90 | 0.1896 | |
| B | 6.12 | 1 | 6.12 | 19.68 | 0.0006 | ** |
| C | 1.48 | 1 | 1.48 | 4.75 | 0.0470 | * |
| D | 25.13 | 1 | 25.13 | 80.83 | <0.0001 | ** |
| AB | 18.77 | 1 | 18.77 | 60.36 | <0.0001 | ** |
| AC | 3.09 | 1 | 3.09 | 9.94 | 0.0070 | ** |
| AD | 10.38 | 1 | 10.38 | 33.39 | <0.0001 | ** |
| BC | 4.25 | 1 | 4.25 | 13.67 | 0.0024 | ** |
| BD | 2.70 | 1 | 2.70 | 8.67 | 0.0107 | * |
| CD | 0.099 | 1 | 0.099 | 0.32 | 0.5813 | |
| A2 | 73.63 | 1 | 73.63 | 236.78 | <0.0001 | ** |
| B2 | 40.83 | 1 | 40.83 | 131.31 | <0.0001 | ** |
| C2 | 28.78 | 1 | 28.78 | 92.55 | <0.0001 | ** |
| D2 | 231.08 | 1 | 231.08 | 743.17 | <0.0001 | ** |
| Residual | 4.35 | 14 | 0.31 | |||
| Lack of fit | 3.95 | 10 | 0.39 | 3.91 | 0.1005 | |
| Pure error | 0.40 | 4 | 0.10 | |||
| Cor. total | 350.65 | 28 | ||||
It can be seen from Fig. 2, that the opening of each response surface is downward, and there is a highest point, indicating that the response surface plots have a slope. When other factors remain unchanged, as a certain factor increases, the response value increases. When the response value reaches the extreme value, the factor increases but the response value gradually decreases, indicating that there is an interaction between the factors. As shown in Fig. 2, when other factors are fixed, the contour plots are oval, but the density of contour plots lines are not the same, showing that there is an interaction between factors, but the strengths of interaction are different.
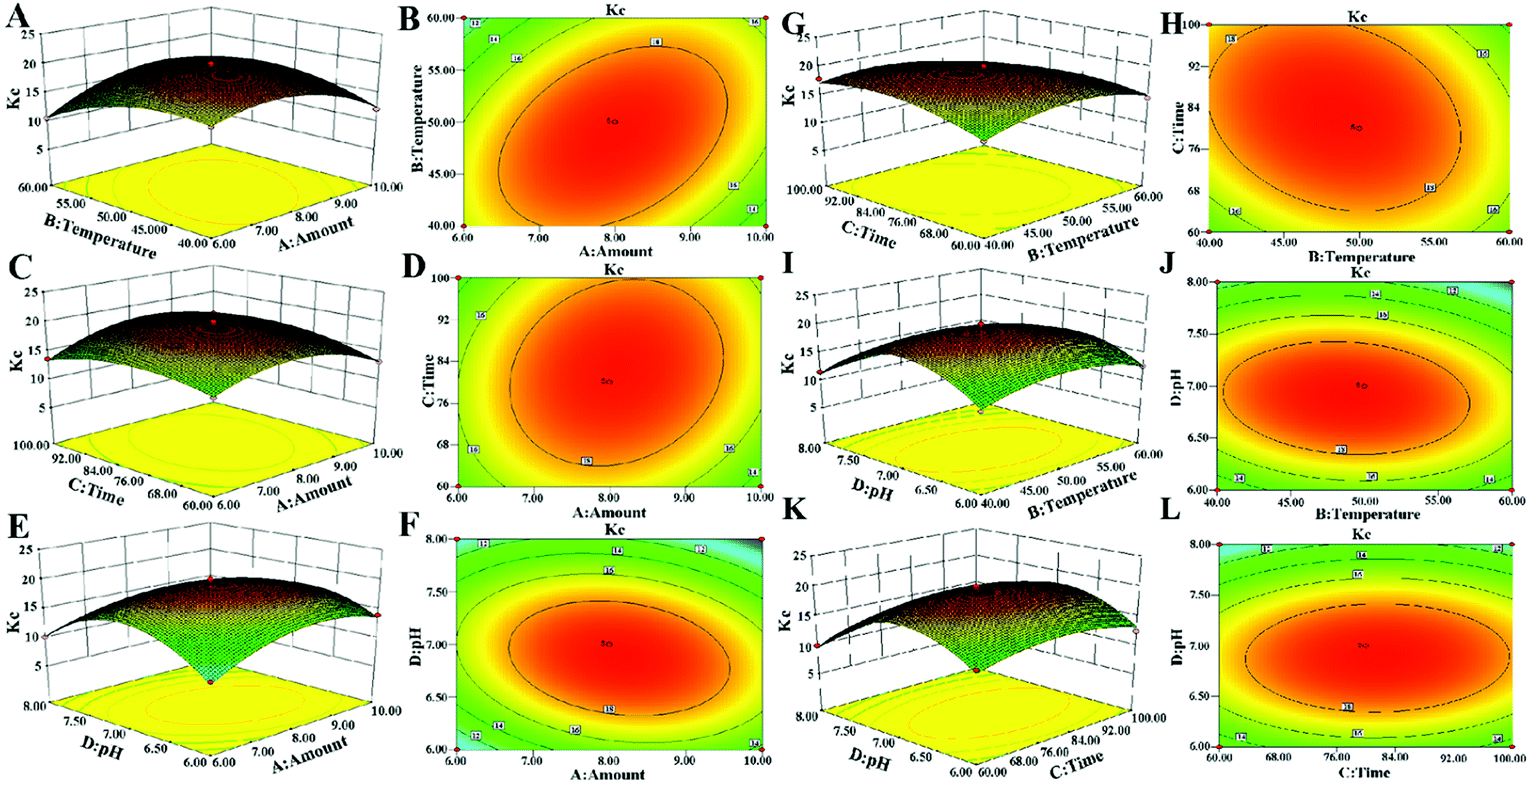 | ||
| Fig. 2 Response surface plots for the mutual effects and contour plots of amount of MCM and temperature (A and B), amount of MCM and time (C and D), amount of MCM and pH (E and F), temperature and time (G and H), temperature and pH (I and J), pH and time (K and L) on the values of Kc. | ||
3.3 Adsorption kinetics study
The study of adsorption kinetics can help us understand the dynamic interaction between pigments and adsorbents.20 In this study, the pseudo-first-order, pseudo-second-order kinetic models,21,22 Elovich kinetic model and intra-particle diffusion kinetic model have been employed to study the mechanism of adsorption process of MCM for pigment molecule.23The pseudo-first-order kinetics model equation could be expressed as follows:
ln(qe − qt) = ln![[thin space (1/6-em)]](https://www.rsc.org/images/entities/char_2009.gif) qe − k1t qe − k1t
| (4) |
The pseudo-second order kinetics model is generally written as follows:
| t/qt = 1/(k2qe2) + t/qe | (5) |
The Evolich kinetic model is widely used in the study of adsorption kinetics of solid/liquid systems. Its general form is as follows:
| qt = (1/β) × ln(αβ) + (1/β) × ln(t) | (6) |
The intra-particle diffusion model is often reported to reveal the adsorption reaction mechanism, and its expression is as follows:
| qt = Kidt1/2 + C | (7) |
Here the dimensionless concentration of pigment in the ICMP solution was defined as A/A0. Therefore, the adsorption capacity of the adsorbent to the pigment in the ICMP solution was calculated as [((A0 − A)/A0)/m].24
The change process of ICMP adsorption capacity qt on MCM with time (t) at different temperatures were shown in Fig. 3A. It can be seen from the figure that the adsorption capacity of MCM for ICMP increases with time at three temperatures, and the adsorption speed is faster in the first 40 minutes, then increases slowly, and finally tends to equilibrium. In addition, temperature has a certain effect on the adsorption capacity of MCM. With the increase of temperature within a certain range, the adsorption rate and adsorption capacity of MCM also increase. These results were coincided with the results of the adsorption temperature experiments.
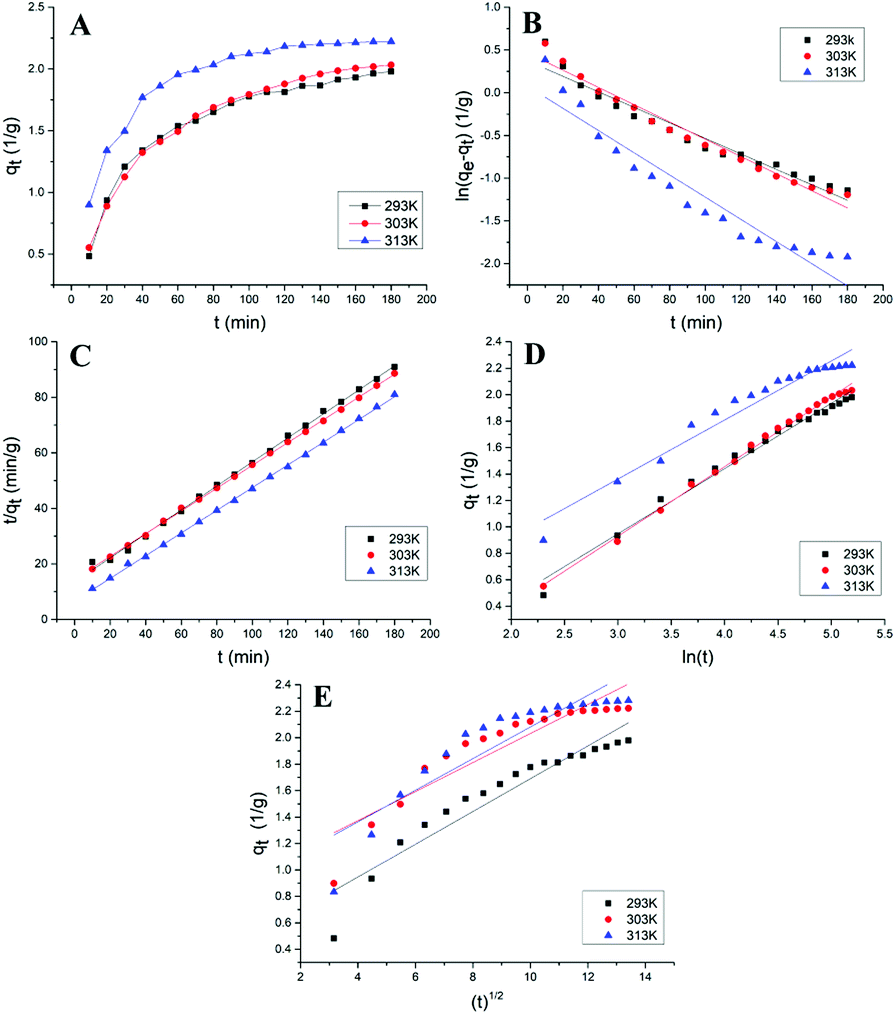 | ||
| Fig. 3 Adsorption kinetics curves (A), linear plots of the pseudo-first-order kinetic model (B), the pseudo-second-order kinetic model (C), the Evolich kinetic model (D) and the intra-particle diffusion model (E) at different temperature. | ||
Kinetic plots for the pseudo-first-order, the pseudo-second-order reactions, the Elovich kinetic model and intra-particle diffusion kinetic model of the adsorption of ICMP onto MCM at different temperature are shown in Fig. 3. Values of these model constants are given in Table 4.
| T (K) | qe, exp (g−1) | Pseudo-first-order | Pseudo-second-order | Elovich | Intra-particle diffusion | ||||||||
|---|---|---|---|---|---|---|---|---|---|---|---|---|---|
| qe, cal (g−1) | k1 | R2 | qe, cal (g−1) | k2 | R2 | α | β | R2 | Kid | C | R2 | ||
| 293 | 2.297 | 1.453 | 0.0091 | 0.9501 | 2.313 | 0.0138 | 0.9983 | 0.1672 | 2.025 | 0.9859 | 0.1239 | 0.4509 | 0.9035 |
| 303 | 2.335 | 1.085 | 0.0145 | 0.9358 | 2.446 | 0.0254 | 0.9995 | 0.4707 | 2.242 | 0.9545 | 0.1097 | 0.9347 | 0.8405 |
| 313 | 2.368 | 1.140 | 0.0162 | 0.9324 | 2.532 | 0.0228 | 0.9988 | 0.3835 | 2.046 | 0.9432 | 0.1194 | 0.8865 | 0.8200 |
It can be seen from the Table 4, that the pseudo-first-order model and pseudo-second-order model have good adaptability for describing the adsorption process of ICMP pigment on MCM. But compared with the pseudo-first-order model, the pseudo-second-order model has a better fitting degree and can more accurately describe the adsorption process of ICMP pigment on MCM. In addition, the qe value in the pseudo-second-order model is closer to the experimental value. All these results indicated that the adsorption kinetic data was better fitted by the pseudo-second-order model. The linear plot of ln(qe − qt) versus t (Fig. 3B) and t/qt versus t (Fig. 3C) also confirmed the above results.
According to the Table 4, the Elovich model equation fitting has a high correlation (Fig. 3D). Since the Elovich equation is a description of the heterogeneous diffusion process comprehensively controlled by the reaction rate and the diffusion factor, it suggests that the adsorption of the ICMP pigment by MCM is a heterogeneous diffusion process. It is not a simple reaction, but a process controlled by reaction rate and diffusion.
The adsorption rate is determined by the adsorption mechanism and the rate-limiting step. It is generally believed that the adsorption process of the adsorbent to the substrate mainly includes the following three steps: ① liquid-film diffusion; ② intra-particle diffusion; ③ adsorption reaction. In general, the reaction speed of the third step is very fast, so liquid film diffusion or (and) intra-particle diffusion is the control step of the entire adsorption reaction.25 According to the experimental data of kinetics, the qt − t1/2 graph can be drawn. If the graph shows straight line and passes through the origin, it means that the adsorption process is only controlled by the intra-particle diffusion. If the graph gives a multi-linear characteristic or does not pass the origin, it suggests that the intra-particle diffusion is not the only rate-limiting step of the reaction.26 As seen from Fig. 3E, the plot does not pass through the origin, which indicates that the intra-particle diffusion is not the only rate limiting step of reaction. Moreover, according to the scatter diagram, the plot can be roughly divided into two parts, indicating that the adsorption mechanism of ICMP on MCM may be controlled by multiple-diffusion steps, including film diffusion and intra-particle diffusion.25 The R2 of intra-particle diffusion is relatively small, which also proves this point (Table 4).
3.4 Adsorption isotherm analysis
In this study, the Langmuir, Freundlich and Temkin equations have been employed to study the adsorption isotherm of MCM for ICMP pigment. The Langmuir model is an isotherm model widely used to describe the performance of adsorbents. It is assumed that the binding sites have the same adsorption energy for each molecule, and there is no interaction between the adsorbed molecules. The monolayer adsorption occurs on the adsorbent with uniform surface structure.27 The linear form of Langmuir isotherm is represented as the following equation:| Ce/qe = Ce/qmax + 1/(KLqmax) | (8) |
In contrast to the Langmuir model, the Freundlich adsorption isotherm is used to describe a kind of adsorption process on heterogeneous surfaces.25 The Freundlich model is expressed as follows:
|
lnqe = lnKf + lnCe/n
| (9) |
The Temkin isotherm model assumed that the heat of adsorption decreases linearly with surface coverage of adsorbent as a result of adsorbent or adsorbate interactions.28 It has generally been applied in the following form:
|
qe = RT/bT × (lnA) + RT/bT × (lnCe)
| (10) |
As shown in Fig. 4A, the adsorption isotherms at different temperatures were similar, with the increases of temperatures, qe gradually increased. Isotherm plots for the Langmuir model, the Freundlich model and the Temkin model of the adsorption of ICMP onto MCM at different temperature are shown in Fig. 4B–D, values of these model constants are given in Table 5.
 | ||
| Fig. 4 Line of isothermal adsorption at different temperatures (A), linear plots of the Langmuir (B), Freundlich (C) and Temkin (D) models at different temperature. | ||
| T (K) | Langmuir | Freundlich | Temkin | ||||||
|---|---|---|---|---|---|---|---|---|---|
| qmax (g−1) | KL | R2 | Kf | n | R2 | A | bT (J mol−1) | R2 | |
| 293 | 2.360 | 1.003 | 0.9322 | 1.425 | 1.241 | 0.9985 | 15.735 | 6906.73 | 0.9781 |
| 303 | 2.411 | 0.958 | 0.7669 | 1.494 | 1.252 | 0.9905 | 16.798 | 7090.18 | 0.9539 |
| 313 | 2.517 | 1.087 | 0.8920 | 1.635 | 1.237 | 0.9962 | 17.713 | 7081.04 | 0.9745 |
From the data in Table 5, it can be found that in the Langmuir equation constants, the value of qmax increase with the increase of temperature, indicating that the pigment in ICMP is more likely to be adsorbed on MCM at higher temperatures. However, the R2 value of Langmuir fitting equation is small, which indicates that the adaptation of ICMP pigment onto MCM do not fit well with Langmuir model. In the Freundlich isotherm, n represent the type of adsorption isotherm as follows: favorable (0 < 1/n < 1), irreversible (1/n = 0), or unfavorable (1/n > 1).26 From Table 5, we found that, all the values of n are higher than 1, which indicated that pigment in ICMP were adsorbed favorably by the MCM during this study. The value of Kf is related to adsorption capacity of MCM and the value of Kf (Table 5) increases with the increase of temperature, indicating that the adsorption process is endothermic in nature. According to the intercept and slope of Fig. 4D, the Temkin constants A and bT can be obtained (Table 5). The value of A increases with the increase of temperature, indicating that the strength of the interaction between ICMP and MCM also increases. bT is related to the heat of adsorption, and it also tends to increase as the temperature rises.
Based on these results, both Freundlich and Temkin models could be used to fit the equilibrium data. However, the R2 value of Freundlich model is higher than that of Temkin model (Table 5). This implies that the Freundlich model may be more suitable to predict the adsorption ability of MCM on the pigment in ICMP.
3.5 Thermodynamic analysis of adsorption
Gibbs free energy (ΔG), enthalpy change (ΔH) and entropy change (ΔS) are important parameters of adsorption thermodynamics. Their values can be calculated from the following equations:The value of ΔH can be calculated using the Clausius–Clapeyron equation:29
| dln(Ce)/dT = −ΔH/RT2 | (11) |
After integral calculated it may be linearized as:30
|
lnCe = ΔH/RT + C
| (12) |
Ce versus 1/T curve (figure not shown).
Because the Freundlich model is more suitable for this adsorption process, the ΔG and ΔS value can be calculated by equation below as shown by:30
| ΔG = −nRT | (13) |
| ΔS = (ΔH − ΔG)/T | (14) |
The parameters of thermodynamic are shown in Table 6. At different temperatures, all ΔG values are negative, which suggests that the adsorption of pigment in ICMP on MCM is a spontaneous process. In addition, the value of ΔG decreased with the increase of temperature, indicating that higher temperature is conducive to the adsorption, which is consistent with the results of adsorption equilibrium study. The absolute value of ΔG is less than 20 kJ mol−1, indicating the involvement of physical adsorption.25 Because ΔH > 0, but less than 30 kJ mol−1, we believe that the adsorption process is an endothermic process, and physical adsorption is the main one.31 Table 6 shows that the values of entropy change (ΔS) were both positive, which indicates an increase in the randomness at the solid/liquid interface during the adsorption process.27
| qe (g−1) | ΔH (kJ mol−1) | ΔG (kJ mol−1) | ΔS (J (mol−1 K−1) | ||||
|---|---|---|---|---|---|---|---|
| 293 K | 303 K | 313 K | 293 K | 303 K | 313 K | ||
| 0.1 | 6.070 | −3.023 | −3.154 | −3.219 | 31.033 | 30.441 | 29.676 |
| 0.2 | 6.168 | 31.368 | 30.765 | 29.990 | |||
| 0.4 | 6.266 | 31.702 | 31.088 | 30.302 | |||
| 0.6 | 6.323 | 31.897 | 31.277 | 30.485 | |||
| 0.8 | 6.364 | 32.036 | 31.411 | 30.615 | |||
3.6 The material recycling
The desorption and regeneration capacity of the adsorbent is an important criterion for evaluating the quality of the adsorbent. To evaluate the desorption and regeneration property of MCM, adsorption desorption experiments were carried out six times. The Dr% values of the six times adsorption desorption experiments were 90.35%, 90.11%, 89.23%, 87.87%, 85.75% and 83.52%, respectively. After six times adsorption desorption experiments, the value of Dr% decreased from 90.35% to 83.52%. It shows that MCM has good desorption and regeneration ability, and has the potential of development and utilization.3.7 Comparison of characterization of samples before and after decolorization with MCM
In order to validate the decolorization efficiency of MCM, the ICMP solutions before and after treatment by MCM under the above optimal conditions were characterized by digital photography, UV-vis Spectroscopy, Vis Spectroscopy after sulfuric acid phenol coloration and IR Spectroscopy. As shown in Fig. 5A, the pigment absorption peak in the region of 200–800 nm disappeared after MCM treatment, indicating that most of the pigments were removed by the MCM. Meanwhile, the photograph of ICMP solutions before and after adsorption also demonstrated that most of the pigments had been absorbed by MCM. The absorbance at 490 nm of polysaccharide solution after color development by phenol-sulphate acid method represents the concentration of polysaccharide.16 As shown in Fig. 5B, there is no significant difference in the absorbance at 490 nm of the ICMP solution before and after decolorization, indicating that the loss of polysaccharide during the adsorption process is very small. The characterizations of IR Spectroscopy (Fig. 5D) before and after decolorization demonstrated the characteristic groups of ICMP were adequately retained after MCM treatment. The above results show that MCM has good decolorization performance and has little effect on ICMP.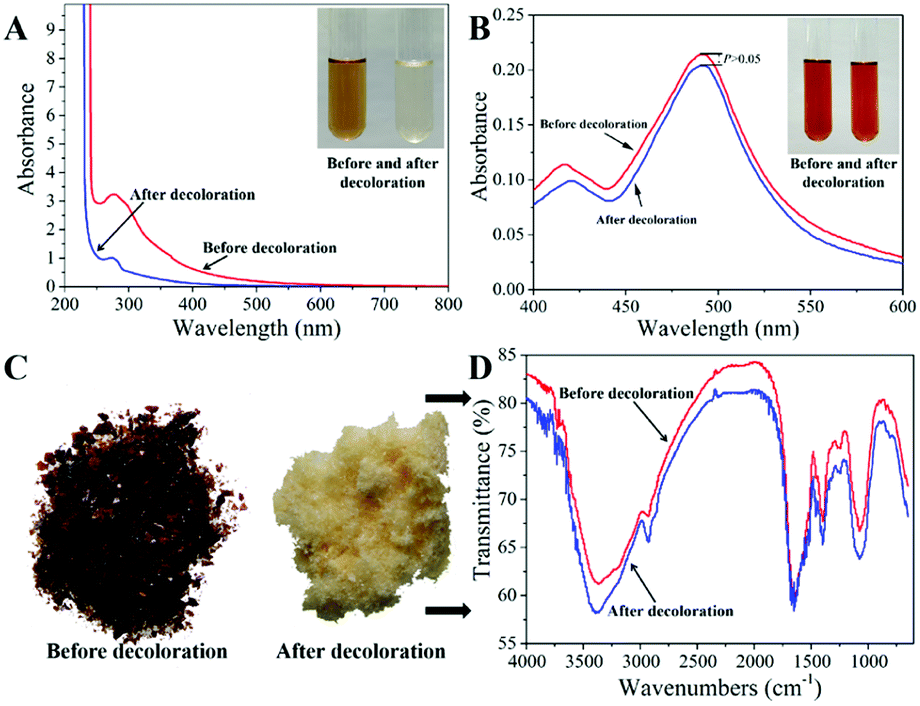 | ||
| Fig. 5 The UV-vis spectrogram (A), Vis spectrogram after sulfuric acid phenol coloration (B), IR spectrogram (C and D) of ICMP solutions before and after decolorization by MCM. | ||
3.8 Comparison of different decolorization methods
In order to verify the decolorization effect of MCM, different decolorization methods were compared (ESI†). As shown in Table 7, MCM presented higher Kc value than that of hydrogen peroxide and activated carbon. The adsorption process of MCM was spontaneous and endothermic. In addition, the adsorption process of MCM is mainly physical adsorption, which has little damage to the structure of polysaccharide. Besides, MCM is a kind of magnetic material, easy to magnetic separation and recovery, and can reduce the waste of polysaccharide in the separation process. Therefore, MCM displayed higher Dr% and Rr% values. The Dr% of activated carbon is low, indicating that its decolorization effect is not good, but because it belongs to physical adsorption, it has no effect on the structure of polysaccharide, its Rr% value is higher than that of hydrogen peroxide. But the separation process of activated carbon is complicated, resulting in some polysaccharide is lost, so its Rr% is lower than MCM. The decolorization process of hydrogen peroxide is chemical decolorization, and the effect is obvious. Its Dr% value is higher than that of activated carbon, which is equivalent to MCM, but because it destroys the structure of polysaccharide, its Rr% value is lower.| Methods | Dr (%) | Rr (%) | Kc |
|---|---|---|---|
| a Data were presented as mean ± SD (n = 3). Superscript “**” represent very significant (P < 0.01) compared with present method. | |||
| Activated carbon adsorption | 80.72 ± 0.64** | 90.14 ± 0.10** | 8.19 ± 0.02** |
| Hydrogen peroxide oxidation | 90.82 ± 0.50 | 86.59 ± 0.04** | 6.77 ± 0.03** |
| Present method | 90.31 ± 0.12 | 95.40 ± 0.11 | 19.66 ± 0.49 |
3.9 Discussion
In this study, the emulsion cross-linking method was used to prepare MCM, and its structure is a shell–core structure. The outer shell of the microsphere is chitosan and the core is Fe3O4.13 The external chitosan has hydrophilic, large specific surface area and more adsorption sites, so MCM has good decolorization effect and high Dr% value.11,32 The internal Fe3O4 makes MCM have magnetic properties, easy to separate from the solution, reducing the loss of polysaccharide. In addition, the results show that the decolorization process of ICMP by MCM is mainly physical adsorption, and has little effect on the structure of polysaccharide, so MCM has high Rr% value. The higher values of Dr% and Rr% proved that MCM was an excellent decolorizing agent under the optimal decolorization conditions.In the study of adsorption mechanism, we found that the decolorization process of ICMP by MCM conformed to pseudo-second order equation and belonged to heterogeneous diffusion process, which was controlled by reaction rate, membrane diffusion and intra-particle diffusion. Freundlich model may be more suitable for predicting the adsorption capacity of MCM to pigments in ICMP. The results of thermodynamic experiments prove that the decolorization process of ICMP by MCM is remarked by physical adsorption, which is an endothermic reaction that occurs spontaneously. Within a certain range, the increase in temperature is conducive to the progress of adsorption; the adsorption reaction is an entropy-driven process, during the adsorption process the randomness of the solid/liquid interface increases.
In addition, we examined the zeta potential value of the polysaccharide solution before and after decolorization (ESI†). It was found that the zeta potential value increased after decolorization, indicating that the pigment in the polysaccharide solution was negatively charged. Due to the presence of protonated amino groups (–NH3+) on the surface of chitosan, it has excellent adsorption performance for negatively charged pigments, so the selective adsorption of MCM may be determined by surface charge.
4. Conclusion
In this study, MCM was proved to have a good decolorization effect on ICMP. The experimental results showed that the optimal decolorization conditions were operated at 48 °C for 82 min (pH = 7) and MCM dosage of 8% (g ml−1). Under these conditions, values of Dr%, Rr% and Kc were 90.31 ± 0.12%, 95.40 ± 0.11% and 19.66 ± 0.49, respectively. From the results of adsorption kinetics experiments, the adsorption process of MCM fitted better with the pseudo-second order equation. Elovich equation shows that the adsorption of the ICMP pigment by MCM is a heterogeneous diffusion process. In addition, the adsorption mechanism of ICMP on MCM may be controlled by multiple-diffusion steps, including film diffusion and intra-particle diffusion. From the adsorption isotherms studies, the adsorption isotherms were better fitted by the Freundlich equation. Moreover, the adsorption process of MCM was spontaneous and endothermic. In addition, the adsorption process of MCM is mainly physical adsorption, which has little damage to the structure of polysaccharide. Most significantly, MCM has good desorption and regeneration ability, and the decolorization effect is better than traditional decolorization methods. In summary, MCM adsorption is a promising decolorization method of polysaccharide which can be used in the field of food industry and pharmaceuticals.Author contributions
Bingbing Yu: investigation, writing – original draft; Yao Chen: investigation, writing – original draft; Lijun Zhu: investigation, writing – original draft; Mengmeng Ban: validation; Li Yang: investigation; Yeda Zeng: investigation; Shijie Li: resources; Chunzhi Tang: review & editing; Dnayan Zhang: investigation, writing-review & editing; Xiaoqing Chen: investigation, writing-review & editing.Conflicts of interest
There are no conflicts to declare.Acknowledgements
This work was supported by the Opening Funding of Guangdong Provincial Key Laboratory of New Drug Development and Research of Chinese Medicine (grant numbers: 2017B030314096-02).References
- Y. F. Wang, Y. Q. Tian, J. J. Shao, X. Shu, J. X. Jia, X. J. Ren and Y. Guan, Int. J. Biol. Macromol., 2018, 108, 300–306 CrossRef CAS PubMed.
- Q. Li, Y. M. Niu, P. F. Xing and C. M. Wang, Chin. Med., 2018, 13(1), 7 CrossRef PubMed.
- Y. B. Wang, P. F. He, L. He, Q. R. Huang, J. W. Cheng, W. Q. Li, Y. Liu and C. Y. Wei, Carbohydr. Polym., 2019, 216, 270–281 CrossRef CAS PubMed.
- Y. Chen, T. Wang, X. Zhang, F. M. Zhang and R. J. Linhardt, Carbohydr. Polym., 2021, 254(1), 117462 CrossRef CAS PubMed.
- Q. Wang, C. L. Wang, F. G. He and H. Y. Zhang, J. Chin. Oncol., 2013, 19, 227–230 CAS.
- Z. C. Xu, X. T. Yan, Z. Y. Song, W. Li, W. B. Zhao, H. H. Ma, J. L. Du, S. J. Li and D. Y. Zhang, Int. J. Biol. Macromol., 2018, 117, 610–616 CrossRef CAS PubMed.
- Y. Y. Shi, T. T. Liu, Y. Han, X. F. Zhu, X. J. Zhao, X. J. Ma, D. Y. Jiang and Q. H. Zhang, Food Chem., 2017, 217, 461–468 CrossRef CAS PubMed.
- A. Simaratanamongkol and P. Thiravetyan, J. Food Eng., 2010, 96(1), 14–17 CrossRef CAS.
- P. Baldrian, V. Merhautova, J. Gabriel, F. Nerud, P. Stopka, M. Hruby and M. J. Benes, Appl. Catal., B, 2006, 66, 258–264 CrossRef CAS.
- J. Liu, J. G. Luo, Y. Sun, H. Ye, Z. X. Lu and X. X. Zeng, Bioresour. Technol., 2010, 101(15), 6077–6083 CrossRef CAS PubMed.
- C. Zhang, S. Y. Liu, S. X. Li, Y. Tao, P. P. Wang, X. Y. Ma and L. Z. Chen, Colloids Surf., A, 2019, 581, 123813 CrossRef CAS.
- C. Z. Fan, K. Li, Y. He, Y. L. Wang, X. F. Qian and J. P. Jia, Sci. Total Environ., 2018, 627, 1396–1403 CrossRef CAS PubMed.
- Z. Y. Song, Y. D. Hu, L. K. Qi, T. T. Xu, Y. S. Yang, Z. C. Xu, X. P. Lai, X. L. Wang, D. Y. Zhang and S. J. Li, Carbohydr. Polym., 2018, 195, 558–565 CrossRef CAS PubMed.
- M. G. Sevag, D. B. Lackman and J. Smolens, J. Biol. Chem., 1938, 124(1), 42–49 Search PubMed.
- L. Liang, G. M. Liu, G. Y. Yu, Y. Song and Q. H. Li, Food Chem., 2018, 277, 744–752 CrossRef PubMed.
- M. Dubois, K. A. Gilles, J. K. Hamilton, P. A. Rebers and F. Smith, Anal. Chem., 1956, 28(3), 350–356 CrossRef CAS.
- Q. P. Xiong, S. Huang, J. H. Chen, B. L. Wang, L. He, L. Zhang, S. J. Li, J. Z. Wang, J. G. Wu, X. P. Lai and D. Y. Zhang, J. Cleaner Prod., 2017, 142, 3409–3418 CrossRef CAS.
- D. Y. Zhang, S. J. Li, Q. P. Xiong, C. X. Jiang and X. P. Lai, Carbohydr. Polym., 2013, 95(1), 114–122 CrossRef CAS PubMed.
- C. Chen, L. J. You, A. M. Abbasi, X. Fu and R. H. Liu, Carbohydr. Polym., 2015, 130, 122–132 CrossRef CAS PubMed.
- Q. S. Wang, T. J. Ying, M. M. Jahangir and T. J. Jiang, J. Food Eng., 2012, 111(2), 386–393 CrossRef CAS.
- Y. S. Ho and G. Mckay, Process Saf. Environ. Prot., 1998, 76(4), 332–340 CrossRef CAS.
- Y. S. Ho and G. Mckay, Water Res., 2000, 34(3), 735–742 CrossRef CAS.
- K. D. Belaid, S. Kacha, M. Kameche and Z. Derriche, J. Environ. Chem. Eng., 2013, 1(3), 496–503 CrossRef CAS.
- A. Serpen, B. Atac and V. Goekmen, J. Food Eng., 2007, 82(3), 342–350 CrossRef CAS.
- Z. P. Gao, Z. F. Yu, T. L. Yue and S. Y. Quek, J. Food Eng., 2013, 116(1), 195–201 CrossRef CAS.
- S. Vasiliu, I. Bunia, S. Racovita and V. Neagu, Carbohydr. Polym., 2011, 85(2), 376–387 CrossRef CAS.
- Y. Y. Xu, Q. F. Dang, C. S. Liu, J. Q. Yan, B. Fan, J. P. Cai and J. J. Li, Colloids Surf., A, 2015, 482, 353–364 CrossRef CAS.
- T. L. Yue, C. X. Guo, Y. H. Yuan, Z. L. Wang, Y. Luo and L. Wang, J. Food Sci., 2013, 78(10-11-12), T1629–T1635 CrossRef CAS PubMed.
- T. S. Anirudhan and P. G. Radhakrishnan, Appl. Surf. Sci., 2009, 255(9), 4983–4991 CrossRef CAS.
- J. H. Huang, R. J. Deng and K. L. Huang, Chem. Eng. J., 2011, 171(3), 951–957 CrossRef CAS.
- F. Q. Liu, J. L. Chen, C. Long, A. M. Li, G. D. Gao and Q. X. Zhang, Chin. J. Polym. Sci., 2004, 22(3), 219–224 CAS.
- X. J. Hu, J. S. Wang, Y. G. Liu, X. Li, G. M. Zeng, Z. L. Bao, X. X. Zeng, A. W. Chen and F. Long, J. Hazard. Mater., 2011, 185(1), 306–314 CrossRef CAS PubMed.
Footnotes |
| † Electronic supplementary information (ESI) available. See DOI: 10.1039/d1ra07758a |
| ‡ These authors contributed equally to this paper. |
| This journal is © The Royal Society of Chemistry 2022 |