 Open Access Article
Structure-based discovery and bio-evaluation of a cyclopenta[4,5]thieno[2,3-d]pyrimidin-4-one as a phosphodiesterase 10A inhibitor†
Mayasah Al-Nemaa,
Anand Gaurav *a,
Vannajan Sanghiran Lee*b,
Baskaran Gunasekaranc,
Ming Tatt Leeade,
Patrick Okechukwuc and
Piyarat Nimmanpipug
 fg
fg
aFaculty of Pharmaceutical Sciences, UCSI University, Kuala Lumpur 56000, Malaysia. E-mail: anand.pharma@gmail.com
bDepartment of Chemistry, Faculty of Science, University of Malaya, Kuala Lumpur, 50603, Malaysia. E-mail: vannajan@um.edu.my
cFaculty of Applied Sciences, UCSI University, Kuala Lumpur 56000, Malaysia
dOffice of Postgraduate Studies, UCSI University, Kuala Lumpur 56000, Malaysia
eGraduate Institute of Pharmacology, College of Medicine, National Taiwan University, 10051 Taipei, Taiwan
fDepartment of Chemistry, Faculty of Science, Chiang Mai University, Chiang Mai 50200, Thailand
gCenter of Excellence for Innovation in Analytical Science and Technology for Biodiversity-based Economic and Society (I-ANALY-S-T_B.BES-CMU), Chiang Mai University, 50200, Thailand
First published on 11th January 2022
Abstract
Phosphodiesterase10A (PDE10A) is a potential therapeutic target for the treatment of several neurodegenerative disorders. Thus, extensive efforts of medicinal chemists have been directed toward developing potent PDE10A inhibitors with minimal side effects. However, PDE10A inhibitors are not approved as a treatment for neurodegenerative disorders, possibly due to the lack of research in this area. Therefore, the discovery of novel and diverse scaffolds targeting PDE10A is required. In this study, we described the identification of a new PDE10A inhibitor by structure-based virtual screening combining pharmacophore modelling, molecular docking, molecular dynamics simulations, and biological evaluation. Zinc42657360 with a cyclopenta[4,5]thieno[2,3-d]pyrimidin-4-one scaffold from the zinc database exhibited a significant inhibitory activity of 1.60 μM against PDE10A. The modelling studies demonstrated that Zinc42657360 is involved in three hydrogen bonds with ASN226, THR187 and ASP228, and two aromatic interactions with TYR78 and PHE283, besides the common interactions with the P-clamp residues PHE283 and ILE246. The novel scaffold of Zinc42657360 can be used for the rational design of PDE10A inhibitors with improved affinity.
Introduction
The cyclic nucleotides, 3′,5′-cyclic adenosine monophosphate (cAMP) and 3′,5′-cyclic guanosine monophosphate (cGMP), are well characterised and evolutionarily conserved second messengers that regulate a multitude of cellular functions involved in neuronal signal transduction and synaptic transmission.1–3 Neuronal regulation of the magnitude and duration of cAMP/cGMP elevation is important to achieve specificity and accuracy of signal transduction. The alterations in cyclic nucleotide availability contribute to changes in neuronal cell functions in the central nervous system (CNS), hence precipitating, maintaining or triggering cognitive, motor or psychiatric disturbances. The availability of cyclic nucleotides is controlled by their rate of synthesis through activation of adenylate and guanylate cyclase and their rate of degradation by phosphodiesterases (PDEs) that hydrolyse cAMP and cGMP to inactive nucleotide monophosphates.1,4PDE10A, is a dual substrate enzyme that catalyses the hydrolysis of cAMP & cGMP. It is expressed in both striatonigral direct (dopamine D1 receptor-expressing) and striatopallidal indirect (dopamine D2 receptor-expressing) pathway medium spiny neurons (MSNs) in the striatum.5–7 The affinity of PDE10A for cAMP is higher than cGMP by approximately 20-fold.8 In the direct pathway neurons, PDE10A inhibition activates cAMP/protein kinase A (PKA) signalling leading to the potentiation of D1-receptor signalling, while in the indirect pathway neurons, PDE10A inhibition activates cAMP/PKA signalling by simultaneous potentiation of adenosine A2A receptor signalling and inhibition of D2-receptor signalling.9 A study of the neuronal type-specific regulation of dopamine- and cAMP-regulated neuronal phosphoprotein (DARPP-32) phosphorylation at Thr34 using neostriatal slices showed that PDE10A inhibitor raised DARPP-32 phosphorylation by 6-fold in the indirect pathway neurons, while it raised DARPP-32 phosphorylation by <2-fold in the direct pathway neurons, thus indicating the predominant effect of PDE10A inhibition in the indirect pathway neurons. Interestingly, the indirect pathway-specific effect of a PDE10A inhibitor is observed with antipsychotic medications, which raise DARPP-32 phosphorylation in dopamine D2-receptor-expressing striatal neurons in mice.6 This effect is responsible for the improvement of the positive symptoms in schizophrenia.7 However, the PDE10A inhibition might be associated with extrapyramidal side effects, similar to the side effects observed with the D2-receptor antagonists, which may explain why PDE10A inhibitors have not reached the market yet as antipsychotic treatment.10
The PDE10A inhibitors are being clinically investigated as a treatment for Huntington's disease, obsessive-compulsive disorder, schizophrenia and Tourette's syndrome due to the high expression of PDE10A in the indirect pathway neurons.9,11,12 In addition, it has been suggested that the inhibition of PDE10A provides a novel approach for the treatment of Alzheimer's disease by overcoming the detrimental effects of the amyloid-β peptide on the cAMP-response element-binding protein (CREB) pathway, which is a key control point for long-term memory formation.13,14 Recently, the extensive efforts of the medicinal chemists have directed toward developing potent PDE10A inhibitors with minimal side effects. However, PDE10A inhibitors are not approved as treatment for neurodegenerative disorders, possibly due to the lack of research in this area. Therefore, the discovery of novel and diverse scaffolds targeting PDE10A is still required. Over the last two decades, the computational methods of drug design and discovery have influenced the overall process of drug discovery.15 The early application of computational chemistry as a means to understand the molecular basis of PDEs inhibition goes back to the 1980s. The first reported study attempted to explain the relationship between specific physicochemical properties and potency of known inhibitors, and thereby define pharmacophore for PDE inhibitors.16–18 Since then, a number of PDE10A inhibitor has been discovered and optimised by means of structure-based methods and ligand-based methods.18 In the present study, a potent inhibitor of PDE10A has been identified using structure-based methods that include virtual screening, molecular docking and molecular dynamics (MD) simulations. The identified inhibitor was able to inhibit the PDE10A activity in the micromolar range in vitro.
Experimental
Computational methods
Receptor-based pharmacophore modelling
Based on the previous step, one PDE10A in complex with its co-crystallised ligand was chosen to develop the receptor-based or structure-based pharmacophore model by finding the pharmacophoric features in the active site that are important for the binding of the ligand. LigandScout 4.4 has been used for the generation of a pharmacophore model that comprises all the important chemical features.23 The interactions between the target and the co-crystallised ligand were used to identify the aromatic ring (AR), hydrophobic area (HA), hydrogen bond acceptor (HBA), hydrogen bond donor (HBD) and ionisable area features. These features represent the pharmacophoric features of the receptor-based pharmacophore.Receiver operating characteristic curve
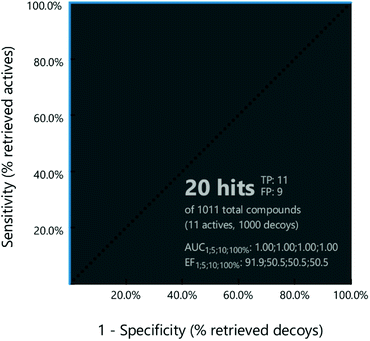
The receiver operating characteristic (ROC) curve has been used to evaluate the capability of the developed pharmacophore model in discriminating the active compounds and decoys. The ROC curve is generated by plotting the Sensitivity against 1-Specificity, where the sensitivity indicates the inclusion of the true positives, whereas; specificity indicates the exclusion of the true negatives from the validation result.24 The ROC lies between 0 and 1, where a value near one is considered favourable. From the reported PDE10A inhibitors in the literature, 11 inhibitors were selected to constitute the test set whereas, 1000 decoys (without reported PDE10A inhibitory activity) were obtained from PubChem. The developed pharmacophore model was validated by screening against the training set and decoy using LigandScout 4.4. The reliability of the pharmacophore model was verified by calculating the ROC value, in addition to other statistical values like the goodness of hit (GH) and enrichment factor (EF).25Multi-step virtual screening
![[thin space (1/6-em)]](https://www.rsc.org/images/entities/char_2009.gif) P 2–5, hydrogen bond donor <3, hydrogen bond acceptor <10, and rotatable bonds <10, were retained. Then, a pharmacophore fit score (FPS) was applied to retrieve compounds with FPS ≥48 (the selected value based on the FPS of the training set compounds). Finally, the hit compounds that passed all the screening filters were submitted to the PAINS-Remover server to remove the Pan Assay Interference Compounds (PAINS) from the retrieved hits.26
P 2–5, hydrogen bond donor <3, hydrogen bond acceptor <10, and rotatable bonds <10, were retained. Then, a pharmacophore fit score (FPS) was applied to retrieve compounds with FPS ≥48 (the selected value based on the FPS of the training set compounds). Finally, the hit compounds that passed all the screening filters were submitted to the PAINS-Remover server to remove the Pan Assay Interference Compounds (PAINS) from the retrieved hits.26Molecular docking
Molecular dynamics simulations
The docked protein–ligand complex with the lowest binding energy was subjected to molecular dynamics (MD) simulations using PMEMD.CUDA in AMBER 14 package.30 The general AMBER force field (GAFF) parameters were assigned for the ligand, and the restricted electrostatic potential (RESP) was calculated under Gaussian g09. The parameters and topologies for the protein–ligand complex were obtained by tleap, and Amber forcefield (ff14SB) was assigned to the complex. The complex system was solvated in a cubic box of TIP3P water with a margin distance of 10 Å in each direction and was neutralised by the addition of Na+ ions. All simulations were carried out under periodic boundary conditions, and the long-range electrostatics were treated using the particle mesh Ewald (PME) method. MD simulations were carried out in four steps (1) relaxation and energy minimisation with a series of steepest descent and conjugated gradient up to 1000 cycles to remove the steric hindrance in the model and use the initial local minimum structure prior running MD simulation; (2) heating the system to 310.15 K using Langevin thermostat at constant volume; (3) equilibration by fixing and equilibrating the protein atoms for 1000 ps at a constant pressure of 1 atm; and (4) finally, a production simulation run for 150 ns using the NPT ensemble under a constant temperature of 310.15 K and pressure of 1 atm. The time step was set to 2 fs while the trajectory was recorded every 1 ps.Binding free energy calculation and residue decomposition using MM-GBSA
The binding free energy of the complexes was calculated from the stable MD trajectories of the last 20 ns using, the Molecular Mechanics-Generalized Born Surface Area (MM-GBSA) method implemented in AMBER 14. In this method, the binding free energy, was calculated as the difference between the free energy of the bound and unbound state of the protein and the ligand.| ΔGbind = Gcomplex − [Gprotein + Gligand] |
| ΔGbind = ΔEMM + ΔGsolv − TΔS |
| ΔEMM = ΔEINT + ΔEVDW + ΔEELE |
Biological assay
Results and discussion
Receptor-based pharmacophore modelling
The structure of PDE10A (PDB ID: 5UWF) in complex with the inhibitor (16d); was selected for the development of the pharmacophore model based on the binding site alignment.36 In which, the alignment of four protein complexes (PDB ID: 3HQW, 4DDL, 4P0N, and 4HF4) on 5UWF showed complete fitness of the four ligands into the active site of 5UWF (Fig. 1, Table 1).37–40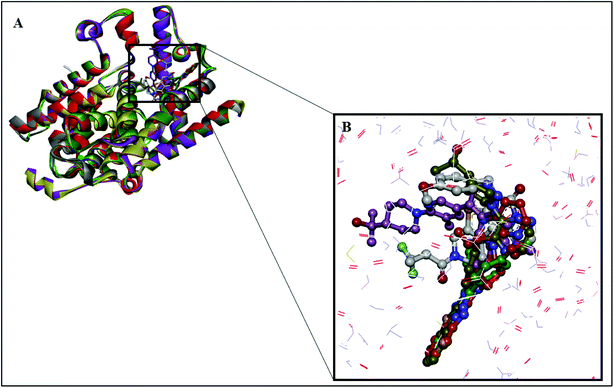 | ||
| Fig. 1 Location of the binding site of PDE10A. (A) The four proteins, 3HQW (green), 4DDL (purple), 4HF4 (yellow) and 4P0N (grey) are superimposed on the reference protein 5UWF (red). (B) Position of the five co-crystallised ligands in the binding site of 5UWF. 5UWF co-crystallised ligand (grey), 3HQW co-crystallised ligand (green), 4DDL co-crystallised ligand (purple), 4HF4 co-crystallised ligand (yellow) and 4P0N co-crystallised ligand (red). | ||
| PDB ID | Active site's residues | Resolution (Å) | Co-crystallised ligand |
|---|---|---|---|
| 5UWF | TYR524, HIS525, LEU675, VAL678, ILE692, TYR693, PHE696, ILE711, MET713, MET714, GLN726, PHE729 | 1.8 | 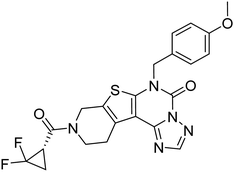 |
| 3HQW | VAL668, ILE682, TRY683, PHE686, PRO702, MET703, LYS708, GLU711, VAL712, GLY715, GLN716, PHE719, ALA722, VAL723 | 1.7 | 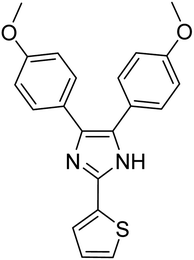 |
| 4DDL | SER563, LEU625, LEU665, VAL668, ILE682, PHE686, ILE701, MET703, GLN716, PHE719 | 2.0 | 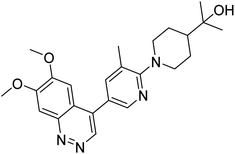 |
| 4P0N | SER563, LEU625, LEU665, VAL668, ILE682, TYR683, PHE686, PRO702, MET703, GLU711, GLY715, GLN716 | 2.0 | 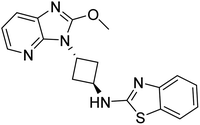 |
| 4HF4 | TYR514, HIS515, LEU665, SER667, VAL668, ILE682, TYR683, PHE686, PRO702, MAT703, LYS708, GLU711, VAL712, GLY715, GLN716, PHE719 | 2.0 | 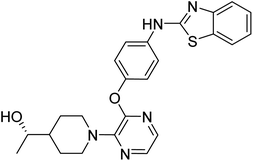 |
As a result, the receptor-based pharmacophore model was developed based on the hydrophilic and lipophilic interaction points available in the active site of 5UWF. The crucial interactions for binding of 16d to 5UWF were considered during the development of the pharmacophore model. Consequently, the final model comprised six pharmacophoric features; one HBA oriented towards GLN726, one AR represented by the thiophene, and four HA represented by the phenol, sulphide and the fluorine groups (Fig. 2).
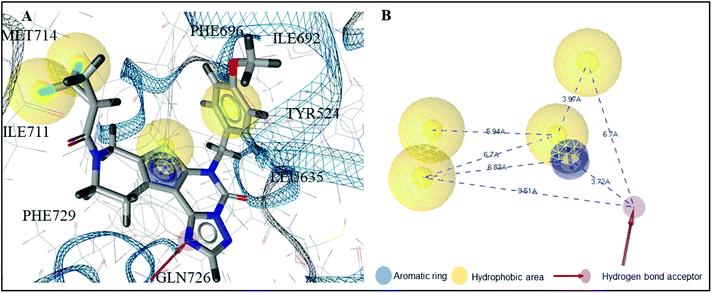 | ||
| Fig. 2 Receptor-based pharmacophore model. (A) The interactions between the amino acid residues of 5UWF and the pharmacophore groups of its co-crystallised ligand 16d. (B) Pharmacophoric features of PDE10A pharmacophore model. | ||
Then, the capability of the receptor-based pharmacophore model in classifying the compounds correctly as active or inactive was evaluated using the ROC curve (Fig. 3). Based on the results, the pharmacophore model was able to identify all the active compounds in the dataset and predict nine inactive to be active. The sensitivity of the pharmacophore was found to be one, and the specificity was 0.99. The obtained ROC, GH and EF values were 1, 0.65, and 50.55, respectively. All the calculated values pointed to the appropriateness of the pharmacophore model to be used as a query in the virtual screening to identify PDE10A inhibitors.
Multi-step virtual screening
Multi-step virtual screening was conducted in six phases (1) pharmacophore-based screening; (2) drug-likeness analysis; (3) pharmacophore fit score; (4) PAINS filter; (5) molecular docking, and; (6) molecular dynamics simulations. The schematic workflow of the multi-step virtual screening protocol employed in this study is shown in Fig. 4. Pharmacophore-based screening of zinc database was performed using the validated receptor-based pharmacophore model as a 3D query to identify potential PDE10A inhibitors with matched pharmacophoric features. As a result, a total of 7541 hits were retrieved in the first phase. Then, several filters were applied to retain only compounds with drug-likeness properties. Consequently, 516 hits were retrieved, in which the physicochemical properties of those hits fit the criteria of the CNS active drug. In this criteria, the compound must be relatively small, moderately lipophilic, has a small polar surface area <60 Å, blood/brain partition coefficient in the range of 0–1.2 and the value of CNS in the range of 0–2, to be considered as a CNS active drug. Compounds that fit the mentioned criteria are most probably able to cross the BBB and have CNS activity. Following the drug-likeness analysis, the 516 hits were subjected to the pharmacophore fit score filter. In this filter, compounds with fit values ≥48 to the pharmacophoric features were retained. As a consequence, only 14 screened hits were obtained in this step (Table S1†). Subsequently, the 14 hits were subjected to the fourth filter in which they were submitted to the PAINS-Remover server to remove the false positive compounds. This filter screens the compounds based on a number of sub-structural features that assist in the identification of problematic screening compounds, which appear as frequent hitters (promiscuous compounds) in many screening libraries. The compounds can be considered false positive for several reasons, i.e. interference in the binding interactions by the formation of aggregates; interference in the assay signalling; and protein-reactive compounds.26 Accordingly, all the 14 hits passed this filter and were considered in docking studies.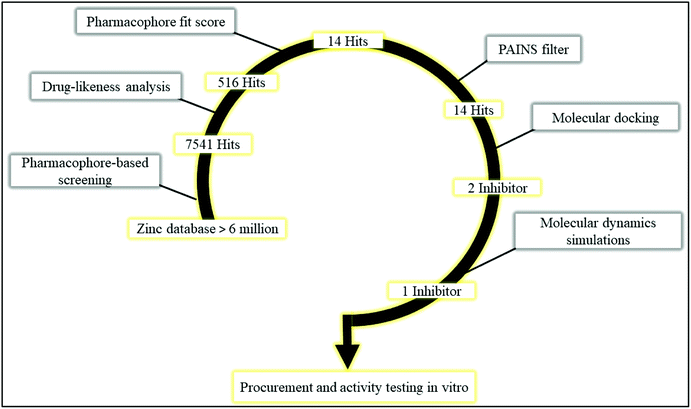 | ||
| Fig. 4 Schematic workflow of the multi-step virtual screening protocol employed in the identification of PDE10A inhibitor. | ||
Molecular docking studies are performed to predict the affinity of the ligand to the target receptor, in addition to the preferred pose and conformation in the complex. In this study, AutoDock Vina 1.1.2 has been used to carry out the molecular docking of 14 compounds. This step was considered the fifth filter in the screening process, where all the compounds were filtered based on their affinities to PDE10A. Before molecular docking, the protocol was validated by re-docking of the co-crystallised ligand, JY4, into the binding site of PDE10A. This step was performed to evaluate the ability of the docking protocol to produce the bioactive conformation. As a consequence, the docked pose with the lowest binding energy adapted a binding mode similar to that of the co-crystallised ligand. Among the docked ligands, the standard compound, TAK063, and Zinc42657360 showed the lowest binding energy of −9.1 kcal mol−1 and −9.2 kcal mol−1, respectively (Tables 2 and S2†). Therefore, the underlying binding interactions of these two compounds with PDE10A were further analysed to explore the structural features that contribute to the PDE10A affinity. The architecture of the binding site of PDE10A achieves all the required criteria for a drug-able binding site. It consists of three pockets, (1) M pocket represents the area in the enzyme that contains the important metal ions (Zn+2 and Mg+2) for catalysing the cAMP and cGMP hydrolysis. (2) S pocket, signifies the solvent filled side pocket which has polar residues and, (3) Q pocket which is known as an inhibitor pocket and further divided into hydrophobic clamp (P-clamp) and conserved purine-selective glutamine. The P-clamp is a rigid and small <300 Å hydrophobic cavity that is ∼14 Å width, ∼13 Å depth and ∼8 Å height. It contains a conserved aromatic PHE located at the roof of the P-clamp; and two hydrophobic residues, ILE and PHE, located on the floor of the binding site. Whereas the purine-selective glutamine pocket contains an invariant substrate-recognising GLN residue which is critical for substrate or ligand recognition. Several studies have shown that the PDE10A inhibitors share two features, a planar ring structure held within the hydrophobic residues of the P-clamp (PHE283 at the roof of the P-clamp and ILE246 and PHE250 on the floor of the binding site); and a hydrogen bonding interaction with the invariant glutamine residue (GLN280). The cyclic nucleotides are recognised by the enzyme upon the formation of two hydrogen bonds for cAMP and one hydrogen bond for cGMP with the Q pocket. Additionally, the phosphate moiety forms a complex with the metal in the M pocket, promoting the hydrolysis of cAMP/cAMP. Thus, the PDE10A inhibitor should be able to occupy either the Q/M pocket or both to block the entry and hydrolysis of cAMP/cGMP.41,42
| Ligand | PDE10A binding energy (kcal mole−1) PDB ID: 6MSA | 2D-structure |
|---|---|---|
| Co-crystallised ligand (JY4) | −8.0 | 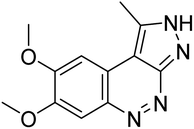 |
| TAK063 (standard) | −9.1 | 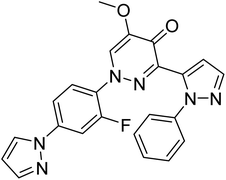 |
| Zinc01397213 | −7.1 | 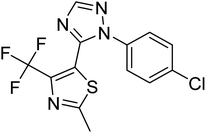 |
| Zinc02156284 | −6.1 | 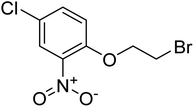 |
| Zinc42657360 | −9.2 | 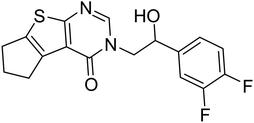 |
| Zinc43638301 | −6.5 | 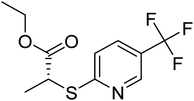 |
| Zinc47464611 | −8.8 | 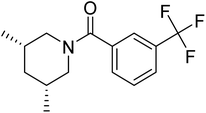 |
| Zinc71439134 | −6.3 | 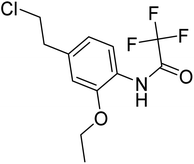 |
| Zinc71759377 | −7.6 | 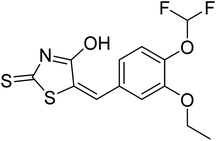 |
| Zinc72553806 | −8.3 |  |
| Zinc72878277 | −7.2 |  |
| Zinc79055898 | −7.6 | 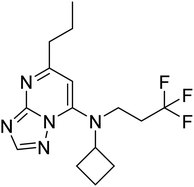 |
| Zinc82446000 | −5.9 | 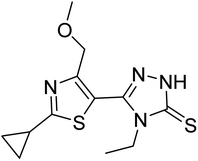 |
| Zinc82779572 | −7.2 | 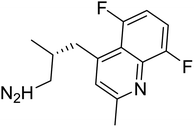 |
| Zinc82779574 | −7.9 | 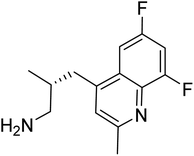 |
| Zinc82779590 | −7.7 | 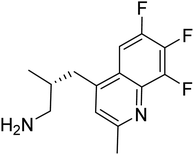 |
The docking study has revealed that both TAK063, and Zinc42657360 occupied the P-clamp of PDE10A and interacted with the main residues, ILE246, PHE250 and PHE283. In regard to Zinc42657360, the cyclopentathiophene moiety interacts with the two residues that form the P-clamp, ILE246 and PHE283. Whereas, for TAK063, the two pyrazole groups interact with PHE250 and PHE283, respectively, and the fluorobenzene group interacts with ILE246 and pHE250 (Fig. 5). Aromatic interactions have seen between the cyclopentathiophene and the pyrimidine groups of Zinc42657360 and the residues PHE283 and TYR78, respectively; and between the pyridazine group of TAK063 and the aromatic residue HID79. Further, three hydrogen bond interactions were observed only in the PDE10A-Zinc42657360 complex. The hydrogen bonds were formed between the hydroxyl group of the ligand and the residues THR187 and ASP228 and between the fluorine group and the residue ASN126 (Fig. 6). Another compound has shown a high affinity to PDE10A in comparison to the rest of the ligands. This compound is Zinc47464611 with a binding energy of −8.8 kcal mol−1. The interactions observed between PDE10A and Zinc47464611 were similar to that observed between PDE10A and the two ligands, Zinc42657360 and TAK063. In which, Zinc47464611 also occupy the P-clamp and interact with ILE246, PHE250 and PHE283. Moreover, the trifluoromethyl benzene group displays aromatic interaction with HID79 (Fig. 7).
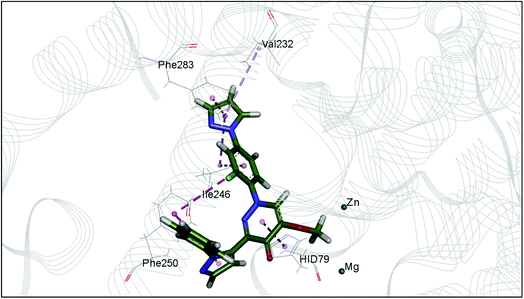 | ||
| Fig. 5 The binding interactions of PDE10A with TAK063. Hydrophobic interactions are presented by pink and Pi–Pi stacking interactions by magenta dotted lines. | ||
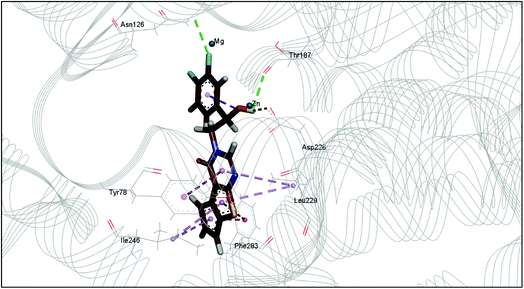 | ||
| Fig. 6 The binding interactions of PDE10A with Zinc42657360. Hydrogen bond interactions are presented by green, hydrophobic interactions by pink, Pi–Pi stacking interactions by magenta dotted lines. | ||
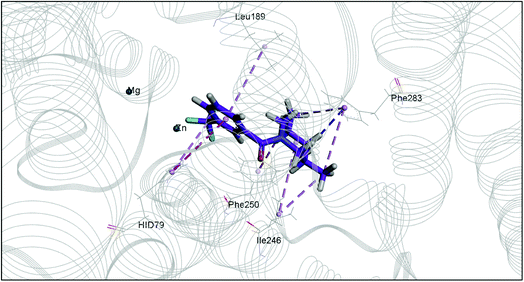 | ||
| Fig. 7 The binding interactions of PDE10A with Zinc47464611. Hydrophobic interactions are presented by pink and Pi–Pi stacking interactions by magenta dotted lines. | ||
According to the binding mode of the three ligands within the active site of PDE10A, we observe that they all formed aromatic interactions or Pi–Pi stacked interactions due to the presence of one or more aromatic rings in their structures. In addition, the three ligands occupied the P-clamp and interacted with the main residues within the clamp. This occupation plays an important role in binding and stabilising the ligands in the active site of PDE10A. However, Zinc42657360 has shown the highest affinity to PDE10A among the three ligands, which could be attributed to the three hydrogen bond interactions formed between the ligand and the active site residues. Thus, the aromatic interactions and the hydrophobic interactions, as well as the hydrogen bonding, showed that TAK-063, Zinc42657360 and Zinc47464611 have an orientation within the active site that would inhibit the entry of cAMP/cGMP into the catalytic domain. These results are consistent with the previous studies that reported the structural elements and key interactions of PDE10A inhibitors like papaverine and MP-10 to achieve high potency and selectivity. These interactions included hydrophobic clamp occupation and aromatic interactions in addition to hydrogen bond interactions with the residues in Q pocket.37,42
The three compounds bound similarly to PDE10A as illustrated in Fig. 5–7. However, the difference in the values of the binding energy for the three compounds cannot be illustrated by molecular docking alone. This could be attributed to the inaccuracy in the calculation of the binding energies of protein–ligand complexes using molecular mechanics-based force field, and the induced-fit effects which are not included in the docking protocol. Therefore, four independent MD simulations were performed for unbound-PDE10A and PDE10A in complex with TAK063, Zinc42657360 and Zinc47464611, respectively to predict the dynamic binding behaviour between the protein and the three ligands in the aqueous environment. The MD results of the various simulations are presented and analysed comparatively in order to better characterise the structure and flexibility of the protein and the ligand's mode of binding. At first, UCSF Chimera 1.13.1 was used for visualising the MD trajectories of each protein–ligand complex that produced in the production stages before proceeding with the analysis of the results; to ensure all the ligands present in the binding site of the target receptor for the entire simulation time. As a consequence, Zinc47464611 was found unbound to its target receptor and away from the binding site at 127 ns (Fig. 8), which; indicates the instability of the ligand within the active site of PDE10A. Therefore, Zinc47464611 was excluded from the rest of the analysis.
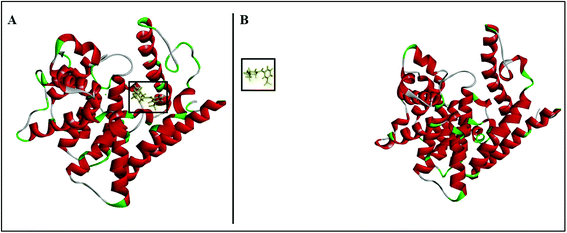 | ||
| Fig. 8 PDE10A-Zinc47464611 complex. (A) The ligand presents within the binding site at 126 ns. (B) The ligand is unbound to the receptor at 127 ns. | ||
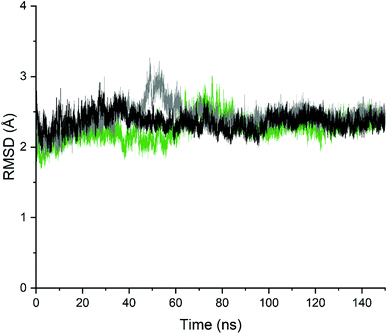
In order to analyse the changes in the relative position of the backbone atoms of the two complexes and validate the stability of the complexes, the time evolution of the RMSD of the backbone atoms' coordinates was monitored during the 150 ns with respect to the initial crystallographic structures. As seen in Fig. 9, the RMSD values were oscillating steadily up to 150 ns simulation for the unbound-PDE10A and the two PDE10A-complexes, which indicate the minor conformational changes in the structure of the protein upon ligands' binding. In regard to the unbound-PDE10A, the RMSD value showed a slight increment to 2.79 Å at 35 ns; in PDE10A-standard (TAK063) complex, the RMSD value increased to 3.2 Å at 48 ns; and in PDE10A-Zinc42657360 complex, the RMSD value increased to 3.0 Å at 75 ns. However, the two ligands remained bound within the binding site of PDE10A, and their RMSD values remained constant throughout the entire simulation time at a range of 1.6–3.2 Å.
In general, more fluctuations were observed in PDE10A-Zinc42657360 complex than that in the unbound-PDE10A and PDE10A-TAK063 complex (Fig. 10). The values of the RMSF, which reflect the individual residues flexibility during the MD simulations, showed minimum fluctuation in the three systems; whereas the RMSF values of the residues HID79 (2.0 Å, 0.7 Å and 0.9 Å, respectively), ASN80 (2.0 Å, 0.7 Å and 0.9 Å, respectively), ASP228 (1.5 Å, 0.4 Å and 0.4 Å, respectively), ASN244 (3.0 Å, 1.1 Å and 1.6 Å, respectively), ARG270 (3.1 Å, 1.6 Å and 2.1, Å respectively), ASP271 (3.5 Å, 2.03 Å and 2.4 Å, respectively) and LYS272 (3.3 Å, 1.8 Å and 2.3 Å, respectively) varied significantly. The highest fluctuation in the unbound-PDE10A was observed in the residues GLY261 and GLY322 with RMSF score of 2.0 Å. While, in PDE10A-Zinc42657360 complex, the highest fluctuations were observed in GLY261(RMFS score 3.5 Å) and ASP271 (RMSF score 3.5 Å); and in PDE10A-TAK063 complex, the highest fluctuations were observed in THR205 (RMSF score 2.9 Å) and GLY206 (RMSF score 2.8 Å). These results indicated the rigidity of the residues within the binding pocket once the inhibitor bound to PDE10A, in which binding of these two inhibitors decreases the flexibility of these residues (TYR78, LEU189, LEU229, ILE246, PHE250, MET267, GLN280, PHE283) hence, making the complexes more stable.
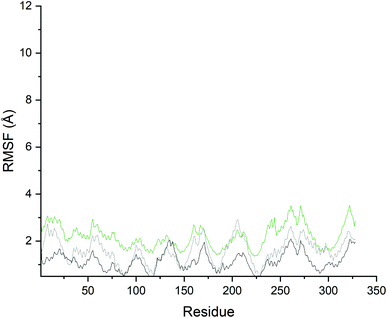 | ||
| Fig. 10 Root mean square fluctuation of the residues in the PDE10A–ligand complexes. Black: Unbound-PDE10A, Grey: PDE10A-TAK063, Green: PDE10A-Zinc42657360. | ||
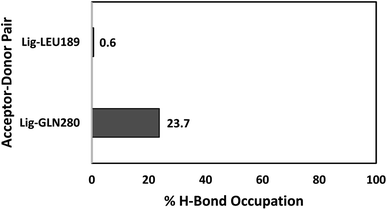
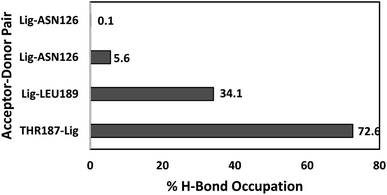
The number of hydrogen bonds and occupancies were also calculated to determine the strength of the intermolecular hydrogen bond interactions between the receptor and the ligands. The hydrogen bond is a direct interaction between the donor and acceptor where the interaction strength depends on the distance and electronegativity of the acceptor. By comparing the hydrogen bond interactions between the proteins and the ligands obtained by molecular docking and MD simulations, we notice that the results were inconsistent for both TAK063 and Zinc42657360. This might be attributed to the rigidity of the docking process, where the protein is treated as a rigid structure and the ligand as a flexible structure. Whereas in MD, both protein and ligand are treated as flexible structures. Thus, the ligand might not form a hydrogen bond with a specific conformation in molecular docking while forming hydrogen bonds with the different conformations of the same protein in MD simulations. The MD results have shown that Zinc42657360 was involved in four hydrogen bond interactions with PDE10A. These hydrogen bonds were formed between THR187 and the hydroxyl group of the ligand with 72.6% occupancy, in which THR187 acted as hydrogen bond acceptor and between ASN126 and fluorine group of the ligand with 5.6% occupancy, where ASN126 acted as hydrogen bond donor. These hydrogen bonds were displayed by the molecular docking results as well. Additionally, LEU189 formed a hydrogen bond with the oxygen group of the ligand with 34.1% occupancy, and ASN126 formed another hydrogen bond with the second fluorine group with 0.1% occupancy. The hydrogen bond between ASN126 and fluorine of the ligand was very week that it stood for a very short time during the MD simulation. In regard to PDE10A-TAK063, the two hydrogen bonds were formed between the residues GLN280 and LEU189 and the amine groups of the ligand with occupancies of 23.7% and 0.6%, respectively. Both residues were acted as hydrogen bond donors (Fig. 11 and 12).
The calculations of the binding free energy for PDE10A complexes have been performed using the MM-GBSA method, which is usually utilised to predict the binding affinity that could assist in identifying the compound with inhibitory potential. The calculation of the free energy difference between two states, bound and unbound, of protein and ligand enables us to estimate the binding affinity by calculating the average results of interaction energies (ΔGgas) and the solvation free energy (ΔGsolv) of the ligand, protein and complex in which these energies contributed favourably to the protein–ligand binding. Both complexes displayed high energy of binding indicated by ΔGtotal value of −21.6 and −24.0 kcal mol−1 for PDE10A-TAK063 complex and PDE10A-Zinc42657360 complex, respectively. The major contributors to the binding free energy were VDW and ELE energies as calculated using molecular mechanics (MM) force field. The VDW interaction is considered the favouring ligand binding energy where large ligands with more atoms are prone to have higher VDW interactions than small ligands. Whereas, the ELE interaction is an important force in the primary approach of the ligand and receptor to each other. These types of interactions are crucial in the stability of the protein–ligand complex. Moreover, the nonpolar component of the solvation energy (ESURF) were almost similar in both complexes and favourable for binding as well. However, they have less contribution to the binding energy due to the relatively small negative values. In contrast, the polar solvation free energy (EGB) was shown to be unfavourable for binding, as indicated by the positive values (Table 3).
| Method | Contribution | PDE10-TAK063 | PDE10A-Zinc42657360 |
|---|---|---|---|
| a *MM: molecular mechanics energies, VDW: van der Waals interactions, EEL: electrostatic interactions, ESURF: non-polar contribution to solvation, EGB: polar contribution of solvation, ΔGtotal: total binding free energy. | |||
| MM (kcal mol−1) | VDW | −46.7 ± 2.0 | −34.4 ± 3.4 |
| EEL | −16.4 ± 3.1 | −46.7 ± 5.0 | |
| ΔGgas | −63.2 ± 3.6 | −81.2 ± 5.2 | |
| GBSA (kcal mol−1) | EGB | 45.9 ± 3.1 | 60.5 ± 3.8 |
| ESURF | −4.3 ± 0.1 | −3.3 ± 0.1 | |
| ΔGsolv | 41.5 ± 3.0 | 57.1 ± 3.8 | |
| ΔGtotal | −21.6 ± 2.4 | −24.0 ± 3.7 | |
In order to identify the important amino acid residues in PDE10A that interact with the ligands, the analysis of the per-residue free energy decomposition was performed to identify the fundamental basis of the protein–ligand interaction. The energy contribution of a single residue in the binding of the receptor with the ligand is divided into three parts VDW, ELE and solvation. Each residue exhibits a negative or positive influence on the receptor–ligand binding. Accordingly, the residues are considered to be effective contributors in the stabilisation energy if their relative energies are <−1 kcal mol−1. The decomposition of energy shows that the per-residue interaction energy varies in the range 0.02 to −3.1 kcal mol−1 for PDE10A complexes. LEU189 contributed significantly to the binding in both complexes in which the decomposition energy was <−3 kcal mol−1. Further, TAK063 bound strongly to PDE10A through residues ILE246, PHE250, GLN280 and PHE283 with favourable energy <−1 kcal mol−1 (Fig. 13). In contrast, the energy contributed by GLN280 in the PDE10A-Zinc42657360 complex was 0.01 kcal mol−1. This energy was unfavourable for binding; hence it could play the opposite role in the protein–ligand binding and result in weakening the stability of the complex.
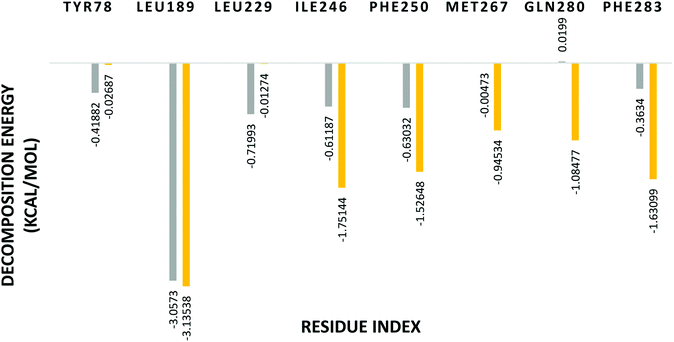 | ||
| Fig. 13 Binding free energy decomposition of the significant amino acids residues of PDE10A complexes. Yellow: PDE10A-TAK063, Grey: PDE10A-Zinc42657360. | ||
Phosphodiesterase10A inhibition assay
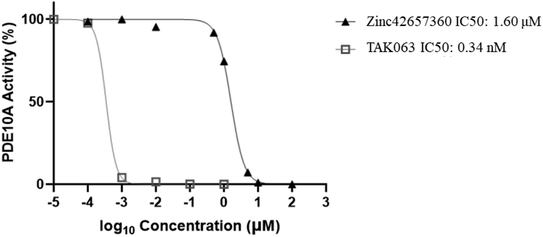
The effect of Zinc42657360 on the PDE10A enzyme activity was investigated using PDE-Glo phosphodiesterase assay. TAK063 and IBMX were used as standard inhibitors. At first, the inhibitory activity for the three compounds was tested at a fixed concentration of 10 μM. Both TAK063 and Zinc42657360 inhibited PDE10A significantly at this concentration, in contrast to IBMX, which did not show any inhibitory activity against PDE10A. Thus, a serial dilution of different concentrations was prepared for TAK063 and Zinc42657360 and screened against PDE10A to identify the concentration that inhibits 50% of enzyme activity. As a result, the obtained IC50 value for TAK063 was 0.34 nM, which is close to the reported value in the literature (0.30 nM). Whereas; the obtained IC50 value for Zinc42657360 was 1.60 μM (Fig. 14).43A number of studies have emphasised the strong relationship between scaffold type and activity toward PDE10A, in which scaffolds possessing less nitrogen (N) have a lower PDE10A inhibitor potency.44,45 Zinc42657360 has two nitrogen groups which are part of the pyrimidine ring. This ring is important for inhibiting the activity of PDE10A by interacting with specific residues in the active site, as shown in the molecular docking study. Accordingly, Zinc42657360 can be used as a starting point for the identification of selective and potent PDE10A inhibitor by optimising the structure of the compound and designing potent analogues.
Conclusion
An integrated virtual screening campaign was used to discover a new PDE10A inhibitor for the treatment of several neurodegenerative disorders through pharmacophore model screening integrated with comprehensive molecular docking. The MD simulations were performed to probe the binding mode and stability of the predicted protein–ligand complexes. Fourteen compounds from the zinc database were subjected to molecular docking in which two compounds displayed the highest affinity to PDE10A, thereby selected for MD simulations. Out of the two compounds, Zinc42657360 was subjected to PDE-Glo phosphodiesterase assay, where it exhibited a significant inhibitory activity of 1.60 μM against PDE10A. The above findings suggested that Zinc42657360 can be explored for further development of new inhibitors of PDE10A. It can be used as a starting point for the discovery of a new series of potent analogues with improved affinity. The strategy used in this study makes a good concession between computational cost and improvement of the hit ratio of drug discovery, thus, may have a broad application in further rational drug design.Author contributions
Mayasah Al-Nema: conceptualization, methodology, investigation, writing-original draft. Anand Gaurav: conceptualization, methodology, validation, writing – review & editing, supervision, project administration, funding acquisition. Vannajan Sanghiran Lee: writing – review & editing, supervision. Baskaran Gunasekaran: writing – review & editing, supervision. Ming Tatt Lee: writing – review & editing, supervision. Patrick Okechukwu: writing – review & editing, supervision. Piyarat Nimmanpipug: editing & funding.Conflicts of interest
There are no conflicts to declare.Acknowledgements
This work was supported by the Centre of Excellence in Research, Value Innovation and Entrepreneurship (CERVIE), UCSI University, Malaysia (Grant number: Proj-2019-In-FPS-018) and the Visiting Professor Grant from Chiang Mai University, Thailand (R000026614). Ms. Mayasah Al-Nema is a recipient of UCSI University Trust Graduate Scholarship. The authors would also like to acknowledge the computational facilities from Data Intensive Computer Center (DICC), https://www.dicc.um.edu.my/, University of Malaya, Kuala Lumpur, Malaysia.References
- A. L. Hebb and H. A. Robertson, Curr. Opin. Pharmacol., 2007, 7, 86–92 CrossRef CAS PubMed.
- P. Greengard, Science, 2001, 294, 1024–1030 CrossRef CAS PubMed.
- G. S. Baillie, FEBS J., 2009, 276, 1790–1799 CrossRef CAS PubMed.
- D. H. Maurice, H. Ke, F. Ahmad, Y. Wang, J. Chung and V. C. Manganiello, Nat. Rev. Drug Discovery, 2014, 13, 290 CrossRef CAS PubMed.
- Z. Xie, W. Adamowicz, W. Eldred, A. Jakowski, R. Kleiman, D. Morton, D. Stephenson, C. Strick, R. Williams and F. Menniti, Neuroscience, 2006, 139, 597–607 CrossRef CAS PubMed.
- H. S. Bateup, P. Svenningsson, M. Kuroiwa, S. Gong, A. Nishi, N. Heintz and P. Greengard, Nat. Neurosci., 2008, 11, 932–939 CrossRef CAS PubMed.
- M. Y. Al-Nema and A. Gaurav, Curr. Top. Med. Chem., 2020, 2404–2421 CrossRef CAS PubMed.
- A. T. Bender and J. A. Beavo, Pharmacol. Rev., 2006, 58, 488–520 CrossRef CAS PubMed.
- A. Nishi, M. Kuroiwa, D. B. Miller, J. P. O'Callaghan, H. S. Bateup, T. Shuto, N. Sotogaku, T. Fukuda, N. Heintz and P. Greengard, J. Neurosci., 2008, 28, 10460–10471 CrossRef CAS PubMed.
- N. DeMartinis, A. Banerjee, V. Kumar, S. Boyer, C. Schmidt and S. Arroyo, Schizophr. Res., 2012, 136, S262 CrossRef.
- P. Heckman, A. Blokland, E. Bollen and J. Prickaerts, Neurosci. Biobehav. Rev., 2018, 87, 233–254 CrossRef CAS PubMed.
- A. Harada, N. Kaushal, K. Suzuki, A. Nakatani, K. Bobkov, J. A. Vekich, J. P. Doyle and H. Kimura, Int. J. Neuropsychopharmacol., 2020, 23, 96–107 CrossRef CAS PubMed.
- D. Puzzo, A. Palmeri and O. Arancio, Rev. Neurosci., 2006, 17, 497–523 CAS.
- J. Sikora, M. Podsiedlik, T. Pietras, M. Kosmalski, M. Matłoka, R. Moszczyński-Petkowski, M. Wieczorek and M. Markowicz-Piasecka, J. Enzyme Inhib. Med. Chem., 2020, 35, 1743–1750 CrossRef CAS PubMed.
- S. P. Leelananda and S. Lindert, Beilstein J. Org. Chem., 2016, 12, 2694–2718 CrossRef CAS PubMed.
- T. R. Blackmore, Imidazoquinazolinone based inhibitors of phosphodiesterase 3, PhD thesis, Monash University, 2012.
- P. Fossa, F. Giordanetto, G. Menozzi and L. Mosti, Quant. Struct.-Act. Relat., 2002, 21, 267–275 CrossRef CAS.
- A. Gaurav, M. Xing and M. Al-Nema, in Quantitative Structure-activity Relationship, InTech, 2017 Search PubMed.
- H. M. Berman, J. Westbrook, Z. Feng, G. Gilliland, T. N. Bhat, H. Weissig, I. N. Shindyalov and P. E. Bourne, Nucleic Acids Res., 2000, 28, 235–242 CrossRef CAS PubMed.
- H. Berman, K. Henrick and H. Nakamura, Nat. Struct. Mol. Biol., 2003, 10, 980 CrossRef CAS PubMed.
- Maestro Schrödinger, LLC, New York, NY, 2019.
- Discovery Studio Visualizer, Dassault Systèmes, San Diego, 2016 Search PubMed.
- G. Wolber and T. Langer, J. Chem. Inf. Model., 2005, 45, 160–169 CrossRef CAS PubMed.
- D. Berrar and P. Flach, Briefings Bioinf., 2011, 13, 83–97 CrossRef PubMed.
- M. Al-Nema, A. Gaurav and G. Akowuah, Comput. Biol. Chem., 2018, 52–63 CrossRef CAS PubMed.
- J. B. Baell and G. A. Holloway, J. Med. Chem., 2010, 53, 2719–2740 CrossRef CAS PubMed.
- G. M. Sastry, M. Adzhigirey, T. Day, R. Annabhimoju and W. Sherman, J. Comput.-Aided Mol. Des., 2013, 27, 221–234 CrossRef PubMed.
- O. Trott and A. J. Olson, J. Comput. Chem., 2010, 31, 455–461 CAS.
- I. A. Guedes, F. S. Pereira and L. E. Dardenne, Front. Pharmacol., 2018, 9, 1089 CrossRef CAS PubMed.
- M. Al-Nema, A. Gaurav and V. S. Lee, Heliyon, 2020, 6, e04856 CrossRef PubMed.
- A. Martínez-Muñoz, M. Bello, A. Romero-Castro, R. A. Rodríguez-Fonseca, J. Rodrigues, V. A. Sánchez-Espinosa and J. Correa-Basurto, J. Mol. Graphics Modell., 2017, 76, 330–341 CrossRef PubMed.
- G. D. Hawkins, C. J. Cramer and D. G. Truhlar, Chem. Phys. Lett., 1995, 246, 122–129 CrossRef CAS.
- J. Tomasi, B. Mennucci and R. Cammi, Chem. Rev., 2005, 105, 2999–3094 CrossRef CAS PubMed.
- V. Tsui and D. A. Case, Biopolymers, 2000, 56, 275–291 CrossRef CAS PubMed.
- A. Onufriev, D. Bashford and D. A. Case, Proteins: Struct., Funct., Bioinf., 2004, 55, 383–394 CrossRef CAS PubMed.
- B. Dyck, B. Branstetter, T. Gharbaoui, A. R. Hudson, J. G. Breitenbucher, L. Gomez, I. Botrous, T. Marrone, R. Barido and C. K. Allerston, J. Med. Chem., 2017, 60, 3472–3483 CrossRef CAS PubMed.
- P. R. Verhoest, D. S. Chapin, M. Corman, K. Fonseca, J. F. Harms, X. Hou, E. S. Marr, F. S. Menniti, F. Nelson and R. O'Connor, J. Med. Chem., 2009, 52, 5188–5196 CrossRef CAS PubMed.
- E. Hu, R. K. Kunz, S. Rumfelt, N. Chen, R. Burli, C. Li, K. L. Andrews, J. Zhang, S. Chmait, J. Kogan, M. Lindstrom, S. A. Hitchcock and J. Treanor, Bioorg. Med. Chem. Lett., 2012, 22, 2262–2265 CrossRef CAS PubMed.
- E. Hu, K. Andrews, S. Chmait, X. Zhao, C. Davis, S. Miller, G. Hill Della Puppa, M. Dovlatyan, H. Chen and D. Lester-Zeiner, ACS Med. Chem. Lett., 2014, 5, 700–705 CrossRef CAS PubMed.
- R. M. Rzasa, E. Hu, S. Rumfelt, N. Chen, K. L. Andrews, S. Chmait, J. R. Falsey, W. Zhong, A. D. Jones and A. Porter, Bioorg. Med. Chem. Lett., 2012, 22, 7371–7375 CrossRef CAS PubMed.
- J. Kehler and J. Nielsen, Curr. Pharm. Des., 2011, 17, 137–150 CrossRef CAS PubMed.
- T. A. Chappie, C. J. Helal and X. Hou, J. Med. Chem., 2012, 55, 7299–7331 CrossRef CAS PubMed.
- J. Kunitomo, M. Yoshikawa, M. Fushimi, A. Kawada, J. F. Quinn, H. Oki, H. Kokubo, M. Kondo, K. Nakashima and N. Kamiguchi, J. Med. Chem., 2014, 57, 9627–9643 CrossRef CAS PubMed.
- R. Moszczyński-Pętkowski, J. Majer, M. Borkowska, Ł. Bojarski, S. Janowska, M. Matłoka, F. Stefaniak, D. Smuga, K. Bazydło and K. Dubiel, Eur. J. Med. Chem., 2018, 155, 96–116 CrossRef PubMed.
- Y. Zhang and A. Pike, Bioorg. Med. Chem. Lett., 2021, 127849 CrossRef PubMed.
Footnote |
| † Electronic supplementary information (ESI) available. See DOI: 10.1039/d1ra07649c |
| This journal is © The Royal Society of Chemistry 2022 |

