DOI:
10.1039/D1RA07247A
(Paper)
RSC Adv., 2022,
12, 5300-5311
Structural analysis and dye removal behavior of amorphous titania embedded poly(vinyl butyral) hybrid fiber†
Received
29th September 2021
, Accepted 19th January 2022
First published on 15th February 2022
Abstract
This study reports on the efficient methylene blue (MB) dye removal properties of a polyvinyl butyral (PVB)–amorphous titania (amTiO2) hybrid fiber (PVB–amTiO2F) made by air-gap spinning in acetone solvent. The successful fabrication of PVB–amTiO2F was confirmed by employing Fourier transform infrared, scanning electron microscopy, X-ray photoelectron spectroscopy, thermogravimetric analysis, and energy dispersive X-ray measurement. Batch experiments were used to examine the cationic MB dye adsorption performance in the dark. The observed data showed that the developed PVB–amTiO2F exhibited moderate adsorption efficiency (68–70%) which is comparable to other amorphous titania-rich adsorbents. The adsorption kinetics was well fitted with a pseudo-second-order model, suggesting that adsorption is mainly led by chemisorption. In addition, the MB degradation properties under visible light were also studied afterwards. A possible adsorption mechanism is discussed. Moreover, the as-fabricated fiber exhibited average to good reusability after 6 cycles. Only cationic MB dye solution was able to demonstrate such properties.
Introduction
Synthetic dyes are considered the most perilous type of pollutant, posing a threat to both human health and aquatic life.1 Among them, methylene blue (MB) has a planar structure and is highly soluble in water. As a result, it may damage marine life due to hindering the entrance of sunlight into water bodies, and reoxygenation of the marine system is interrupted. Although MB is not poisonous, it can induce health problems, such as high blood pressure, nausea, and abdominal pain when consumed in amounts greater than 7.0 mg kg−2.2 Furthermore, light can effortlessly photosensitize MB, causing it to release detrimental oxygen that can harm our DNA structure, especially when present in large volume.3
In the past, several techniques have been employed for dye removal, including advanced oxidation, membrane separation, electrolysis, and photocatalytic degradation. But visible-light-induced photocatalysis and adsorption methods are considered the most effective techniques in the field of organic pollutant remediation because of their high efficiencies, low cost, less harmful by-products, and low energy consumption.4
As a porous material, metal–organic frameworks (MOFs) represent diverse applications in wastewater treatment, generated from organic–inorganic hybrids.1 Recently, MOF-based composites, such as MIL-101(Fe)@PDopa@Fe3O4, Fe3O4/MIL-101(Fe), α-Fe2O3@UiO-66, and BiOI@UIO-66(NH2)@g-C3N4, have been developed to establish the efficacy of MOFs in this field.4 In addition, carbon-based materials, especially graphene oxide and reduced graphene oxide, have shown promising results as photocatalysts in dye degradation.5
Furthermore, organic–inorganic hybrid structures driven by transition metal titanium dioxide (TiO2) are also effective in the field of adsorption and photodegradation for organic pollutants.6 Although crystalline TiO2 is suitable for photocatalytic reactions due to its low toxicity, chemical–thermal stability, and good resistance to photo-corrosion, it has several well-known drawbacks, including ineffective utilization of visible and near-infrared light and high recombination of photo-generated charge carriers, which greatly hinder the improvement of its photocatalytic activity.7 Conversely, amorphous metal oxides have several potential advantages over crystalline phases:8 they are easier to make at room temperature, with a significantly larger surface area, and the ability to have a variety of chemical compounds doped or embedded into their matrices. Despite amorphous TiO2 (amTiO2) having long been thought to be nearly inactive due to the easy recombination of photogenerated electrons and holes when exposed to light,9 some research has found that the surface area of amTiO2 is preferable to its crystal structure for increasing photocatalytic activity. Buddee et al. developed curcumin-sensitized amTiO2 for the successful photodegradation of MB dye.6 Later, Wang et al. showed that amTiO2 was faster than crystalline TiO2 for the visible-light-induced photodegradation of rhodamine B (Rh-B), implying that amTiO2 was a good mediator for electron transfer from excited dyes to oxygen.10 They stated that the synergistic dye degradation dynamics were mainly controlled by the higher surface area of amTiO2 rather than crystallinity. Meanwhile, in the past, Kanna et al.11 and Sriprang et al.12 effectively decolorized crystal violet (CV) and malachite green (MG) dyes, respectively, by amTiO2 where the adsorption property of the adsorbent mainly dominated the decoloration process. Consequently, in 2019, we reported not amTiO2 particles, but cellulose acetate (CA) fiber crosslinked amTiO2 (i.e. CA–amTiO2 fibers), decomposing organic dyes, and reducing Cr(VI) when exposed to visible light.13
Accordingly, herein, we aimed to fabricate a PVB–amorphous TiO2 hybrid fiber (PVB–amTiO2F), considered as an efficient candidate for organic dye removal. The fiber was prepared via an air-gap spinning process. The activity of the fiber was thought suitable for adsorption of MB dye since the matrix of the fabricated fiber has anionic functional groups, suggesting some possible interactions with MB dye. This study also investigated the possibility of using this fiber as a photocatalyst for MB decomposition upon exposure to visible light. The ability of the developed PVB–amTiO2F for MB dye removal is estimated and discussed. The adsorption kinetics of the process and the possibility for reuse of PVB–amTiO2F are also assessed.
Experimental
Materials
PVB (Mowital® PVB B60H), with a molecular weight of 50–60 kDa was purchased from Kuraray Co. Ltd., Japan. Titanium(IV) isopropoxide (TTIP) was purchased from Wako Pure Chemical Industries Ltd., Japan. Aeroxide P25 (commercial TiO2 powder) was purchased from Nippon Aerosil Co. Ltd., Japan. The acetone and ethanol used in this study were dehydrated using 3 Å molecular sieves. Several dyes, namely methylene blue (MB), methyl orange (MO), and rhodamine B (Rh-B), were purchased from Nacalai Tesque Inc., Japan. All reagents were of analytical grade and used without further purification.
Preparation of PVB–amTiO2F and a comparison sample
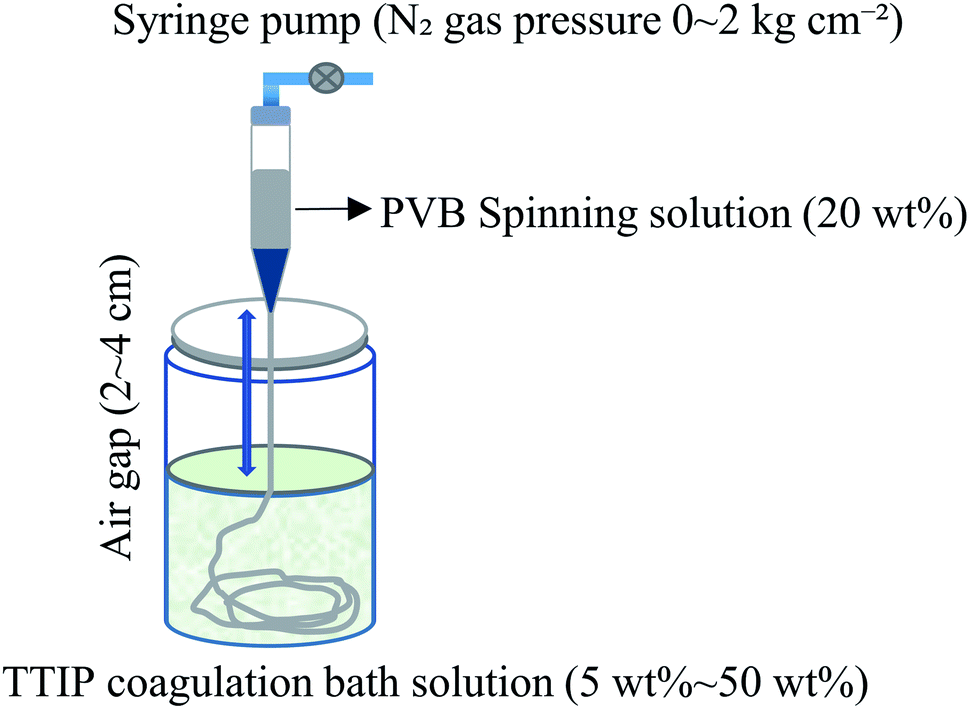
The sample preparation method,14 known as air-gap spinning, is shown schematically in Fig. 1. Firstly, 2 g of PVB and 8 g of dehydrated ethanol were used to make a 20 wt% PVB–ethanol solution (spinning solution). To make a coagulation solution, TTIP was dissolved in dehydrated acetone at different concentrations. The PVB spinning solution (2 mL) was then spun from a syringe into a stirred coagulation bath with a syringe pump, rapidly forming a fibrous material. After 30 min immersion time, the resultant fibers were repeatedly washed with methanol to eliminate unreacted components, followed by soaking in distilled water to obtain the hydrolyzed product of TTIP (Fig. S1†). This as-spun fiber is denoted PVB–amTiO2F. All samples were vacuum-dried before being used for other measurements. The TTIP bath concentrations were 5 wt%, 10 wt%, 15 wt%, 20 wt%, and 50 wt%. The nozzle-to-bath (air-gap) distance, spinning solution volume, spinning rate, and N2 gas pressure were 2–4 cm, 2.0 mL, 4 mL min−1, and (0–2 kg cm−2) respectively. For comparison, amTiO2 powder was also prepared according to previous research.10 Here, 5 mL of TTIP was added dropwise into 50 mL of distilled water without the addition of any strong acids or organic solvents. The instantly formed white suspension was kept at room temperature for 2 h to allow for complete hydrolysis, then separated by a sieve and washed five times with 20 mL of distilled water to remove any impurities. The powders were then dried in an oven at 70 °C for 2 h. The as-prepared amorphous TiO2 powder is designated amTiO2P.
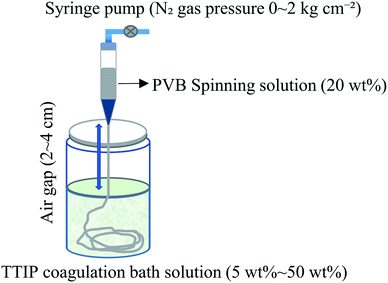 |
| | Fig. 1 Preparation method of PVB–amTiO2F by air-gap spinning. | |
Characterization
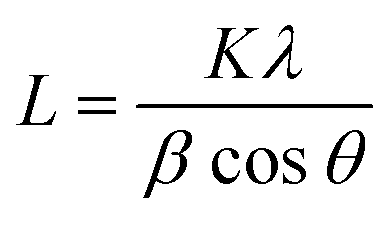
A Keyence scanning electron microscope (SEM) (VE-9800, Keyence Co. Ltd., Japan) was used to examine the morphological structure of PVB–amTiO2F at a voltage of 5 kV. Using an ion coater (SC-701; Sanyu Electron Co. Ltd., Japan), all samples were first coated with Au/Pd sputtering under vacuum. Thermogravimetric (TG) measurements were carried out in the air, using a thermogravimetric analyzer (DTG-60, Shimadzu, Japan) at a heating rate of 10 °C min−1 from 30 to 600 °C. For fibrous samples, an X-ray diffractometer (Ultima-IV, Rigaku, Japan) was used to perform crystallographic measurements. In addition, a separate X-ray diffraction (XRD) measurement was taken using CuKα with Ni filter (30 kV, 15 mA) (Rigaku MiniFlex II, Japan) for the powder sample. For comparison, the crystallite size of the powder sample was also calculated using Scherrer's equation. The eqn (1) can be denoted as:| |
 | (1) |
where θ is the Bragg angle of the peaks (°), λ is the wavelength of the X-ray (0.15418 nm), and β is the line broadening at half the maximum intensity (FWHM) (rad). The shape factor K is 0.89. An Infrared (IR) spectrometer (IR Affinity-1, Shimadzu, Japan) arrayed with an attenuated total reflection (ATR) ancillary (MIRacle 10, Shimadzu, Japan) bearing a diamond/ZnSe crystal was used to perform ATR-FTIR experiments at ambient temperature. Nitrogen adsorption isotherms were measured at −196 °C using a BELSORP-mini II, MicrotracBEL Corp., Japan. The Brunauer–Emmett–Teller (BET) method was used to compute specific surface areas. From the isotherm, the pore-size distribution (PSD) curves were measured using the Barrett–Joyner–Halenda (BJH) algorithm. X-ray photoelectron spectroscopy (XPS) was performed with a JEOL JPS-9010 (Nippon Electronics Co. Ltd., Japan) instrument with an Mg-Kα (hν = 1253.6 eV) source at a residual gas pressure of 5 × 10⁻⁶ Pa. Energy dispersive spectroscopy (EDS) was performed coupled with field emission scanning electron microscope (FE-SEM) (Zeiss Ultra Plus, Carl Zeiss Microscopy GmbH, Germany) to assess the purity and elemental composition of the fibers. Prior to this, osmium conduction was employed on the fiber surface by using a coating device (HPC-1SW, Japan). The absorption spectra from 400 to 800 nm were recorded using a UV-vis spectrometer (ASV11D, AS ONE Corporation, Japan).
The net charge of the PVB–amTiO2F surface was measured based on pH changes of a NaCl solution containing 0.2 g of fiber.12 Initially, the pH of these solutions was adjusted and recorded as the initial pH, pHi. At the end of the experiment, the pH was measured as the final pH, pHf. Finally, pHpzc was calculated from the crossover point of the predetermined pHi vs. pHf plot curve.
Batch adsorption and decomposition studies
Unless otherwise stated, the test dispersions were typically prepared by adding 0.2 g of PVB–amTiO2F fibers to a 10 mL aqueous solution containing 10 mg L−1 of dye with a specified pH. In the initial stage of the study, the dark adsorption kinetics of the dyes were tested by using a UV-vis spectrometer to monitor dye concentration at regular intervals. Once the adsorption had reached equilibrium, samples immersed in the solution were exposed to visible light. Then the dispersion solution was constantly stirred with a stirring bar while being irradiated under a 100 W halogen lamp (Mega-Light100-ROHS, SCHOTT).13 The absorbances for MB, MO, and Rh-B were recorded at 664 nm, 463 nm, and 554 nm, respectively, for both adsorption and decomposition measurements.15–17 Eqn (2) and (3), respectively, were used to calculate adsorption efficiency (%) and adsorption capacity.| | |
Adsorption efficiency (%) = (C0 − Ct)/C0 × 100
| (2) |
| | |
Qt (mg g−1) = (C0 − Ct)/m × V
| (3) |
where, C0 and Ct (mg L−1) are the dye concentrations at times zero and t, respectively. V (L) is the dye volume and m (g) is the mass of the fiber.
Adsorption kinetics
The adsorption kinetics of MB onto PVB–amTiO2F was evaluated using Lagergren pseudo-first-order18 and pseudo-second-order19 models by fitting the Qt data acquired empirically with eqn (4) and (5), respectively;| |
ln(Qe − Qt) = ln![[thin space (1/6-em)]](https://www.rsc.org/images/entities/char_2009.gif) Qe − k1t Qe − k1t
| (4) |
| | |
t/Qt = 1/k2Qe2 + t/Qe
| (5) |
Here, Qe symbolizes the adsorptive removal capacity of MB under equilibrium conditions, and k1 and k2 are the pseudo-first-order and pseudo-second-order rate constant, respectively.
Results and discussion
Structural analysis by SEM
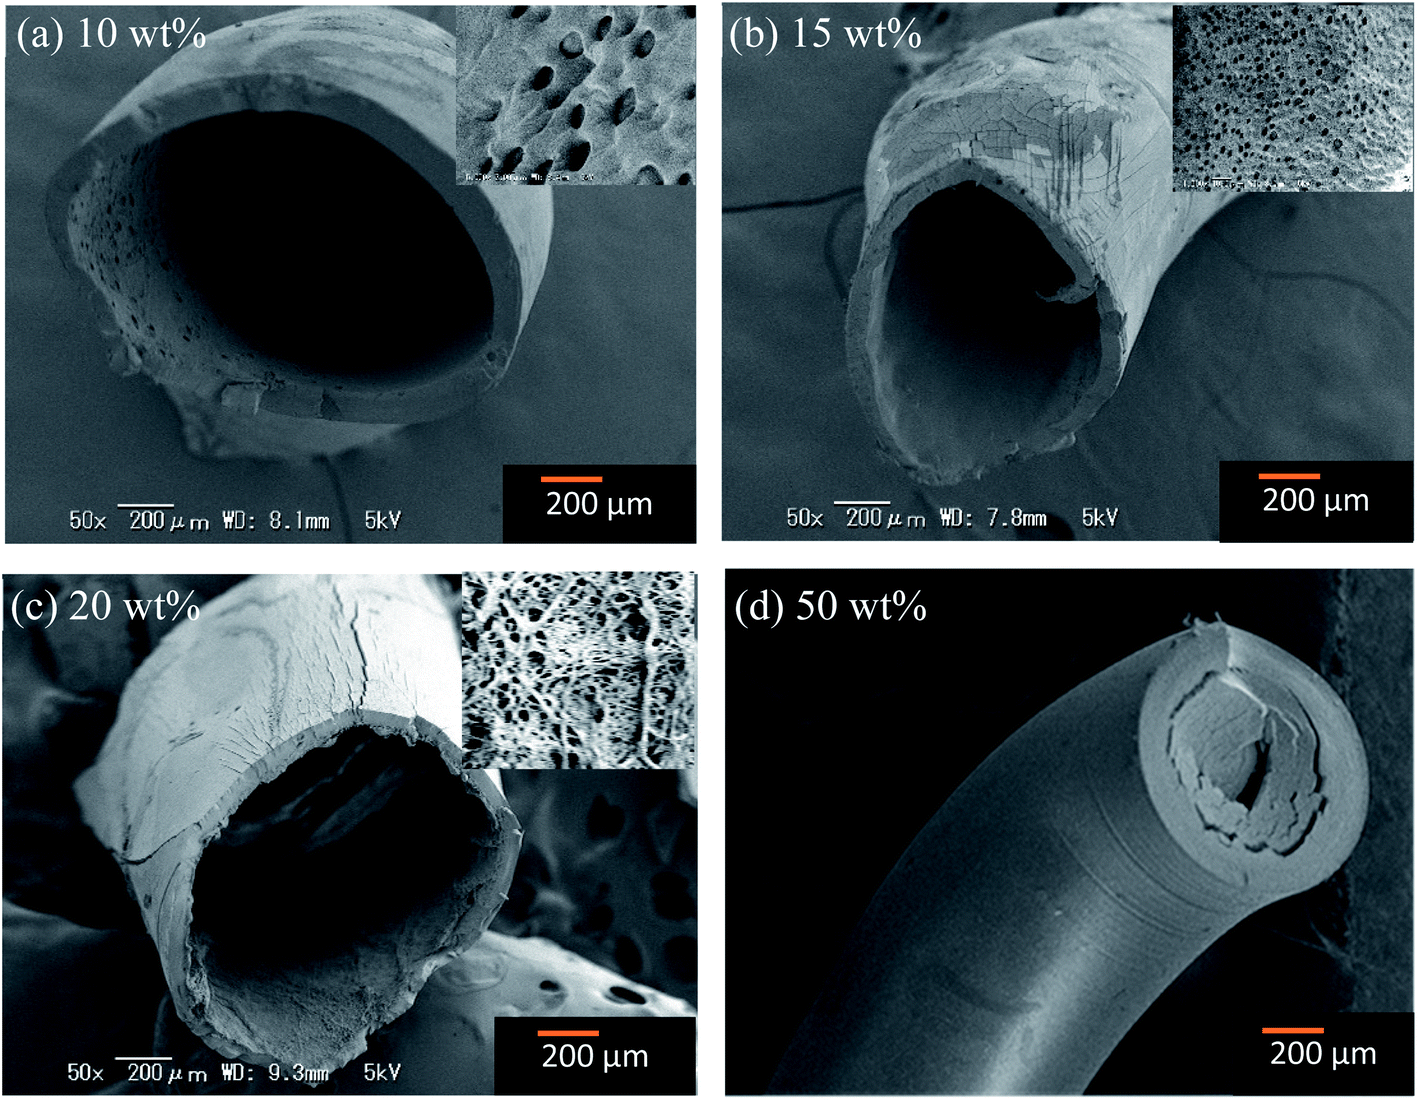
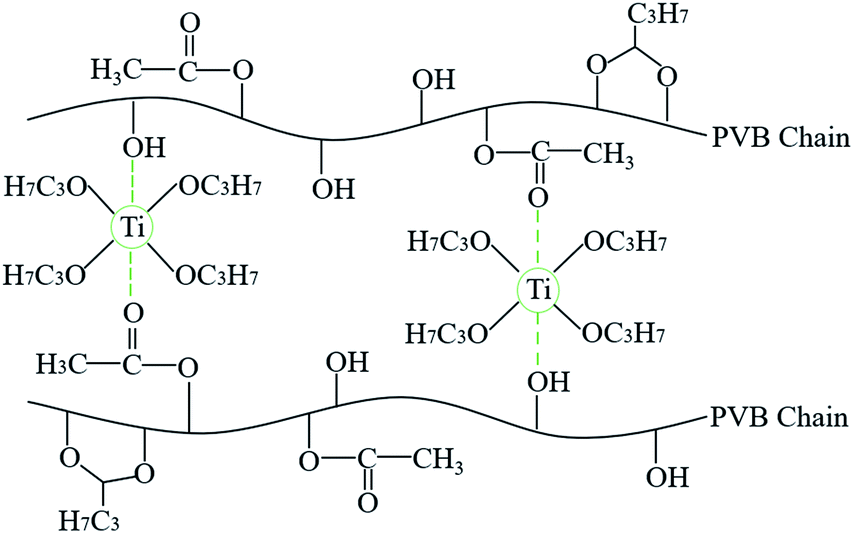
Fig. 2 shows the SEM micrographs of the fibers prepared at various TTIP coagulation bath concentrations. At 5 wt%, the prepared fibers look like a very entangled and limp structure, making it difficult to remove the remaining PVB. Easy-to-handle fibers could be yielded at concentrations from 10 wt% to 50 wt%. These fibers exhibited a core structure that is almost comparable to the PVB–zirconia fibers reported by Bhuiyan et al.14 However, some micropores are observed on the inner wall (inset pictures) of the low-TTIP concentration fibers. At increased bath concentrations, the fibers gained a flattened shape with a reduced hollow structure. The diameter of the fiber decreased as the concentration of the TTIP bath increased, indicating that the alkoxide wt% had a substantial influence on the fiber structure (Fig. S2†). This was because a higher TTIP concentration restricts the swelling of the PVB solution within the coagulation bath. As a result, the produced fibers were highly brittle and thin in diameter at concentrations close to 50 wt%. The cross-linking reaction speed between PVB and TTIP was considered slow, which led to some unreacted alkoxide components at lower concentrations. The proposed reaction mechanism of the prepared PVB–amTiO2F is depicted in Fig. 3.20 The ethoxy groups in the TTIP would be hydrolyzed during the preparation process and yield hollow hydrous fibers.
 |
| | Fig. 2 SEM images of the PVB–amTiO2F prepared at TTIP bath concentrations of (a) 10 wt%, (b) 15 wt%, (c) 20 wt%, and (d) 50 wt%. | |
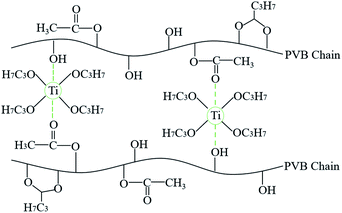 |
| | Fig. 3 Schematic reaction chemistry of PVB–amTiO2F formation. | |
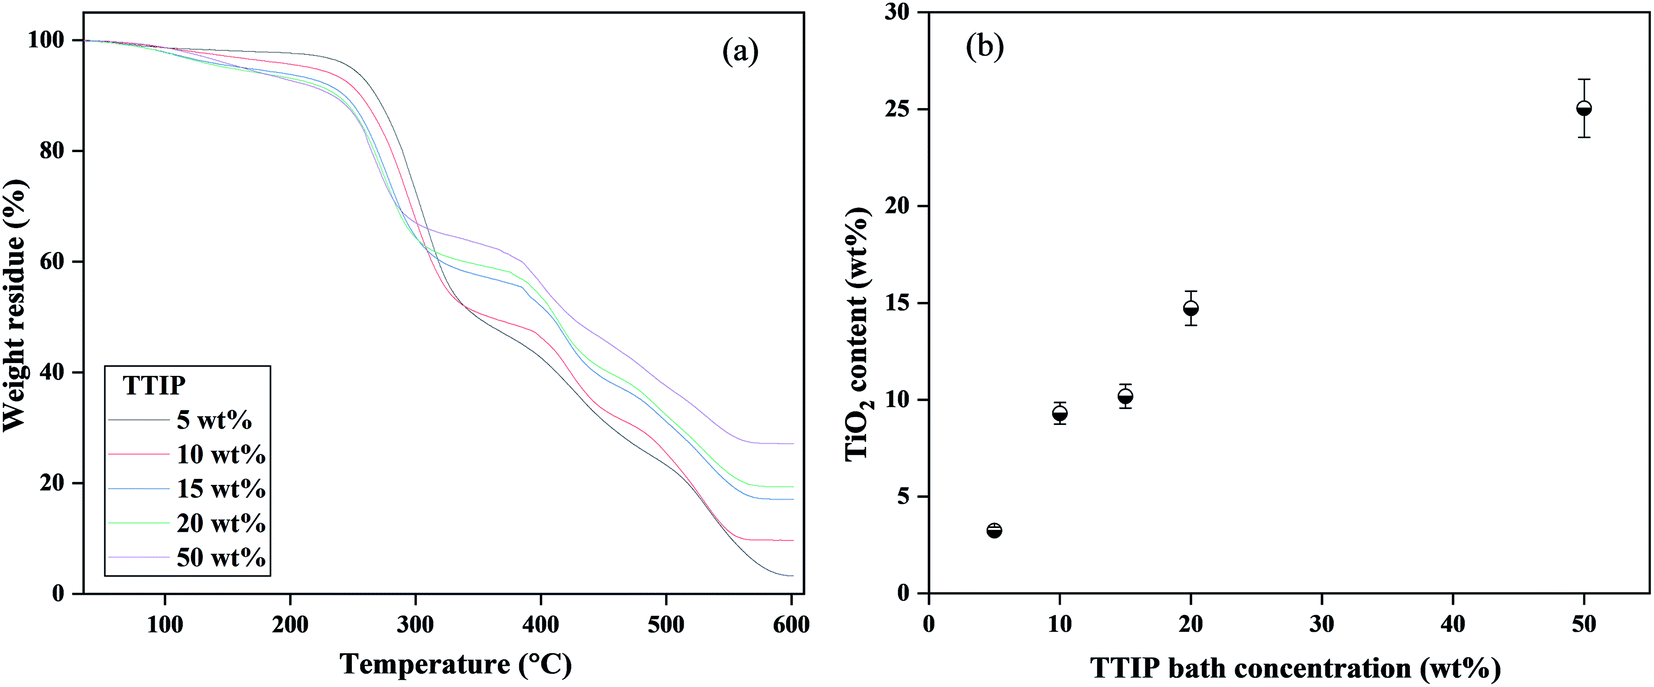
TG analysis
Fig. 4 shows (a) TG curves and (b) residual TiO2 weight content for fiber samples as a function of TTIP coagulation bath concentrations. The residual weights in the TG curves correspond to the weight at 600 °C. All samples are thermally decomposed in three stages, as reported by Hanna et al.21 The first degradation stage was ascribed from room temperature to ∼250 °C corresponding to the evaporation of water content in the samples. The degradation of the PVB main chains causes the second stage, which was initiated at ∼250 °C and ended at ∼440 °C. The third step took place at 440 °C, which indicated the carbonization of the products to ash. With increasing TTIP bath concentration, the residual weight was considered to increase up to 50 wt% (Fig. 4(b)). Following that, we were not able to prepare well-structured fibers. However, an increased number of cross-links is observed for very high TTIP bath concentration where a spontaneous diffusion of Ti from the fiber's surface to the center is considered. This may be due to the high diffusion of TTIP from the cross-linking point to the PVB polymer chain at higher concentrations (Fig. S3†). The amount of decomposition in the second and third stages is thought to be affected by the number of reactions between PVB and TTIP, as well as by the diffusion rates of Ti into the PVB polymer chain. The amount of decomposition at the second and third stages is summarized in (Fig. S4†). Meanwhile, apart from 50 wt% fibers, the morphological characteristics of 10–20 wt% PVB–amTiO2F remained almost the same. But, we have considered 20 wt% PVB–amTiO2F for subsequent measurements pondering its relative Ti content and internal porous distribution.
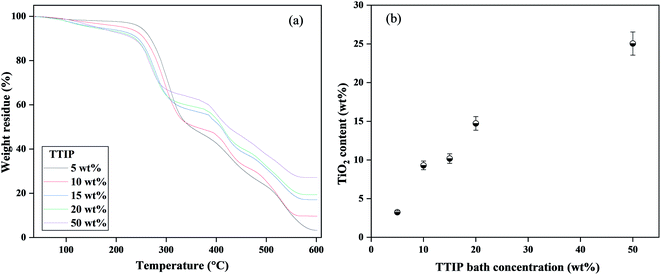 |
| | Fig. 4 (a) Typical TG profiles, and (b) residual TiO2 weight of the PVB–amTiO2F samples at 600 °C as a function of TTIP bath concentration. | |
FTIR measurement
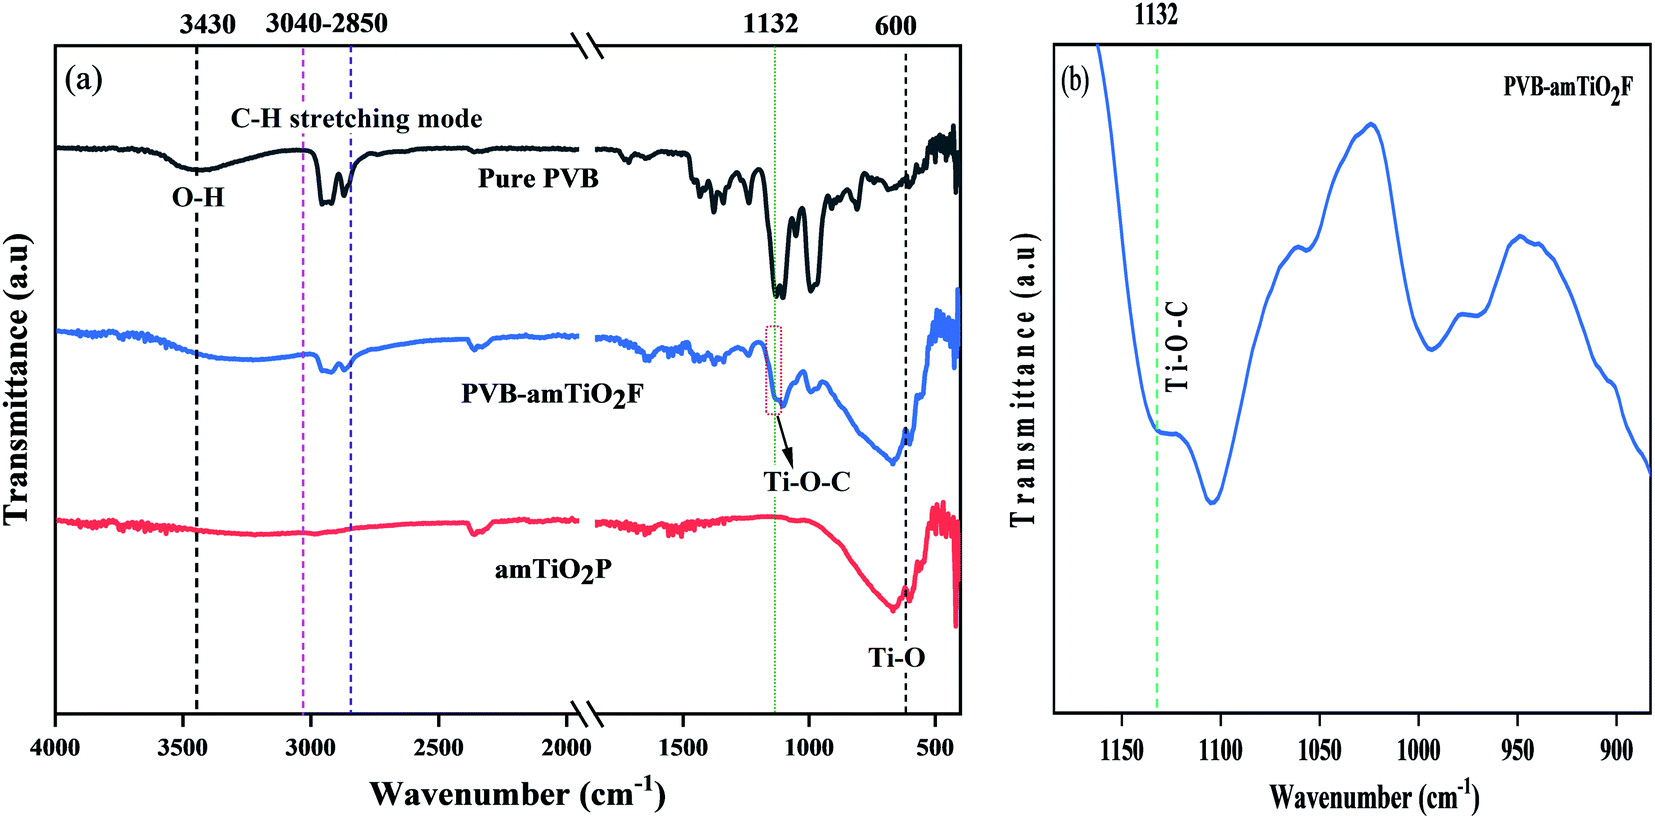
FTIR was used to investigate the chemical structures of pure PVB, PVB–amTiO2F, and amTiO2P samples. Fig. 5(a) shows a comparison of the infrared ATR-FTIR spectra. For pure PVB, there is a wide band corresponding to the –OH group in the range 3200–3600 cm−1, and the stretching modes of C–H in the range 2850–3000 cm−1.22 Moreover, the bending modes of C–H groups were also discernible in the range 1300–1500 cm−1.23 However, significant differences were observed in the C–O–C group band at the 950–1200 cm−1 range. The bands determined at wavenumbers of 1132, 1107, and 1053 cm−1 were for typical PVB.22 These are visible in the measured spectra in Fig. 5(a). But their shapes seem to be little affected in the case of the PVB–amTiO2F sample. In this case, the band at 1053 cm−1 has not fully disappeared, but a small shoulder can be seen. However, the C–O–C group band is transformed to Ti–O–C at 1132 cm−1 due to coordinate bonding between PVB and Ti(OR)4, as demonstrated by the lower peak intensity of the PVB–amTiO2F sample (Fig. 5(b)). Also, the peak at 600 cm−1 is ascribed to absorption bands of Ti–O, related to flexion vibration.24
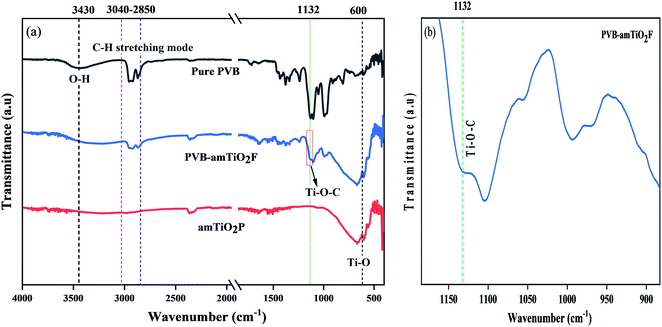 |
| | Fig. 5 ATR-FTIR spectra of (a) pure PVB, amTiO2P, and PVB–amTiO2F; and (b) considered coordinate bonding position in PVB–amTiO2F. | |
XRD
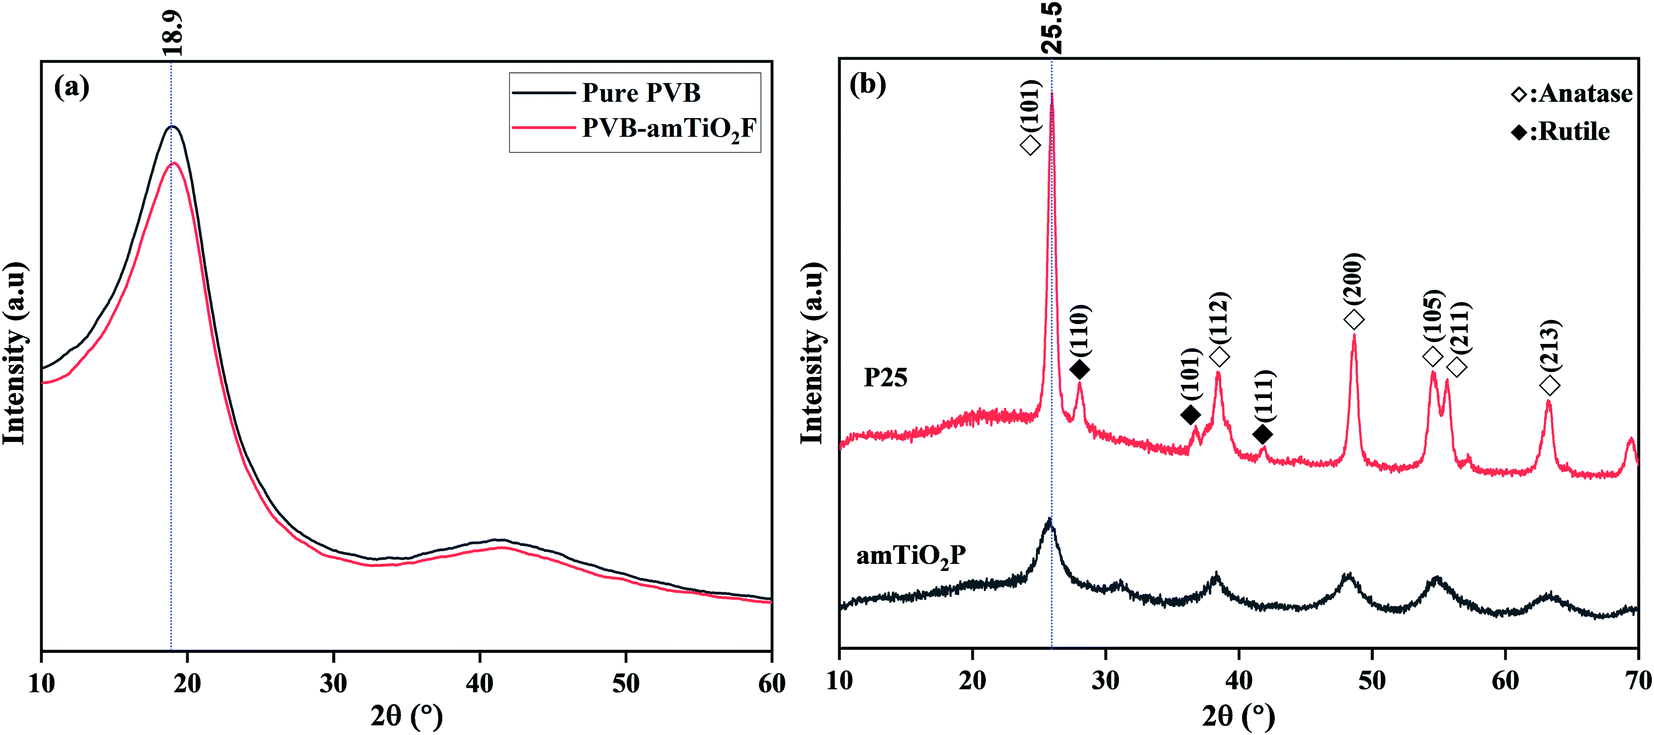
The crystallographic structures and phase alignment of the materials were confirmed by XRD. As shown in Fig. 6(a), pure PVB has a broad diffraction peak at around 18.9°, suggesting that the polymer matrix is amorphous.25 However, no characteristic peak of PVB–amTiO2F appeared in this XRD data, indicating that coordinately bonded TiO2 had a small impact on the fiber's molecular alignment. Furthermore, for confirmation of the characteristic phase of amTiO2 belonging to PVB–amTiO2F, a comparative XRD profile of amTiO2P (hydrolyzed product of TTIP) and commercial P25 is also examined. The diffraction pattern of P25 and amTiO2P is shown in Fig. 6(b), confirming the identical main peak around the 25.5° value, which corresponds to the anatase (101) phase.26 We also used Scherrer's method (Lorentz peak fitting) to compute the crystallite sizes of both samples to determine the peak area. The average crystallite sizes were 16.23 nm and 4.32 nm for P25 and amTiO2P, respectively. As a result, it may be concluded that amTiO2P is mostly amorphous titania with traces of crystalline anatase. Therefore, PVB–amTiO2F is suggested to be amorphous despite the presence of small traces of crystal-sized anatase TiO2.
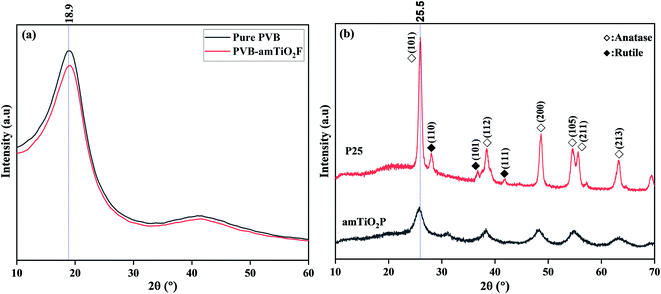 |
| | Fig. 6 XRD patterns of (a) pure PVB and PVB–amTiO2F; and (b) synthesized amTiO2P and P25. | |
EDS measurement
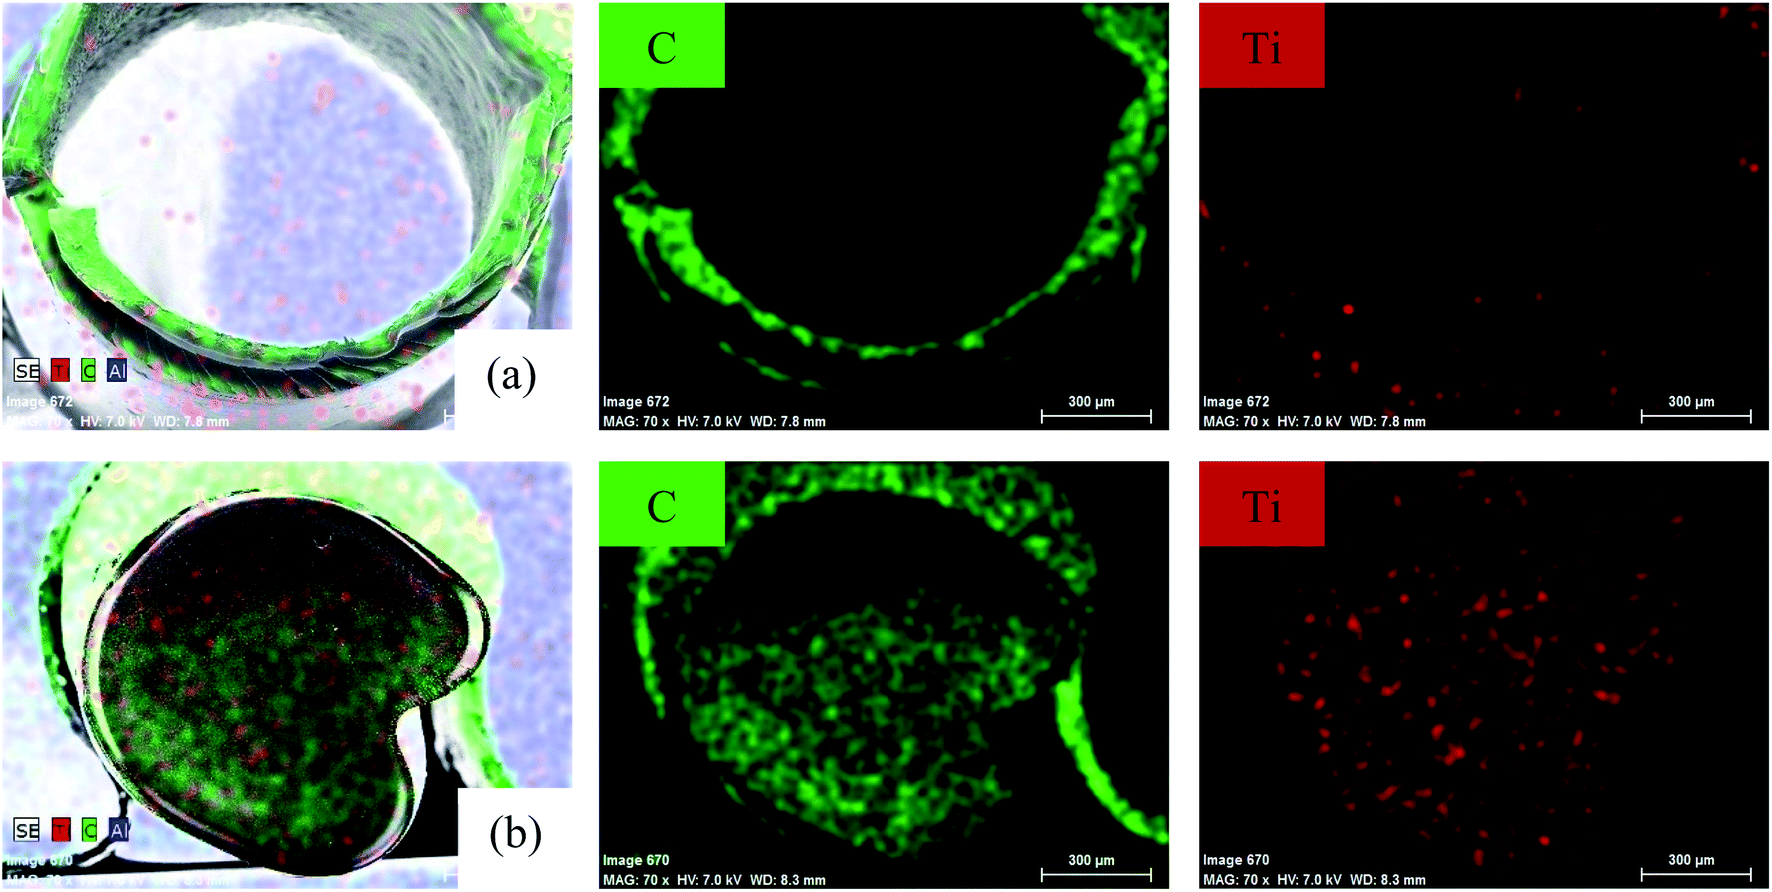
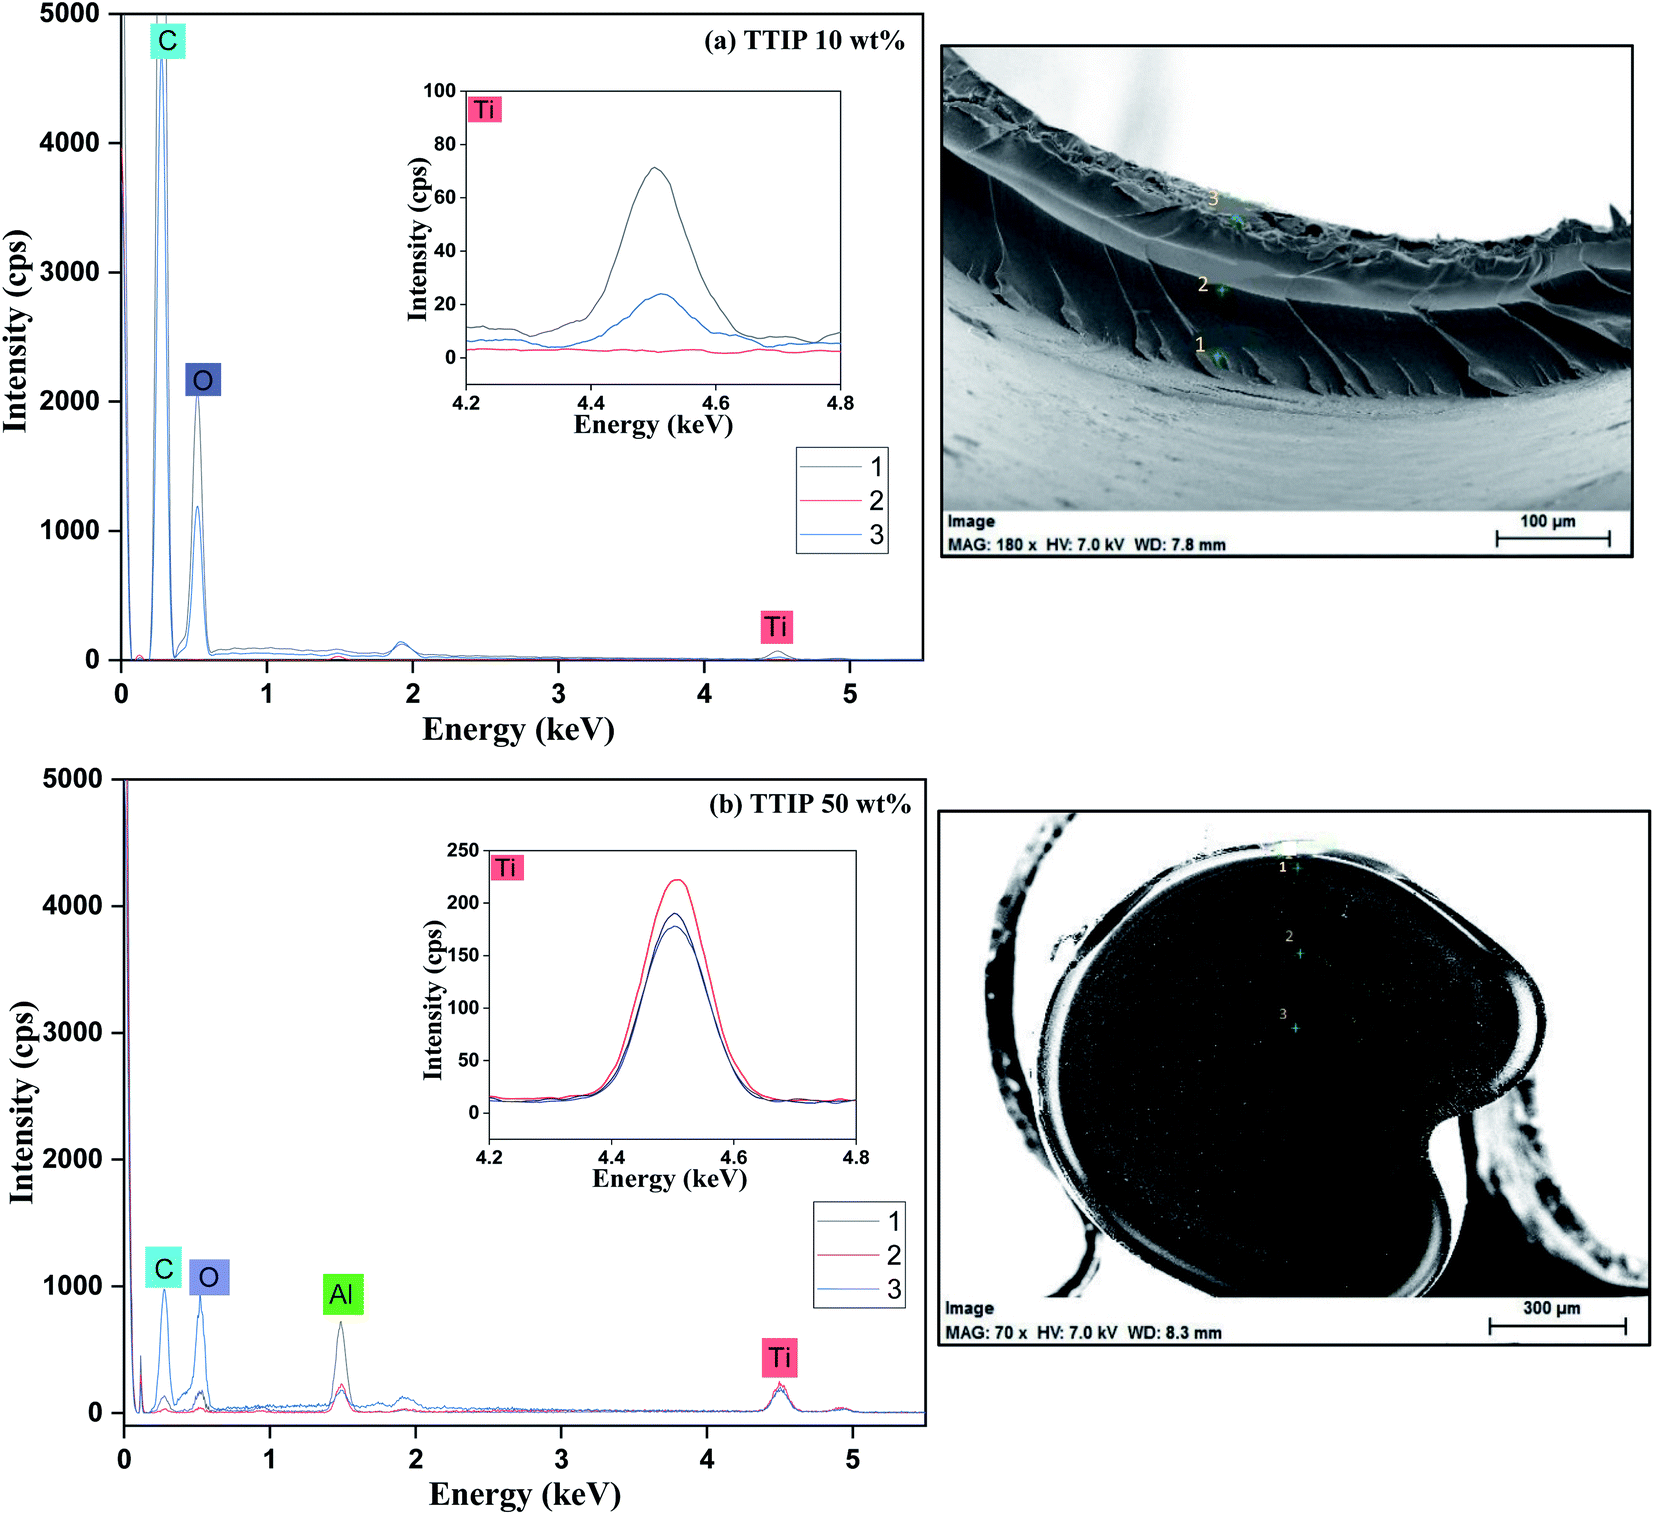
To better understand the distribution of Ti within the fiber, we used EDS measurement on the fiber cross-section. C and Ti mapping pictures for fiber samples prepared at different TTIP bath concentrations are shown in Fig. 7. The illustration shows that Ti mostly existed at the surface for fibers prepared at low-TTIP bath concentrations. This small Ti diffusion from the vicinity to the center is thought to be caused by the slow reaction between PVB and TTIP. However, Ti diffusion could be increased and also uniformly distributed across the fibers prepared at higher concentrations (∼50 wt%). Similar findings were also investigated by point analyses (Fig. 8), where more detailed and precise elemental data (Table S1†) is obtained. These results indicated that the reaction proceeded from the fiber's outer surface. The 10 wt% TTIP concentration may have been low to react with PVB, resulting in small diffusion which only led to local Ti distribution at the fiber surface. But, for 50 wt%, a uniform distribution of Ti is observed within the fiber, which indicates easy diffusion of interacted Ti to the reactive sites.
 |
| | Fig. 7 EDX elemental mapping of PVB–amTiO2F cross-sections prepared with (a) 10 wt% TTIP bath concentrations, and (b) 50 wt% TTIP bath concentrations. | |
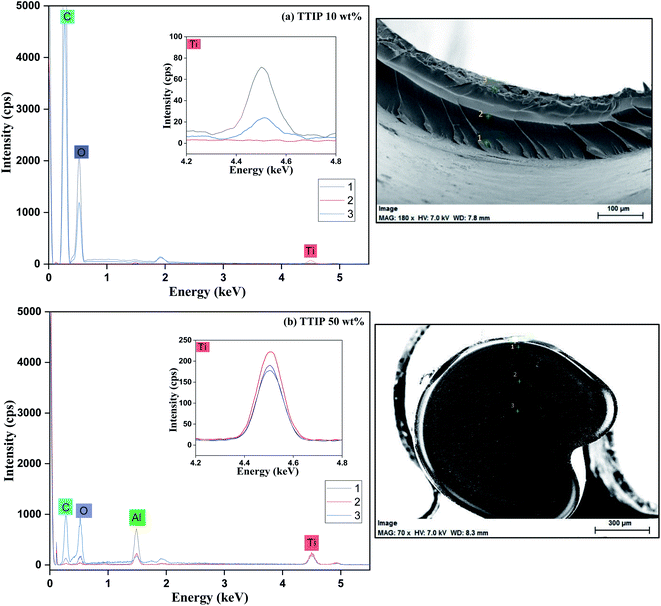 |
| | Fig. 8 Point analysis of EDS for the PVB–amTiO2F samples. 3 analysis points were indicated by green cross in the right-side pictures; point 1 indicates the surface, point 2 indicates the intermediates of the other two and point 3 indicates the center position of the fiber cross-section. Al might appear from the sample holder. The magnified plot (inset) illustrates more Ti distribution at center points for both fibers. | |
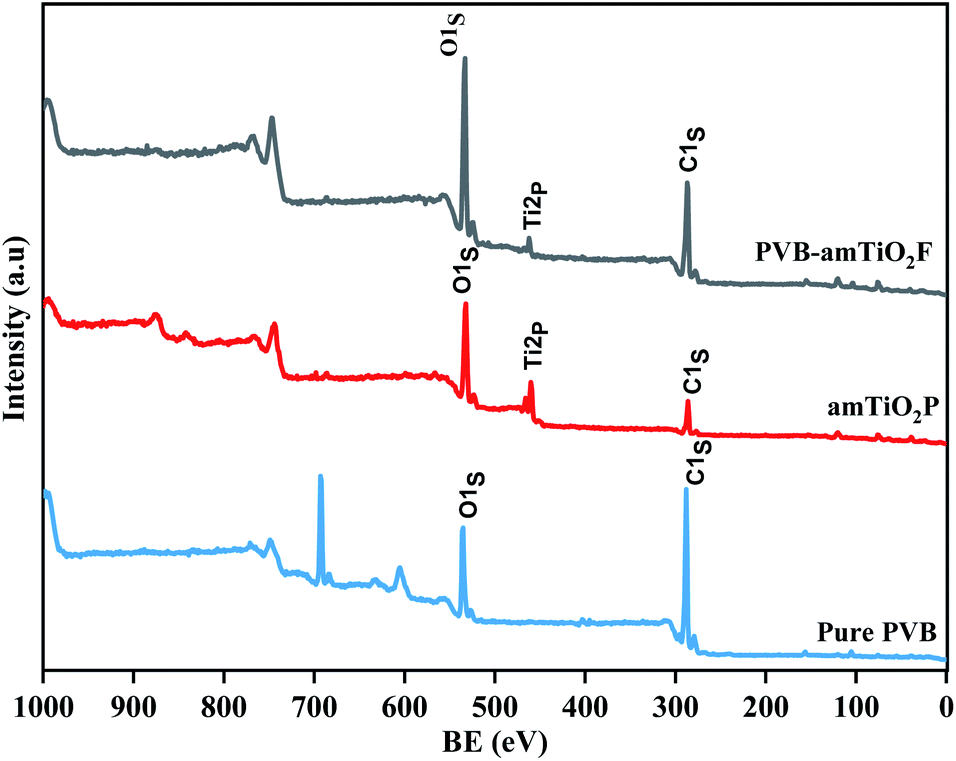
XPS measurements
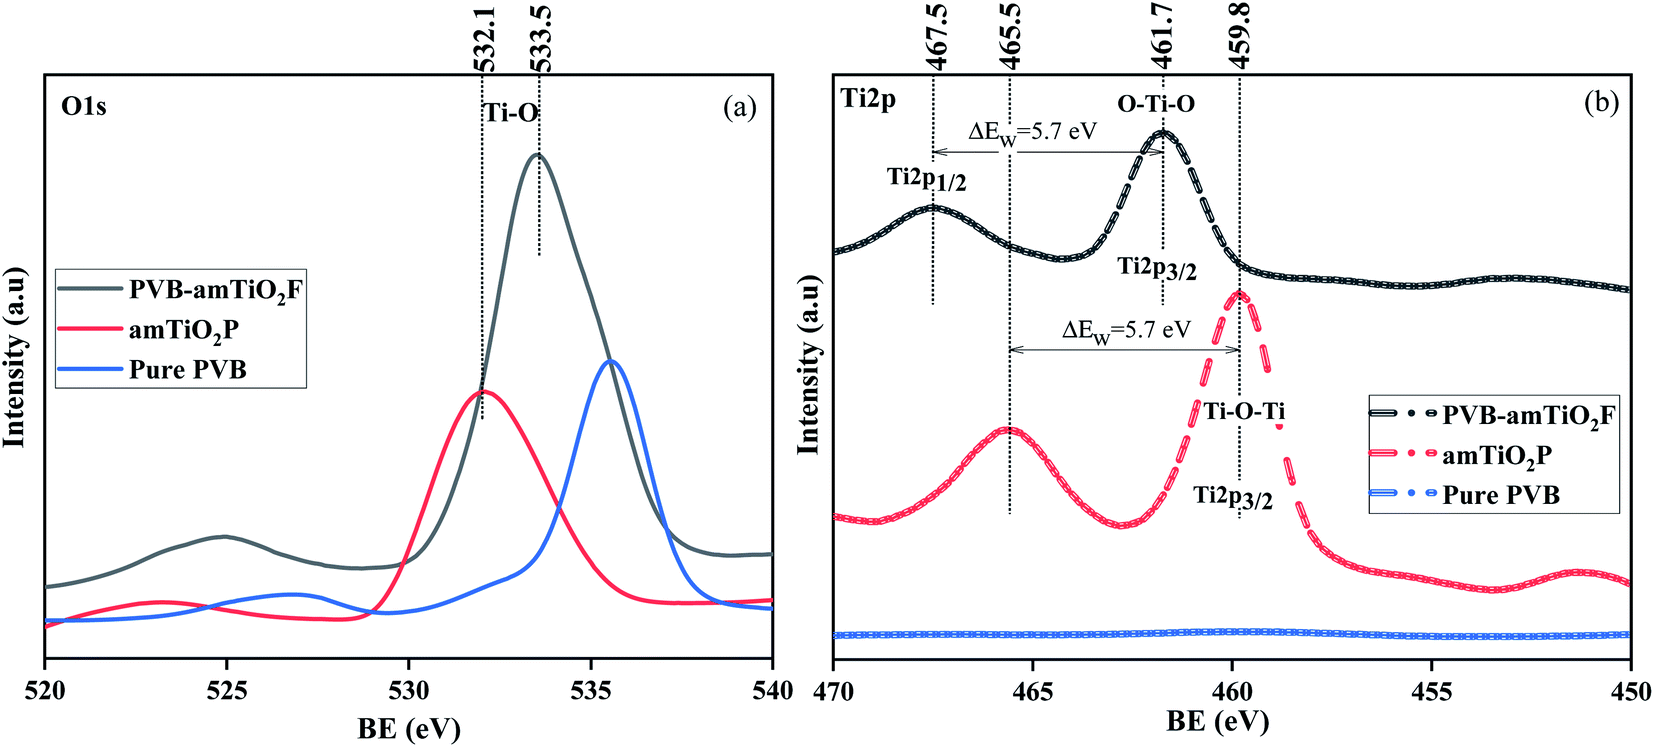
The electron structure on the surface of PVB–amTiO2F was analyzed using XPS to obtain chemical information about C, O, and Ti atoms while bare amTiO2P and pure PVB samples were used as controls (Fig. 9). PVB–amTiO2F and amTiO2P showed obvious peaks of C1s, O1s, and Ti2P, while the XPS pattern of Ti2P was absent only for pure PVB. The spectral analysis O1s results of the PVB–amTiO2F, amTiO2P, and pure PVB samples are enlarged in Fig. 10(a). The O1s peak of amTiO2P at 532.1 eV can be ascribed to the Ti–O bond.27 However, there was a positive shift in the Ti–O bond binding energy for PVB–amTiO2F, which was most likely due to the presence of a coordinate bond between the acetyl group of PVB and TiO2. For amTiO2P, the spin–orbit splitting (5.7 eV) of Ti2p led to the appearance of two 2p peaks at around 459.8 and 465.5 eV, corresponding to Ti2p3/2 and Ti2p1/2, respectively (Fig. 10(b)). According to the splitting, it is suggested that Ti was mostly Ti4+. Since the oxygen element was more electronegative than the titanium, the two Ti2p peaks of PVB–amTiO2F were 1.9 eV higher than those of amTiO2P, reaching 461.7 eV and 467.5 eV, respectively.28 The positive Ti2p3/2 shifts resulting from the replacement of a certain Ti–O–Ti bond29 with an O–Ti–O bond for PVB–amTiO2F can be attributed to the low-intensity fitted peaks. Besides, there is a shoulder near the Ti2p3/2 peak, which can be attributed to the Ti3+ state.30
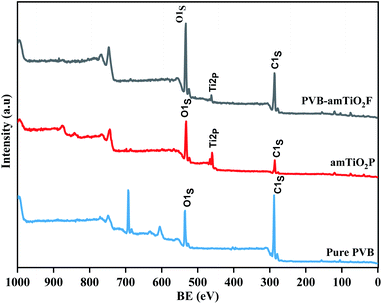 |
| | Fig. 9 Wide-scan XP spectra of pure PVB, amTiO2P, and PVB–amTiO2F. | |
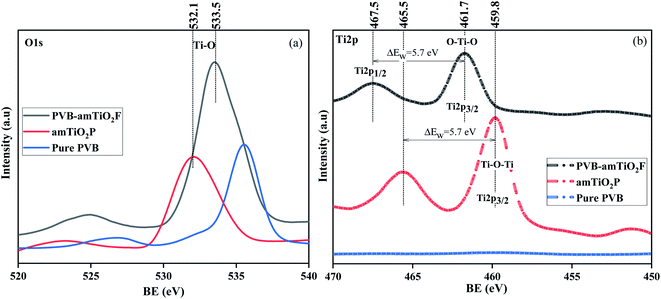 |
| | Fig. 10 XP spectra of pure PVB, amTiO2P, and PVB–amTiO2F; (a) O1s spectra, and (b) Ti2p. | |
Porous structure analysis
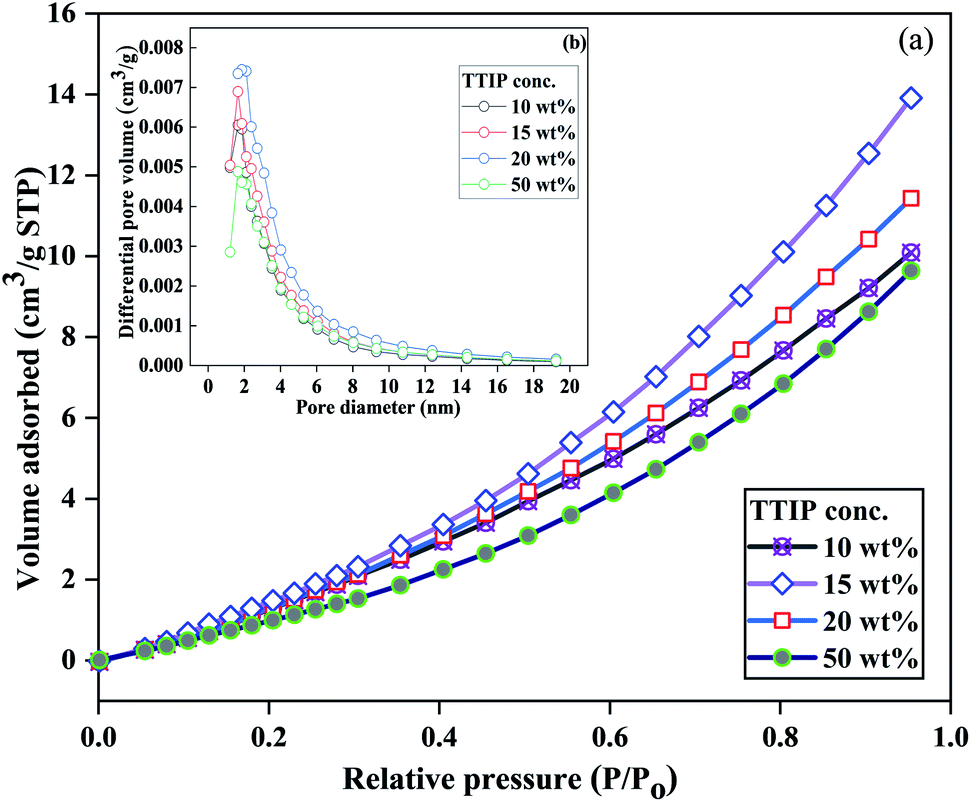
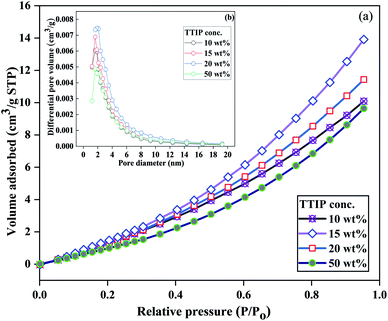
Fig. 11 shows the N2 adsorption isotherms and the corresponding BJH total pore volume plots of PVB–amTiO2F with different TTIP bath concentrations. At relatively high pressure, the curve exhibits convexity to the P/P0 axis in Fig. 11(a), which is attributed to a type III isotherm where adsorbent and adsorbate had low interactions.31 The BJH adsorption pore size distribution of the fibers was narrow, with a mean value of 6.8 nm, suggesting that the materials have a typical mesoporous layer in the external surface. No significant changes in pore size distribution were observed when the TTIP bath concentration was changed, as shown in Fig. 11(b). However, the lower pore volume of the 50% TTIP concentration sample confirmed a relatively dense external fiber surface which may be due to less PVB swelling during fiber preparation. For 10 wt% to 50 wt% samples, the BET surface area is represented in Table S2.† These differences are ascribed to the collapse of some mesopores at the non-hollow structure and the agglomeration of the amTiO2 particles in the external surface. Also, the bonded Ti species on the mesostructured network are increased due to the high diffusion of amTiO2, which subsequently preserves the relatively low surface area with an integrated non-hollow structure.
 |
| | Fig. 11 (a) N2 adsorption isotherms (−196 °C), and (b) the corresponding BJH pore size distribution plots of PVB–amTiO2F with different TTIP bath concentrations. | |
Effects of pH on MB adsorption
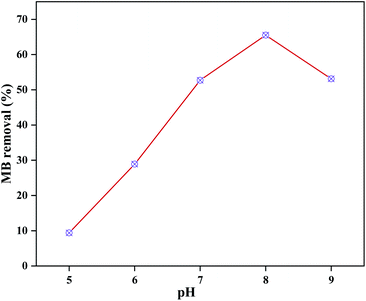
This series of tests was carried out using 0.2 g of 20 wt% PVB–amTiO2F, 10 mL (10 mg L−1) of dye, and equilibrium adsorption time in the dark. Solution pH is an important factor that affects the magnitude of the adsorbent surface charge and the dye molecule's ionization state. Fig. 12 shows that the adsorption of MB increased from 10 to 65% when the pH was increased from 5 to 8 and then a decrease started due to desorption. The parent fragment of MB dye carries a positive charge. In this work, the pHpzc of the as-prepared PVB–amTiO2F was 6.4 (Fig. S5†), measured by the pH drift method,32,33 which is considered comparable with a CA–TiO2 composite gel fiber prepared by Kurokawa.20 At pH < pHpzc, a repulsive electrostatic force was generated due to the increased number of positively charged sites on the fiber surface which did not favor the adsorption of dye cations. Conversely, higher uptake values were obtained at pH > pHpzc because of electrostatic attractions between the positively charged dye and the negatively charged fiber TiO2 according to eqn (6).20,34–36 Considering the above points, a pH of 8 was chosen as the experimental pH for the removal of dye in the subsequent experiments.| |
 | (6) |
 |
| | Fig. 12 Effect of the solution pH on equilibrium MB dye adsorption performance exhibited by 20 wt% PVB–amTiO2F. | |
MB adsorption performance
We conducted adsorption studies in the dark to clarify the adsorption ability of PVB–amTiO2F before analyzing its photoreduction performance. Fig. 13 shows the change in the MB concentration as a function of time when the PVB–amTiO2F samples were kept in the test solutions. In this diagram, A denotes the absorbance at each given time whereas A0 indicates the test solution's initial absorbance. It can be seen that the adsorption capacity of different PVB–amTiO2F was related to their porous structure and relative Ti content. As depicted in Fig. 13, the removal % increased with increasing residual Ti content and the relevant porous property of the PVB–amTiO2F, adsorbing a maximum of about 70% MB when reaching equilibrium. Meanwhile, the adsorption of dye molecules by 15 wt% PVB–amTiO2F seemed to be rather perplexing, showing down to about 48% uptake for a similar timespan. This might be attributed to the fiber's changing surface area and the variations in their mesoporous outer wall where diffusion starts from one site to another. A similar result was also reported by Asai et al.13
 |
| | Fig. 13 The adsorption dynamics of MB in different reaction systems, when the samples were immersed into the MB solutions in the dark. Reaction conditions: Fiber: 0.2 g, 10 mL (10 mg L−1) MB, pH ∼ 8.0, at 18 °C. | |
Adsorption kinetics
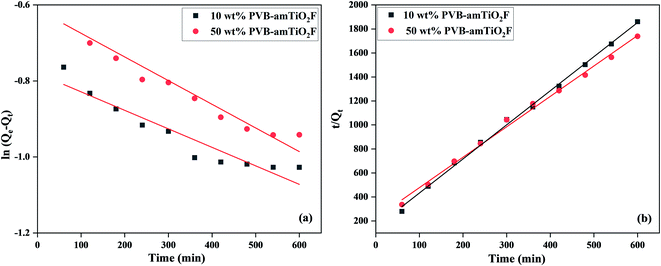
The adsorption kinetic results of MB on PVB–amTiO2F were evaluated using Lagergren pseudo-first-order and pseudo-second-order models, as depicted in Fig. 14(a) and (b), and Table 1. The best fit of the linear equations suggested that the pseudo-second-order kinetics model gave Qe,cal values close to the experimental Qe values. Furthermore, the regression coefficients (R2) for the pseudo-second-order kinetics model were 0.997 and 0.994 for MB absorption on 10 wt% and 50 wt% PVB–amTiO2F, respectively, better than the Lagergren pseudo-first-order kinetic model. This result indicated that the pseudo-second-order model of MB's adsorption kinetics on PVB–amTiO2F provides more in-depth information, so the kinetics could be categorized as chemisorption,38 because of electrostatic interactions between the fiber and dye functional groups.12 Similar MB adsorption kinetics on the other adsorbents have also been commonly studied.37 But in our study, higher adsorbent dose and longer adsorption equilibrium time have a great influence on the kinetics and hinder the adsorption capacity. The efficient adsorptive removal of MB using PVB–amTiO2F is compared with other amorphous titania adsorbents in Table 2.
 |
| | Fig. 14 The adsorption kinetic plots of MB on PVB–amTiO2F fitted with (a) pseudo-first-order, and (b) pseudo-second-order models. | |
Table 1 The adsorption kinetics parameters of MB on PVB–amTiO2F calculated from the best fitting of pseudo-first-order and pseudo-second-order models
| Kinetics model |
Parameters |
10 wt% PVB–amTiO2F Qe,exp (mg g−1) = 0.34 |
50 wt% PVB–amTiO2F Qe,exp (mg g−1) = 0.367 |
| Pseudo 1st order |
Qe,cal (mg g−1) |
0.458 |
0.542 |
| K1 (min−1) |
−8.11 × 10⁻⁷ |
−1.03 × 10⁻⁶ |
| R2 |
0.887 |
0.922 |
| |
|
|
|
| Pseudo 2nd order |
Qe,cal (mg g−1) |
0.351 |
0.394 |
| K2 (min−1) |
0.054 |
0.028 |
| R2 |
0.997 |
0.994 |
Table 2 Comparison on equilibrium adsorption % of dye onto different amorphous titania adsorbents
| Adsorbent |
Adsorbent type |
Dye |
Adsorption (%) |
References |
| Amorphous TiO2 |
Particle |
CV |
87–98 |
11 |
| Curcumin-sensitized amorphous TiO2 |
Composite |
MB |
40–60 |
6 |
| Orange-II |
45 |
| Amorphous TiO2 |
Particle |
MG |
∼80 |
12 |
| CV |
∼97 |
| TiO2 sulfonated carbon |
Composite |
MB |
∼99 |
37 |
| CR |
∼98 |
| CA–amTiO2F |
Fiber |
MB |
∼60 |
13 |
| PVB–amTiO2F |
Fiber |
MB |
68–70 |
This study |
Decomposition abilities for MB
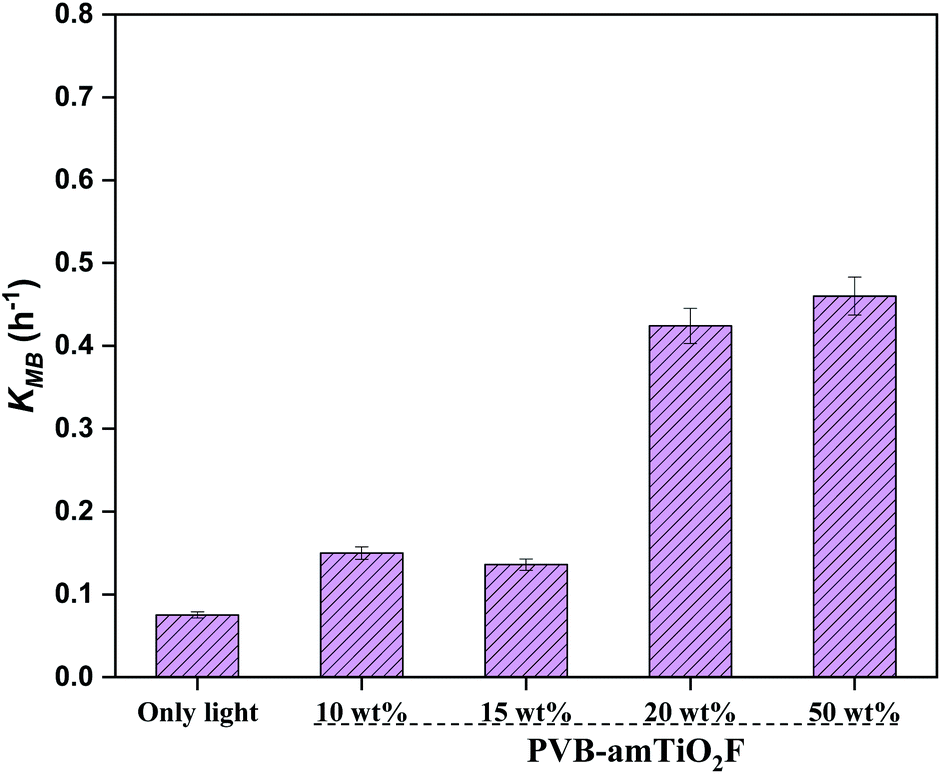
We continued to examine the reduction ability of MB under visible light after the adsorption experiments described above. The absorbance was normalized by the absorbance after 10–11 h dark adsorption, denoted by A1, given in the eqn below,where K represents the rate constant, and t is the total time employed for the test. Fig. 15 shows the variation in fitting lines for A/A1 in MB reduction using eqn (7). The measured K values from the line fits are illustrated in Fig. 16. Overall, the lower Ti content PVB–amTiO2F showed very low KMB values which are almost comparable to ‘only-light’ samples, suggesting an absence of photodegradation. However, setting 10 wt% and 15 wt% aside, the 20 wt% and 50 wt% fiber samples showed little and slow photoactivity. This is evidence confirming the low photocatalytic property for amorphous TiO2 hybrid fibers which is a similar result to that shown by Kanna et al.11 and Asai et al.13
 |
| | Fig. 15 Variation in normalized absorbance for MB concentrations by visible light irradiation, as a function of immersion time. The lines represent the fitting results using eqn (7). | |
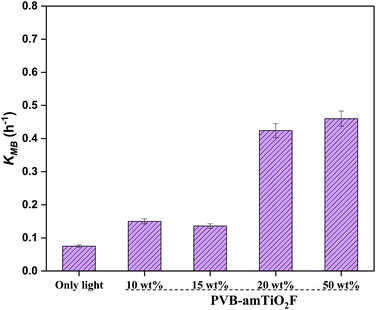 |
| | Fig. 16 Decomposition rate constant for MB obtained from the fitting in Fig. 15. | |
Removal abilities against other dyes
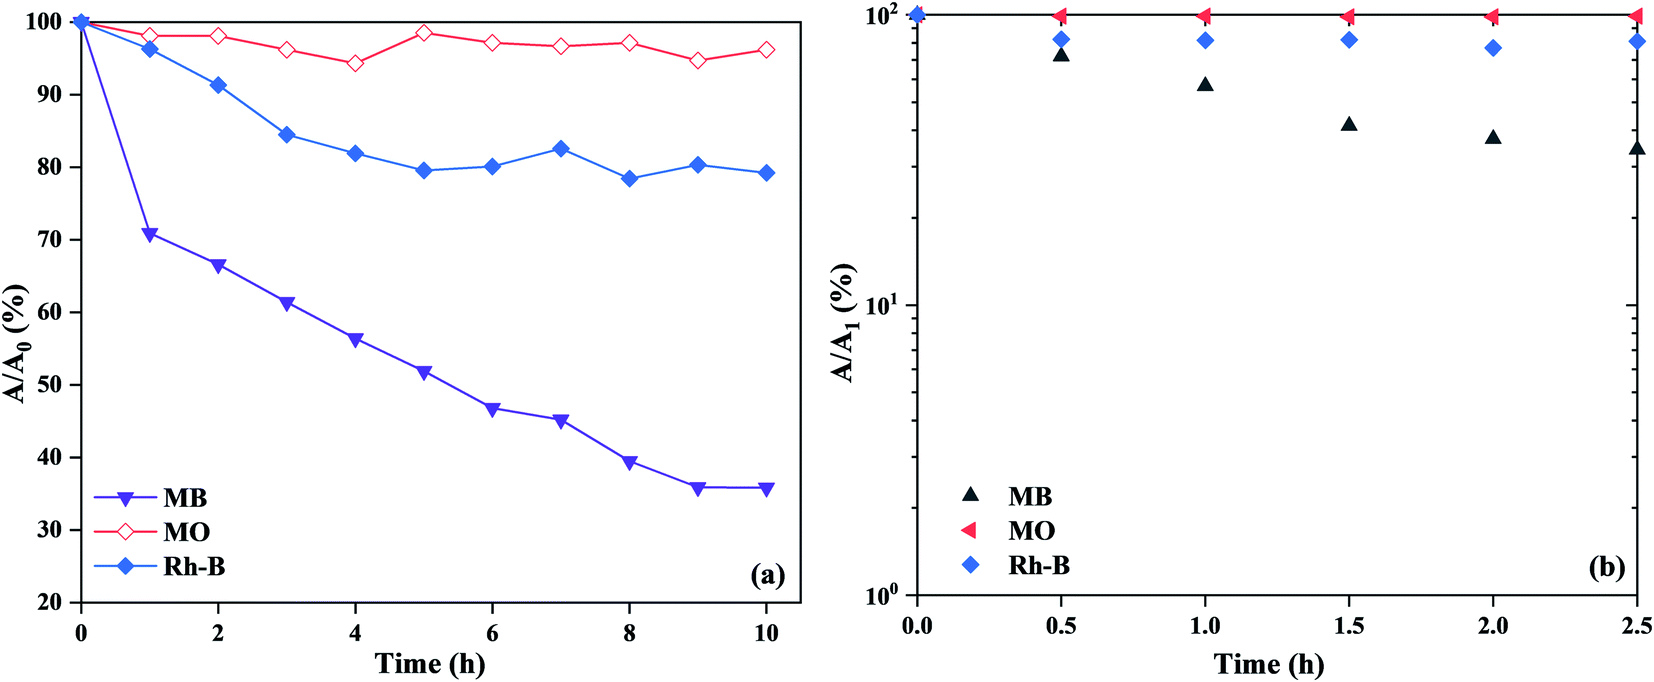
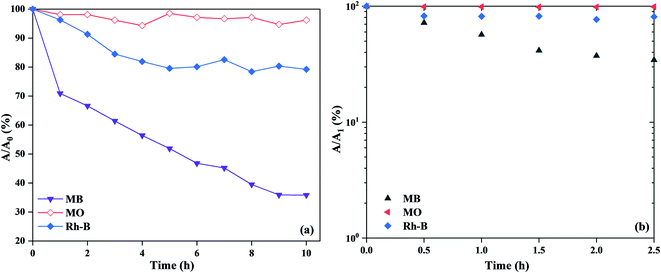
For the comparison with MB dye, we also investigated the adsorption and decomposition ability of PVB–amTiO2F on other dyes such as acidic MO and zwitterionic Rh-B. According to Fig. 17(a), the adsorption capacities for MB, Rh-B, and MO were ∼68%, ∼20%, and ∼4%, respectively, consistent with the experimental capacity order of MB > Rh-B > MO. Considering the molecular sizes of the dyes, it is reasonable that adsorption of bulky Rh-B required a long time and resulted in a lower adsorption amount compared to MB, even though both can show cationic behavior. Meanwhile, the low adsorption value for MO was attributed to the more electrostatic repulsion between the negatively charged adsorbent (PVB–amTiO2F) and the anionic MO dye molecule.39,40 Fig. 17(b) shows decomposition abilities of 20 wt% PVB–amTiO2F for the above-mentioned dyes under visible light. MB and Rh-B could be decomposed by PVB–amTiO2F but MO was unchanged. To ascertain the true nature of PVB–amTiO2F, we could conclude that adsorption becomes a dominant factor here.11 For reference, in the dye solutions without any fiber samples, MO and Rh-B were not decomposed (Fig. S6†). Therefore, the removal of MB and Rh-B shown in Fig. 17(b) can be attributed to the presence of PVB–amTiO2F.
 |
| | Fig. 17 (a) The capacity of adsorbed MB, MO, and Rh-B dyes in the dark, and (b) dye decomposition ability in visible light irradiation for 20 wt% PVB–amTiO2F, reaction conditions: fiber 0.2 g, 10 mL (10 mg L−1) dyes, pH ∼ 8.0, at 18 °C. | |
Possible mechanism of MB dye adsorption and photodegradation
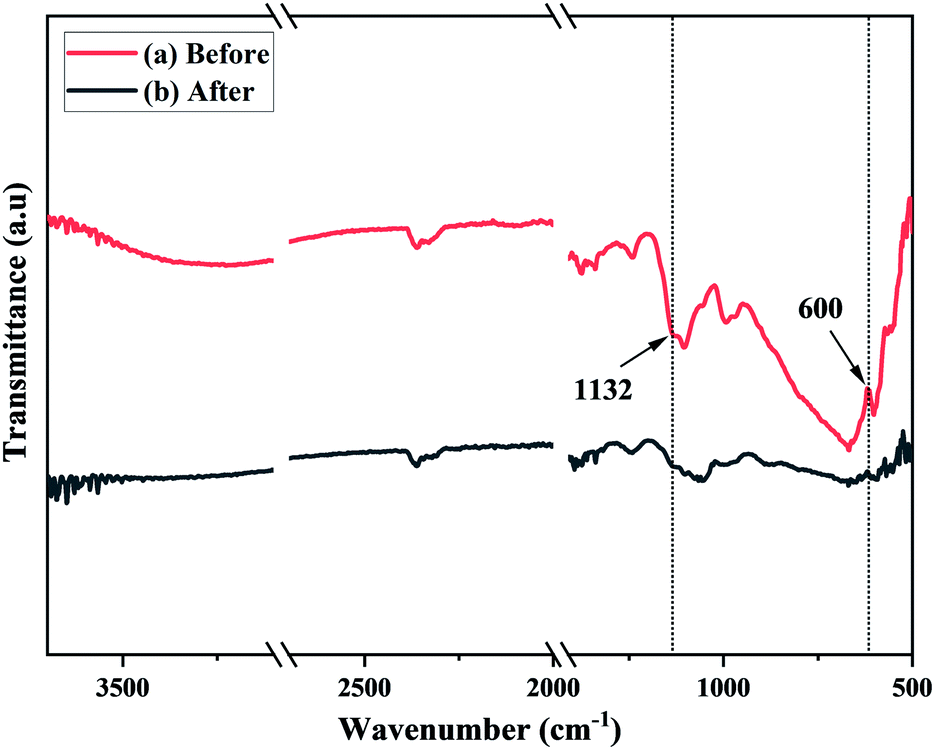
From the adsorption and decoloration behavior of PVB–amTiO2F, we concluded that these reactions were independent but influenced by some other factors. In our results, cationic MB was adsorbed by PVB–amTiO2F. The removal mechanism of MB dye onto PVB–amTiO2F involves the electrostatic attraction between the dye and adsorbent ionic charges which are postulated with pH results.4,11,12,20,37 Fig. 18 shows the affected peak positions and intensity of PVB–amTiO2F after MB adsorption. The peak intensity around the Ti–O–C band at 1132 cm−1 and around the Ti–O band at 600 cm−1 is decreased due to the interactions of MB. Furthermore, the presence of nitrogen atoms in the MB dye structure could form hydrogen bonds with –OH groups of PVB–amTiO2F.4,38 But we could not find such evidence from the FTIR spectra in our study. Since the fragment of MB bears a positive charge, it should be favorably adsorbed to the negative sites of the PVB–amTiO2F surface and subsequently could be attacked by the very active ˙OH fraction under visible light, according to the same process described by Kanna et al.11 Overall, the mode of MB removal by PVB–amTiO2F was mostly by adsorption (∼68%), but with combined prolonged adsorption and photocatalytic activity, it could be enhanced up to ∼85% or more.
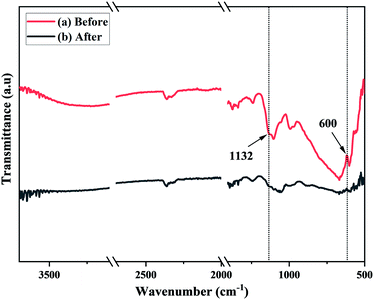 |
| | Fig. 18 ATR-FTIR spectra of PVB–amTiO2F (a) before, and (b) after MB adsorption. | |
Reusability
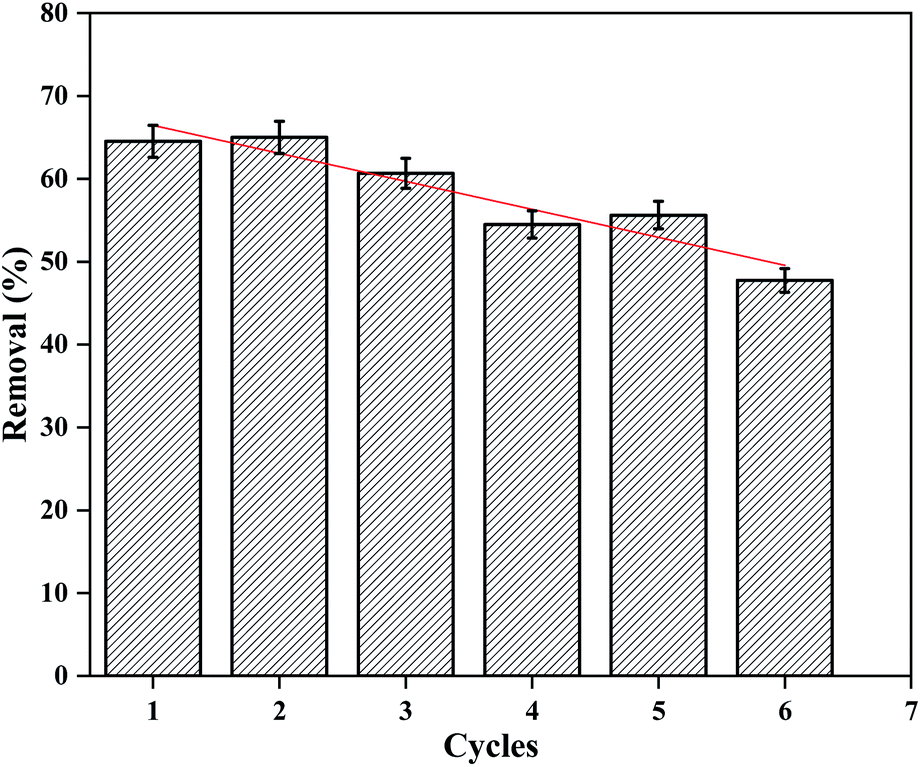
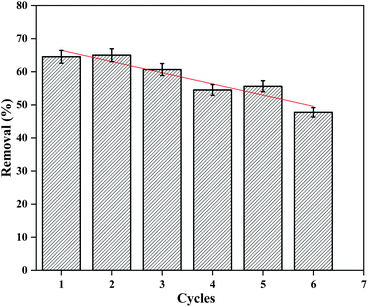
An extended study was accomplished for six adsorption/desorption cycles to assess the reusability of the developed PVB–amTiO2F. Desorption of MB dye was executed by soaking the dye-adsorbed PVB–amTiO2F in 20 mL of ethanol solution, under gentle stirring for 8–10 h. After regeneration, the PVB–amTiO2F was reused in the next adsorption run. Fig. 19 shows the repeatability study of PVB–amTiO2F. After six cycles, the removal efficiency was 47–48%, which could indicate the reusability and durability of the fabricated PVB–amTiO2F for MB adsorption.
 |
| | Fig. 19 Reusability of PVB–amTiO2F in MB adsorption. | |
Conclusions
In this study, we investigated the phenomenon whereby poly(vinyl butyral) fibers, cross-linked by amorphous TiO2 (i.e. PVB–amTiO2F), removed MB dye upon visible light irradiation. According to this study, the principle of removing dye from the aqueous solution was mainly by chemisorption (∼68%). The adsorption and degradation dynamics were mostly controlled by the fiber's relative Ti content, surface area, and the charge characteristics of the dyes. The ability of PVB–amTiO2F to remove dye from different dye solutions revealed that they could be most efficient for cationic dyes, but not for acidic dyes. In addition, a repeatability test of PVB–amTiO2F showed an average to good reuse possibility for several times with little decrease in the removal percentage.
Author contributions
A. H. Bhuiyan studied the experimental design, implemented the experiment, examined the data and results, and finally organized the manuscript. M. Zakaria helped in the experimental implementation and apparatus use. K. Nakane provided the concept, supervised the work, and reviewed the manuscript. All authors have read and approved to manuscript submission.
Conflicts of interest
The authors declare that they have no conflict of interest.
Acknowledgements
A. H. Bhuiyan is thankful to the Japanese Government for supporting PhD financial grants (MEXT:MONBUKAGAKUSHO scholarship).
References
- A. S. Eltaweil, I. M. Mamdouh, E. M. Abd El-Monaem and G. M. El-Subruiti, ACS Omega, 2021, 6, 23528–23541 CrossRef CAS PubMed
 .
. - M. Oz, D. E. Lorke, M. Hasan and G. A. Petroianu, Med. Res. Rev., 2011, 31, 93–117 CrossRef CAS PubMed .
- C. D. Carneiro, J. C. Amorim, S. M. Cadena, G. R. Noleto, P. Di Mascio, M. E. Rocha and G. R. Martinez, Food Chem. Toxicol., 2010, 48, 2380–2387 CrossRef CAS PubMed .
- A. S. Eltaweil, E. M. Abd El-Monaem, G. M. El-Subruiti, M. M. Abd El-Latif and A. M. Omer, RSC Adv., 2020, 10, 19008–19019 RSC .
- V. L. E. Siong, X. H. Tai, K. M. Lee, J. C. Juan and C. W. Lai, RSC Adv., 2020, 10, 37905–37915 RSC .
- S. Buddee and S. Wongnawa, J. Sol-Gel Sci. Technol., 2015, 75, 152–163 CrossRef CAS .
- S. Sun, P. Song, J. Cui and S. Liang, Catal. Sci. Technol., 2019, 9, 4198–4215 RSC .
- M. K. I. Senevirathna, P. Pitigala and K. Tennakone, J. Photochem. Photobiol., A, 2005, 171, 257–259 CrossRef CAS .
- B. Ohtani, Y. Ogawa and S. Nishimoto, J. Phys. Chem. B, 1997, 101, 3746–3752 CrossRef CAS .
- Q. Wang, X. Chen, K. Yu, Y. Zhang and Y. Cong, J. Hazard. Mater., 2013, 246, 135–144 CrossRef PubMed .
- M. Kanna, S. Wongnawa, S. Buddee, K. Dilokkhunakul and P. Pinpithak, J. Sol-Gel Sci. Technol., 2010, 53, 162–170 CrossRef CAS .
- P. Sriprang, S. Wongnawa and O. Sirichote, J. Sol-Gel Sci. Technol., 2014, 71, 86–95 CrossRef CAS .
- H. Asai, S. Kato and K. Nakane, Solid State Sci., 2019, 88, 67–73 CrossRef CAS .
- A. H. Bhuiyan, T. Nagakawa and K. Nakane, J. Appl. Polym. Sci., 2021, 138, 50164 CrossRef CAS .
- H. Kyung, J. Lee and W. Choi, Environ. Sci. Technol., 2005, 39, 2376–2382 CrossRef CAS .
- T. P. Ang, J. Y. Law and Y.-F. Han, Catal. Lett., 2010, 139, 77–84 CrossRef CAS .
- K. S. Srikanth, H. S. Kushwaha and R. Vaish, Mater. Sci. Semicond. Process., 2018, 73, 51–57 CrossRef CAS .
- J.-P. Simonin, Chem. Eng. J., 2016, 300, 254–263 CrossRef CAS .
- D. Robati, J. Nanostruct. Chem., 2013, 3, 1–6 Search PubMed .
- Y. Kurokawa, Polym. Gels Networks, 1996, 4, 153–163 CrossRef CAS .
- A. A. Hanna, A. H. Basta, H. El-Saied and I. F. Abadir, Polym. Degrad. Stab., 1999, 63, 293–296 CrossRef CAS .
- E. Corroyer, M.-C. Brochier-Salon, D. Chaussy, S. Wery and M. N. Belgacem, Int. J. Polym. Anal. Charact., 2013, 18, 346–357 CrossRef CAS .
- P. Peer, M. Polaskova and P. Suly, Chin. J. Polym. Sci., 2018, 36, 742–748 CrossRef CAS .
- P. Kongsong, L. Sikong, S. Niyomwas and V. Rachpech, Photocatalytic Antibacterial Performance of Glass Fibers Thin Film Coated with N-Doped SnO2/TiO2, https://www.hindawi.com/journals/tswj/2014/869706/, accessed February 12, 2021 Search PubMed.
- Z. Lei, Z. Chen, Y. Zhou, Y. Liu, J. Xu, D. Wang, Y. Shen, W. Feng, Z. Zhang and H. Chen, Compos. Sci. Technol., 2019, 180, 44–50 CrossRef CAS .
- K. Alamelu, V. Raja, L. Shiamala and B. J. Ali, Appl. Surf. Sci., 2018, 430, 145–154 CrossRef CAS .
- T. N. Nguyen, V. V. Tran, V. K. H. Bui, M. Kim, D. Park, J. Hur, I. T. Kim, H. U. Lee, S. Ko and Y.-C. Lee, J. Nanosci. Nanotechnol., 2020, 20, 6844–6849 CrossRef CAS PubMed .
- L. Ji, S. Zhou, X. Liu, M. Gong and T. Xu, J. Mater. Sci., 2020, 55, 2471–2481 CrossRef CAS .
- M. Xing, F. Shen, B. Qiu and J. Zhang, Sci. Rep., 2014, 4, 1–7 Search PubMed .
- M. S. P. Francisco, V. R. Mastelaro, P. A. Nascente and A. O. Florentino, J. Phys. Chem. B, 2001, 105, 10515–10522 CrossRef CAS .
- K. S. Sing, D. H. Everett, R. A. W. Haul, L. Moscou, R. A. Pierotti, J. Rouquerol and T. Siemieniewska, Pure Appl. Chem., 1985, 57, 603–619 CAS .
- Y. Bessekhouad, D. Robert, J.-V. Weber and N. Chaoui, J. Photochem. Photobiol., A, 2004, 167, 49–57 CrossRef CAS .
- B. K. Nandi, A. Goswami and M. K. Purkait, Appl. Clay Sci., 2009, 42, 583–590 CrossRef CAS .
- F. Çiçek, D. Özer, A. Özer and A. Özer, J. Hazard. Mater., 2007, 146, 408–416 CrossRef PubMed .
- X. Wang, N. Zhu and B. Yin, J. Hazard. Mater., 2008, 153, 22–27 CrossRef CAS PubMed .
- A. Aguedach, S. Brosillon and J. Morvan, Appl. Catal., B, 2005, 57, 55–62 CrossRef CAS .
- I. I. Widiyowati, M. Nurhadi, M. Hatami and L. S. Yuan, Bull. Chem. React. Eng. Catal., 2020, 15, 476–489 CrossRef CAS .
- N. I. I. Zamri, S. L. N. Zulmajdi, N. Z. A. Daud, A. H. Mahadi, E. Kusrini and A. Usman, SN Appl. Sci., 2021, 3, 1–16 Search PubMed .
- N. Mohammadi, H. Khani, V. K. Gupta, E. Amereh and S. Agarwal, J. Colloid Interface Sci., 2011, 362, 457–462 CrossRef CAS PubMed .
- K. M. Dalia, A. Mohamad, A. Wan, I. Azni and Z. A. Zurina, Chem. Eng. J., 2012, 449–457 Search PubMed .
Footnote |
| † Electronic supplementary information (ESI) available. See DOI: 10.1039/d1ra07247a |
|
| This journal is © The Royal Society of Chemistry 2022 |
Click here to see how this site uses Cookies. View our privacy policy here. 
 Open Access Article
 This Open Access Article is licensed under a Creative Commons Attribution-Non Commercial 3.0 Unported Licence
 ab,
Mohammad Zakaria
ab,
Mohammad Zakaria