 Open Access Article
Curvature-induced defects on carbon-infiltrated carbon nanotube forests
Stephanie R. Morco,
Brian D. Jensen and
Anton E. Bowden *
*
Brigham Young University, Department of Mechanical Engineering, 350 Engineering Building, Provo, UT 84602, USA. E-mail: abowden@byu.edu
First published on 12th January 2022
Abstract
A morphological study of the micro-scale defects induced by growing a carbon-infiltrated carbon nanotube (CICNT) forest on concave substrates was conducted. Two CICNT heights (roughly 60 μm and 400 μm) and 4 curvatures (1–4 mm ID) were studied in order to test the geometric limitations. Defects were categorized and quantified by scanning electron microscopy (SEM) of the tops and cross-sections. These deformities were categorized as increased roughness on the top surface, a corrugated (also called wavy or rippled) forest, a curved forest, an inside crevice where the forest separates, and increased forest density on the top surface. Roughness increased nearly 3-fold with the taller forest heights no matter the substrate curvature. Due to the geometric limitations of CICNT height and substrate curvature, all other microscale defects were significantly more present on samples with a small radius of curvature and a tall CICNT forest (p < 0.05). These buckling and warping types of defects were attributed to the increase in circumferential compression as the forest grows as well as the van der Waals interactions between the nanotubes. Because the fabrication process for CICNT involves growing a CNT forest and then infiltrating it with pyrolytic carbon, this work may be applicable to other CNT forests on concave substrates within these forest heights and substrate curvatures.
Introduction
The unique mechanical, electrical, and chemical properties of carbon nanotube (CNT) “forests” give this material an extensive range of practical applications.1 A few of these include energy storage,2,3 chromatography,4,5 flexible electronics,6 and biomedical applications.7–9 Although many potential applications require a CNT forest coating on a rod or inside a tube, such as fluid flow applications,10 few studies on CNT forests have been conducted on curved substrates.One of the concerns with growing CNT forests on non-planar substrates is that additional morphological defects will be induced because the order and alignment of the individual CNT within a forest ensemble influences the performance of the material on the macroscale. Microscale defects in CNT forests on flat substrates already affect their mechanical, electrical, and thermal properties.11 For example, when forests exhibit more waviness – also termed as a rippled or corrugated forest – on the microscale, the stiffness of the forest as a whole is reduced by as much as three orders of magnitude.12 This morphological defect may be a result of varying growth rates of adjacent CNT causing strain mismatch,13,14 mechanical coupling from van der Waals forces,11,15 compressive stress,16,17 or a combination of these.18,19 Understanding these defects and others leads to the understanding of forest growth and property changes.
A carbon-infiltrated carbon nanotube (CICNT) forest is a CNT forest that has been subsequently infiltrated with amorphous pyrolytic carbon.20 The structure maintains its shape and can still be rendered superhydrophobic like CNT forests with contact angles greater than 155°,21 but it is more durable as a cohesive material because CNTs cannot be brushed off the substrate. Under bending loads, CICNT have shown a strength of 102 MPa and a modulus of elasticity of 4.1 GPa in the direction perpendicular to the forest (i.e., pulling the nanotubes away from each other), and in the direction parallel to the nanotube axes, the achievable strength was 903 MPa with a modulus of elasticity of 11 GPa.20
Because CNT, and subsequently CICNT, forests grow perpendicular to their substrate, a forest inside a tube or on any concave substrate experiences circumferential compression, while a forest on a rod or other convex substrate experiences circumferential tension. As these stresses increase, the forest will eventually deform and exhibit defects. Defects from circumferential tension were seen on 3 mm diameter rods of a CICNT forest as cracks parallel to the rod axis at the top of CICNT forests were observed and systematically studied.22 For a forest height of roughly 150 μm, the length a forest section could be without cracking was 414 μm on average. This was attributed to the van der Waals forces between the individual nanotubes and the increasing circumferential stress as they grow on a convex curvature.
Neither CNT nor CICNT forest defects caused by concave substrate curvature have been systematically studied. This is likely because most studies of CNT forests on concave substrates are comprised of relatively short CNT forest heights (<16 μm) with relatively large curvatures (>11 mm ID).4,23–25 One exception is a study of CNT forests coated directly onto stainless steel tubing with an inner diameter of 1.27 mm and a CNT forest height ranging from 4 to 60 μm showed a relatively high surface roughness.10 A cross-sectional view of this forest showed non-uniformity of CNT height, but this and other micro-scale morphological defects have not been systematically studied. Although virtually all the results from the present work are likely to be equally applicable to both CNT and CICNT forests, we have only directly characterized CICNT, since our primary interest is in medical device applications of CICNT. Thus, the objective of this research was to characterize and evaluate the defects caused by the geometric limitations of coating CICNT on highly curved concave substrates.
Experimental
Design of experiments overview
Different combinations of radius of curvature and CNT height were tested in a 4 by 2 block design of experiments with a sample size of 6, or 48 samples in total. Four substrate sizes with radii of curvature ranging from 0.5 mm to 2 mm (i.e., 1 mm ID to 4 mm ID) in 0.5 mm increments were used. These roughly correspond to the internal diameters of gauge 17, 12, 9, and 7 needles and are also relevant to blood vessel sizes relevant to cardiovascular applications for CICNT materials. CNT height was controlled by the amount of time in the growth phase of the fabrication process.20,26 The growth times in this study were 1 minute and 10 minutes, which corresponded to heights of 63 ± 14 μm and 389 ± 61 μm, respectively. The length of the substrate and CICNT infiltration time were held constant.Sample fabrication
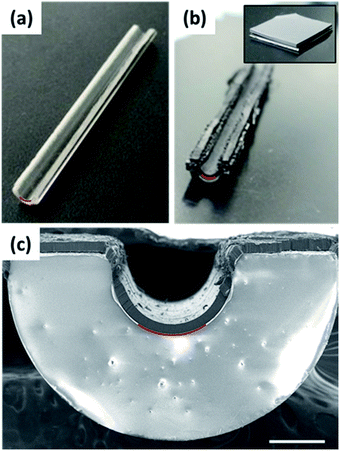
CICNT in quartz tubes were manufactured using a process that has been reported previously for flat, silicon substrates.27,28 The tubes were cut roughly 2 inches long and then in half lengthwise (Fig. 2a) to expose the inside curvature to thin film deposition processes. This included a layer of Al2O3 as the diffusion barrier (30–40 nm thick, applied through electron beam evaporation) followed by a layer of Fe as the CNT catalyst (4 nm thick, applied through thermal evaporation). These evaporation processes produce an even coating on flat substrates, but there are shielding effects that the concave substrates would be subject to. This caused the film thicknesses on the sides, or “walls”, of the concave substrates to differ from the calibrated measurements. Because of this, only the bottom 45–60° (red lines in Fig. 2) of the substrate was studied.The fabrication process for CICNT growth and pyrolytic carbon infiltration is outlined in the time–temperature plot in Fig. 1. In a 1 inch CVD tube furnace, the gas flow rates were as follows: hydrogen (H2) at 235.5 sccm, ethylene (C2H4) at 249.3 sccm, and argon (Ar) at 220.6 sccm. The growth was performed at 750 °C for either 1 or 10 minutes, which correspond to the labels “short” and “tall”, respectively. The infiltration was performed at 900 °C for 16 minutes. The process for achieving “tall” growths was also used to coat CICNT on flat substrates with the purpose of comparing the CICNT density differences on the top surfaces of flat and concave substrates.
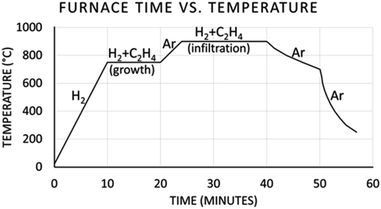 | ||
| Fig. 1 Time–temperature plot of the CNT growth and carbon infiltration process in a 1 inch CVD tube furnace. | ||
SEM image analysis
The samples were scored and snapped to examine the cross-sections of the CICNT forests under SEM (Fig. 2c). This view of the forests showed the nanotube alignment. Images at various magnifications ranging from 80× to 25![[thin space (1/6-em)]](https://www.rsc.org/images/entities/char_2009.gif) 000× were used to identify and quantify any forest irregularities above the bottom central 45–60° (red lines in Fig. 2) as discussed previously. These irregularities included any morphology that was not aligned and orderly even if the morphology is also seen on flat substrates. Because forest alignment affects the material properties of CNT forests,12 the irregularities were considered defects, and they were characterized and quantified for statistical analysis.
000× were used to identify and quantify any forest irregularities above the bottom central 45–60° (red lines in Fig. 2) as discussed previously. These irregularities included any morphology that was not aligned and orderly even if the morphology is also seen on flat substrates. Because forest alignment affects the material properties of CNT forests,12 the irregularities were considered defects, and they were characterized and quantified for statistical analysis.
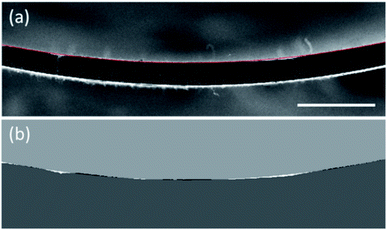
Surface roughness of the CICNT coating was calculated from SEM images using MATLAB image processing (Fig. 3). An ideal surface would perfectly match the curvature of the underlying quartz tube, however localized non-uniformity in CNT growth rates produces a surface roughness that greatly exceeds that of the underlying quartz substrate. This surface roughness was obtained by comparing the deviation of the “actual” CICNT surface from an idealized quadratic curve fit of the top edge (“ideal”). The subtraction of the “actual” and “ideal” images shows where they do not overlap (the black and white areas in Fig. 3b), so these areas were divided by the length of the ideal curve to obtain a roughness value in units of μm. In order to better fit the circular curvature with a quadratic function, the roughness for the left and right halves of each image was calculated separately then averaged. Statistical significance was calculated by one-way ANOVA.
CICNT density calculation
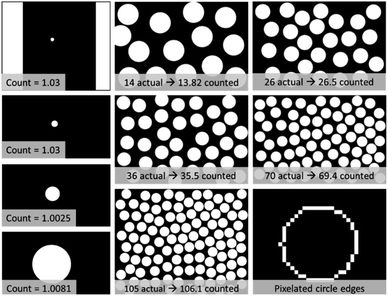
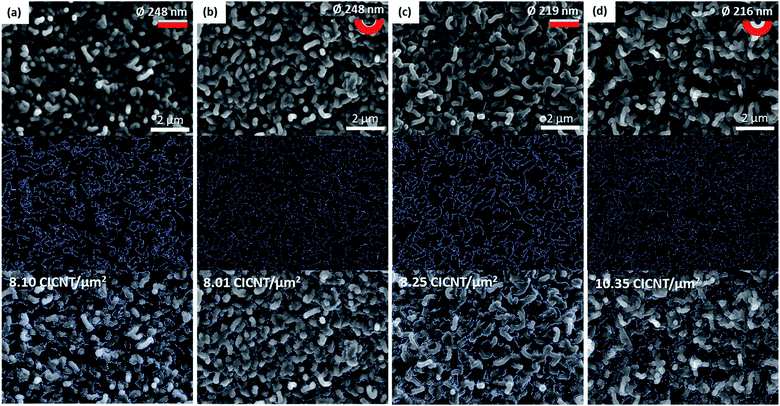
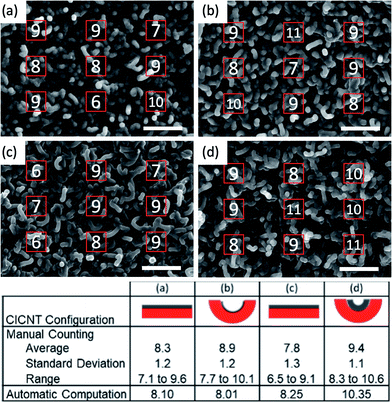
Because the surface of a CICNT-coated device interacts with the environment, top-view SEM images of flat and concave substrates were analyzed for variation in CICNT density. Determining CICNT density is challenging due to the textural features of the CICNTs, thus a novel, automatic CICNT counting algorithm was developed based on image processing and geometric feature identification. Using this counting algorithm, the area density of CICNT (CICNT/μm2) on both flat and concave substrates was calculated by dividing the number of CICNT in an image by the image area. The algorithm approximated the tops of CICNT as circles, so its counts were verified by counting the circles in several images with a known quantity of circles (Fig. 4) as well as manually counting CICNT in several locations on four different images (Fig. 9). The locations were set as a grid of 9 squares with a 1 μm2 area. The number of CICNT in each square was counted, and then the average, standard deviation, and range were computed to ensure the automatic computation results were within an acceptable range.The first step in the algorithm was to find the circumference of the circles or CICNT by using a Canny edge-detection algorithm in MATLAB (approxcanny). This generated a black image with white pixels for the circle or CICNT edges. The circle verification is in Fig. 4. Following the edge detection, the number of circles or CICNT in each image was calculated. The total circumference of all circles or CICNT in the image was first found by summing all the pixels that represent the edges in each image. The total circumference was then divided by 2.8 (modified pi) and the average circle or CICNT diameter in pixels to get the number of circles or CICNT in the image. Pi – the ratio of circumference to diameter – is slightly reduced because the pixelated circles do not capture the full circumference of a circle (Fig. 4).29 When this algorithm was tested on images with a known number of circles, there was a 1.3% error on average.
The CICNT density measured from top-view SEM images depends on the infiltration of that forest, so comparable images must have comparable CICNT diameters. Because of this, only four images were analyzed: two flat substrates, a concave substrate with a short CICNT forest, and a concave substrate with a tall CICNT forest (Fig. 8).
Results
Roughness
Roughness values (μm) were calculated and plotted in Fig. 5. The radius of curvature did not significantly affect the roughness, but the CICNT height did. Tall CICNT showed significantly more roughness than short CICNT (p < 0.05). On average, the tall CICNT samples were over 3 times rougher than the short CICNT samples.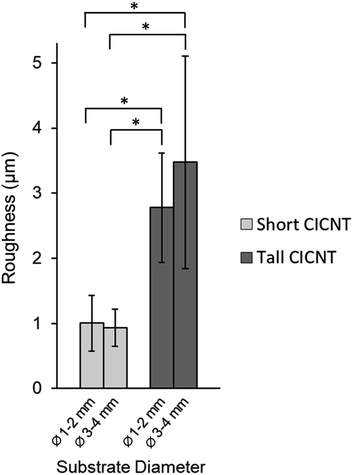 | ||
| Fig. 5 Average roughness values (μm) for each variable combination. Error bars represent standard deviation and * indicates p < 0.05. | ||
Microscale defects
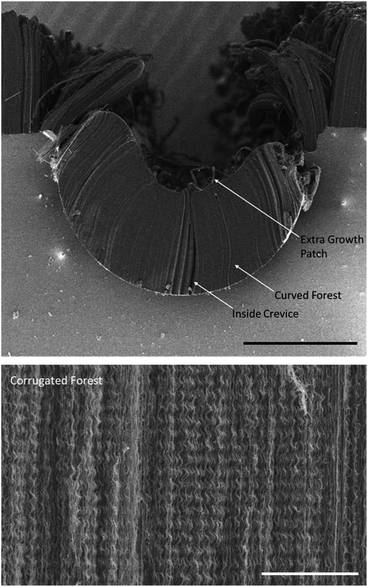
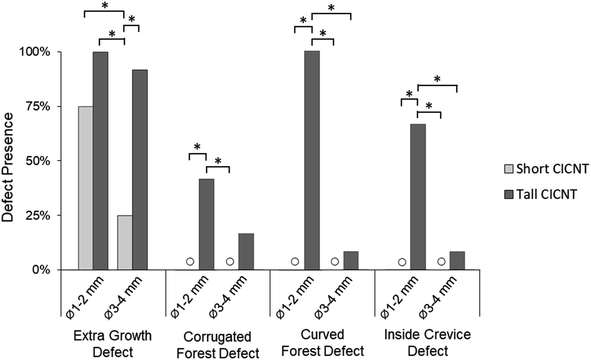
Four types of microscale defects were observed and recorded from the cross-section SEM images. These defects were designated as extra growth patches, corrugated forest, curved forest, and inside crevice. Examples of each defect are shown in Fig. 6. If a defect or multiple defects were observed in the cross-section SEM images within the bottom 45–60° zone, that sample was labeled with those defects. The defect presence was tallied and plotted with respect to the forest height and substrate curvature (Fig. 7).Extra growth patches were identified by several bundles of CICNTs growing taller than the rest of the forest. These can also be described as outgrowths of CICNT extending beyond the forest height. They were present in all CICNT height and curvature combinations, but they were seen in significantly lower quantities on the combination of wider curvature (3–4 mm ID) and shorter CICNT height. Specifically, short forests on 3–4 mm ID curvature had fewer samples with extra growth patches than tall forests on 1–2 mm ID curvature (p < 0.0001), tall forests on 3–4 mm ID curvature (p = 0.0002), and short forests on 1–2 mm ID curvature (p = 0.006).
A corrugated forest defect was identified by microscale waves of CICNT with a wavelength of roughly 1–2 μm. These corrugations – or ripples – are akin to a high-order column buckling failure. The defect has also been seen with CNT forests on flat substrates under conditions where adjacent CNTs have different growth rates.13 This defect was not present on any sample with short CICNT, and it was observed in significantly higher quantities on the samples with smaller curvature substrates (1–2 mm ID) and tall CICNT (roughly 400 μm). Specifically, tall forests on 1–2 mm ID curvature had more samples with a corrugated forest than short forests on 1–2 mm ID curvature (p = 0.01) and short forests on 3–4 mm ID (p = 0.01).
The curved forest defect was identified by CICNT that collectively arc away from the center of the forest. As the forest grew perpendicular to the substrate, the curvature caused the tips of the CICNT to push against each other as the available space decreased due to decreasing circumference. Rather than remain straight and perpendicular to the substrate, these forests bowed out and curved away from the center of the forest Fig. 6. This defect was not present on any sample with short CICNT, and it was significantly more present on samples with smaller diameter substrates combined with a tall CICNT forest than on any other combination. Specifically, tall forests on 1–2 mm ID curvature had more samples with curved forests than short forests on 1–2 mm ID curvature (p < 0.0001), tall forests on 3–4 mm ID curvature (p < 0.0001), and short forests on 3–4 mm ID curvature (p < 0.0001).
The inside crevice defect is closely related to the curved forest defect, and in some ways, it is a more extreme version of the curved forest defect. An inside crevice was identified by a small gap or opening in the middle of the CICNT forest as if the tops of the forest were pushed together but the forest continued growing from the bottom causing the forest to bow and then separate under the pressure. Because these defects are found internal to the CICNT forest, they cannot be directly observed from a top-down view, and since they likely vary throughout the length of a CICNT sample, an absolute number of them cannot be directly measured using SEM. However, we have characterized the relative incidence rate using a cross-sectional view (Fig. 6). The inside crevice had the same trends as the curved forest: no presence on any short CICNT samples and present significantly more on samples with smaller diameter substrates combined with tall CICNT than on any other combination. Specifically, tall forests on 1–2 mm ID curvature had more samples with curved forests than short forests on 1–2 mm ID curvature (p < 0.0001), tall forests on 3–4 mm ID curvature (p < 0.0001), and short forests on 3–4 mm ID curvature (p < 0.0001).
Top surface
The top surfaces of the concave substrates were compared with flat substrates of the same CICNT diameter. The surface morphology is essentially the same (Fig. 8), but the CICNT density of the tall CICNT on a small concave substrate (10.35 CICNT per μm2) was higher than that on both the flat substrates (8.10 and 8.25 CICNT per μm2) and the short CICNT on a small concave substrate (8.01 CICNT per μm2).These values computed by the CICNT density algorithm were validated by comparison with manual counting (Fig. 9). The CICNTs within one square micron regions at nine equally-spaced locations in each image were manually counted, and the average, standard deviation, and range for each image was computed. All algorithm calculations fell within the range of the average ± standard deviation of each image, indicating consistency of the automatic calculation algorithm.
Discussion
As the CNT forests grew, the circumferential compression increased, and when geometric limitations of curvature and forest height were reached, certain types of defects occurred. These defects were characterized and quantified from SEM images of the top and cross-sectional views. The types of defects seen were increased roughness, extra growth patches, corrugated forest, curved forest, inside crevice, and increased CICNT density on the top surface. Naturally, these were seen significantly more on the combination of tall CICNT height (average roughly 400 μm) and small radii of curvature (1–2 mm ID).Roughness was directly related to CICNT height; however, the variation observed in the present work may not impact future applications. Taller CICNTs displayed a significantly rougher surface than the shorter CICNTs. This may occur because all the CNTs in the forest normally grow at the same rate, but the longer they grow, the more variability can be introduced. There may be concern that the increased roughness on taller forests would impact potential applications, but the roughness averages varying between 1 μm and 3.5 μm in this study are relatively small and may not impact the desired outcomes. Certainly, this impact depends on the application. For a blood flow application, such as mechanical heart valves or coronary stents, roughness can be directly correlated with thrombus formation;30 however, despite roughness changes between Ra = 1.8 μm and 19.5 μm showing an effect on blood flow,31 surface roughness changes in this range have shown no effect on thrombosis.32 This may also be the case for other flow applications.
Extra growth patches were seen significantly less on short CICNT with large curvature (3 and 4 mm ID) than any other combination, but this effect may not be an inherent feature of CICNT on concave substrates. These extra-growth patches may come from CNT growing on unstable corners and edges of the substrate and falling to the bottom of the tube. CNT are heavier when they are taller, so these would be more likely to fall. Additionally, because the 1 and 2 mm ID tubes were smaller and more difficult to cut down the center, their top surfaces were rougher and more imperfect. This could cause more unstable CNT to fall even for short growth heights.
The corrugated forest defect, also called rippled morphologies or vertical corrugations,13 occurred significantly more for long growth heights on the small IDs, but this defect is not unique to curved substrates. It has also been seen on flat substrates.13 One possible explanation is that the CNTs buckled because of the extremely high aspect ratios of the CNTs (e.g., 2 nm diameter and 400 μm tall). However, compression tests done on other CNT forests show a different morphology than these,33–36 so this is not a likely cause. A more likely explanation is that if the corrugated forest area grew faster than its adjacent CNTs due to dispersity of CNT diameter, then the mismatch between the growth rates in that area and the entire forest will cause increased tortuosity due to mechanical coupling.11,13,37 Simulations have shown that an increased tortuosity or waviness in a CNT forest reduces the effective modulus of elasticity (E) by up to three orders of magnitude,12 and this is also illustrated in eqn (1). Additionally, the top surfaces of the CICNT structure are observed to have a distinct morphology from the interior. The top surface is more variable and the CICNTs may intertwine, as opposed to the interior which is largely homogeneous. It is likely that the tortuosity at the top surface as the forest grows introduces lateral forces that may be the mechanical cause of the increased incidence of defects within the taller forests. In regard to potential coating applications, this defect may affect the strength under compression, but it should not interfere with the functionality because the function comes from the top surface structure.
| E = (ρN × L × τ) × K | (1) |
The curved forest defect is a good indication that the CNT forest is too long for the radius of curvature. A possible explanation for this is that the CNTs cannot grow perpendicular to the substrate if other CNTs are blocking them. This may cause some CNTs to get smothered and stop growing as if they have had their iron capped,38 or they can expand outward creating a curve in the forest. The CNTs tend to grow parallel to each other because of van der Waals forces,39 but this is not always possible when the substrate is concave.
The results for the inside crevice defect correlated with those for the curved forest defect. From an etiology perspective, both defects may occur because as the tips of the forests run into each other, the middles are pushed out towards the sides as the CNTs continues to grow. Another explanation for this is that the inside crevice defect can also be present if there was a defect in the iron layer, such as a scratch or dust particle, that caused CNT not to grow there. This may have been the case for some of the samples in the present work, but post-hoc identification of such defects was not possible due to the fact that they are obscured by the surrounding CICNT. Future work can include an inspection step prior to CNT growth and infiltration to identify defects in the iron catalyst layer via SEM or atomic force microscopy (AFM) imaging. It is also possible that an electrical resistance measurement technique could be used to identify iron layer defects prior to growth. However, to date, we have not investigated the utility of either of these techniques.
Each of the defects described in the present work were more prevalent on tall CICNT forests with small substrate curvatures, so coating height, as a design factor for highly curved surfaces, is recommended to be as short as possible. Not only do shorter forest heights induce less defects, but they also reduce the interface stress between the CICNT material and the underlying substrate during use.
Many of the proposed applications of CICNT involve interaction with fluids, thus the top surface nanostructure is of special interest. Calculations of CICNT density have previously been quite challenging, thus in the present work we introduced a novel, image-analysis based methodology that is broadly applicable and quick to implement. Although this methodology is new and still requires additional validation to know the absolute density for CICNT, it allows a clear comparison of relative CICNT densities across samples.
There are several limitations of this work. First, CICNT were not coated inside a full tube, so only the bottom 45–60° of curvature was evaluated. Although there are some fundamental equations that may predict the deposition layer thickness as a function of distance from the emitter based on surface curvature, we did not specifically measure those values. The vapor deposition processes used to apply the CNT catalyst materials are unidirectional, which work well for planar substrates. The modifications required to use these processes for concave substrates are still under development and currently do not yield fully uniform catalyst material thicknesses. Future work may include improved processes for growing CICNT on the inside of full tubing. Thus, in the present work, we were constrained to analyze only a small fraction of the circumference. Nonetheless, the defects observed in this study are consistent with what may be induced by circumferential compression on a CNT forest. Another limitation is that the scope of this work was constrained to evaluation of the microscale defects found in CNT forests. More qualitative and quantitative work can be done to assess defects on the atomic and nanoscale.13 Also, as is typical for CNT and CICNT-related work, growth heights in this study were indirectly controlled by holding CNT growth time constant, so there was variation in the final forest height. For vertically aligned CICNT grown on a curved surface, this variation is somewhat amplified, potentially due to gravity effects which may “pull” the tips of longer CICNTs downward.40 Additionally, “waviness” in the CICNT height across the top surface may be observed. Both of these factors could affect the accuracy of determining the CICNT “tip” density calculations based on top-down SEM image analysis due to variations in focal length. However, in the present work, we report overall CICNT density (total number of CICNT per area of interest), which is less sensitive to these factors – and which we found to match well with our manual CICNT density counts. Furthermore, we are most interested in relative density calculations, as opposed to absolute numbers, and the method seems robust for making that comparison. Despite these limitations, this study found significant differences between the number of defects in the groups of CNT height and substrate curvatures, and this data can be used to understand the microscale defects caused by substrate curvature.
Conclusions
Because growing a CNT forest on a concave substrate causes circumferential compression on the forest, the micro-scale morphological response to this stress was studied. CICNT forests were grown at different forest heights and substrate curvatures, and SEM images of the top and cross-sections were used to discover the geometric limitations. In general, the combination of a tall CICNT height (roughly 400 μm) with a small substrate curvature (1–2 mm ID) exhibited certain types of micro-scale defects: increased roughness, extra growths, corrugated forest, curved forest, and inside crevices. This combination was also associated with an increased CICNT density on the top surface. Because CICNT is a CNT forest infiltrated with pyrolytic carbon, this work likely applies to all CNT forests on concave substrates within these forest heights and substrate curvatures.Conflicts of interest
There are no conflicts to declare.References
- A. Venkataraman, E. V. Amadi, Y. Chen and C. Papadopoulos, Nanoscale Res. Lett., 2019, 14, 220 CrossRef PubMed.
- P. Tripathi, A. Bhatnagar, A. Ramesh, A. K. Vishwakarma, S. Singh, D. B. Bailmare, A. D. Deshmukh, B. K. Gupta and O. N. Srivastava, Electrochim. Acta, 2020, 354, 136650 CrossRef CAS.
- W. Shi and D. L. Plata, Green Chem., 2018, 20, 5245–5260 RSC.
- C. Saridara and S. Mitra, Anal. Chem., 2005, 77, 7094–7097 CrossRef CAS PubMed.
- M. Karwa, Z. Iqbal and S. Mitra, J. Mater. Chem., 2006, 16, 2890–2895 RSC.
- S. Park, M. Vosguerichian and Z. Bao, Nanoscale, 2013, 5, 1727–1752 RSC.
- S. Azimi, A. Farahani and H. Sereshti, Electroanalysis, 2020, 32, 394–403 CrossRef CAS.
- A. Al-Jumaili, S. Alancherry, K. Bazaka and M. V. Jacob, Materials, 2017, 10(9), 1066 CrossRef PubMed.
- G. Chen, B. Dodson, F. Johnson, I. Hancu, E. Fiveland, W. Zhang, C. Galligan, C. Puleo, R. C. Davis, J. Ashe and R. R. Vanfleet, J. Magn. Reson., 2018, 295, 72–79 CrossRef CAS PubMed.
- M. Karwa, Z. Iqbal and S. Mitra, Carbon, 2006, 44, 1235–1242 CrossRef CAS.
- M. Bedewy and A. J. Hart, Nanoscale, 2013, 5, 2928–2937 RSC.
- I. Y. Stein, D. J. Lewis and B. L. Wardle, Nanoscale, 2015, 7, 19426–19431 RSC.
- E. R. Meshot, D. W. Zwissler, N. Bui, T. R. Kuykendall, C. Wang, A. Hexemer, K. J. J. Wu and F. Fornasiero, ACS Nano, 2017, 11, 5405–5416 CrossRef CAS PubMed.
- M. De Volder, S. Park, S. Tawfick and A. J. Hart, Nat. Commun., 2014, 5, 4512 CrossRef CAS PubMed.
- M. R. Maschmann, Carbon, 2015, 86, 26–37 CrossRef CAS.
- A. J. Hart and A. H. Slocum, Nano Lett., 2006, 6, 1254–1260 CrossRef CAS PubMed.
- J. Choi, S. Pyo, D.-H. Baek, J.-I. Lee and J. Kim, Carbon, 2014, 66, 126–133 CrossRef CAS.
- P. Vinten, J. Bond, P. Marshall, J. Lefebvre and P. Finnie, Carbon, 2011, 49, 4972–4981 CrossRef CAS.
- Y. Zhang, G. Zou, S. K. Doorn, H. Htoon, L. Stan, M. E. Hawley, C. J. Sheehan, Y. Zhu and Q. Jia, ACS Nano, 2009, 3, 2157–2162 CrossRef CAS PubMed.
- B. H. Hanna, W. C. Fazio, J. D. Tanner, J. M. Lund, T. S. Wood, R. C. Davis, R. R. Vanfleet and B. D. Jensen, J. Microelectromech. Syst., 2014, 23, 1330–1339 CAS.
- K. A. Stevens, C. D. Esplin, T. M. Davis, D. J. Butterfield, P. S. Ng, A. E. Bowden, B. D. Jensen and B. D. Iverson, Appl. Phys. Lett., 2018, 112, 211602 CrossRef.
- W. Robison, B. Jensen and A. Bowden, “Patterned Carbon Nanotube Growth on Convex Cylindrical Stainless Steel Substrates for the Production of Coronary Stents.” Proceedings of the ASME 2016 International Design Engineering Technical Conferences and Computers and Information in Engineering Conference. Volume 4: 21st Design for Manufacturing and the Life Cycle Conference, 10th International Conference on Micro- and Nanosystems, ASME, Charlotte, North Carolina, USA. August 21–24, 2016. V004T08A021. DOI: DOI:10.1115/DETC2016-60243.
- H. W. Baac, T. Lee and L. J. Guo, Biomed. Opt. Express, 2013, 4, 1442–1450 CrossRef PubMed.
- H. W. Baac, J. G. Ok, A. Maxwell, K. T. Lee, Y. C. Chen, A. J. Hart, Z. Xu, E. Yoon and L. J. Guo, Sci. Rep., 2012, 2, 989 CrossRef PubMed.
- J. Z. Xu, P. Xu, P. S. Guo, W. Ou-Yang, Y. W. Chen, T. Feng, X. Q. Piao, M. Wang and Z. Sun, RSC Adv., 2015, 5, 21755–21761 RSC.
- K. Moulton, N. B. Morrill, A. M. Konneker, B. D. Jensen, R. R. Vanfleet, D. D. Allred and R. C. Davis, J. Micromech. Microeng., 2012, 22(5), 055004 CrossRef.
- J. D. Tanner, C. Grames, B. D. Jensen, S. P. Magleby and L. L. Howell, J. Mech. Robot., 2015, 7(2), 021001 CrossRef.
- K. Jones, B. D. Jensen and A. Bowden, J. Nanotechnol. Eng. Med., 2013, 4(2), 020903 CrossRef.
- M. S. Gharajeh, International Journal of Research Studies in Computer Science and Engineering, 2017, 4, 15–21 CrossRef.
- L. Brancato, D. Decrop, J. Lammertyn and R. Puers, Materials, 2018, 11(7), 1109 CrossRef PubMed.
- V. Carvalho, N. Rodrigues, R. Ribeiro, P. F. Costa, R. A. Lima and S. F. C. F. Teixeira, Micromachines, 2020, 11(6), 549 CrossRef PubMed.
- S. Segan, M. Jakobi, P. Khokhani, S. Klimosch, F. Billing, M. Schneider, D. Martin, U. Metzger, A. Biesemeier, X. Xiong, A. Mukherjee, H. Steuer, B. M. Keller, T. Joos, M. Schmolz, U. Rothbauer, H. Hartmann, C. Burkhardt, G. Lorenz, N. Schneiderhan-Marra and C. Shipp, BioMed Res. Int., 2020, 2020, 3481549 Search PubMed.
- T. Tong, Y. Zhao, L. Delzeit, A. Kashani, M. Meyyappan and A. Majumdar, Nano Lett., 2008, 8, 511–515 CrossRef CAS PubMed.
- C. H. Cao, A. Reiner, C. H. Chung, S. H. Chang, I. Kao, R. V. Kukta and C. S. Korach, Carbon, 2011, 49, 3190–3199 CrossRef CAS.
- M. Fujino, H. Terasaka, T. Suga, I. Soga, D. Kondo, Y. Ishizuki and T. Iwai, IEEE-NANO, 2012, p. 2410 Search PubMed.
- P. Pour Shahid Saeed Abadi, S. B. Hutchens, J. R. Greer, B. A. Cola and S. Graham, Nanoscale, 2012, 4, 3373–3380 RSC.
- V. Balakrishnan, M. Bedewy, E. R. Meshot, S. W. Pattinson, E. S. Polsen, F. Laye, D. N. Zakharov, E. A. Stach and A. J. Hart, ACS Nano, 2016, 10, 11496–11504 CrossRef CAS PubMed.
- J. F. AuBuchon, L. H. Chen and S. H. Jin, J. Phys. Chem. B, 2005, 109, 6044–6048 CrossRef CAS PubMed.
- M. F. L. De Volder, D. O. Vidaud, E. R. Meshot, S. Tawfick and A. J. Hart, Microelectron. Eng., 2010, 87, 1233–1238 CrossRef CAS.
- S. Zhu, C.-H. Su, J. Cochrane, S. Lehoczky, Y. Cui and A. Burger, J. Cryst. Growth, 2002, 234, 584–588 CrossRef CAS.
| This journal is © The Royal Society of Chemistry 2022 |

