
 Open Access Article
 This Open Access Article is licensed under a Creative Commons Attribution-Non Commercial 3.0 Unported Licence
Electrochemical sensor based on screen printed carbon electrode–zinc oxide nano particles/molecularly imprinted-polymer (SPCE–ZnONPs/MIP) for detection of sodium dodecyl sulfate (SDS)
Putri Faradillaa,
Henry Setiyanto*ab,
Robeth Viktoria Manurung *c and
Vienna Saraswatyd
*c and
Vienna Saraswatyd
aAnalytical Chemistry Research Group, Institut Teknologi Bandung, Bandung, Indonesia. E-mail: henry@chem.itb.ac.id
bCenter for Defence and Security Research, Institut Teknologi Bandung, Bandung, Indonesia
cResearch Centre for Electronics and Telecommunication, National Research and Innovation Agency Republic of Indonesia, Bandung, Indonesia. E-mail: robeth.viktoria.manurung@lipi.go.id
dResearch Unit for Clean Technology, National Research and Innovation Agency Republic of Indonesia, Bandung, Indonesia
First published on 24th December 2021
Abstract
The foremost objective of this work is to prepare a novel electrochemical sensor-based screen-printed carbon electrode made of zinc oxide nanoparticles/molecularly imprinted polymer (SPCE–ZnONPs/MIP) and investigate its characteristics to detect sodium dodecyl sulfate (SDS). The MIP that is polyglutamic acid (PGA) film was synthesized via in situ electro-polymerization. The SDS's recognition site was left on the surface of the PGA film after extraction using the cyclic voltammetry (CV) technique, facilitating the specific detection of SDS. Moreover, the ZnONPs (∼71 nm, polydispersity index of 0.138) were synthesized and effectively combined with the MIP by a drop-casting method, enhancing the current response. The surface of the prepared SPCE–ZnONPs/MIP was characterized by scanning electron microscopy and energy dispersive X-ray. Besides, the electrochemical performance of the SPCE–ZnONPs/MIP was also studied through CV and differential pulse voltammetry (DPV) techniques. As an outstanding result, it is observed that the current response of SPCE–ZnONPs/MIP for detection of SDS remarkably increased almost four times higher from 0.009 mA to 0.041 mA in comparison with bare SPCE. More importantly, the proposed SPCE–ZnONPs/MIP exhibited an excellent selectivity (in the presence of interfering molecules of Ca2+, Pb2+, as well as sodium dodecylbenzene sulfonate (SDBS)), sensitivity, reproducibility, and repeatability. Since the modified sensor offers portability, it is suitable for in situ environment and cosmetic monitoring.
1. Introduction
Sodium dodecyl sulfate (SDS), an anionic surfactant, also called sodium lauryl sulfate (SLS), is one of the most frequently used additives in household and personal care products (cosmetics).1 In the household industry, SDS is used as a softener and cleaning agent. Whereas in personal care products, SDS is used as a flocculating or a decolorizing agent. It is imperative to note that SDS concentrations in household products were found at 1–30% w/v. Whereas in several personal care products, SDS was detected at 0.01 to 50% w/v.2 According to Bondi et al. SDS at 0.5–10% w/v causes skin and eye irritation.Additionally, applying SDS at a concentration higher than 10% w/v in personal care products resulted in dermatitis, including swelling, blistering, or redness.3 The environmental safety assessment of SDS has shown its toxic potential to the aquatic organisms, particularly on fish fertilization and on the kidney and spleen function. More importantly, SDS is also reported to result in cell damage, a decrease in cell proliferation, and hyperplasia.4 Additionally, the government Republic of Indonesia has released regulation no. 22/(2021), which mentioned that the allowed concentration of SDS in wastewater (refer to the detergent concentration) is below 0.2 mg L−1.5 Then, following the cosmetic ingredient review, SDS is potentially harmful. Thus, the preparation of SDS in cosmetics is limited to a maximum concentration of 1%.6 Therefore, it is essential to evaluate the presence of SDS both qualitative and quantitatively, either in wastewater or personal care products.
Several analytical methods have been used to evaluate SDS, including colorimetry,7 UV-vis spectrometry,8 gas chromatography-mass spectrometry,9 fluorescent,10 amperometry,11 potentiometric,12,13 and voltammetric.14,15 Those methods are capable of assessing SDS. However, they generate inconvenience, are time-consuming, expensive, and require complex preparation. Hence, it is urgent to develop an effective, rapid, and simple method for SDS determination. In addition, for environmental monitoring, a portable sensor is preferred.
An electrochemical-based sensor has attracted interest for being developed. An electrochemical-based sensor offers rapid measurement, simple preparation, cost-effectiveness, and portability—undoubtedly, it is very promising. However, a bare working electrode on an electrochemical-based sensor generally only consists of carbon, therefore, exhibits a poor electrochemical response. The performance of an electrochemical-based sensor can be enhanced via the electrode materials, for example, by preparing an electrical double-layer sensor, a pseudo sensor, or a hybrid sensor.16 In this work, we are interested in developing an electrical double layer sensor because it has a more sensitive interfacial property.
Polymers, metal oxide, and carbonaceous materials have been exploited to fabricate an electrical double layer sensor. However, the utilization of pure metal oxide suffers a low conductivity, chemical instability, and mechanical brittleness. Therefore, combining the metal oxide with a binder is better to provide an appropriate composite with a remarkably electrochemical response.16,17 Among various metal oxides, zinc oxide nanoparticles (ZnONPs) have received interest in electrochemical sensing development because their advantages include environmentally friendly, cheap, high surface area, highly stable material (both physical and chemical), biocompatible and non-toxic. More importantly, ZnONPs have high electrocatalytic activity, accelerating the process evaluation of various analytes.18–20 Although the ZnO particles have good stability, however, the utilization of ZnONPs is rarely used individually on a modified sensor because of instability issues such as aggregation during the preparation step.21 Here, several investigators have tried using ZnONPs in combination with other materials such as graphene oxide and multi-walled carbon nanotube, then enhancing the function of the sensors.20,22
A molecularly imprinted polymer (MIP) is a polymer containing a functional monomer and a molecule template. It also has reported improving electrochemical-based sensor performance.23,24 MIP can be easily synthesized either by bulk or in situ electro-polymerization.25 Preparation of MIP by bulk polymerization suffers difficulties in accessing molecules template and low homogeneity. Thus, it requires a more protracted process in removing the molecules template. In reverse, the in situ electro-polymerization provides an easier and faster approach to remove the molecule template and generates cavities in uniform shape and size.24,26–30
Among various polymers, glutamic acid (GA), a monomer, has been widely used as the functional monomer for MIP-based electrochemical sensing. The poly glutamic acid (PGA) polymer showed a satisfying response in detecting Cd and Pb ions,31 dopamine,32 and rhodamine.33 It seems that the γ-peptide and α-carboxyl groups of PGA play an essential role in selective binding with target analyte via electrostatic interaction and covalent bond.34,35
In this present work, we modify the SPCE with MIP (PGA) for more excellent selectivity and sensitivity in SDS detection because of its electroactive nature and possibly interacting with PGA via hydrogen bond.23 The MIP was prepared by in situ electro-polymerization to provide a facile preparation of the PGA and its molecule template. Later, to improve the electrochemical response and facilitate a better electron transfer, the prepared MIP was further combined with ZnONPs. A set of parameters including optimum conditions for evaluation and the analytical performance of ZnONPs/MIP modified SPCE towards SDS were investigated.
2. Experimental
2.1 Materials
Zn(CH3COOH)2·2H2O (99.5–101.0%), KOH (≥85%), L-glutamic acid (99.0–100.5%), sodium dodecyl sulfate (≥99%), sodium hydroxide, KCl (≥99.5%), sodium dodecylbenzene sulfonate, Pb(NO3)2, CaCO3, K3[Fe(CN)6], K4[Fe(CN)6], KH2PO4 (≥99.995%), and K2HPO4 (≥99.99%) are from Merck (Germany) with pro analytical grade. Ultrapure water was prepared by a Module E-pure D4642-33 instrument (Barnstead) with a resistivity ≥18 MΩ. Silver paste and insulator paste (polysiloxane, silicone thickened oil) were purchased from Shoei.2.2 Apparatus and electrochemical measurement
Particle size analysis was performed using a Zetasizer Nano Series, Malvern (UK). For absorbance measurement, an UV-visible spectrophotometer (Agilent Technologies-8453, Germany) was used. Scanning electron microscopy (SEM) (JEOL JSM IT300, Japan) was used to evaluate the surface morphology of the electrode. In comparison, an energy-dispersive X-ray diffractive (EDX) (Oxford X-Max 20, UK) evaluation was applied to identify the element present on the electrode surface. The electrochemical measurement was recorded using Autolab PGSTAT302N Metrohm. All measurements were performed at room temperature. The surface of SPCE was activated in 0.1 M NaOH using CV technique within the potential range between 0 to 1.2 V. CV characterization was performed with 0.01 M [Fe(CN)6]3−/4− in 0.1 M KCl over the potential range −0.3 to 0.6 V with a scan rate of 100 mV s−1. The current of SDS was measured using DPV at the potential ranging of −0.2 to 0.4 V, and 0.1 M PBS pH 7 was employed as a supporting electrolyte.2.3 Screen-printed carbon electrode fabrication
The schematic diagram for the fabrication of screen-printed carbon electrodes (SPCE) is illustrated in Fig. 1. As shown, the electrodes were deposited onto an alumina substrate surface (10 mm × 25 mm). The reference electrode was printed using silver paste (Fig. 2a) and dried in the oven. The substrate was then calcinated at 750 °C using a furnace. The working and counter electrodes were printed using carbon paste onto the substrate and dried in an oven at 110 °C (Fig. 2b).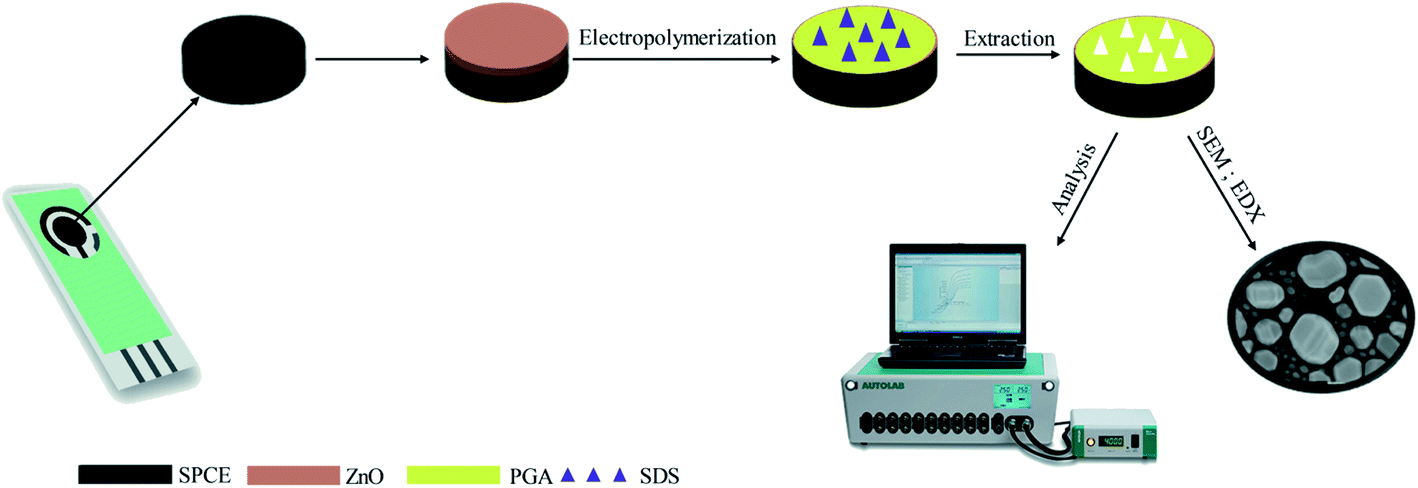 | ||
| Fig. 1 The schematic diagram of preparation SPCE–ZnONPs/MIP. | ||
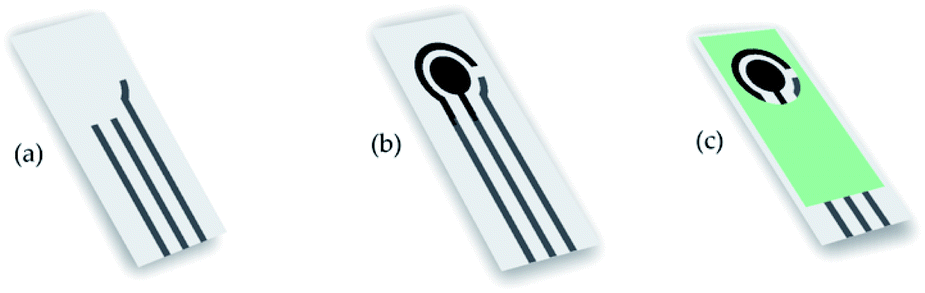 | ||
| Fig. 2 Step of SPCE fabrication of (a) reference electrode; (b) working, counter electrode; and (c) encapsulation. | ||
Further, an insulator paste was printed for the encapsulation layer (Fig. 2c). The silver electrode was modified using the electroplating technique in KCl 0.1 M with Pt wire to form a silver/silver chloride electrode. Finally, the surface of SPCE was activated using 50 μL of 0.1 M NaOH to remove the impurities during the fabrication process.
2.4 Preparation of ZnO nanoparticles (ZnONPs)
The ZnONPs were synthesized following the previous work.36 In separated flasks, about 200 mL of 0.1 M of Zn(CH3COOH)2·2H2O and 200 mL of 0.4 M KOH were dissolved in ethanol. Both solutions were heated at 60 °C with constant stirring until completely dissolved. Subsequently, KOH solution was dripped slowly into Zn(CH3COOH)2·2H2O solution and continuously stirred for 3 hours. The zinc oxide particles were obtained as a white precipitate. The ZnO particles were then collected by centrifugation at 4000 rpm. Subsequently, the ZnO particles were washed with acetone and ultrapure water to remove the impurities and heated at 600 °C to form ZnONPs (2.2 grams). For optimization, the concentration of ZnONPs suspensions were varied from 0.25 to 1.25 mg mL−1. The ZnONPs suspensions were prepared by dispersing the ZnONPs in ethanol and sonicated for 30 minutes. Later about 2.5 μL of ZnONPs suspension was drop cast onto the surface of the SPCE and was dried at 60 °C.2.5 Fabrication of SPCE–ZnONPs/MIP
The schematic diagram for the preparation of SPCE–ZnONPs/MIP is presented in Fig. 1. The MIP was prepared by in situ electro-polymerization using glutamic acid (GA) as the functional monomer. About 50 μL of the 1 mM GA and 1 mM SDS (1![[thin space (1/6-em)]](https://www.rsc.org/images/entities/char_2009.gif) :1) mixture in 0.1 M PBS (pH = 7) was dropped onto the SPCE surface for the electro-polymerization process. Subsequently, the in situ electro-polymerization of GA was performed using the CV technique at the potential ranging from −0.8 to 1.8 V. Then, the SDS was removed by extraction using ultrapure water, leaving a molecule template on the polymer matrix. For the repeatability measurement, an SPCE–ZnONPs/MIP was used for ten repetitive measurements. The SPCE–ZnONPs/MIP was washed by ultrapure water using the CV technique at the potential range from −0.8 to +1.8 V before repetitive measurement. A non-imprinted polymer (NIP) (SPCE–NIP) was also fabricated for comparing the performance with SPCE–ZnONPs/MIP. The SPCE–NIP was prepared with a similar procedure according to SPCE–MIP preparation without a molecule template.
:1) mixture in 0.1 M PBS (pH = 7) was dropped onto the SPCE surface for the electro-polymerization process. Subsequently, the in situ electro-polymerization of GA was performed using the CV technique at the potential ranging from −0.8 to 1.8 V. Then, the SDS was removed by extraction using ultrapure water, leaving a molecule template on the polymer matrix. For the repeatability measurement, an SPCE–ZnONPs/MIP was used for ten repetitive measurements. The SPCE–ZnONPs/MIP was washed by ultrapure water using the CV technique at the potential range from −0.8 to +1.8 V before repetitive measurement. A non-imprinted polymer (NIP) (SPCE–NIP) was also fabricated for comparing the performance with SPCE–ZnONPs/MIP. The SPCE–NIP was prepared with a similar procedure according to SPCE–MIP preparation without a molecule template.
2.6 Real sample analysis
The laundry wastewater and shampoo were used for the evaluation of SDS in the actual sample. The laundry wastewater (sample 1) was collected from a public place. The laundry wastewater was diluted 100 times using 0.1 M PBS (pH = 7) and directly analyzed using the DPV method. Shampoo (sample 2) was purchased from the supermarket. About 1.0 g of shampoo sample was dissolved in 10 mL of methanol and filtered. The filtrate of shampoo was diluted 100 times using 0.1 M PBS (pH = 7) and analyzed using DPV.3. Result and discussion
3.1 Synthesis of ZnONPs
The particle size analysis using a PSA showed that the particles of synthesized ZnO, which were synthesized by a wet chemical method, are in nano-size. As depicted in Fig. 3a, the particle size distribution of ZnONPs showed an average diameter size of ∼71 nm with a monodisperse system (polydispersity index (PI) = 0.168).37 The maximum absorption peak of ZnONPs was observed at λ = 377 nm (Fig. 3b), suggesting that the ZnONPs were in the form of hexagonal wurtzite. The SEM image emphasized the formation of nanoparticles of the synthesized ZnONPs (Fig. 3c). As depicted, the SEM image clearly shows that the synthesized ZnONPs are crystalline with a wurtzite structure with particles size below ∼100 nm. This is closely related to the results of particle size and maximum absorption peak evaluation.38–42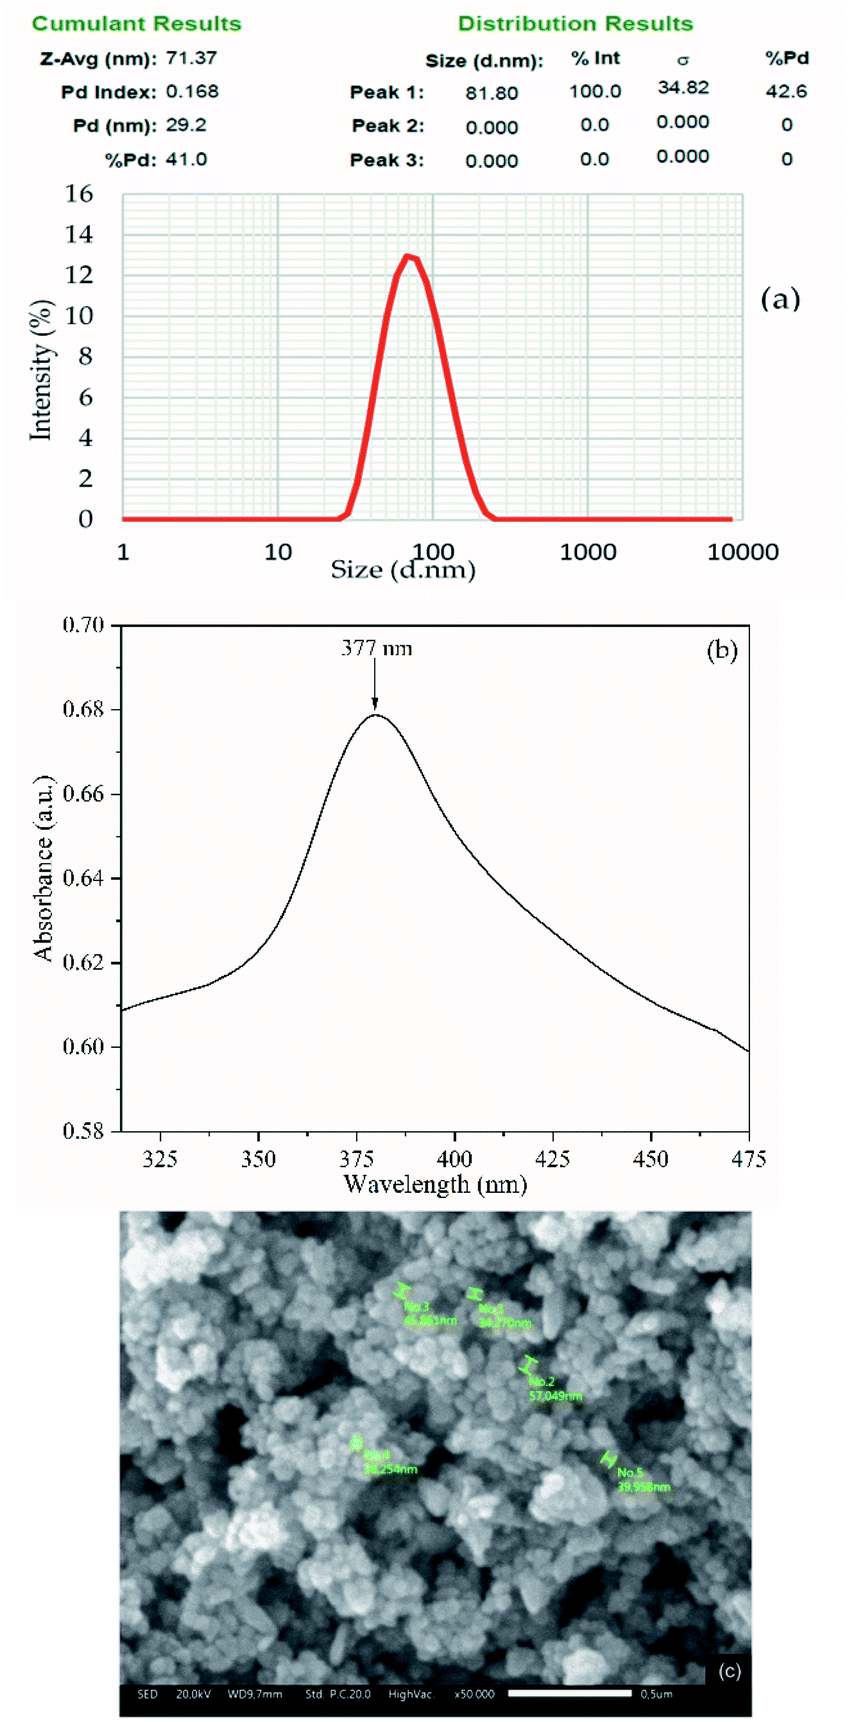 | ||
| Fig. 3 The (a) particle size distribution and (b) the UV-visible spectra. And (c) SEM image of ZnONPs at 50000× magnification. | ||
3.2 Cyclic voltammetry (CV) behavior of the fabricated SPCE
The fabricated SPCE should be activated before the characterization. The activation step aimed to remove impurities and enhance the electron transfer. In this work, the fabricated SPCE was activated with 50 μL of 0.1 M NaOH solution. As a comparison, a commercial SPCE was used to investigate the performance of the fabricated SPCE without activation. The CV behavior of commercial SPCE activated SPCE, and unactivated SPCE are shown in Fig. 4. As depicted, the activated SPCE showed a higher peak current (Ipa = 0.26 mA, Ipc = 0.23 mA, ΔE = 0.21 V) in comparison with unactivated SPCE (Ipa = 0.20 mA, Ipc = 0.12 mA, ΔE = 0.27 V) as well as commercial SPCE (Ipa = 0.22 mA, Ipc = 0.19 mA, ΔE = 0.22 V). This is probably due to the removal of covering organic binders on the surface of SPCE. Thus, the functionality and sensitivity of the surface of SPCE as a working electrode improved.43,44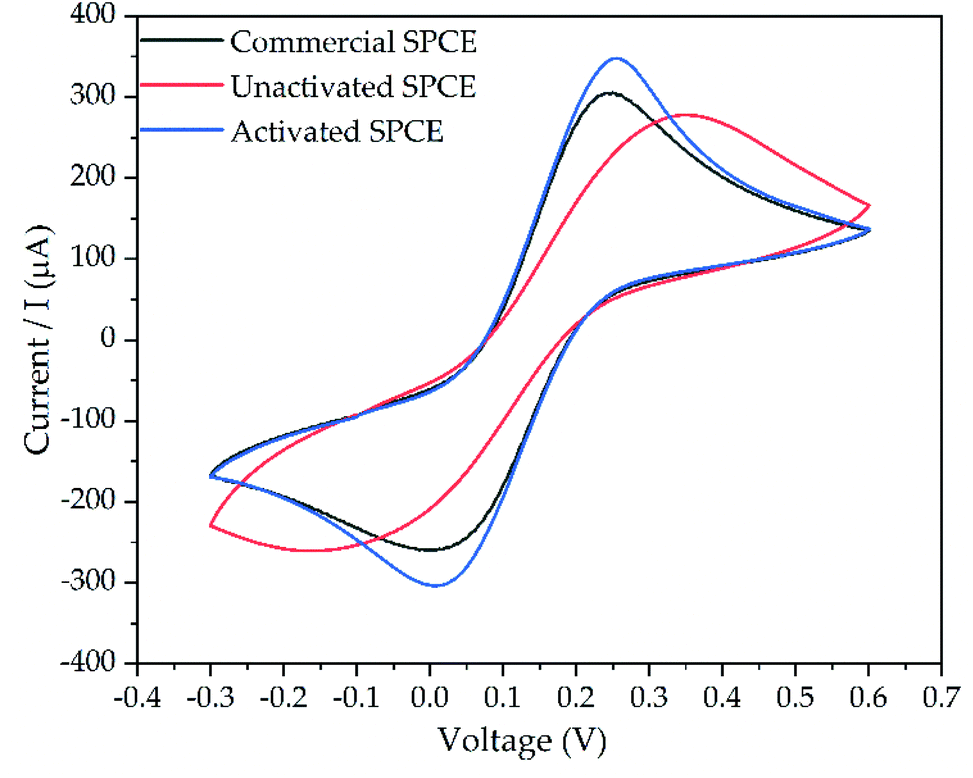 | ||
| Fig. 4 The CV voltammogram of unactivated SPCE (red line), activated SPCE (blue line), and commercial SPCE (black line). | ||
3.3 Electropolymerization of glutamic acid (GA) on SPCE–ZnONPs
The SPCE–ZnONPs were modified using GA by in situ electro-polymerization. The CV responses during in situ electro-polymerization of GA on the electrode surface can be seen in Fig. 5a. As depicted, the oxidation peak of SDS and GA present at working potential values of 0.18 and 1.2 V, respectively.45–47 We recorded a successful formation of PGA film by the presence of the oxidation peak at a potential working value of −0.8 to +1.8 V. The oxidation peak at 1.2 V indicated that the amino group from GA was oxidized to a radical cation. Therefore, the polymerization of GA occurred due to interaction between the radical cation with a deprotonated carboxyl group (–COOH–) from other GA molecules.48 Moreover, the amino group radical cations established carbon-nitrogen linkages on the electrode surface.47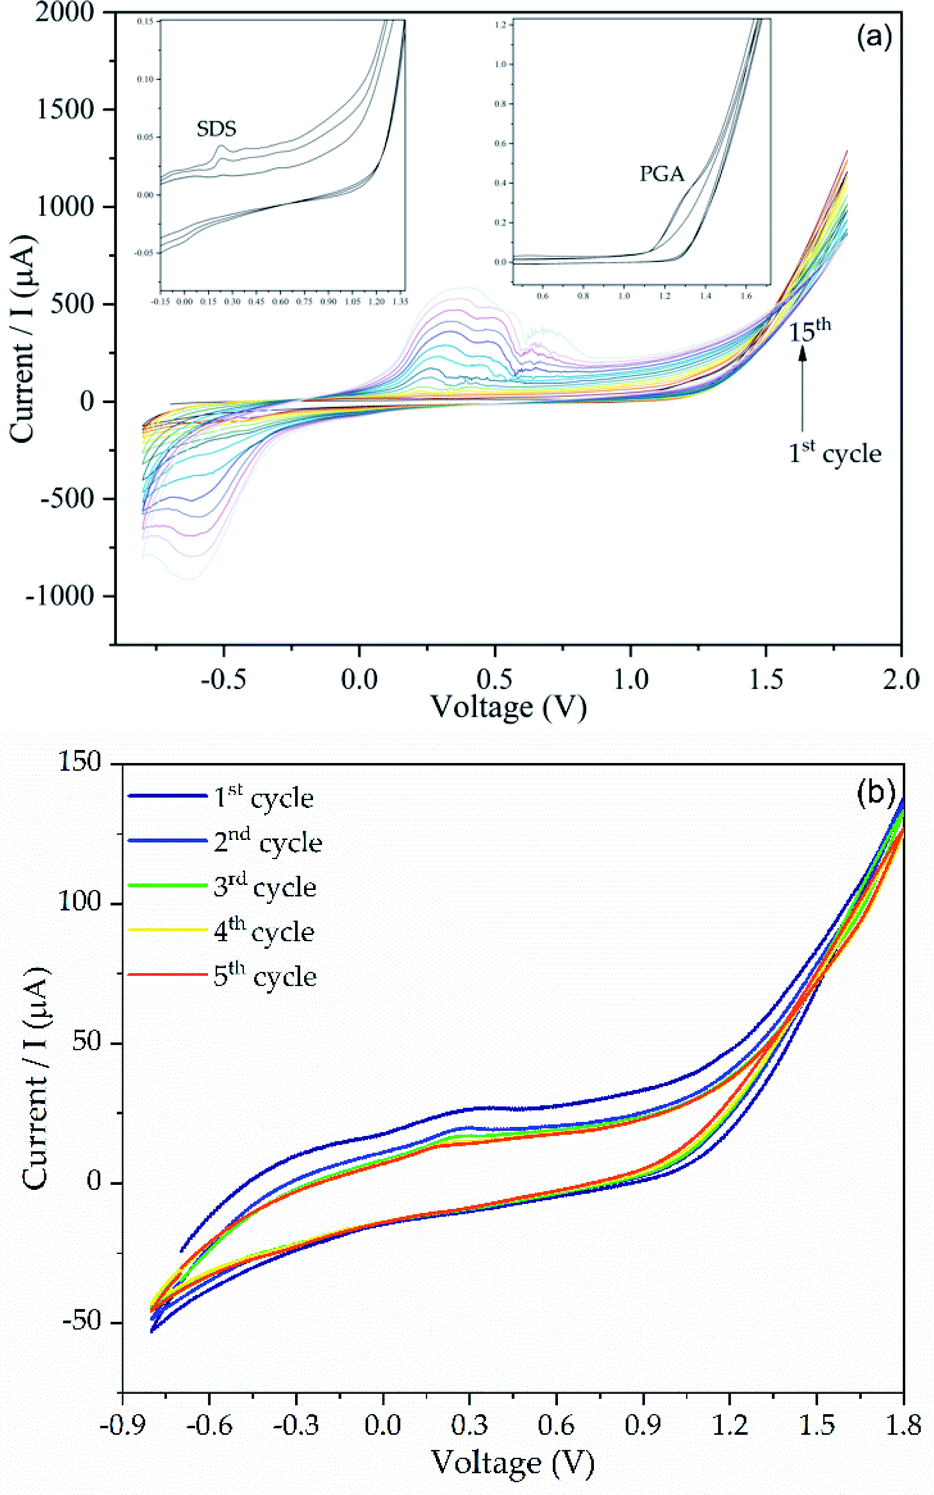 | ||
| Fig. 5 (a) The CV voltammogram of GA electro-polymerization and (b) extraction process of SDS from the PGA matrix. | ||
After electro-polymerization, the SDS molecules were then extracted from the polymer matrix to create a cavity as an SDS site. The CV voltammogram of SPCE–ZnONPs/MIP before and after extraction of SDS from the PGA matrix can be seen in Fig. 5b. As shown, a decrease of oxidation peak at a working potential of 0.18 V was observed on the second cycle (blue line) of extraction, showing that SDS molecules start to be removed from the polymer matrix. The absence of oxidation peak after the 5th extraction cycle, indicating a complete SDS removal.49
3.4 Surface morphology and EDX characterization of modified SPCE
SEM observation was applied to study the changes in surface morphology of SPCE–ZnONPs/MIP sensing. The morphology clearly shows that the bare SPCE (Fig. 6a) has a smoother surface than the modified SPCE. The surface of SPCE–ZnONPs/MIP (Fig. 6b) showed a rougher surface, suggesting that the MIP and ZnONPs successfully drop cast on the surface of SPCE. More importantly, as depicted by the red circle in Fig. 6b, the cavities present on the surface of SPCE–ZnONPs/MIP confirmed the successful polymerization of PGA and extraction SDS from the PGA matrix. Further, to verify that the ZnONPs have been drop cast on the SPCE, an EDX evaluation was applied. The EDX image (Fig. 6c) depicted the presence of carbon, oxygen, and Zn element. No doubt, it is confirmed that the ZnONPs successfully drop cast.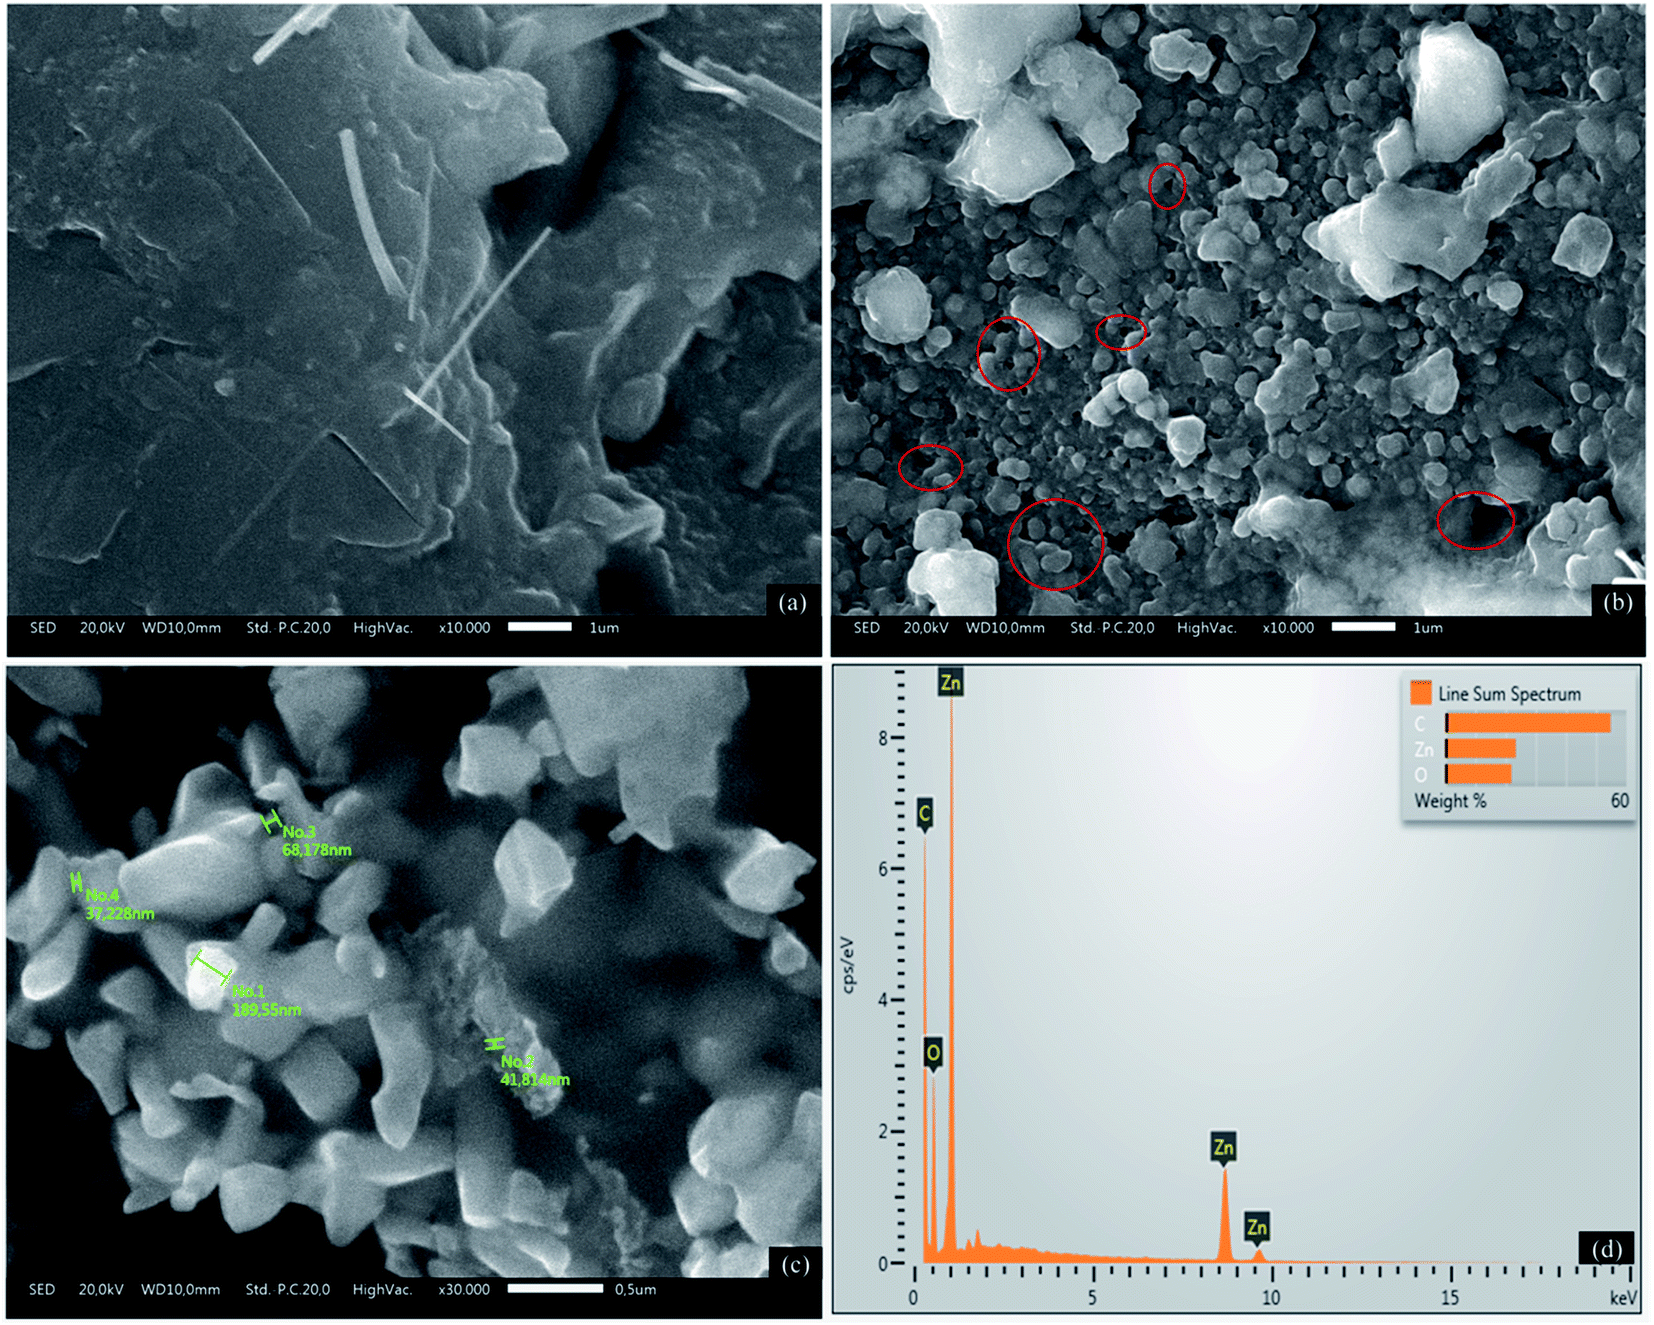 | ||
| Fig. 6 The surface morphology of: (a) bare SPCE (at 10000× magnification); (b) SPCE–ZnO/MIP (at 10000× magnification); (c) SPCE–ZnO/MIP (at 30000× magnification) and (d) EDX spectrum of SPCE–ZnONPs/MIP. | ||
3.5 The electrochemical response of SDS on modified SPCE
Electrochemical responses of 0.1 mM SDS on several modified SPCE were observed by differential pulse voltammetry (DPV) in 0.1 M PBS (pH = 7). We use the DPV technique to evaluate SDS response due to its advantage to provide higher current sensitivity, and better resolution than CV.50,51 Fig. 7 shows the DPV voltammogram and the histogram of SDS electrochemical response. As shown in Fig. 7b, the peak current of SDS responses on SPCE–NIP and SPCE–ZnONPs are similar to the response SDS on the bare SPCE. However, it was observed that the peak current response of SPCE–ZnONPs is lower than the bare SPCE. Factors that influence the electrochemical response are (1) the diffusion of the analyte, (2) the electrochemical catalytic reaction, and (3) the electron transport.52 Since the ZnONPs were simply dropping cast individually on the surface of SPCE, and therefore when the modified electrode was dried, the ZnONPs tended to agglomerate. Then reducing the peak current response due to the decrease in diffusion of SDS onto the surface of SPCE.53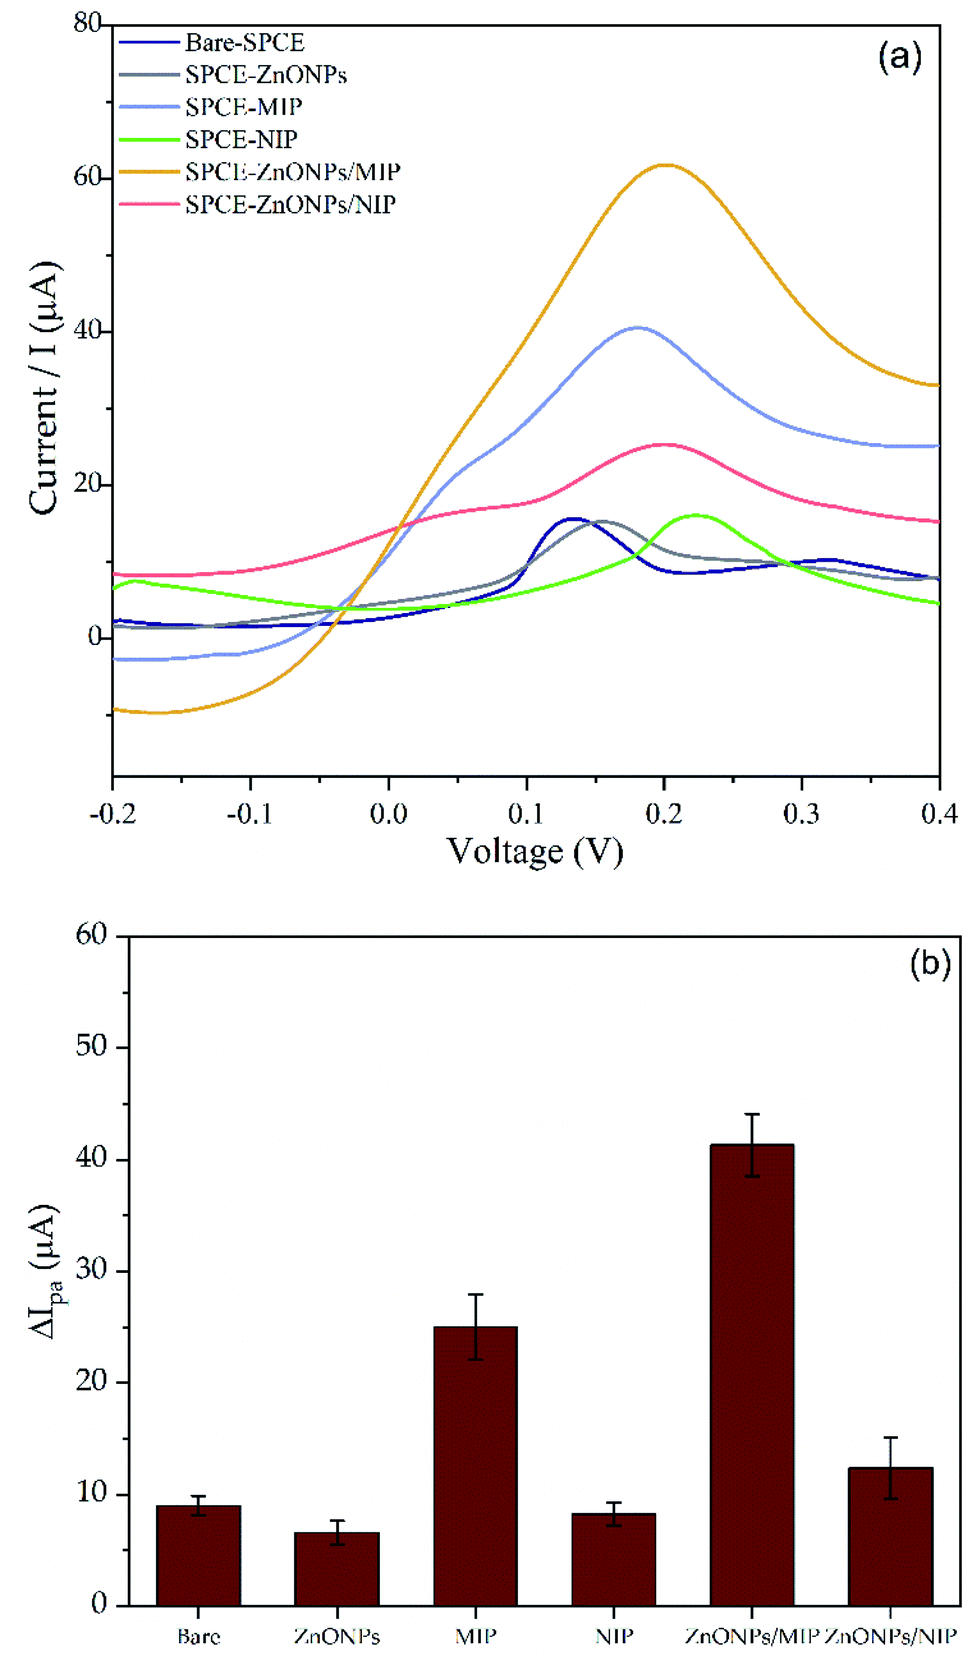 | ||
| Fig. 7 (a) DPV voltammogram and (b) histogram of SDS oxidation peak. | ||
A significant increment of SDS responses were observed on SPCE–MIP, SPCE–ZnONPs/NIP, and SPCE–ZnONPs/MIP with peak current values (Ipa) of 0.025 mA, 0.012 mA, and 0.041 mA, respectively. The SPCE/ZnONPs-NIP exhibited the poorest response as compared with SPCE–MIP and SPCE–ZnONPs/MIP. Conversely, the SPCE–ZnONPs/MIP exhibited the most significant current response. It seems the MIP plays an essential role as an organic binder for ZnONPs, reducing the aggregation of ZnONPs after drop cast on modified SPCE. Therefore, providing a better electrocatalytic activity.54,55 In addition, the presence of MIP cavities provides a highly selective template for SDS evaluation. No doubt, by combining the MIP with ZnONPs, the performance of the modified electrode remarkably improved.
3.6 Optimization of SPCE–ZnONPs/MIP
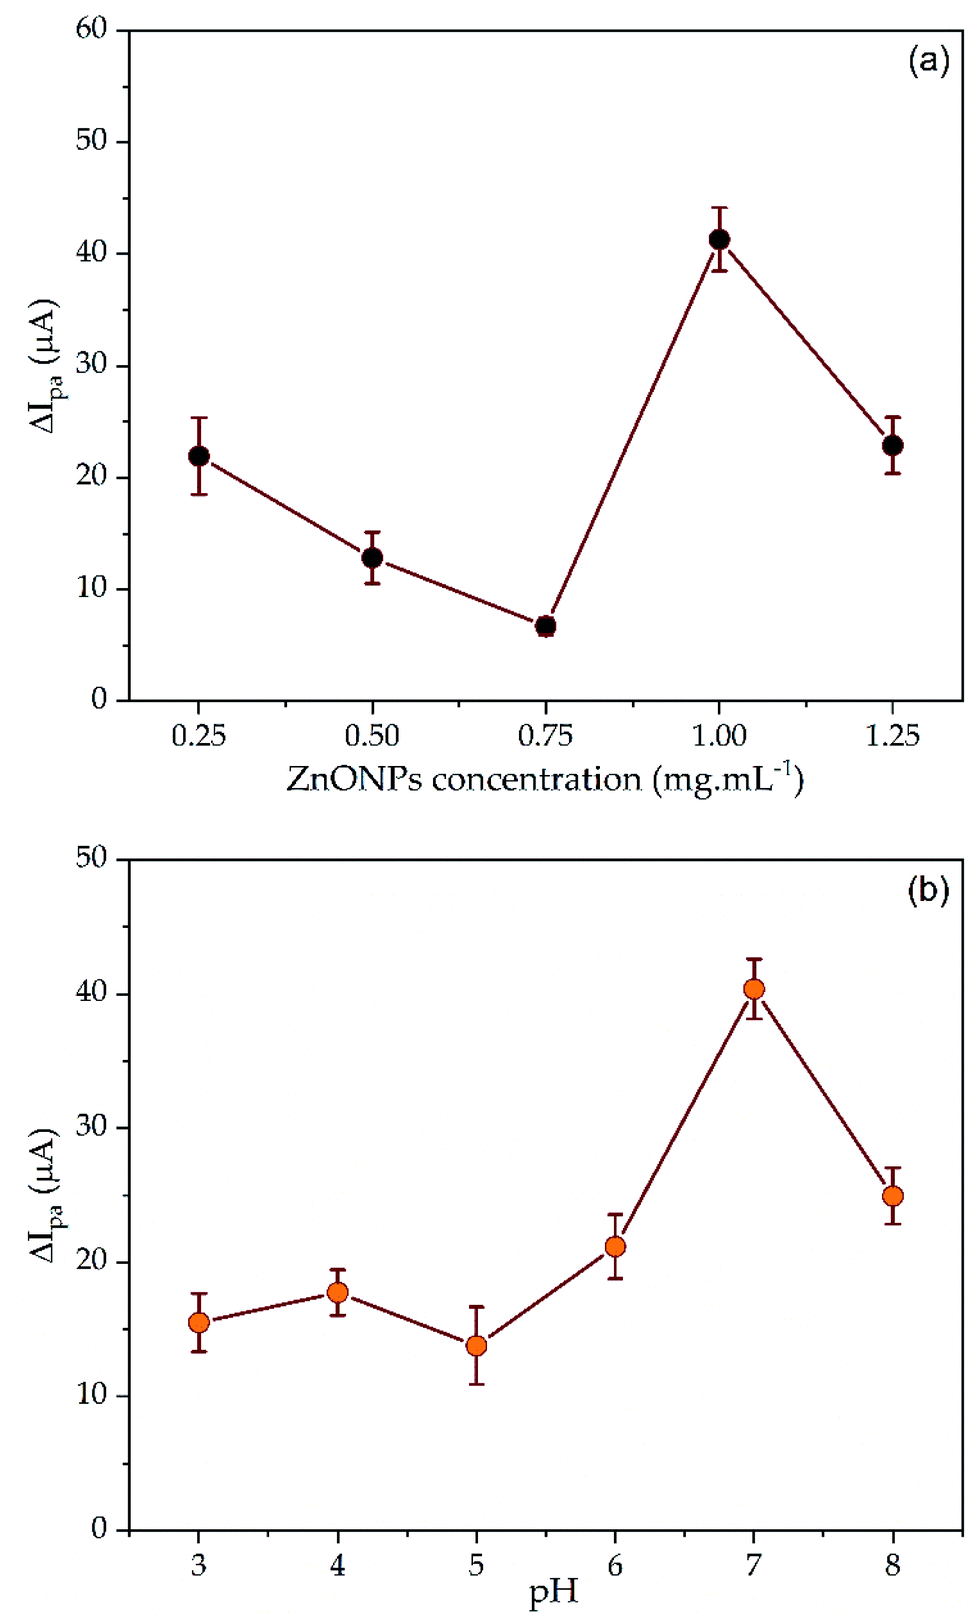 | ||
| Fig. 8 (a) The influence of ZnONPs concentration and (b) pH on anodic currents of 0.1 mM SDS on the SPCE–ZnONPs/MIP. | ||
3.7 Performance of the SPCE–ZnONPs/MIP sensing
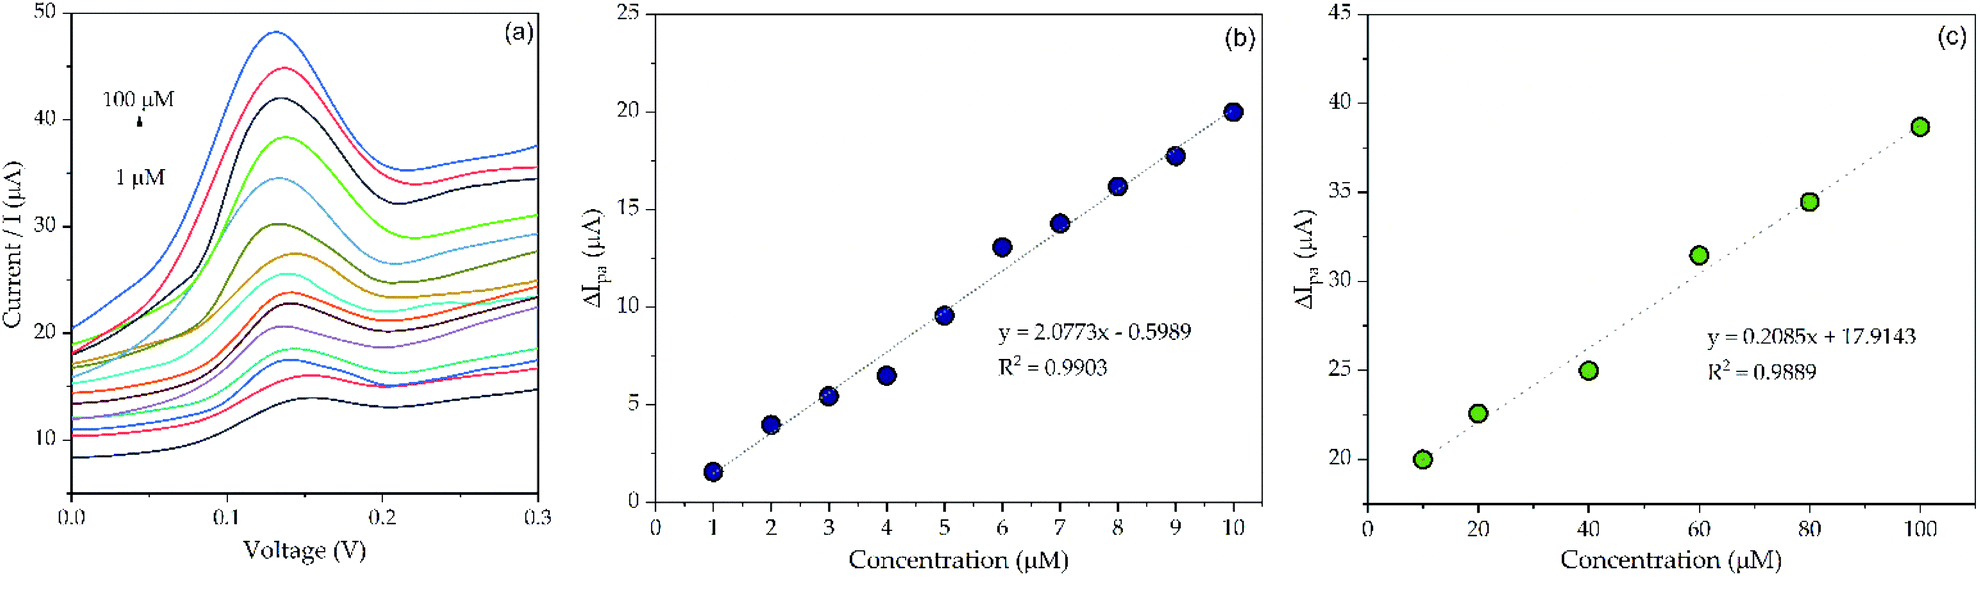 | ||
| Fig. 9 (a) DPV voltammogram of SDS at 1–100 μM; (b) plot of SDS concentration (1–10 μM) vs. anodic peak current; (c) plot of SDS concentration (10–100 μM) vs. anodic peak current. | ||
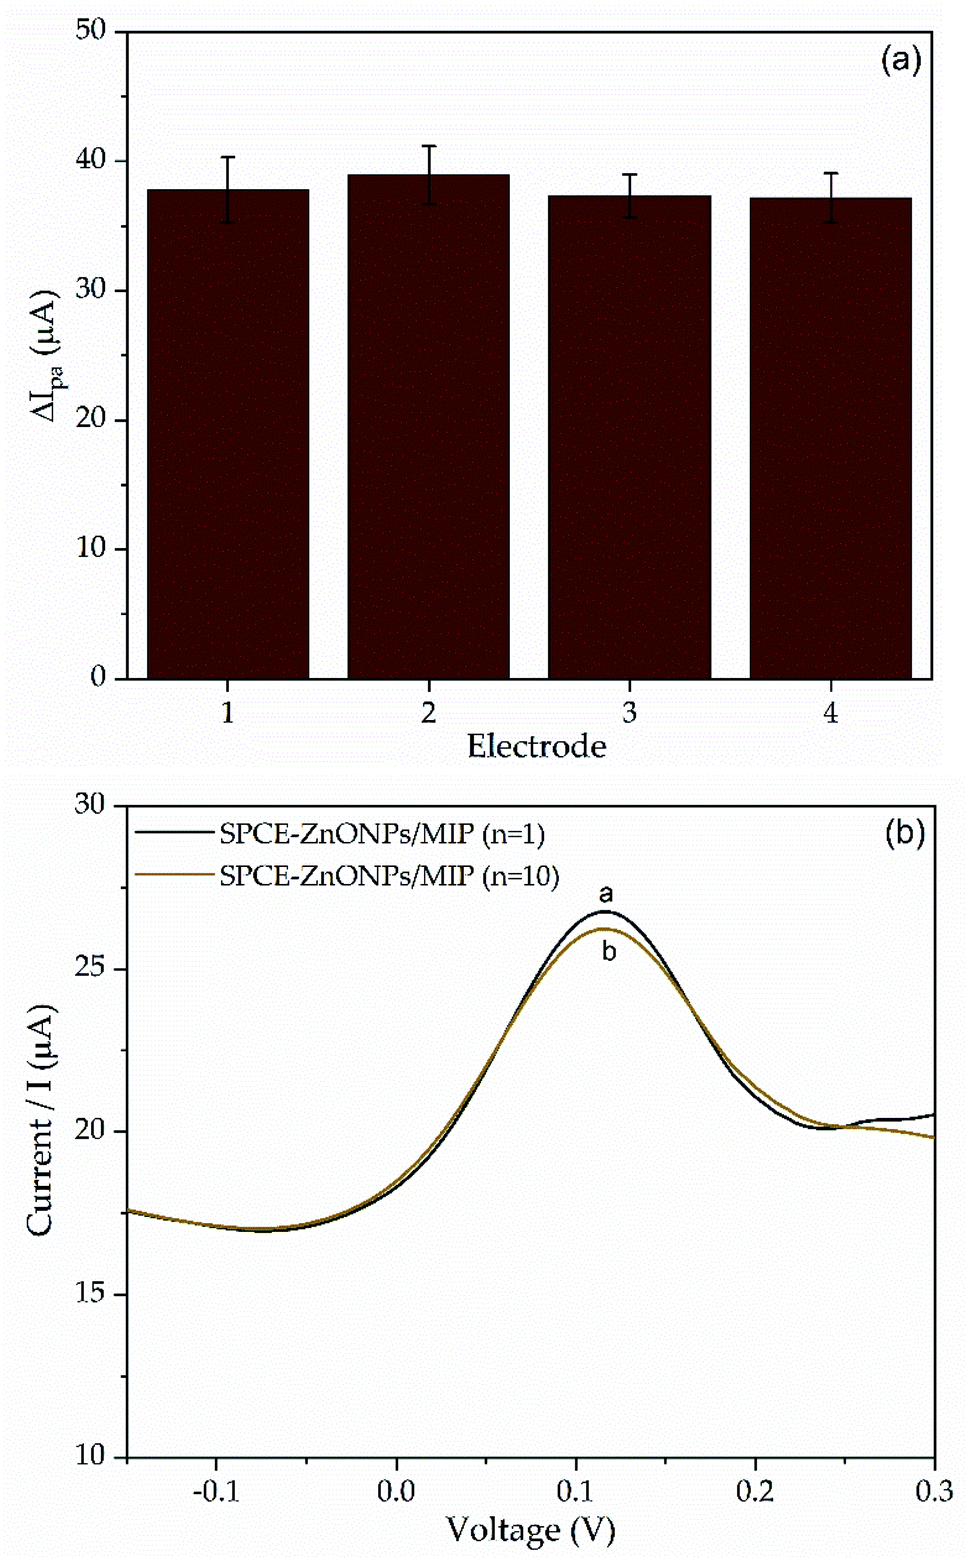 | ||
| Fig. 10 (a) The peak current of 0.1 mM SDS response on four different SPCE–ZnONPs/MIP and (b) the DPV curve of the repeatability measurement on an SPCE–ZnONPs/MIP. | ||
Further, the selectivity of SPCE–ZnONPs/MIP was tested in the presence of some interfering compounds, including Pb2+, Ca2+, and SDBS. The oxidation peak of those interferents present at the potential value of 0.80 V, 0.61 V, and 0.29 V, respectively (see Fig. 11a) on the bare SPCE. The voltammogram of SDS in the presence of interferents can be seen in Fig. 11b. As depicted, the peaks of interferent molecules were not detected. However, a decrease in peak current response of SDS + SDBS occurred, as shown in Fig. 11c. The structures of SDS and SDBS are similar,67 thus creating a strong competition between SDS and SDBS molecules to fill the cavities of molecule template on the polymer matrix, then decreasing the peak current response.12,15 Considering that the changes of peak current response of SDS in the presence of interferents are less than 10% (between 1–9.15%). Those molecules did not cause significant interference.66
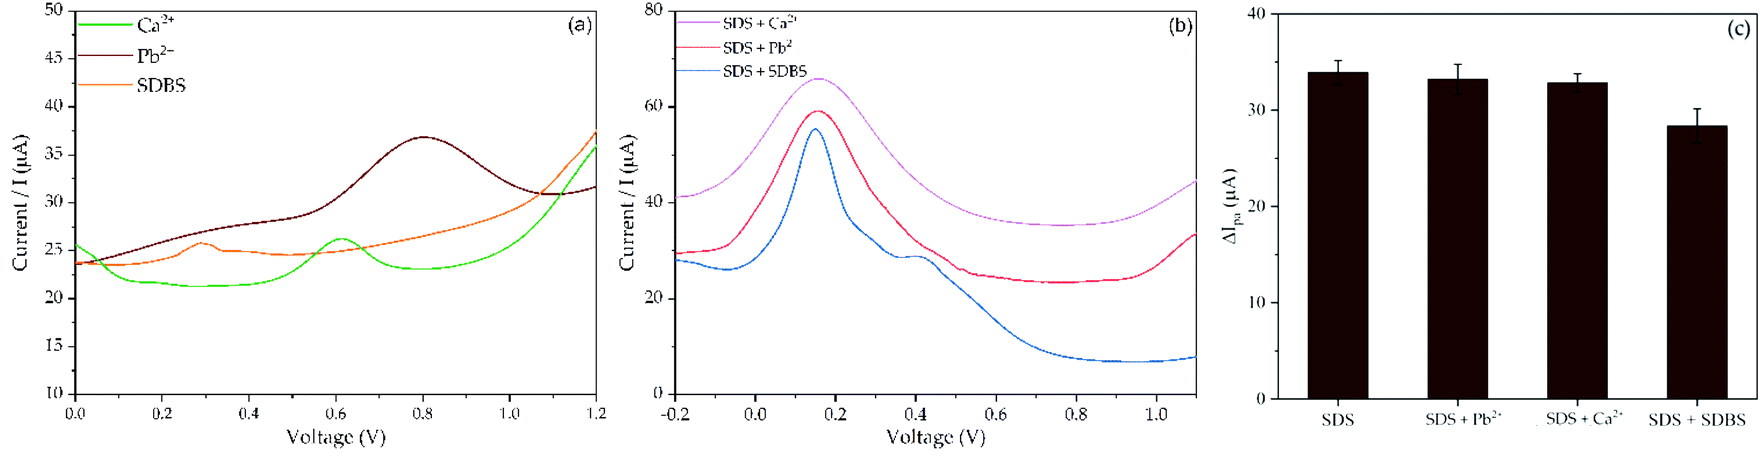 | ||
| Fig. 11 (a) Voltammogram of 0.1 mM interferent molecules on bare SPCE; (b) 0.1 mM SDS containing interferences (0.1 mM) on SPCE–ZnONPs/MIP; and (c) histogram of oxidation peak current of 0.1 mM SDS solution in the presence of interferences (0.1 mM) on SPCE–ZnONPs/MIP. | ||
3.8 Analysis of real samples
Finally, to test that our proposed method is applicable for evaluating real samples, we analyzed SDS concentration in laundry wastewater and shampoo. UV-visible spectrophotometry was used to confirm whether the measurement was accurate or not. As presented in Table 2, both the proposed method and UV-vis spectrophotometry evaluation are in good agreement for SDS determination. This was also emphasized by the calculation of texp and ttable, which show that the texp is lower than ttable, indicating that the proposed method is acceptable.68 In addition, the percentage recovery (%R) of SDS from the laundry wastewater and shampoo were 97.07 and 94.27% (see Table 3), revealing that our proposed method accurately detects SDS in real samples.2,66| Sample | DPV | UV-visible | texp | ttable |
|---|---|---|---|---|
| Concentration (μM ± % RSD) | Concentration (μM ± % RSD) | |||
| Laundry wastewater | 370.6 ± 1.95 | 342.6 ± 3.02 | 3.840 | 4.3 |
| Shampoo | 524.7 ± 1.48 | 522.3 ± 3.07 | 0.015 | 4.3 |
| Sample | Concentration (μM) | Spiked (μM) | Measured (μM) | Recovery (%) |
|---|---|---|---|---|
| Laundry wastewater | 3.71 | 5 | 8.45 | 97.07 |
| Shampoo | 5.25 | 5 | 9.66 | 94.27 |
The determination of SDS concentration using SPCE–ZnONPs/MIP provides a rapid and straightforward analysis. This is because the amount of samples required for the evaluation is only 50 μL, which is fewer than the evaluation using UV-visible spectrophotometry (2 mL). Thus, undoubtedly, our method exhibits an effective analysis with less time and sample consumption.
More importantly, compared to another electrochemical method in SDS evaluation, which uses Au-based screen printing electrode (Au-SPE),45 our proposed sensing is a carbon-based SPE, therefore cheaper than Au-SPE. Although the Au-SPE has shown more sensitive sensor performance, however, considering the low-cost preparation of carbon-based SPE, providing a sensitive electrochemical response, and capable of evaluating the SDS concentration below the stated concentration by government regulation, our modified SPCE are possible to be applied in a large scale, and powerful to be used for monitoring of SDS in wastewater runs off.
4. Conclusions
In summary, an electrochemical sensing-based SPCE–ZnONPs/MIP is developed for the detection of SDS. A simple and effective drop-casting technique is used to prepare the ZnONPs/MIP on the SPCE substrate. Electrochemical studies show that the modified electrode performs well towards the detection of SDS at pH 7. The linear dynamic range of SDS is 1–10 μM with LOD of 0.652 μM (0.188 μg mL−1) at the developed electrode. It is observed that the repeatability performance of the developed electrode is verified as suggested by a similar response after ten repetitive DPV tests. Most interestingly, the current response of SDS is improved up to four times higher by combining the MIP with ZnONPs, suggesting a better electrocatalytic activity. Considering the high % R of SDS from the real samples and its portability, the proposed SPCE–ZnONPs/MIP has a promising application for monitoring SDS directly in the environment.Author contributions
Data collection, data analysis, manuscript writing (PF). Design, concept, data collection, analysis, interpretation, and manuscript writing (HS and VS). Data collection, fabrication, and modification of SPCE, data analysis, and manuscript finalization (RVM).Conflicts of interest
There is no conflict to declare.Acknowledgements
This work was funded by P2MI Faculty of Mathematics and Sciences ITB under contract no. 61/IT.1.CO2/SK-TA/2021 and National Research and Innovation Agency (BRIN) under scheme INSINAS grant no. 12/INS/PPK/E4/2021. The authors thank the Department of Chemistry (Analytical Chemistry), Faculty of Mathematics and Natural Sciences, Bandung Institute of Technology, Research Centre for Electronics and Telecommunication and Research Unit for Clean Technology – National Research and Innovation Agency Republic of Indonesia for supporting this work. The authors also acknowledge the facilities, scientific and technical support from Advanced Characterization Laboratories Bandung, National Research and Innovation Agency Republic of Indonesia through e-Layanan Sains.References
- W. Fu, F. Qu, G. Yu and J. You, Sens. Actuators, B, 2017, 245, 774–779 CrossRef CAS.
- C. A. Bondi, J. L. Marks, L. B. Wroblewski, H. S. Raatikainen, S. R. Lenox and K. E. Gebhardt, Environ. Health Insights, 2015, 9, 27–32 Search PubMed.
- S. Kumar, T. J. Kirha and T. Thonger, J. Chem. Pharm. Res., 2014, 6(5), 1488–1492 Search PubMed.
- L. Ooi, L. Y. Heng and A. Ahmad, J. Sens., 2014, 2015, 809065 Search PubMed.
- The Government Regulation of the Republic of Indonesia Number 20, Implementation of Environmental Protection and Management, 2021.
- U. S. Food and Drug Administration, Food and Drug Administration Department of Health and Human Services, 2021, vol. 3 Search PubMed.
- X. Chen, S. Kang, M. J. Kim, J. Kim, Y. S. Kim, H. Kim, B. Chi, S. Kim, J. Y. Lee and J. Yoon, Angew. Chem., Int. Ed. Engl., 2010, 49(8), 1422–1425 CrossRef CAS PubMed.
- E. Rodenas-Torralaba, B. F. Reis, A. Morales-Rubio and M. d. l. Guardia, Talanta, 2005, 66, 591–599 CrossRef PubMed.
- N. Shende, A. Karale, P. Marathe, S. Chakraborty, A. D. Mallya and R. M. Dhere, Biologicals, 2019, 60, 68–74 CrossRef CAS PubMed.
- C. L. Zheng, Z. X. Ji, J. Zhang and S. N. Ding, Analyst, 2014, 139, 3476–3480 RSC.
- A. N. Reshetilova, I. N. Semenchukb, P. V. Iliasov and L. A. Taranovab, Anal. Chim. Acta, 1997, 347, 19–26 CrossRef.
- T. A. Ali and G. G. Mohamed, J. AOAC Int., 2015, 98, 116–123 CrossRef CAS PubMed.
- N. M. Makarova and E. G. Kulapina, Russ. J. Electrochem., 2015, 51, 672–678 CrossRef CAS.
- A. R. Ghiasvand, Z. Taherimaslak and M. Allahyari, Int. J. Electrochem. Sci., 2009, 4, 320–335 CAS.
- X. Hao, J. L. Lei, N. B. Li and H. Q. Luo, Anal. Chim. Acta, 2014, 852, 63–68 CrossRef CAS PubMed.
- R. Eivazzadeh-Keihan, R. Taheri-Ledari, M. S. Mehrabad, S. Dalvand, H. Sohrabi, A. Maleki, S. M. Mousavi-Khoshdel and A. E. Shalan, Energy Fuels, 2021, 35, 10869–10877 CrossRef CAS.
- M. F. Sanad, V. S. N. Chava, A. E. Shalan, L. G. Enriquez, T. Zheng, S. Pilla and S. T. Sreenivasan, ACS Appl. Mater. Interfaces, 2021, 13(34), 40731–40741 CrossRef PubMed.
- T. Sen, S. Mishra, S. S. Sonawane and N. G. Shimpi, Polym. Eng. Sci., 2018, 58, 1438–1445 CrossRef CAS.
- M. R. Ganjali, F. G. Nejad and H. Beitollahi, Int. J. Electrochem. Sci., 2017, 12, 3231–3240 CrossRef CAS.
- T. Gan, A. Zhao, S. Wang, Z. Lv and J. Sun, Sens. Actuators, B, 2016, 235, 707–716 CrossRef CAS.
- Z. Wang, H. Li, F. Tang, J. Ma and X. Zhou, Nanoscale Res. Lett., 2018, 13, 202 CrossRef PubMed.
- T. Kokab, A. Shah, M. A. Khan, M. Arshad, J. Nisar, M. N. Ashiq and M. A. Zia, ACS Appl. Nano Mater., 2021, 4(5), 4699–4712 CrossRef CAS.
- R. Gui, H. Jin, H. Guo and Z. Wang, Biosens. Bioelectron., 2018, 100, 56–70 CrossRef CAS PubMed.
- T. Gan, J. Li, A. Zhao, J. Xu, D. Zheng, H. Wang and Y. Liu, Food Chem., 2018, 268, 1–8 CrossRef CAS PubMed.
- A. Chiappini, L. Pasquardin and A. M. Bossi, Sensors, 2020, 20, 5069 CrossRef CAS PubMed.
- T. Gan, J. Li, L. Xu, S. Guo, A. Zhao and J. Sun, Microchim. Acta, 2020, 187, 291 CrossRef CAS PubMed.
- A. Yarman and F. Scheller, Sensors, 2020, 20, 2677 CrossRef CAS PubMed.
- L. M. Gonçalves, Curr. Opin. Electrochem., 2021, 25, 100640 CrossRef.
- T. Kitto, C. B. Guen, N. Rossetti, and F. Cicoira, Processing and patterning of conducting polymers for flexible, stretchable, and biomedical electronics, in Handbook of Organic Materials for Electronic and Photonic Device, Woodhead Publishing Series in Electronic and Optical Materials, 2nd edn, 2019, pp. 817–842 Search PubMed.
- D. Dechtrirat, B. Sookcharoenpinyo, P. Prajongtat, C. Sriprachuabwong, A. Sanguankiat, A. Tuantranont and S. Hannongbua, RSC Adv., 2018, 8, 206 RSC.
- S. L. Wei, L. Yan, X. Huang, J. Li, S. Yao, H. Zhang and A. Xu, Ionics, 2021, 27, 375–387 CrossRef CAS.
- M. N. Bui, C. A. Li and G. H. Seong, BioChip J., 2012, 6, 149–156 CrossRef CAS.
- H. Setiyanto, F. Ferizal, V. Saraswaty, R. S. Rahayu and M. A. Zulfikar, IOP Conf. Ser.: Mater. Sci. Eng., 2021, 1088, 012113 CAS.
- Y. Lin, K. Liu, C. Liu, L. Yin, Q. Kang, L. Li and B. Li, Electrochim. Acta, 2014, 133, 492–500 CrossRef CAS.
- J. J. Feminus, R. Manikandan, S. S. Narayanan and P. N. Deepa, J. Chem. Sci., 2019, 131, 11 CrossRef.
- N. M. Shamhari, B. S. Wee, S. F. Chin and K. Y. Kok, Acta Chim. Slov., 2018, 65, 578–585 CrossRef CAS PubMed.
- N. Akbar, Z. Aslam, R. Siddiqui, M. R. Shah and N. A. Khan, AMB Express, 2021, 11, 104 CrossRef CAS PubMed.
- M. Pudukudy and Z. Yaakob, J. Cluster Sci., 2014, 26, 1187–1201 CrossRef.
- D. Jain, Shivani, A. A. Bhojiya, H. Singh, H. K. Daima, M. Singh, S. R. Mohanty, B. J. Stephen and A. Singh, Front. Chem., 2020, 8, 778 CrossRef CAS PubMed.
- Z. M. Al-Asady, A. H. AL-Hamdani and M. A. Hussein, AIP Conf. Proc., 2020, 2213, 020061 CrossRef CAS.
- A. B. Lavand and Y. S. Malghe, Int. J. Photochem., 2015, 305–310 Search PubMed.
- U. S. Rao, G. Srinivas and T. P. Rao, Procedia Mater. Sci., 2015, 10, 90–96 CrossRef CAS.
- S. Palanisamy, C. Karuppiah, S. Chen and P. Periakaruppan, Electroanalysis, 2014, 26, 1984–1993 CrossRef CAS.
- R. A. D. Faria, Y. Messaddeq, L. G. D. Heneine and T. Matencio, Int. J. Biosens. Bioelectron., 2019, 5(1), 1–2 Search PubMed.
- S. Motia, I. A. Tudor, L. M. Popescu, R. M. Piticescu, B. Bouchikhi and N. El Bari, J. Electroanal. Chem., 2018, 823, 553–562 CrossRef CAS.
- D. P. Santos, M. V. B. Zanoni, M. F. B. Bergamini, A. Chiorcea-Paquim, V. C. Diculescu and A. O. Brett, Electrochim. Acta, 2008, 53, 3991–4000 CrossRef CAS.
- L. Zhang and X. Lin, Analyst, 2001, 126, 367–370 RSC.
- S. Pruneanu, F. Pogacean, C. Grosan, E. M. Pica, L. V. Bolundut and A. S. Biris, Chem. Phys. Lett., 2011, 504, 56–61 CrossRef CAS.
- I. Seguro, J. G. Pacheco and C. Delerue-Matos, Sensors, 2021, 21, 1975 CrossRef CAS PubMed.
- M. Amare and S. Admassie, Bull. Chem. Soc. Ethiop., 2012, 26, 73–84 CrossRef CAS.
- Y. Zhou, W. Tang, J. Wang, G. Zhang, S. Chai, L. Zhang and T. Liu, Anal. Methods, 2014, 6, 3474 RSC.
- Y. Li, P. Kang, H. Huang, Z. Liu, G. Li, Z. Guo and X. Huang, Sens. Actuators, B, 2020, 307, 127639 CrossRef.
- D. Antuña-Jiménez, M. B. González-García, D. Hernández-Santos and P. Fanjul-Bolado, Biosensors, 2020, 10, 9 CrossRef PubMed.
- L. Nemcek, M. Šebesta, M. Urík, M. Bujdoš, E. Dobročka and I. Vávra, Plants, 2020, 9, 1365 CrossRef CAS PubMed.
- S. Chaudhary, A. Umar, K. K. Bhasin and S. Baskoutas, Materials, 2018, 11, 287 CrossRef PubMed.
- D. Martín-Yerga, D. Bouzas-Ramos, M. Menéndez-Miranda, A. R. M. Bustos, J. R. Encinar, J. M. Costa-Fernández, A. Sanz-Medel and A. Costa-García, Electrochim. Acta, 2015, 166, 100–106 CrossRef.
- J. Gross, S. Sayle, A. R. Karow, U. Bakowsky and P. Garidel, Eur. J. Pharm. Biopharm., 2016, 104, 30–41 CrossRef CAS PubMed.
- M. A. Ashraf, W. Peng, Y. Zare and K. Y. Rhee, Nanoscale Res. Lett., 2018, 13, 214 CrossRef PubMed.
- L. Ozcan and Y. Sahin, Sens. Actuators, B, 2007, 127, 362–369 CrossRef CAS.
- D. R. Albano and F. Sevilla III., Sens. Actuators, B, 2007, 121, 129–134 CrossRef CAS.
- N. Alizadeh and M. Mahmodian, Elecctroanalysis, 2000, 12, 7 CrossRef.
- G. A. E. Mostafa, Int. J. Environ. Anal. Chem., 2008, 88, 435–446 CrossRef CAS.
- C. Trellu, N. Oturan, Y. Pechaud, E. D. van Hullebusch, G. Esposito and M. A. Oturan, Water Res., 2017, 118, 1–11 CrossRef CAS PubMed.
- M. Ghalkhani, F. Ghelichkhani and F. Ghorbani-Bidkorbeh, Iran. J. Pharm. Res., 2018, 17, 44–53 CAS.
- W. Argoubi, M. Saadaoui, S. B. Aoun and N. Raouafi, Beilstein J. Nanotechnol., 2015, 6, 1840–1852 CrossRef CAS PubMed.
- S. F. Beckert and W. S. Paim, Int. J. Metrol. Qual. Eng., 2017, 8, 23 CrossRef.
- A. K. Anas, S. Y. Pratama, A. l Izzah and M. A. Kurniawan, Bull. Chem. React. Eng. Catal., 2021, 16, 188–195 CrossRef CAS.
- T. K. Kim, Korean J. Anesthesiol., 2015, 68, 540–546 CrossRef PubMed.
| This journal is © The Royal Society of Chemistry 2022 |