
 Open Access Article
 This Open Access Article is licensed under a Creative Commons Attribution-Non Commercial 3.0 Unported Licence
Investigating cyanogen rich Manihot esculenta efficacy for Ru phytomining and application in catalytic reactions†
Sifelani Dube,
Leah C. Matsinha,
Banothile C. E. Makhubela and
Abayneh A. Ambushe*
and
Abayneh A. Ambushe*
Research Center for Synthesis and Catalysis, Department of Chemical Sciences, University of Johannesburg, P. O. Box 524, Auckland Park 2006, South Africa. E-mail: aambushe@uj.ac.za; Tel: +27 (11) 559 2329
First published on 5th January 2022
Abstract
Phytomining is a newly developing alternative green technology. This technology has been applied for recovering precious metals from mine tailings that are low-grade ores. In this study, effective catalytic transfer hydrogenation of furfural to furfural alcohol was investigated using a ruthenium (Ru) bio-based catalyst, Ru@CassCat. The catalyst was prepared from Ru rich bio-ore recovered during laboratory scale phytomining as a model of mining tailing using the cassava plant (Manihot esculenta). Pre-rooted cassava cuttings were propagated and watered with Ru rich solutions for ten weeks before harvest. Harvested cassava roots were calcined to produce the bio-ore used as an in situ bio-based catalyst. The properties of the catalyst were characterized by various techniques, which include transmission electron microscopy (TEM), Fourier transform infrared (FT-IR) spectroscopy, scanning electron microscopy coupled to energy-dispersive X-ray spectroscopy (SEM-EDS), powder X-ray diffraction (pXRD), ultraviolet-visible (UV-Vis) spectroscopy, thermogravimetric analysis (TGA) and Brunauer–Emmett–Teller (BET) theory. Characterization by FTIR, SEM and TEM revealed that RuCassCat has spherical component particles, loosely arranged around a cellulose/lignin-like matrix of the biocatalyst. It was also found that calcination strengthened the structure and texture of the support carbon matrix to distribute the Ru particles evenly. An ICP-MS analysis showed that up to 295 μg g−1 of Ru was detected in cassava roots. The variation of test conditions, namely, temperature, time, base, catalyst load, and a hydrogen source, was investigated. Optimally, a 0.00295 wt% ruthenium loading on the Ru@CassCat catalyst resulted in 100% furfural conversion with a turnover frequency of 0.0114 million per hour at 160 °C for 24 h using triethylamine as a base and formic acid as a hydrogen source. The catalyst remained active for up to three recycles, consecutively and produced furfural alcohol in high turnover numbers.
1. Introduction
Conventional mining activities on high-grade ores have shown an increase in recent decades due to the demand for metals. As a result, low-grade ore tailings have built up, which are not feasible to mine conventionally. Typical low-grade mine tailings pile up in old Johannesburg Gold Mines, Gauteng Province, South Africa.1 Therefore, there is a need to develop cost-effective and eco-friendly technologies such as phytoextraction and phytomining to extract and remediate the remaining valuable metals to produce a bio-ore.2 Remediated soils can thus be reused for agriculture, forestry, and other commercial purposes.3,4Phytomining, a process where recovered bio-ore is further refined into valuable metal or metal products to cover the extraction costs, extends beyond phytoextraction.5 The resulting bio-ore can then be used as a raw material to produce bio-based catalysts for the chemical manufacturing industry. Phytomining poses a great advantage with minimal environmental damage compared with traditional mining methods such as open casts with high soil erosion rates.6 The amount of metal the plant absorbs depends on the metal's bioavailability and the hyperaccumulator plant species used.
Identifying and selecting an appropriate hyperaccumulator species is vital to the process of phytomining. The species used should accumulate exceptional metal concentrations in roots or aerial parts without evident toxicity signs.7 Usually, heavy metal tolerant hyperaccumulators with a rapid growth rate, high biomass yield per hectare, and a prolific root system are used in phytomining. Due to their short growth periods and adaptability to environmental stresses (water scarcity and high temperature), trees, grasses, vegetables, annual and tropical root crops such as cassava are preferred.8,9 Cassava is a woody tropical root crop cultivated perennially in tropics and subtropics for consumption by animals and humans. It forms part of the staple diet in the Democratic Republic of the Congo and Nigeria.2 However, some wild versions (e.g., Manihot (M.) acuminatissima, M. sparsifolia, M. pruinose, M. alutacea, M. divergens, M. cecropiaefolia and M. esculenta.11) are highly toxic, being non-edible because of extremely high levels of cyanide, a complexing ligand, in the leaves and adventitious roots. In this study, M. esculenta was used in ruthenium (Ru) phytomining without posing a threat to food security.10
To the best of our knowledge, no alternative reports have been made on the phytomining of Ru. Ruthenium is one of the platinum group metals (PGMs) whose price has remained high because of the high demand, economic value, scarcity, and application in catalysis.12 Bio-based catalysts based on Ru have been applied in the synthesis of anti-cancer agents,13 automotive catalytic converters,14 olefin metathesis15 and hydrogenation reactions.16 The Ru@CassCat produced in this study was applied in the hydrogenation of furfural to furfural alcohol (FFA). The easily accessible and available platform molecule furfural17 is an important raw material of multichemical products (Scheme 1), including furfural alcohol (FFA).18,19
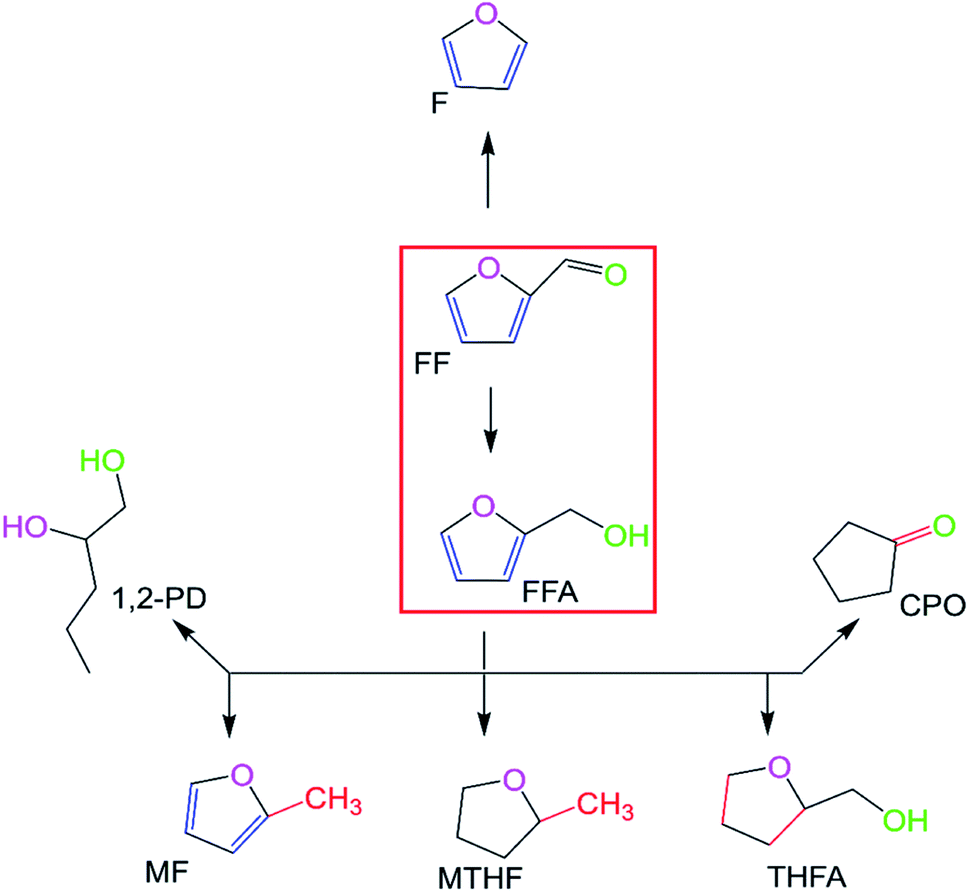 | ||
| Scheme 1 Typical chemoselective reactions that can result from furfural hydrogenation. (F = furan, FF = furfural, FFA = furfural alcohol, MF = methylfuran, MTHF = methyltetrahydrofuran, THFA = tetrahydrofurfuryl alcohol, CPO = cyclopentanone, 1,2-PD = 1,2-pentanediol).19 | ||
Here, we report on a laboratory-based investigation of cassava's phytomining ability to recover catalytically active Ru-rich bio-based material. The main goal of this study was to demonstrate the potential of cassava to absorb precious metals from soils. Backyard potting soils were used as models of mining tailing for field application. The study chose cassava plant, a natural hyperaccumulator due to its cyanogenic rich glucoside. The usage of the cyanide ligand in cassava minimizes the need for chelating agents, which must be added to soils to improve the metal absorption capacity of the subject plant. Therefore, the focus was on recovering the bio-ore laden with metal particles and its application in catalytic reactions. The study further evaluated the catalytic potential of the recovered bio-based catalyst in the chemoselective hydrogenation of furfural to furfural alcohol. A successful application of such a catalyst means converting furfural sourced from lignocellulosic biomass into commercially valuable end products like furfural alcohol. These products can be used as important raw material feedstock for the chemical industry.
2. Materials and methods
2.1. Cassava growth studies in Ru contaminated soils
Cassava stem cuttings (approximately 15 cm long) obtained from Mzinti, Mpumalanga, South Africa, were first pre-rooted for propagation in standard plastic potting mixes for a few weeks to develop a strong foundation plant structure with support roots before contamination. After developing enough leaves to sustain photosynthesis, rooted stem cuttings in triplicate were subjected to a 14 hours photoperiod of daily watering and controlled temperature at the University of Johannesburg Greenhouse. The greenhouse has an average optimum temperature range of 22–26 °C day/night. A 1000 mL of 500 mg L−1 of Ru(III) solution prepared from ruthenium(III) chloride hydrate (RuCl3·xH2O) (Sigma-Aldrich, USA) salt was used for every four contaminations (250 mL per contamination) of the subject plant while the control plant was watered with an equal volume of tap water. Both plants were watered every 48 h and allowed to grow under observation for up to nine weeks.2.2. Catalyst preparation, characterization and inductively coupled plasma-mass spectrometry analysis
After ten weeks of contamination, both control and contaminated plants were harvested and segregated into leaves, stems, and roots. Segregated plant parts were left to air dry up to 14 days in clean sample preparation rooms to avoid cross-contamination of the samples. Dry samples were then prepared for inductively coupled plasma-mass spectrometry (ICP-MS) analysis by grinding into a fine powder using a portable electric coffee grinder (NIMA, Japan). Soil samples were ground using a milling machine. Ground samples were then sieved through a 0.074 mm metallic pore sieve. A 0.1 g of each plant sample was digested in 10 mL of Suprapur HNO3 (Merck, Germany). An equivalent amount of growth soil was also digested; however, in a respective 3![[thin space (1/6-em)]](https://www.rsc.org/images/entities/char_2009.gif) :1:1 mixture (10 mL) of HCl (Merck, Germany), HF (Merck, Spain), and HNO3. Complete digestion was obtained; hence, there was no need for filtering the digests. Calcined adventitious roots (0.01 g) were also digested in a 4:2 mixture (10 mL) of HNO3 and H2O2 (Sigma-Aldrich, Germany). Operating conditions of the microwave digestion system are reported in Table S1.† Digested samples were filtered using a 0.45 μm syringe filter, diluted further using a 1% HNO3 solution and quantitative determination of Ru was conducted using an ELAN 6100 and a NexION™ 300 ICP-MS (PerkinElmer, Canada). The ICP-MS operating conditions are reported in Table S2.†
:1:1 mixture (10 mL) of HCl (Merck, Germany), HF (Merck, Spain), and HNO3. Complete digestion was obtained; hence, there was no need for filtering the digests. Calcined adventitious roots (0.01 g) were also digested in a 4:2 mixture (10 mL) of HNO3 and H2O2 (Sigma-Aldrich, Germany). Operating conditions of the microwave digestion system are reported in Table S1.† Digested samples were filtered using a 0.45 μm syringe filter, diluted further using a 1% HNO3 solution and quantitative determination of Ru was conducted using an ELAN 6100 and a NexION™ 300 ICP-MS (PerkinElmer, Canada). The ICP-MS operating conditions are reported in Table S2.†
After the first quantitative analysis, a sample of adventitious roots was calcined in porcelain crucibles in a furnace at 300 °C for 3 h to produce a Ru-based Ru@CassCat catalyst.20 Root samples were also separately calcined at similar conditions to prevent cross-contamination. The produced Ru-based and control carbon-supported bio-based catalysts were digested and analyzed using ICP-MS. The second quantitative analysis determined the new concentration of Ru in the Ru@CassCat catalyst for loading later. Both bio-based catalysts were characterized by various analytical and spectroscopic techniques, which include transmission electron microscopy (TEM), scanning electron microscopy (SEM), powder X-ray diffraction (pXRD), energy-dispersive X-ray spectroscopy (EDS), ultraviolet-visible (UV-Vis) spectroscopy, thermogravimetric analysis (TGA), Fourier transform infrared (FT-IR) spectroscopy and Brunauer–Emmett–Teller (BET) to study their physicochemical properties. Metal salt used during the contamination was also characterized for comparison where possible.
2.3. Evaluation of Ru@CassCat in the hydrogenation of furfural
Catalytic transfer hydrogenation reactions were conducted in a 50 mL high-pressure stainless-steel autoclave (Taiatsu Techno (R)) reactor equipped with high heat-resistant glass sleeves. Various reaction parameters were optimized, including bases variation 1,8-diazabicyclo[5.4.0]undec-7-ene (DBU) (Furka, Germany), pyridine (Sigma-Aldrich, UK), triethylamine (Et3N) (Sigma-Aldrich, UK) and KOH (Rochelle Chemicals, South Africa)), bio-based catalyst load (10–40 mg), sources of hydrogen (ethanol (Sigma-Aldrich, Germany), formic acid (Sigma-Aldrich, Germany), methanol (Sigma-Aldrich, France, and Germany), and isopropanol (Glassworld, South Africa)), temperature (100–160 °C), and time (10–24 h). The tightly sealed reactor was mounted on a pre-heated electric magnetic stirring personal synthesizer (Tokyo Rikakikai, Japan) equipped with a digital temperature controller. The reaction was left at the desired temperature to continuously stir at 1000 revolutions per minute (rpm). After the desired time had elapsed, the reactor was removed from the stirrer, cooled, and slowly depressurized as a way of stopping the reaction before opening. Proton (1H) NMR (Bruker, South Africa) spectroscopy was used to analyze the product mixture to determine substrate conversion, product yield and selectivity. The above procedure was adapted from Oklu21 and Moyo.22 For recyclability tests, a product mixture was dissolved in ethanol. The resultant solution was evaporated under vacuum at 115 °C to leave a solid Ru@CassCat catalyst residue dried at 40 °C overnight in a vacuum oven. The dried solid was transferred back into the autoclave reactor, recharged with all reactants, and set up another cycle at optimum conditions. The procedure was repeated until no solid residue was recoverable. All experiments were repeated to ensure reproducibility.3. Results and discussion
3.1. Synthesis of Ru@CassCat catalyst
In this study, a laboratory greenhouse study area was chosen rather than a field so that experimental plants could be subjected to constant temperatures until harvest time. A greenhouse also offers a less contaminating environment, unlike open fields subject to erosion contaminations. Greenhouse growth studies and some part of bio-based catalyst characterization followed in this report were adopted from the work published by Parker et al.,20 on Pd and Alcantara et al.,2,23 on Hg and Au.A report from Parker et al.,20 who synthesized Pd nanoparticles using Arabidopsis, recorded that 10 mM palladium acetate [Pd(OAc)2] solution caused plants to wilt within 24 h of contamination due to high metal dosage. A high metal concentration exposure to a plant in a short period reduces the time available to reduce enough Pd metal ions to their elemental state. This research used 500 mg L−1 of Ru(III) solution over an eight to ten-week contamination period. This period was long enough to allow plants to absorb more metal ions and reduce them to their atomic state. Parker et al.20 reported wilting Arabidopsis in 24 h due to high metal dosage. Giving the plant enough time allow it to produce reduced metal atoms that are widely spread and evenly distributed across tissues. Since the experiment was performed as a model of mine tailings containing low metal levels, it was essential to use less concentrated solutions for contamination. Garden soil growth studies were chosen over hydroponic culture studies to imitate mining tailing dumps. These soils have high nutritional content required for plant growth, eliminating applying fertilizers and other artificial nutrients rich media. In nine weeks of contamination, yellowing and drying of plant leaves signalled metal shock and stress symptoms (Fig. 1).
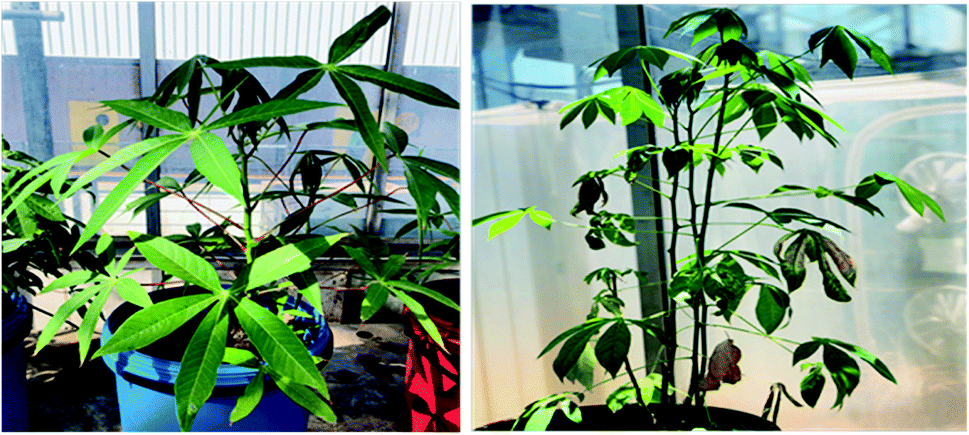 | ||
| Fig. 1 Cassava plants before (left) and after (right) weeks of metal contamination.24 | ||
Plants start showing stress and shock symptoms as metals accumulate to higher concentrations by wilting up their leaves.20 Accumulation of metals tends to block aquaporin channels required for water and nutrient absorption leading to metal stress observed in some plants. Thus, plants were harvested and prepared for metal quantification following stress symptoms.
Inductively coupled plasma-mass spectrometry was used to determine the concentration of accumulated metals in harvested plant parts. The technique was chosen because of its reliability at a low detection limit (LOD) and linearity over a wide dynamic range. The analysis was performed using an external calibration method. A calibration curve for Ru quantification is shown in Fig. S1,† and results obtained from the quantitative analysis are presented in Table 1. Acceptable linearity was obtained for the quantification of Ru by ICP-MS with a coefficient of determination (R2) value of 0.9996. Such a value is close to one and indicates a great relationship strength of the analysis model to the detected concentrations. The percentage relative standard deviation (%RSD) was <5% for all measurements for precision. This value is three times less than a % RSD of 15%, and is acceptable in analyses of higher concentrations.
| Sample | Concentration (μg g−1) | |||
|---|---|---|---|---|
| Leaves | Stem | Roots | Soil | |
| a The concentration for control samples was <LOD. The LOD = 3 × SDblank. (SD = standard deviation = 0.178). | ||||
| Uncalcined | 33.1 ± 0.3 | 3.02 ± 0.04 | 147 ± 1.4 | 869 ± 11.5 |
| Calcined | 47.4 ± 0.3 | 18.9 ± 0.1 | 295 ± 1.2 | |
Since cassava plants were contaminated with metal-rich solutions at 500 mg L−1 concentration, absorbed metal concentration in plant tissues was expected to range from higher μg kg−1 (ppb) to low mg kg−1 (ppm). Quantitative analysis of uncalcined samples showed that cassava absorbed up to 147 μg g−1 of Ru in roots, 33.1 μg g−1 in leaves, and 3.02 μg g−1 in the stem. These results show an accumulation trend of root > leaf > stem. A similar trend has been reported by Yabanli et al.25 for As, Cd, Hg, and Pb accumulation in Myriophyllum spicatum following the distribution; root > leaf > stem. Roots accumulating the most metal are in line with the results from Alcantara et al.2 after discovering 18.99 mg kg−1 of Au having accumulated primarily on cassava roots. The high Ru concentrations detected in cassava roots are be partly because of the plant's ability to sequestrate metals at root surface tissue with less translocation.26 Metals access root systems through ion channels. Once metal ions enter through ion channels, they become concentrated in roots and unlikely to translocate to aerial shoots of plants. These ions adsorb onto roots and bind to carboxyl groups of carboxylic acids.27 Low translocation of metals to shoots (especially heavy and toxic ones) is a strategy by plants to minimize toxicity by protecting leaves and their photosynthetic machinery from extreme metal stress.2,28 Also, fibrous roots are situated in the soil vicinity from which most metal ions are concentrated; thus, they are better positioned to concentrate more metals than other parts. The higher accumulation of Ru in roots makes cassava a great candidate for the phytostabilization of this metal. However, metal absorption and sequestration mechanisms in biological systems are complex.
After quantitative analysis, roots of both Ru and control samples were calcined at 300 °C for 3 h to produce a Ru-rich carbonaceous material. The produced material was applied directly as a bio-based catalyst in furfural hydrogenation. Highly active metal nanoparticles and metal oxides are often supported on mesoporous compounds or encapsulated in dendrimers. Thus, calcining the roots at an average temperature (300 °C) removed all the volatile organic material to leave a mesh of carbon deposit around the metal as support.20,29 If high temperatures above 300 °C are used for calcination, the carbon vaporizes, and support is lost, leaving pure metal. Pure metals perform poorly in catalysis if unsupported.30 Thus, the temperature and time the material is calcined for determining the size reduction and morphology of the particles produced.31 After calcination, 295 μg g−1 (36.6 μmol) (Table 1) of Ru was determined in the root. The newly elevated metal concentrations calculated are due to the higher mass loss of plant organics during calcination.32–34 The difference can be observed from the TGA stability profiles. Thus, produced bio-based catalysts have been characterized by TEM, SEM-EDS, pXRD, TGA, FTIR spectroscopy, UV-vis spectroscopy and BET to determine physicochemical properties.
3.2. Characterization of Ru@CassCat catalyst
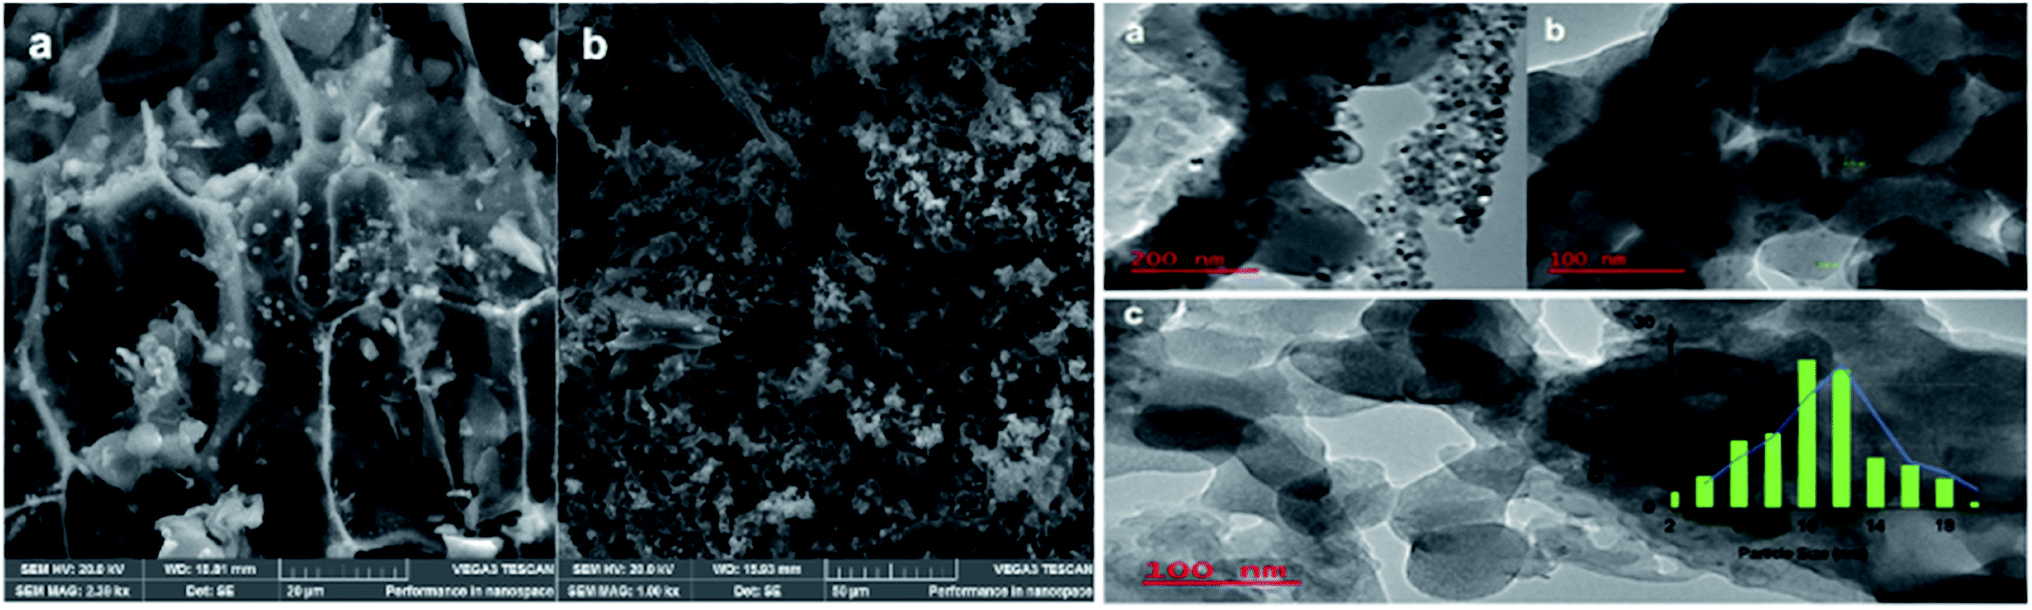 | ||
| Fig. 2 Cassava Ru@CassCat analysis. On the left is an SEM image of [(a) Ru-bio matrix and the (b) control] on the right is a TEM image of (a) Ru-bio matrix at (b) various sizes and the (c) control with an insert of Ru-particle size distribution. | ||
Particle size was estimated using ImageJ software.35 This observation supports BET analysis results where the average pore size was calculated around 15 nm with an average pore size diameter of 10 nm. The TEM images also show particles deposited in and around the carbon support mesh seen as a cloud. These results are consistent with SEM analysis and previous observations reported by Joo et al.36 and Jiang et al.37 Dark regions of aggregated particles are also presumed to have contributed to the slow conversion of furfural compared to catalysts reported by Moyo.22 and Oklu.21 From SEM analysis, a myriad of small spherical particles stuck on support walls are observed in the matrix. The support serves similarly to that in commercial Ru on activated carbon (Ru/C). A few irregularly shaped anisotropic polygons are also observed. This result agrees with spherical Au, and Ag nanomaterials of various sizes and shapes reported by Islam et al.38 synthesized from Prunus armeniaca. Observations from TEM and SEM analyses confirm similar spherical particles dispersed around a cloud of support. The control carbonaceous material showed only a mesh of fibrous carbon structures with no definitive particles. The observed long thin structures are cellulose fibers as characterized by FTIR.
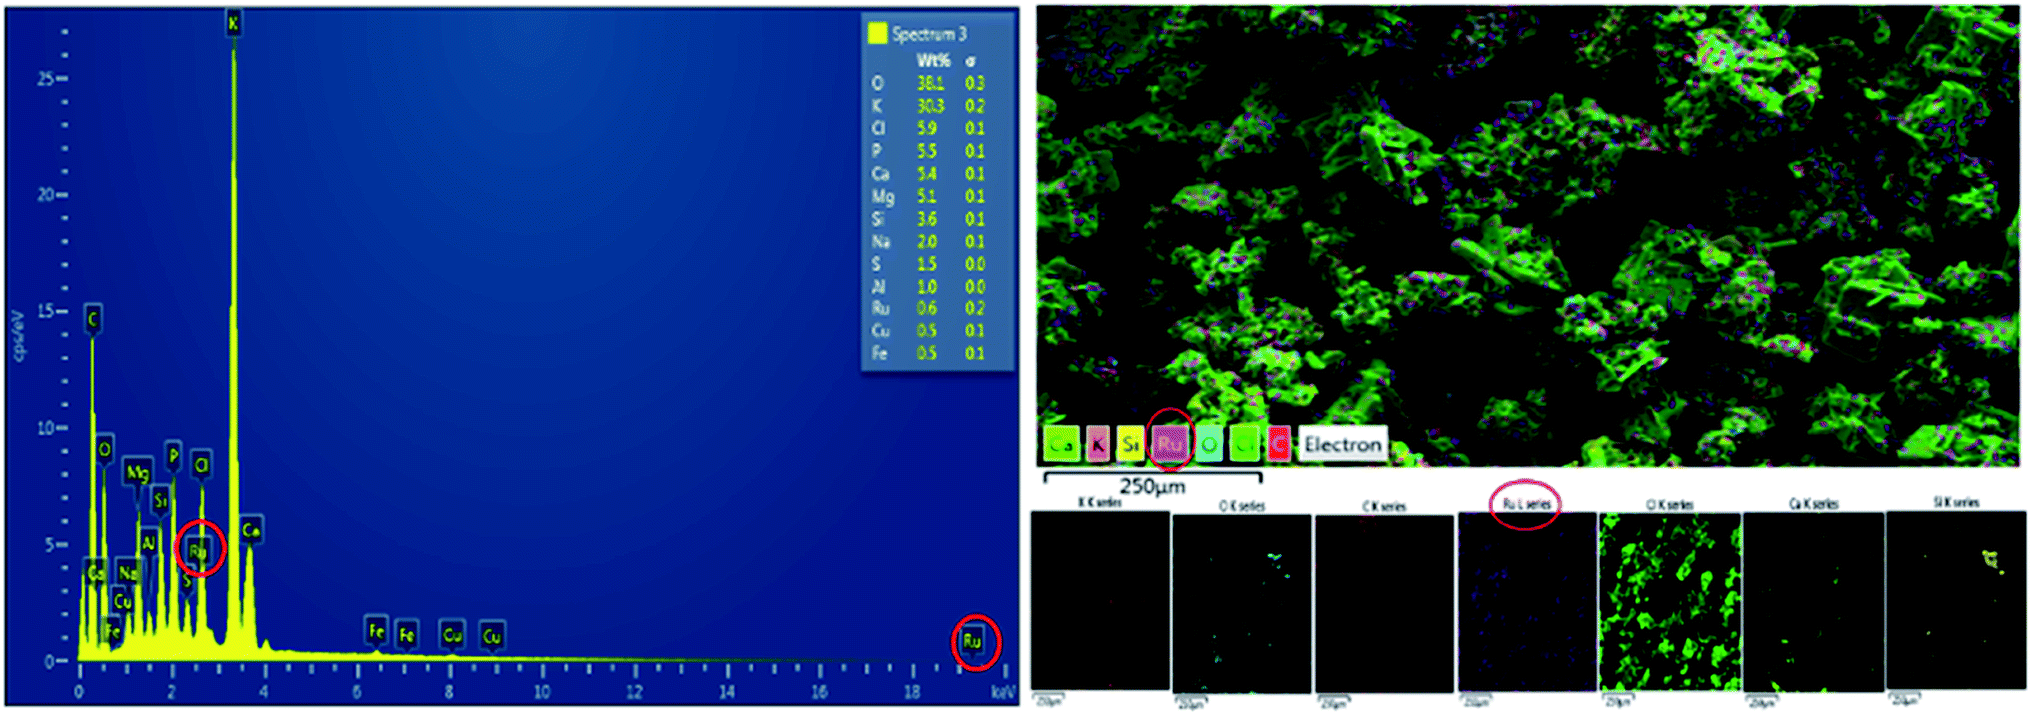 | ||
| Fig. 3 Cassava bio-based material EDS spectrum of ruthenium Ru@CassCat (left) and its elemental maps (right). | ||
Elemental Ru was detected at 0.6 wt%, a low metal content, explaining the longer turnaround time (24 h) observed during complete furfural conversion. The surfaces areas calculated from the BET analysis substantiates this. Only common plant metals observed from EDS spectra of catalyst samples were detected from the EDS spectrum of the control sample (Fig. S2†).
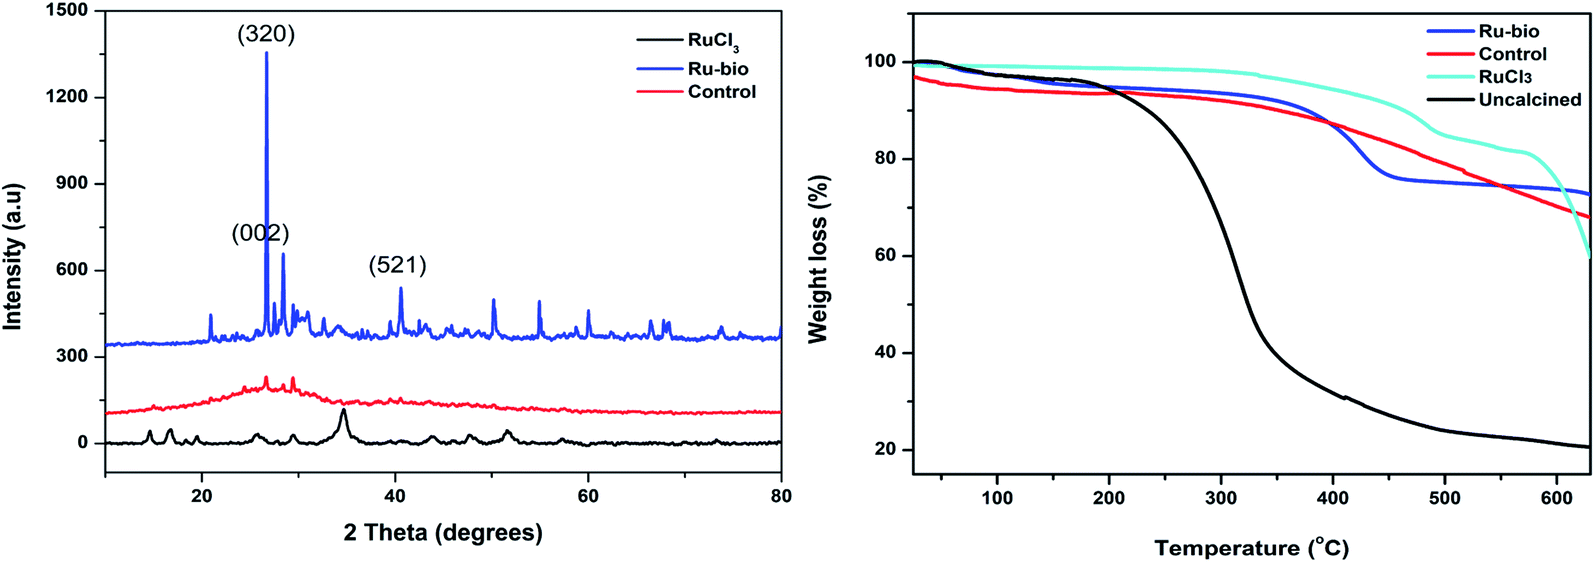 | ||
| Fig. 4 Analysis of ruthenium Ru@CassCat, ruthenium(III) chloride (RuCl3) and the control by powder X-ray diffraction (left) and TGA (right). | ||
Heating profiles of RuCl3 (contamination salt), Ru-based (uncalcined and calcined), and control bio-matrices were recorded to compare thermal stability. Three successive decomposition stages of weight loss were observed in all samples except the uncalcined bio-based material (Fig. 4). The first ∼5% loss observed below 150 °C is attributed to the loss of moisture or water molecules that have adsorbed onto the samples during storage.44,45 The next approximately 22% loss observed, between 200 °C and 475 °C was due to the capping bio-matrices' thermal degradation and loss of support around the metal atoms. A similar observation was46,47 reported by Islam et al.38 From 450–700 °C, the remaining material is completely converted into carbon ash residues through material combustion.44 Close to complete decomposition of the bio-based material above 450 °C means the material can only be used efficiently in heating applications that run below 450 °C. The RuCl3 profile shows that the metal salt underwent the first decomposition stage only after 450 °C showing no moisture and loss of chloride ligands. The uncalcined sample shows about a 55% difference in weight loss compared to the calcined matrix. This huge difference indicates that, during calcining, most organic components are driven off to leave a more stable carbon support around the metal. Loss of organics is observed in the early stages of the heating profiles.
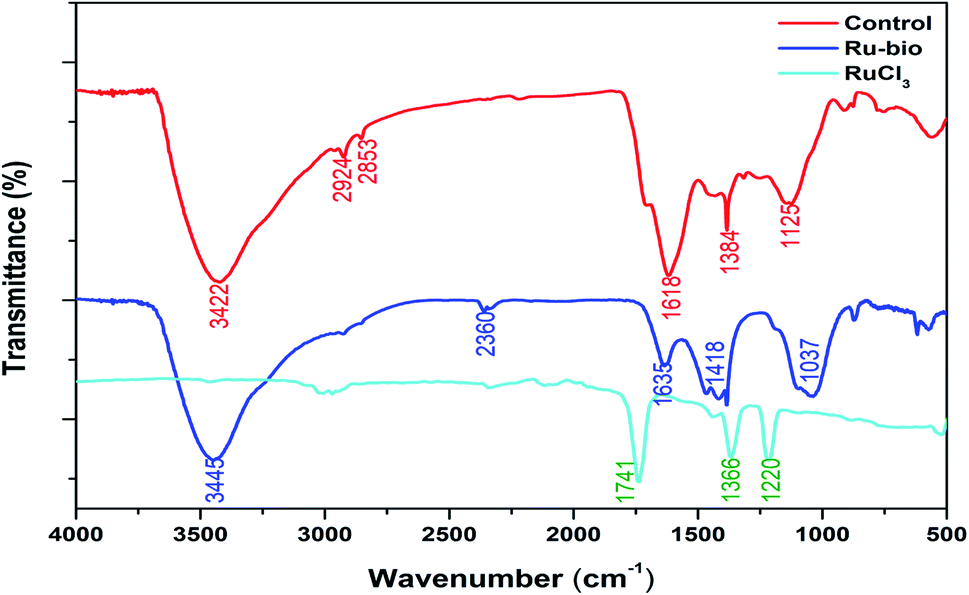 | ||
| Fig. 5 Analysis of ruthenium Ru@CassCat, ruthenium(III) chloride (RuCl3) and the control by FT-IR spectroscopy. | ||
An asymmetric stretching vibration band observed at 2360 cm−1 can be attributed to a C–O stretch from atmospheric CO2.51 Bands around 1418, 1384, and 870 cm−1 have been associated with other plant polysaccharides or cellulose's crystallinity structure and amorphous regions in plant biomass.48 Other peaks in the region 1630–900 cm−1 are attributed to the double bonds C![[double bond, length as m-dash]](https://www.rsc.org/images/entities/char_e001.gif) C, amide –N(H)CO (∼1640–1618 cm−1), –CH, C–O–C (∼1040–1035 cm−1), C–O stretching and bending vibrations in cellulose and other plant constituents.48,52,53 According to Gopinath et al.,39 the peak around 1384 cm−1 is due to an –NO2 stretching frequency. They also reported a low-intensity peak around 500 cm−1, belonging to the metallic Ru or C–H bending. However, the peak may be raised due to reducing Ru(III) ions to their elemental atomic form. As a result, the suggestion by Gopinath et al.39 for the presence of molecules such as polyphenols, flavonoids, terpenoids, amines and amides, being responsible for the reduction and capping of metallic particles in biomass sounds logical. However, functional groups for some of these molecules were not observed in the spectra.
C, amide –N(H)CO (∼1640–1618 cm−1), –CH, C–O–C (∼1040–1035 cm−1), C–O stretching and bending vibrations in cellulose and other plant constituents.48,52,53 According to Gopinath et al.,39 the peak around 1384 cm−1 is due to an –NO2 stretching frequency. They also reported a low-intensity peak around 500 cm−1, belonging to the metallic Ru or C–H bending. However, the peak may be raised due to reducing Ru(III) ions to their elemental atomic form. As a result, the suggestion by Gopinath et al.39 for the presence of molecules such as polyphenols, flavonoids, terpenoids, amines and amides, being responsible for the reduction and capping of metallic particles in biomass sounds logical. However, functional groups for some of these molecules were not observed in the spectra.
Ultraviolet-visible spectroscopy analysis was performed to check for the presence of metallic nanoparticles in the bio-ore. Usually, aqueous solutions of plant material powders rich with metals in their elemental state tend not to show UV absorption peaks after reduction.39,54 From Fig. S3,† RuCl3 shows an absorption maximum at 387 nm and 490 nm. Both peaks indicate Ru(III) species.42,55 The disappearance of the 490 nm peak implies the reduction of Ru(III) to Ru(0) by plant compounds such as flavonoids, terpenoids, phenols, amines, and amides.39 Spectra recorded from the materials solutions also show no peaks indicating that Ru(III) was reduced completely to Ru(0).42 Hou44,54,56 reported a continuous disappearance of previously observed characteristic peaks for Ru(III) species similar to Miyazaki et al.57 on their study of RuCl3 reduction by ethylene glycol. These observations fully substantiate this work's findings that Ru(III) was successfully reduced to its elemental state in the Ru@CassCat. However, the absence of a nanoparticle characteristic peak between 530–580 nm indicates that the material is mainly composed of Ru bulk.
Type V isotherms are observed in hydrophobic microporous and mesoporous adsorbents with adsorbed water due to weaker interactions between the adsorbate and adsorbent. Also, a weak composite H4 type hysteresis loop is observed at low relative pressures (P/P0), approximately 0.45, indicating the coexistence of mesopores and micropores, as also reported by Lou et al.58 Type H4 loops are often characteristic of aggregated crystalline and mesoporous zeolites as observed from pXRD analysis; they exhibit by micro–mesoporous activated carbonaceous materials.59
3.3. Catalytic properties of the Ru@CassCat catalyst in transfer hydrogenation of furfural
Catalytic transfer hydrogenation (CTH) reactions like furfural (Scheme S1†) are mainly known not to occur in the absence of a base. The base decomposes the hydrogen source, e.g., formic acid, to liberate hydrogen used for reduction.8,60,61 Transfer hydrogenation was chosen as an alternative to direct hydrogenation since it uses cheaper and less hazardous reagents than molecular hydrogen (H2) with minimal stoichiometric waste. Also, CTH is simple and safer in operation and does not require high-pressure vessels. A negative control reaction was performed in the absence using conditions adapted from literature.21,22 In the absence of a base, the catalyst performed poorly, with 0% furfural conversion (entry 1, Table 2). However, the conversion increased to 13.2% (entry 2) in the triethylamine (Et3N) base, showing a base's importance in such reactions. Thus, 10 mmol of the base was used in all subsequent reactions.| Entry | Conditiona | Variation | Conv.b (%) | FF (%) Y | FFAc (%) Sel.g | TONd (×104) | TOFe (×103/hr) |
|---|---|---|---|---|---|---|---|
a Conditions: all setups used the conditions listed below unless specified in the table. Furfural (FF) (10 mmol), catalyst (0.00295 wt%), Et3N (10 mmol), formic acid (20 mmol), time (24 h), and temperature (160 °C). iProp = isopropanol, FF (%) Y = furfural percentage yield.b Conv. = conversion.c FFA = furfural alcohol and Cat. = catalyst.d  e e  f FA = formic acid.g Sel. = selectivity. f FA = formic acid.g Sel. = selectivity. |
|||||||
| 1 | Negative control | No base | 0 | 0 | 0 | 0 | 0 |
| 2 | Temperature (°C) | 100 | 13.2 | 12.7 | 100 | 3.5 | 4.7 |
| 3 | 120 | 20.1 | 18.7 | 100 | 5.1 | 6.4 | |
| 4 | 140 | 22.3 | 21.0 | 100 | 5.9 | 7.4 | |
| 5 | 160 | 66.0 | 64.9 | 100 | 9.0 | 11.3 | |
| 6 | Time (hours) | 10 | 34.0 | 34.0 | 100 | 9.1 | 9.1 |
| 7 | 16 | 67.0 | 61.0 | 100 | 20.2 | 12.6 | |
| 8 | 20 | 88.0 | 86.0 | 100 | 18.2 | 9.1 | |
| 9 | 24 | 100.0 | 100.0 | 100 | 27.4 | 11.4 | |
| 10 | Catalyst amount (mg) | 10 | 61.0 | 60.0 | 100 | 16.5 | 6.9 |
| 11 | 20 | 100.0 | 100.0 | 100 | 27.4 | 11.4 | |
| 12 | 30 | 98.0 | 96.0 | 100 | 26.2 | 10.9 | |
| 13 | 40 | 94.0 | 92.0 | 100 | 25.2 | 10.5 | |
| 14 | Base | Et3N | 100.0 | 100.0 | 100 | 27.4 | 11.4 |
| 15 | KOH | 0 | 0 | 0 | 0 | 0 | |
| 16 | Pyridine | 0 | 0 | 0 | 0 | 0 | |
| 17 | DBU | 5.8 | 5.6 | 100 | 1.5 | 0.6 | |
| 18 | Hydrogen source | EtOH | 14.0 | 13.2 | 100 | 3.6 | 1.5 |
| 19 | MeOH | 0 | 0 | 0 | 0 | 0 | |
| 20 | i-Prop | 0 | 0 | 0 | 0 | 0 | |
| 21 | FAf | 100.0 | 100.0 | 100 | 27.4 | 11.4 | |
| 22 | Controls | No catalyst | 55.6 | 55.0 | 100 | 15.2 | 6.3 |
| 23 | Control catalyst | 74.0 | 73.4 | 100 | 20.1 | 25.1 | |
A typical well-labelled spectrum of a product mixture from one of the reaction setup is presented in Fig. S5.† Furfural alcohol is selectively formed as evidenced by the appearance of the new methylene (–CH2) peak at 4.577 ppm. This peak confirmed converting a –CHO aldehyde functional group to a –CH2–OH. The continuous disappearance of the aldehydic proton peak at 9.642 ppm showed progress in furfural conversion. The alcoholic proton (–OH) would appear as a broad shoulder peak at ∼3.0 ppm. This peak has a broad spectrum of appearance due to its intra- and inter-molecular hydrogen bonding involvement.62 Therefore, it can be confirmed that furfural alcohol was indeed formed, and effects of various test conditions were thus optimized.
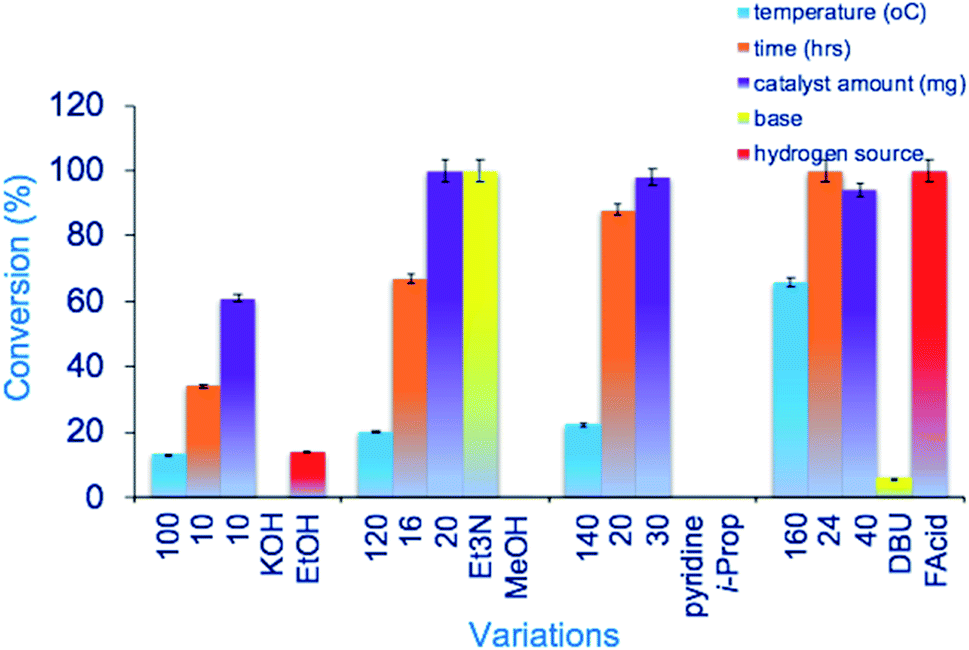 | ||
| Fig. 6 Bar graph showing all the Ru@CassCat catalyst parameter optimizations during the hydrogen transfer reaction of furfural to furfural-alcohol. Conditions: unless specified, FF (10 mmol), CDCl3 (4 mL), FAcid (20 mmol), Et3N (10 mmol), DMF (0.06485 mmol), catalyst (0.00295 wt%), 100 °C, 24 h. | ||
Nanao et al.71 performed a similar reaction of furfural hydrogenation using Pd supported on carbon in ethanol and attained 86.8% conversion to furfural alcohol in 30 min. The 86.8% conversion obtained in such a short time is as a result of using a higher catalyst load (5 wt%), a separate solvent and direct molecular hydrogen (H2) as a source of hydrogen. In this study, formic acid was a limitation as it acted both as a hydrogen source and solvent. In another study, where transfer hydrogenation was performed using formic acid as a hydrogen source, a Cu–Pd/C catalyst showed complete conversion of furfural-to-furfural alcohol with 98.1% selectivity toward furfural alcohol at 170 °C for time (3 h) at minimal catalyst load.72 These results align well with this study's results as 100% selectivity with a complete conversion of furfural was obtained. Additionally, a Rh-doped Ni bio-based catalyst used in the hydrogenation of nitrobenzene to cyclohexylamine showed 100% conversion with a selectivity of 91.6% at 140 °C.73 The similarities in the efficiency of the reported carbon-supported catalysts show that catalysts of this nature are a promising green alternative to conventional catalysts.24,74
Therefore, furfural conversion to-furfural alcohol was enhanced when formic acid was used as a hydrogen source in the presence of Et3N. The optimum temperature was determined to be 160 °C using 20 mg (0.00295 wt%) of catalyst for 24 h. The optimization setups were repeated to check for repeatability and reproducibility of the results. Furthermore, recovering enough material to perform characterization during recycling was a challenge since no defined solid remained even after rotary evaporation of the reaction mixture. It is important to characterize catalysts before and after every recycling stage to determine their property change because of reaction.38 However, most of the catalyst was lost in a homogenous product mixture with every reaction during recycling in this study. Hence, the little catalyst that remained with each cycle was only active up to 3 recycles, as presented in Fig. 7 and could not be harnessed for characterization.
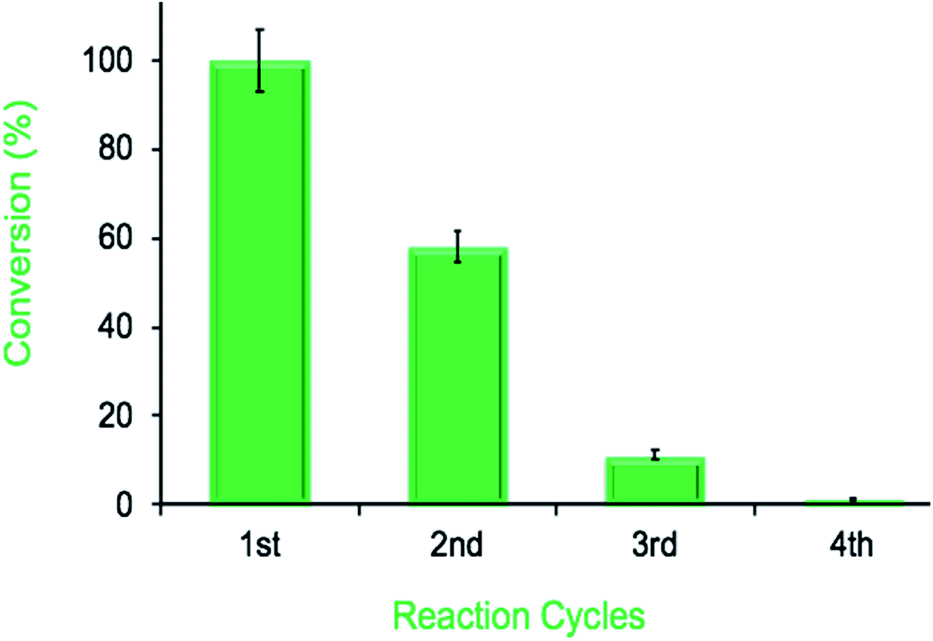 | ||
| Fig. 7 Bar graph showing recycling of the Ru@CassCat catalyst during the hydrogen transfer reaction of furfural to furfural–alcohol. Conditions: unless specified, FF (10 mmol), CDCl3 (4 mL), FAcid (20 mmol), Et3N (10 mmol), DMF (0.06485 mmol), catalyst (0.00295 wt%), 100 °C, 24 h. | ||
4. Conclusions
The ability of cassava plant (Manihot esculenta) to absorb metal ions from soil contaminated with Ru(III) solution has been investigated. It has been demonstrated that cassava plants can be successfully grown in garden potting soils as models of mining tailings to produce a bio-ore with inherent catalytically active sites. Cassava showed an efficient uptake of 295 μg g−1 of Ru detected in roots. Higher accumulation of Ru metal in roots suggests that cassava is an excellent phytostabilizing candidate of this metal than other metals. In 24 h, a 0.00295 wt% of Ru@CassCat resulted in 100% furfural conversion with a turnover frequency of 0.0114 million/hour at 160 °C using triethylamine and formic acid. Selectivity remained 100% toward furfural alcohol. This result renders a highly promising application for the future of this material. Plant-derived metal-rich biomatrix can serve as green sources of active catalysts that can be successfully applied in catalysis. The current study primarily focused on transfer hydrogenation cheaper and less hazardous reagents than molecular hydrogen (H2). Further investigation of direct hydrogenation using molecular hydrogen and the Ru@CassCat catalyst is recommended for comparative studies.Further studies on phytomining of Ru should look into exploring more cyanogenic plants like Macadamia integrifolia. The latter is that are suitable for in-field application and soil-based studies of actual mining tailing samples. The investigation of the effect of various growth conditions such as soil pH, moisture content, salinity, and temperature control on the accumulation of metal in cassava plants is recommended in future studies. Clear knowledge of the mechanism behind uptake, translocation, and reduction of metal ions into elemental atoms in plants should be fully developed. A better understanding of this mechanism can improve controlling metal deposition in plants to produce particles of desirable properties.
Author contributions
Sifelani Dube: writing-original draft, data curation, investigation. Leah C. Matsinha: validation, writing-review and editing. Banothile C. E. Makhubela: supervision, validation, conceptualization, project administration, writing-review and editing. Abayneh A. Ambushe: supervision, validation, project administration, conceptualization, writing-review and editing.Conflicts of interest
The authors declare no conflict of interest.Acknowledgements
This work was supported by the National Research Foundation (NRF) of South Africa (Grant Numbers; MND200630538858, SFH180606341688 and 117989) and the Research Centre for Synthesis and Catalysis, University of Johannesburg, South Africa. The authors acknowledge Spectrum analytical facility at the University of Johannesburg for the instruments used for analysis.References
- U. Okereafor, M. Makhatha, L. Mekuto and V. Mavumengwana, Gold Mine Tailings: A Potential Source of Silica Sand for Glass Making, Minerals, 2020, 10(5), 448 CrossRef CAS
.
- H. J. P. Alcantara, A. I. Doronila and S. D. Kolev, Phytoextraction potential of Manihot esculenta Crantz. (cassava) grown in mercury- and gold-containing biosolids and mine tailings, Miner. Eng., 2017, 114, 57–63 CrossRef CAS
- H. Ali, E. Khan and M. A. Sajad, Phytoremediation of heavy metals—Concepts and applications, Chemosphere, 2013, 91(7), 869–881 CrossRef CAS PubMed
- A. Mahar, P. Wang, A. Ali, M. K. Awasthi, A. H. Lahori and Q. Wang, et al., Challenges and opportunities in the phytoremediation of heavy metals contaminated soils: A review, Ecotoxicol. Environ. Saf., 2016, 126, 111–121 CrossRef CAS PubMed
- G. N. Pujari. Phytomining of Low Grade Ore. Lubumbashi, 2018. Vol. 19 Search PubMed
- V. Sheoran, A. S. Sheoran and P. Poonia, Phytomining: A review, Miner. Eng., 2009, 22(12), 1007–1019 CrossRef CAS
- A. Ali, D. Guo, A. Mahar, W. Ping, F. Wahid and F. Shen, et al., Phytoextraction and the economic perspective of phytomining of heavy metals, Solid Earth Discussions, 2017, 1–40 Search PubMed
- J. Zhang, K. Dong, W. Luo and H. Guan, Selective Transfer Hydrogenation of Furfural into Furfuryl Alcohol on Zr-Containing Catalysts Using Lower Alcohols as Hydrogen Donors, ACS Omega, 2018, 3(6), 6206–6216 CrossRef CAS PubMed
- M. Marmiroli, D. Imperiale, E. Maestri and N. Marmiroli, The response of Populus spp. to cadmium stress: Chemical, morphological and proteomics study, Chemosphere, 2013, 93(7), 1333–1344 CrossRef CAS PubMed
- R. L. Howeler, N. Thomas, K. Holst Sanjuán, K. H. Sanjuán, H. Quirós and J. G. Isebrands, et al., Save and grow: cassava. A guide to sustainable production intensification, Produire plus avec moins, Ahorrar para crecer. 2013 Search PubMed
- N. M. A. Nassar, Wild cassava, Manihot spp.: Biology and potentialities for genetic improvement, Genet. Mol. Biol., 2000, 23(1), 201–212 CrossRef
- H. M. Aquan, Phytoextraction of Palladium and Gold from Broken Hill Gossan, Massey University, 2015 Search PubMed
- G. Mangiapia, G. D'Errico, L. Simeone, C. Irace, A. Radulescu and A. Di Pascale, et al., Ruthenium-based complex nanocarriers for cancer therapy, Biomaterials, 2012, 33(14), 3770–3782 CrossRef CAS PubMed
- B. J. Glaister and G. M. Mudd, The environmental costs of platinum-PGM mining and sustainability: Is the glass half-full or half-empty?, 2010 Search PubMed
- R. H. Grubbs, Olefin-metathesis catalysts for the preparation of molecules and materials (Nobel lecture), in Angewandte Chemie – International Edition, John Wiley & Sons, Ltd, 2006. pp. 3760–3765 Search PubMed
- S. Omar and R. Abu-Reziq, Highly active ruthenium catalyst supported on magnetically separable mesoporous organosilica nanoparticles, Appl. Sci., 2020, 10(17), 5769 CrossRef CAS
- M. Dashtban and A. Technologies, Production of Furfural : Overview and Challenges Production of Furfural : Overview and Challenges, Research Gate, 2015, 2, 44–53 Search PubMed
- A. Fuente-Hernández, R. Lee, N. Béland, I. Zamboni and J. M. Lavoie, Reduction of furfural to furfuryl alcohol in liquid phase over a biochar-supported platinum catalyst, Energies, 2017, 10(3), 1–10 CrossRef
- B. C. Makhubela and J. Darkwa, The role of noble metal catalysts in conversion of biomass and bio-derived intermediates to fuels and chemicals, Johnson Matthey Technol. Rev., 2018, 62(1), 4–31 CrossRef CAS
- H. L. Parker, E. L. Rylott, A. J. Hunt, J. R. Dodson, A. F. Taylor and N. C. Bruce, et al., Supported palladium nanoparticles synthesized by living plants as a catalyst for Suzuki-Miyaura reactions, PLoS One, 2014, 9(1), 1–6 Search PubMed
- N. K. Oklu and B. C. E. Makhubela, Chemoselective and efficient catalytic hydrogenation of furfural by iridium and ruthenium half-sandwich complexes, New J. Chem., 2020, 44(22), 9382–9390 RSC
- P. S. Moyo, L. C. Matsinha and B. C. E. Makhubela, Pd(II) and Pt(II) catalyzed selective synthesis of furfuryl alcohol: Solvent effects and insights into the mechanism, J. Organomet. Chem., 2020, 922, 121362 CrossRef CAS
- H. J. P. Alcantara, F. Jativa, A. I. Doronila, C. W. N. Anderson, R. Siegele and T. G. Spassov, et al., Localization of mercury and gold in cassava (Manihot esculenta Crantz), Environ. Sci. Pollut. Res., 2020, 27(15), 18498–18509 CrossRef CAS PubMed
- B. J. Akinbile, L. C. Matsinha, B. C. Makhubela and A. A. Ambushe, Towards Sustainability Pathway with Bio-Derived Platinum and Palladium Catalyst for Furfural Hydrogenation—A Novel Greener Approach in Catalysis, Minerals, 2021, 11(8), 895 CrossRef CAS
- M. Yabanli, A. Yozukmaz and F. Sel, Heavy metal accumulation in the leaves, stem and root of the invasive submerged macrophyte Myriophyllum spicatum L. (Haloragaceae): An example of Kadi{dotless}n Creek (Mugla, Turkey), Braz. Arch. Biol. Technol., 2014, 57(3), 434–440 CrossRef CAS
- N. C. Sharma, S. V. Sahi, S. Nath, J. G. Parsons, J. L. Gardea-Torresdey and P. Tarasankar, Synthesis of plant-mediated gold nanoparticles and catalytic role of biocarbon-embedded nanomaterials, Environ. Sci. Technol., 2007, 41(14), 5137–5142 CrossRef CAS PubMed
- C. P. Jiménez-Gómez, J. A. Cecilia, D. Durán-Martín, R. Moreno-Tost, J. Santamaría-González and J. Mérida-Robles, et al., Gas-phase hydrogenation of furfural to furfuryl alcohol over Cu/ZnO catalysts, J. Catal., 2016, 336, 107–115 CrossRef
- À. Dago, I. González, C. Ariño, A. Martínez-Coronado, P. Higueras and J. M. Díaz-Cruz, et al., Evaluation of mercury stress in plants from the Almadén mining district by analysis of phytochelatins and their Hg complexes, Environ. Sci. Technol., 2014, 48(11), 6256–6263 CrossRef
- W. Li, Y. Gao, P. Tang, Y. Xu and D. Ma, One-step synthesis of carbon-supported copper nanoparticles from biomass for N-arylation of pyrazole, J. Energy Chem., 2018 1, 27(3), 859–865 Search PubMed
- N. M. Scott, R. Dorta, E. D. Stevens, A. Correa, L. Cavallo and S. P. Nolan, Interaction of a bulky N-heterocyclic carbene ligand with Rh(I) and Ir(I). Double C-H activation and isolation of bare 14-electron Rh(III) and Ir(III) complexes, J. Am. Chem. Soc., 2005, 127(10), 3516–3526 CrossRef CAS PubMed
- A. B. Sifontes, M. Rosales, F. J. Méndez, O. Oviedo and T. Zoltan, Effect of Calcination Temperature on Structural Properties and Photocatalytic Activity of Ceria Nanoparticles Synthesized Employing Chitosan as Template, J. Nanomater., 2013, 2013, 1–9 CrossRef
- S. Gladiali and E. Alberico, Asymmetric transfer hydrogenation: Chiral ligands and applications, Chem. Soc. Rev., 2006, 35(3), 226–236 RSC
- D. E. Salt, R. C. Prince, I. J. Pickering and I. Raskin, Mechanisms of Cadmium Mobility and Accumulation in Indian Mustard, Plant Physiol., 1995, 109(4), 1427–1433 CrossRef CAS PubMed
- F. Liao, Y. Huang, J. Ge, W. Zheng, K. Tedsree and P. Collier, et al., Morphology-dependent interactions of ZnO with Cu nanoparticles at the materials' interface in selective hydrogenation of CO2 to CH3OH, Angew. Chem., Int. Ed., 2011, 50(9), 2162–2165 CrossRef CAS PubMed
- M. D. Abràmoff, P. J. Magalhães and S. J. Ram, Image Processing with ImageJ, in Optical Imaging Techniques in Cell Biology. CRC Press, 2006, pp. 249–258 Search PubMed
- S. H. Joo, J. Y. Park, C.-K. Tsung, Y. Yamada, P. Yang and G. A. Somorjai, Thermally stable Pt/mesoporous silica core–shell nanocatalysts for high-temperature reactions, Nat. Mater., 2009, 8(2), 126–131 CrossRef CAS PubMed
- L. Jiang, A. Hsu, D. Chu and R. Chen, Size-Dependent Activity of Palladium Nanoparticles for Oxygen Electroreduction in Alkaline Solutions, J. Electrochem. Soc., 2009, 156(5), B643 CrossRef CAS
- N. U. Islam, R. Amin, M. Shahid and M. Amin, Gummy gold and silver nanoparticles of apricot (Prunus armeniaca) confer high stability and biological activity, Arabian J. Chem., 2019, 12(8), 3977–3992 CrossRef CAS
- K. Gopinath, V. Karthika, S. Gowri, V. Senthilkumar, S. Kumaresan and A. Arumugam, Antibacterial activity of ruthenium nanoparticles synthesized using Gloriosa superba L. leaf extract, J. Nanostruct. Chem., 2014, 4(1), 83 CrossRef
- A. Dzimitrowicz, P. Jamróz, G. C. diCenzo, I. Sergiel, T. Kozlecki and P. Pohl, Preparation and characterization of gold nanoparticles prepared with aqueous extracts of Lamiaceae plants and the effect of follow-up treatment with atmospheric pressure glow microdischarge, Arabian J. Chem., 2019, 12(8), 4118–4130 CrossRef CAS
- D. K. Belghiti, E. Scorsone, J. de Sanoit and P. Bergonzo, Simultaneous detection of indole and 3-methylindole using boron-doped diamond electrodes, Phys. Status Solidi A, 2016, 213(10), 2662–2671 CrossRef CAS
- P. K. Gupta, K. V. S. Ranganath, N. K. Dubey and L. Mishra, Green Synthesis, Characterization and Biological Activity of Synthesized Ruthenium Nanoparticles using Fishtail Fern, Sago Palm, Rosy Periwinkle and Holy Basil, Curr. Sci., 2019, 117(8), 1308 CrossRef CAS
- D. Philip, C. Unni, S. A. Aromal and V. K. Vidhu, Murraya Koenigii leaf-assisted rapid green synthesis of silver and gold nanoparticles, Spectrochim. Acta, Part A, 2011, 78(2), 899–904 CrossRef PubMed
- B. S. Lou, P. Veerakumar, S. M. Chen, V. Veeramani, R. Madhu and S. B. Liu, Ruthenium nanoparticles decorated curl-like porous carbons for high performance supercapacitors, Sci. Rep., 2016, 6(1), 1–11 CrossRef PubMed
- S. Shikha, S. R. Chaudhuri and M. S. Bhattacharyya, Facile One Pot Greener Synthesis of Sophorolipid Capped Gold Nanoparticles and its Antimicrobial Activity having Special Efficacy Against Gram Negative Vibrio cholerae, Sci. Rep., 2020, 10(1), 1463 CrossRef CAS PubMed
- N. U. Islam, R. Amin, M. Shahid and M. Amin, Gummy gold and silver nanoparticles of apricot (Prunus armeniaca) confer high stability and biological activity, Arabian J. Chem., 2019, 12(8), 3977–3992 CrossRef CAS
- J. Kasthuri, S. Veerapandian and N. Rajendiran, Biological synthesis of silver and gold nanoparticles using apiin as reducing agent, Colloids Surf., B, 2009, 68(1), 55–60 CrossRef CAS PubMed
- V. Hospodarova, E. Singovszka and N. Stevulova, Characterization of Cellulosic Fibers by FTIR Spectroscopy for Their Further Implementation to Building Materials, Am. J. Anal. Chem., 2018, 09(06), 303–310 CrossRef CAS
- M. Poletto, V. Pistor, M. Zeni and A. J. Zattera, Crystalline properties and decomposition kinetics of cellulose fibers in wood pulp obtained by two pulping processes, Polym. Degrad. Stab., 2011, 96(4), 679–685 CrossRef CAS
- M. F. Rosa, E. S. Medeiros, J. A. Malmonge, K. S. Gregorski, D. F. Wood and L. H. C. Mattoso, et al., Cellulose nanowhiskers from coconut husk fibers: Effect of preparation conditions on their thermal and morphological behavior, Carbohydr. Polym., 2010, 81(1), 83–92 CrossRef CAS
- W. Konicki, M. Aleksandrzak, D. Moszyński and E. Mijowska, Adsorption of anionic azo-dyes from aqueous solutions onto graphene oxide: Equilibrium, kinetic and thermodynamic studies, J. Colloid Interface Sci., 2017, 496, 188–200 CrossRef CAS PubMed
- F. Xu, J. Yu, T. Tesso, F. Dowell and D. Wang, Qualitative and quantitative analysis of lignocellulosic biomass using infrared techniques: A mini-review, Applied Energy. Elsevier Ltd, 2013, pp. 801–809. Vol. 104 Search PubMed
- K. Fackler, J. S. Stevanic, T. Ters, B. Hinterstoisser, M. Schwanninger and L. Salmén, FT-IR imaging microscopy to localize and characterize simultaneous and selective white-rot decay within spruce wood cells, Holzforschung, 2011, 65(3), 411–420 CAS
- S. Hou, C. Xie, H. Zhong and S. Yu, Mild water-promoted ruthenium nanoparticles as an efficient catalyst for the preparation of cis-rich pinane, RSC Adv., 2015, 5(109), 89552–89558 RSC
- W.-Y. Jeon, Y.-B. Choi, B.-H. Lee, H.-J. Jo, S.-Y. Jeon and C.-J. Lee, et al., Glucose detection via Ru-mediated catalytic reaction of glucose dehydrogenase, Adv. Mater. Lett., 2018, 9(3), 220–224 CrossRef CAS
- Z. Wang, X. Zhang, X. Liu, M. Lv, K. Yang and J. Meng, Co-gelation synthesis of porous graphitic carbons with high surface area and their applications, Carbon, 2011, 49, 161–169 CrossRef CAS
- A. Miyazaki, I. Balint, K. I. Aika and Y. Nakano, Preparation of Ru nanoparticles supported on γ-Al2O3 and its novel catalytic activity for ammonia synthesis, J. Catal., 2001, 204(2), 364–371 CrossRef CAS
- B. S. Lou, P. Veerakumar, S. M. Chen, V. Veeramani, R. Madhu and S. b. Liu, Ruthenium nanoparticles decorated curl-like porous carbons for high performance supercapacitors, Sci. Rep., 2016, 6, 1–11 CrossRef
- M. Thommes, K. Kaneko, A. V. Neimark, J. P. Olivier, F. Rodriguez-Reinoso and J. Rouquerol, et al., Physisorption of gases, with special reference to the evaluation of surface area and pore size distribution (IUPAC Technical Report), Pure Appl. Chem., 2015, 87(9–10), 1051–1069 CAS
- P. Puthiaraj, K. Kim and W.-S. Ahn, Catalytic transfer hydrogenation of bio-based furfural by palladium supported on nitrogen-doped porous carbon, Catal. Today, 2019, 324, 49–58 CrossRef CAS
- S. E. Clapham, A. Hadzovic and R. H. Morris, Mechanisms of the H2-hydrogenation and transfer hydrogenation of polar bonds catalyzed by ruthenium hydride complexes, Coord. Chem. Rev., 2004, 248(21–24), 2201–2237 CrossRef CAS
- O. Pàmies and J. E. Bäckvall, Studies on the mechanism of metal-catalyzed hydrogen transfer from alcohols to ketones, Chem. –Eur. J., 2001, 7(23), 5052–5058 CrossRef
- W. Strieder and R. Aris, Diffusion Limited Reactions, in Variational Methods Applied to Problems of Diffusion and Reaction, Springer, Berlin, Heidelberg, 1973, pp. 42–58 Search PubMed
- S. Kennepohl, W. Reusch and T. Soderberg, Basicity of Amines, Chem Libretexts, 2020, available from: https://chem.libretexts.org/@go/page/36441 Search PubMed.
- J. Hu, S. Zhang, R. Xiao, X. Jiang, Y. Wang and Y. Sun, et al., Catalytic transfer hydrogenolysis of lignin into monophenols over platinum-rhenium supported on titanium dioxide using isopropanol as in situ hydrogen source, Bioresour. Technol., 2019, 279, 228–233 CrossRef CAS PubMed
- B. Jiang, J. Hu, Y. Qiao, X. Jiang and P. Lu, Depolymerization of Lignin over a Ni-Pd Bimetallic Catalyst Using Isopropanol as an in Situ Hydrogen Source, Energy Fuels, 2019, 33(9), 8786–8793 CrossRef CAS
- G. Huang, L. Wang, H. Luo, S. Shang, B. Chen and S. Gao, et al., Isopropanol as a hydrogen source for single atom cobalt-catalyzed Wacker-type oxidation, Catal.: Sci. Technol., 2020, 10(9), 2769–2773 RSC
- J. Wang, L. Xu, R. Nie, X. Lyu and X. Lu, Bifunctional CuNi/CoOx catalyst for mild temperature in situ hydrodeoxygenation of fatty acids to alkanes using isopropanol as hydrogen source, Fuel, 2020, 265, 116913 CrossRef CAS
- C. Cheng, P. Li, W. Yu, D. Shen and S. Gu, Catalytic hydrogenolysis of lignin in ethanol/isopropanol over an activated carbon supported nickel-copper catalyst, Bioresour. Technol., 2021, 319, 124238 CrossRef CAS PubMed
- K. Ken Ostrikov, Y. Li, R. Zhou, F. Qi, D. Zhou and R. Zhou, et al., Plasma-enabled liquid ethanol conversion for hydrogen production: Discharge characteristics and process control, J. Phys. D: Appl. Phys., 2020, 53(17), 174001 CrossRef
- H. Nanao, Y. Murakami, O. Sato, A. Yamaguchi, N. Hiyoshi and M. Shirai, Furfuryl Alcohol and Furfural Hydrogenation over Activated Carbon–supported Palladium Catalyst in Presence of Water and Carbon Dioxide, ChemistrySelect, 2017, 2(8), 2471–2475 CrossRef CAS
- J. Du, J. Zhang, Y. Sun, W. Jia, Z. Si and H. Gao, et al., Catalytic transfer hydrogenation of biomass-derived furfural to furfuryl alcohol over in situ prepared nano Cu-Pd/C catalyst using formic acid as hydrogen source, J. Catal., 2018, 368, 69–78 CrossRef CAS
- X. Lu, Y. Chen, Z. Zhao, H. Deng, D. Zhou and C. Wei, et al., Highly selective one-step hydrogenation of nitrobenzene to cyclohexyl, RSC Adv., 2016, 6(19), 15354–15361 RSC
- A. Kumar, V. Goyal, N. Sarki, B. Singh, A. Ray and T. Bhaskar, et al., Biocarbon supported nanoscale ruthenium oxide-based catalyst for clean hydrogenation of arenes and heteroarenes, ACS Sustainable Chem. Eng., 2020, 8(41), 15740–15754 CrossRef CAS
Footnote |
| † Electronic supplementary information (ESI) available: Detailed experimental materials and methods, additional instrumental operating conditions (ICP-MS and Microwave acid digestion system), characterization methods (EDS for control), ICP-MS calibration curve, schemes, and other NMR data. See DOI: 10.1039/d1ra06647a |
| This journal is © The Royal Society of Chemistry 2022 |