 Open Access Article
meta-Terphenyls as versatile fluorescent molecular sensors for monitoring the progress of hybrid polymerization processes
Wiktoria
Tomal
a,
Patryk
Szymaszek
a,
Magdalena
Bilut
a,
Roman
Popielarz
 *a,
Tomasz
Świergosz†
 b and
Joanna
Ortyl
 *a
*a
aDepartment of Biotechnology and Physical Chemistry, Faculty of Chemical Engineering and Technology, Cracow University of Technology, Warszawska 24, 31 155 Kraków, Poland. E-mail: jortyl@pk.edu.pl; rpopiel@pk.edu.pl
bDepartment of Chemical Technology and Environmental Analysis, Faculty of Chemical Engineering and Technology, Cracow University of Technology, Warszawska 24, 31 155 Kraków, Poland
First published on 25th July 2022
Abstract
Herein, the performance of a series of 2-amino-4,6-diphenylbenzene-1,3-dicarbonitrile derivatives in the role of fluorescent molecular sensors for monitoring progress of various photopolymerization processes by the Fluorescence Probe Technique (FPT) has been evaluated. It was found that all of the derivatives studied, except for the one containing a nitro substituent in its structure, showed high enough sensitivity and stability to be applied as versatile sensors for both cationic and free-radical polymerization processes. Next, the applicability of the sensors was applied for study of hybrid polymerization processes (i.e., both cationic and free radical polymerization reactions occurring simultaneously). The hybrid photopolymerization of pure glycidyl methacrylate (GlyMA) and the mixtures of GlyMA with 3,4-epoxycyclohexylmethyl 3,4-epoxy-cyclohexanecarboxylate (CADE), or CADE with trimethylolpropane triacrylate (TMPTA) was studied. It was found that during the hybrid photopolymerization of CADE/TMPTA mixtures, each monomer polymerized independently to form an interpenetrated polymer network (IPN). On the other hand, hybrid photopolymerization of GlyMA/CADE mixtures leads to a copolymer, where final functional group conversions are higher than those achievable by the corresponding photopolymerizations of pure GlyMA and CADE monomers. The use of m-terphenyl sensors allows for real-time monitoring of various hybrid polymerization processes and provides key information on the processes, which was not previously possible.
Introduction
Polymers have conquered not only the chemical market but also other sectors, such as biomedicine, allowing development of engineering materials for fabrication of artificial tissues,1,2 protective coatings,3,4 or materials for targeted drug delivery applications.5,6 Various methods are used for polymer production. One of the most modern methods of polymer synthesis is photopolymerization.7–10 The light-induced polymerization processes are highly-efficient, fast, solvent-free and economical.11–14 Due to numerous advantages, photopolymerization is used in polymer coating industry,15 and for solvent-free paints,16 varnishes17 and adhesives,18 as well as in graphics industry.19,20 Moreover, the photopolymerization processes have been used in 3D printing technology and microelectronics for encapsulation of integrated circuits.21–30For a photopolymerization process to be efficient and the polymeric product having desired properties, it is necessary to control the photopolymerization course, preferably on-line (i.e., directly during the reaction) or the process parameters need to be optimized. For this purpose, various techniques for monitoring the progress of the photopolymerization processes, such as Real Time Fourier-Transform Infrared Spectroscopy (RT-FTIR), Photo-Differential Scanning Calorimetry (Photo-DSC) and the Fluorescence Probe Technique (FPT) have been developed. In particular, the FPT has gained a lot of attention, because of its simplicity and versatility in both on-line and off-line uses.31–34 In polymer chemistry, the FPT is employed to monitor the progress of polymerization and photopolymerization processes, as well as to control the quality of raw materials used for fabrication of polymers, including the parameters of the final products.35,36 Moreover, this method can be employed to evaluate the kinetics of polymerization processes and to assess quantitatively the efficiency of various photoinitiators in order to optimize the photopolymerization process.37 Comparing these methods, photo-DSC and photo-FTIR provide information about the direct changes that occur in the monomer/monomer mixture during photopolymerization processes, while the FPT gives direct information about the sensor behavior in a given process caused by changes in the reaction environment. These techniques are thus complementary.
The FPT is based on the measurement of changes in the fluorescence characteristics of an appropriate fluorescent sensor (also called a probe), added at a small concentration to the reaction medium. During the polymerization progress, the sensor changes its fluorescence38,39 or absorbance40 characteristics as a result of the changes of the system viscosity41–43 or polarity.44,45 Thus, the quanta of light emitted by the probe molecules carry information about the changes that occur during the reaction.46–48 Several different types of fluorescent probes have been developed so far to monitor the polymerization processes. Any process that causes changes in the polarity or microviscosity of the system can be monitored by the FPT, but depending on the nature of the changes, an appropriate selection of the sensor with good sensitivity and emission quantum efficiency is necessary. The limited versatility of already known fluorescent probes makes it still crucial to search for new, more versatile molecules that could be employed as molecular sensors to monitor cationic, free radical and hybrid polymerization processes with the same sensor.
In this paper, we report the applicability of 2-amino-4,6-diphenyl-benzene-1,3-dicarbonitrile derivatives as versatile fluorescent molecular sensors for monitoring both cationic and free-radical polymerization processes of various monomers by the Fluorescence Probe Technique (FPT). Moreover, the performance of those sensors in monitoring the progress of example hybrid photopolymerization processes has been evaluated.
Experimental procedures
Materials
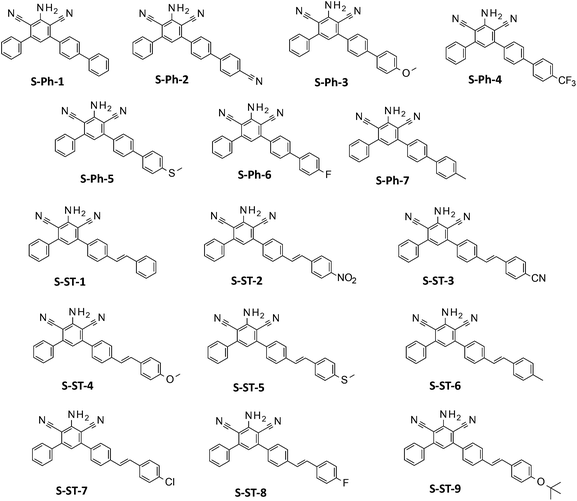
Two groups of meta-terphenyl derivatives based on a 2-amino-4,6-diphenyl-benzene-1,3-dicarbonitrile core (Fig. 1) have been evaluated for their suitability as fluorescent molecular sensors for monitoring photopolymerization processes by the FPT. The sensors in the first group, labelled with an S-Ph prefix, contained an additional substituted phenyl ring at the para-position of one of the phenyl rings of the core. These were: 2-amino-4-phenyl-6-(4-phenylphenyl)benzene-1,3-dicarbonitrile (S-Ph-1), 2-amino-4-[4-(4-cyanophenyl)phenyl]-6-phenyl-benzene-1,3-dicarbonitrile (S-Ph-2), 2-amino-4-[4-(4-methoxyphenyl)phenyl]-6-phenyl-benzene-1,3-dicarbonitrile (S-Ph-3), 2-amino-4-phenyl-6-[4-[4-(trifluoromethyl)phenyl]phenyl]benzene-1,3-dicarbonitrile (S-Ph-4), 2-amino-4-[4-(4-methylsulfanylphenyl)phenyl]-6-phenyl-benzene-1,3-dicarbonitrile (S-Ph-5), 2-amino-4-[4-(4-fluorophenyl)phenyl]-6-phenyl-benzene-1,3-dicarbonitrile (S-Ph-6), and 2-amino-4-[4-(4-methylphenyl)phenyl]-6-phenyl-benzene-1,3-dicarbonitrile (S-Ph-7).The second group, labelled with an S-ST prefix, was composed of the sensors, where an appropriately substituted styryl group was attached in place of the additional phenyl ring, so that the phenyl ring was separated with an additional double bond from the m-terphenyl core. This series consisted of the following derivatives: 2-amino-4-phenyl-6-[4-[(E)-styryl]phenyl]benzene-1,3-dicarbonitrile (S-ST-1), 2-amino-4-[4-[(E)-2-(4-nitrophenyl)vinyl]phenyl]-6-phenyl-benzene-1,3-dicarbonitrile (S-ST-2), 2-amino-4-[4-[(E)-2-(4-cyanophenyl)vinyl]phenyl]-6-phenyl-benzene-1,3-dicarbonitrile (S-ST-3), 2-amino-4-[4-[(E)-2-(4-methoxyphenyl)vinyl]phenyl]-6-phenyl-benzene-1,3-dicarbonitrile (S-ST-4), 2-amino-4-[4-[(E)-2-(4-methylsulfanylphenyl)vinyl]phenyl]-6-phenyl-benzene-1,3-dicarbonitrile (S-ST-5), 2-amino-4-[4-[(E)-2-(4-methylphenyl)vinyl]phenyl]-6-phenyl-benzene-1,3-dicarbonitrile (S-ST-6), 2-amino-4-[4-[(E)-2-(4-chlorophenyl)vinyl]phenyl]-6-phenyl-benzene-1,3-dicarbonitrile (S-ST-7), 2-amino-4-[4-[(E)-2-(4-fluorophenyl)vinyl]-phenyl]-6-phenyl-benzene-1,3-dicarbonitrile (S-ST-8) and 2-amino-4-[4-[(E)-2-(4-tert-butoxyphenyl)vinyl]phenyl]-6-phenyl-benzene-1,3-dicarbonitrile (S-ST-9). Structures of the sensors studied are shown in Fig. 1, while their synthesis and 13C-NMR, 1H-NMR and LC-MS analyses were reported in a previous paper.49
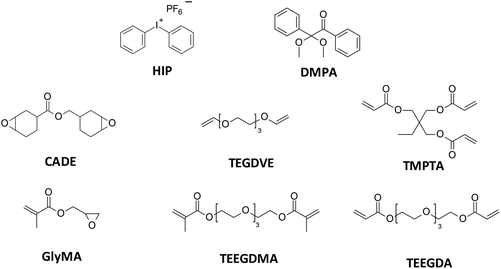
Commercially available diphenyliodonium hexafluorophosphate (HIP, Alfa Aesar, Haverhill, MA, USA) and 2,2-dimethoxy-2-phenylacetophenone (DMPA, Sigma Aldrich, Hamburg, Germany) were used as the cationic and free-radical photoinitiators, respectively. For cationic photopolymerization, standard monomers such as 3,4-epoxycyclohexylmethyl 3,4-epoxy-cyclohexanecarboxylate (CADE, Lambson Ltd, Wetherby, UK) and triethylene glycol divinyl ether (TEGDVE, Sigma Aldrich) were used, while for free-radical photopolymerization tetraethylene glycol dimethacrylate (TEEGDMA, Sigma Aldrich) and tetraethylene glycol diacrylate (TEEGDA, Sigma Aldrich) were used. The performance of the sensors studied in the following other monomers or monomer mixtures was also verified: trimethylolpropane triacrylate (TMPTA, Sigma Aldrich) and glycidyl methacrylate (GlyMA, Sigma Aldrich). The structures of the materials used in this study are shown in Fig. 2.
Absorbance measurements
The absorption spectra were obtained using an EPP2000C spectrometer (StellarNet, Inc., Tampa, FL, USA) with the spectral range 190–850 nm and a broadband deuterium-halogen lamp, emitting in the range of 190–2500 nm. The measurements were carried out in a quartz cuvette with a 1.0 cm optical path at room temperature. The absorbance values were converted to molar extinction coefficients, expressed in the units [dm3 mol−1 cm−1].Fluorescence measurements
Fluorescence spectra of the sensors studied in different solvents were obtained using the same EPP2000C spectrometer, but in combination with a UV LED and an appropriate adapter. The following UV LEDs were used as the excitation light sources: UV-LED-320 emitting at λmax = 320 nm (UVTOP315-BL-TO39, Roithner Laser Technik GmbH, Austria) and a UV-LED emitting at λmax = 365 nm (Amecam, Warsaw, Poland). The fluorescence spectra were recorded at room temperature (25 °C). All the solvents were of spectroscopic purity.FPT measurements
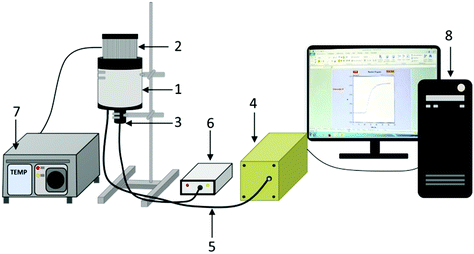
 | (1) |
Additionally, in order to compare quantitatively how the nature and position of the substituents in the probe structure affect the sensitivity of these systems, the relative sensitivity (S) parameter was defined by eqn (2):
 | (2) |
Results and discussion
Fluorophores suitable for application as fluorescent molecular sensors have to have appropriate spectral characteristics. In particular, such fluorophores have to exhibit high enough fluorescence intensity at low concentrations, so that the sensor concentration can be maintained as low as possible, while still enabling recording noise-free fluorescence spectra, and the fluorophores have to be very sensitive to minute changes of medium polarity. Both these features depend on the core fluorophore structure and on the type of substituent. Hence, first the basic spectroscopic properties of the fluorophores studied were investigated.The influence of the chemical structure on absorption and emission characteristics
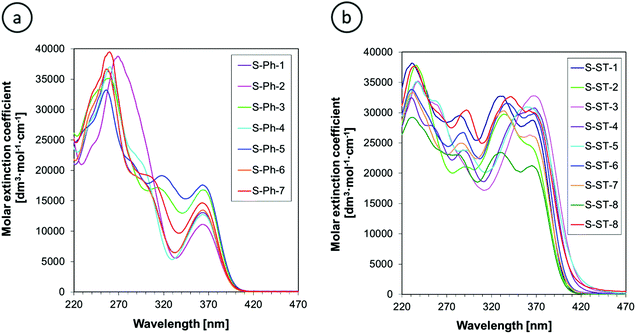
The UV-Vis absorption spectra of 2-amino-4,6-diphenyl-benzene-1,3-dicarbonitrile derivatives in acetonitrile are presented in Fig. 4. The phenyl-substituted derivatives (S-Ph series) exhibit a long-wavelength absorption band in the range of 340–400 nm, whereas the absorption of styryl-substituted derivatives (S-ST series) is slightly shifted towards longer wavelengths and reaches up to about 450 nm. In addition, the styryl derivatives exhibit a molar extinction coefficient of the long-wavelength absorption band about twice higher than that of the phenyl-substituted derivatives. The observed differences in light absorption between the S-Ph and S-ST series result from more extended conjugation in the latter series due to the presence of an additional double bond.Quantitative parameters of the absorption spectra are summarized in Table 1. The absorption maximum of the long-wavelength band of the derivatives studied is not affected by the substituents, which is particularly visible in the case of the S-Ph series, where the long-wavelength band is well separated from adjacent absorption bands (Fig. 4a). The absorption maximum of that band for all of the derivatives studied is very close to the emission maximum of easily available commercial UV LEDs, emitting maximum light intensity at 365 nm. This makes those LEDs a good choice as the excitation light sources to maximize the fluorescence intensity of the sensors studied. However, these sensors can be excited also by any other UV light sources emitting at shorter wavelength than the λmax-ab, because their minimal extinction coefficient at the shorter wavelengths is only less than two-times lower than that at the λmax-ab (Fig. 4).
| Sensor | Substituent |
λ
max-ab![[thin space (1/6-em)]](https://www.rsc.org/images/entities/char_2009.gif) a [nm] a [nm] |
ε @λmax-ab [dm3 mol−1 cm−1] | λ max-fl [nm] | I max-fl [a.u.] (λexc = 320 nm) | I max-fl [a.u.] (λexc = 365 nm) |
|---|---|---|---|---|---|---|
| a Absorption maximum of the long-wavelength absorption band. | ||||||
| S-Ph-1 | H | 363 | 13![[thin space (1/6-em)]](https://www.rsc.org/images/entities/char_2009.gif) 000 000 |
427 | 1488 | 1252 |
| S-Ph-2 | CN | 363 | 11![[thin space (1/6-em)]](https://www.rsc.org/images/entities/char_2009.gif) 100 100 |
431 | 1633 | 1147 |
| S-Ph-3 | OMe | 363 | 16![[thin space (1/6-em)]](https://www.rsc.org/images/entities/char_2009.gif) 800 800 |
434 | 1684 | 1295 |
| S-Ph-4 | CF3 | 363 | 12![[thin space (1/6-em)]](https://www.rsc.org/images/entities/char_2009.gif) 700 700 |
429 | 1120 | 1170 |
| S-Ph-5 | SMe | 363 | 17![[thin space (1/6-em)]](https://www.rsc.org/images/entities/char_2009.gif) 600 600 |
506 | 1483 | 1385 |
| S-Ph-6 | F | 363 | 13![[thin space (1/6-em)]](https://www.rsc.org/images/entities/char_2009.gif) 500 500 |
427 | 1480 | 1407 |
| S-Ph-7 | Me | 362 | 14![[thin space (1/6-em)]](https://www.rsc.org/images/entities/char_2009.gif) 600 600 |
426 | 1820 | 1720 |
| S-ST-1 | H | 365 | 28![[thin space (1/6-em)]](https://www.rsc.org/images/entities/char_2009.gif) 800 800 |
437 | 2323 | 1823 |
| S-ST-2 | NO2 | — | — | — | 25 | 115 |
| S-ST-3 | CN | 360 | 32![[thin space (1/6-em)]](https://www.rsc.org/images/entities/char_2009.gif) 700 700 |
433 | 1905 | 1846 |
| S-ST-4 | OMe | 368 | 30![[thin space (1/6-em)]](https://www.rsc.org/images/entities/char_2009.gif) 800 800 |
531 | 1231 | 1707 |
| S-ST-5 | SMe | 360 | 31![[thin space (1/6-em)]](https://www.rsc.org/images/entities/char_2009.gif) 000 000 |
537 | 892 | 1226 |
| S-ST-6 | Me | 365 | 29![[thin space (1/6-em)]](https://www.rsc.org/images/entities/char_2009.gif) 900 900 |
493 | 2377 | 2177 |
| S-ST-7 | Cl | 360 | 26![[thin space (1/6-em)]](https://www.rsc.org/images/entities/char_2009.gif) 300 300 |
435 | 2080 | 1787 |
| S-ST-8 | F | 365 | 21![[thin space (1/6-em)]](https://www.rsc.org/images/entities/char_2009.gif) 200 200 |
437 | 1857 | 1666 |
| S-ST-9 | OCMe3 | 360 | 30![[thin space (1/6-em)]](https://www.rsc.org/images/entities/char_2009.gif) 400 400 |
538 | 966 | 930 |
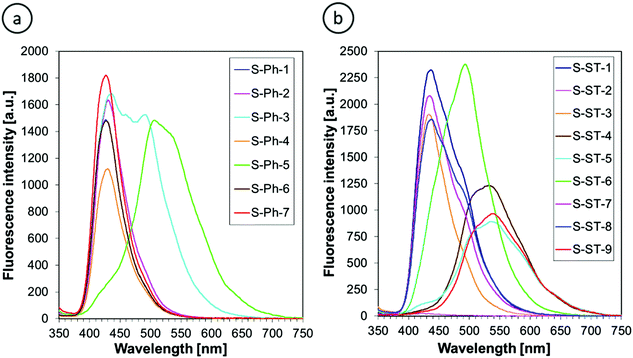
Fluorescence spectra of the 2-amino-4,6-diphenyl-benzene-1,3-dicarbonitrile derivatives were measured at two excitation wavelengths λexc = 320 nm and λexc = 365 nm in acetonitrile to compare the advantages and disadvantages of using the particular excitation wavelengths. The fluorescence spectra obtained upon excitation at 320 nm are shown in Fig. 5. The fluorescence spectra recorded at 365 nm excitation had the same shape, but different fluorescence intensity due to different extinction coefficients at the longer excitation wavelength. The fluorescence intensities at different excitation wavelengths but at the same fluorophore concentration are compared in Table 1.
Fig. 5 indicates that all of the derivatives studied, except for S-ST-2, exhibit high enough fluorescence efficiency to record noise-free fluorescence spectra at short data acquisition times, which is important for fluorescent sensors. The derivative S-ST-2 contains a nitro group in its structure. If a nitro group is not conjugated with a strongly electron-donating substituent to enable intramolecular charge transfer in the excited state, the presence of the nitro group in a fluorophore quenches its fluorescence. Consequently, S-ST-2 showed very weak fluorescence and it can be eliminated from the list of candidates for the sensor applications.
The fluorescence peak positions of the m-terphenyls studied appear in the range 390–700 nm (Fig. 5). The fluorescence spectra are much more affected by the substituents than the corresponding absorption spectra. Unsubstituted derivatives (i.e., S-Ph-1 and S-ST-1) and those containing electron-withdrawing substituents (i.e., S-Ph-2, S-Ph-4, S-Ph-6, S-ST-3, S-ST-7 and S-ST-8) emit in the same range of 390–550 nm with the maximum intensity at 429 ± 2 nm for the S-Ph series and 435 ± 2 nm for the S-ST series. On the other hand, electron-donating substituents, such as methoxy (OMe), t-butoxy (OCMe3), methylsulfanyl (SMe) and methyl (Me) groups shifted the fluorescence spectra to longer wavelengths by several dozen nanometers (Table 1). This can be attributed to a push–pull effect in the excited state between the electron-donating substituents on the phenyl or styryl ring and the electron-withdrawing cyano group at position 1 of the pyridine ring. Strong electron delocalization along the conjugated system in the excited state stabilizes the excited state and lowers its energy, which results in the strong fluorescence spectral shift to longer wavelengths.
Fluorescence intensity is also affected by the type of substituent, but to a lesser extent than the fluorescence peak position. Among the sensors studied (i.e., while neglecting the nitro derivative S-ST-2, which does not qualify for the role of a sensor), S-ST-6 showed the highest fluorescence intensity, while the lowest intensity, observed for S-ST-5 (at 320 nm excitation) or S-ST-9 (at 365 excitation), was only about 2.5-times lower (Table 1).
Finally, comparison of the fluorescence intensities at different excitation wavelengths confirms that in the case of the derivatives studied, the choice of the excitation wavelength is not critical, because the fluorescence intensities measured for the same compounds at 320 nm and 365 nm excitation are similar (Table 1). Hence, for practical applications a 320 nm UV LED will be better as the excitation light source, because we noticed that in the case of a 365 nm LED, the excitation light scattered by the sample slightly overlapped with the fluorescence spectra at the short wavelength side.
The performance of the sensors studied in polymerizing media
 | ||
| Fig. 6 Changes of the emission spectra of (a) S-Ph-1 and (b) S-ST-1 upon cationic photopolymerization of the TEGDVE monomer. | ||
| Sensor | Substituent | λ max-b [nm] | I max-b [a.u.] | λ max-a [nm] | I max-a [a.u.] | Δλmax [nm] | S [%] | ΔI/Ib [%] |
|---|---|---|---|---|---|---|---|---|
| Indexes “b” and “a” denote the data before polymerization and after polymerization, respectively; Δλmax is the shift of the fluorescence spectrum upon monomer polymerization (Δλmax = λmax-a − λmax-b), S is the sensor sensitivity defined by eqn (2), and ΔI/Ib is the corresponding relative change of fluorescence intensity in [%] (ΔI/Ib = (Imax-a − Imax-b)/Imax-b × 100%). | ||||||||
| S-Ph-1 | H | 432 | 1426 | 420 | 1752 | −12 | 169 | 23 |
| S-Ph-2 | CN | 437 | 1109 | 425 | 1580 | −12 | 219 | 42 |
| S-Ph-3 | OMe | 433 | 1775 | 420 | 2044 | −13 | 179 | 15 |
| S-Ph-4 | CF3 | 435 | 1091 | 421 | 1493 | −14 | 184 | 37 |
| S-Ph-5 | SMe | 493 | 1402 | 425 | 2087 | −67 | 1440 | 49 |
| S-Ph-6 | F | 432 | 1498 | 419 | 1892 | −13 | 174 | 26 |
| S-Ph-7 | Me | 432 | 1733 | 419 | 2048 | −12 | 166 | 18 |
| S-ST-1 | H | 436 | 1984 | 427 | 2038 | −9 | 183 | 3 |
| S-ST-2 | NO2 | 434 | 44 | 434 | 249 | — | — | 466 |
| S-ST-3 | CN | 440 | 2616 | 428 | 2846 | −12 | 230 | 9 |
| S-ST-4 | OMe | 501 | 2357 | 440 | 2264 | −60 | 546 | 4 |
| S-ST-5 | SMe | 501 | 1783 | 461 | 1917 | −39 | 515 | 7 |
| S-ST-6 | Me | 453 | 2722 | 430 | 3115 | −23 | 563 | 14 |
| S-ST-7 | Cl | 438 | 3360 | 429 | 3435 | −8 | 169 | 2 |
| S-ST-8 | F | 437 | 3191 | 427 | 3165 | −9 | 198 | 1 |
| S-ST-9 | OCMe3 | 501 | 2111 | 440 | 1828 | −61 | 537 | 13 |
| 25ST | (Reference) | 440 | 785 | 433 | 844 | −7 | 159 | 8 |
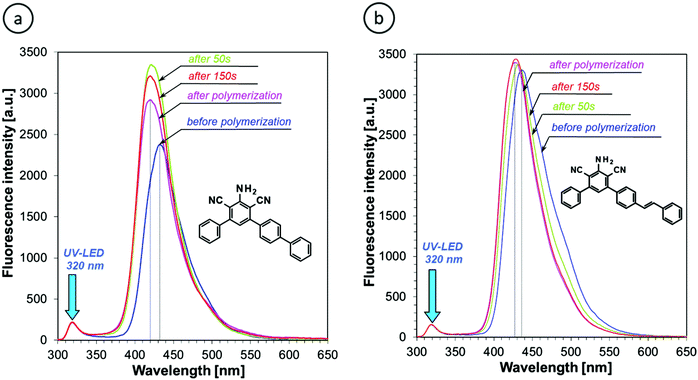
The fluorescence spectra of all of the derivatives studied, except for S-ST-2, shifted towards shorter wavelengths (Fig. 6 and Table 2). The largest shift was observed for SMe-substituted sensors in both sensor series, and the alkoxy-substituted sensors in the S-ST series (Table 2). Hence, the derivatives substituted with the electron-donating substituents show the highest sensitivity to polarity changes occurring during cationic photopolymerization of the TEGDVE monomer. This is consistent with the push–pull effect discussed in the previous section and indicates that strong electron delocalization in the excited state is critical for high sensitivity of a sensor to polarity changes. Nevertheless, all of the derivatives studied (i.e., except for S-ST-2) shifted their fluorescence spectrum more than the 25ST reference, which so far has been used as one of the few sensors known, suitable to study cationic photopolymerization processes. This means that all of the m-terphenyls studied show high enough sensitivity to be used as sensors for the cationic polymerization processes.
The fluorescence intensity of the sensors studied, measured at the peak maximum, was only slightly affected by the monomer polymerization (i.e., by less than 50%, except for S-ST-2, Table 2). For most of the sensors, the fluorescence intensity increased. This is a typical behavior of fluorescent molecular sensors in polymerizing media, which comes from the fact that upon rigidification of the sensor environment, the radiationless excitation energy dissipation into vibrational energy levels of the molecule becomes less efficient due to the inhibition of molecule free movements. Interestingly, the S-ST-2 derivative that showed too low fluorescence intensity in acetonitrile and in a liquid TEGDVE monomer to be useful as a sensor at low monomer conversions increased the fluorescence intensity more than 4-times upon monomer polymerization. This means that the fluorescence intensity of S-ST-2 is highly sensitive to changes of medium microviscosity, while being little affected by changes of the medium polarity. Hence, the nitro-substituted derivative (S-ST-2) may be considered for application as a sensor of minute changes in polymer rigidity, occurring in the final stages of polymerization processes, or for example upon polymer aging.
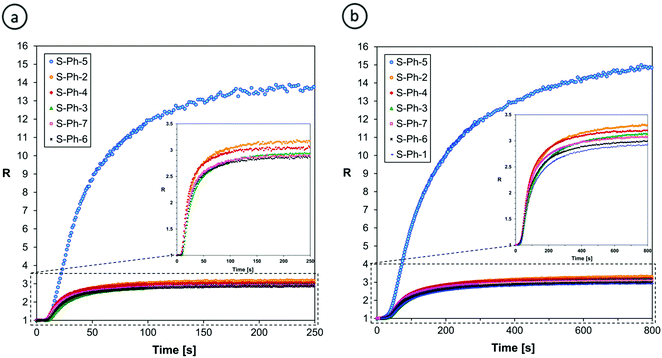
Either the fluorescence spectrum shift or changes of the fluorescence intensity can be used for monitoring the progress of polymerization processes. For the purpose of this research, we selected the ratio method, defined in the Experimental section, because it is more accurate and independent of geometrical measurement parameters. Fig. 7 shows the photo-polymerization profiles, obtained by FPT using the sensors studied.
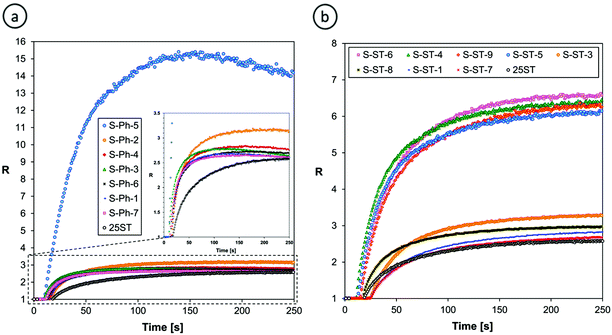 | ||
| Fig. 7 Monitoring the progress of cationic photopolymerization of the TEGDVE monomer using (a) S-Ph and (b) S-ST series of the sensors studied. | ||
Fig. 7 confirms that the sensors that showed the highest shift of their fluorescence spectrum upon TEGDVE polymerization (Table 2) also showed the highest ratio span between the unpolymerized and polymerized states of the monomer. However, the ratio span is large enough for all of the sensors studied to be measured precisely and it is even higher than that of the 25ST reference probe. Hence, where sensitivity is concerned, all of the derivatives studied (i.e., except for S-ST-2) are sensitive enough to be used as fluorescent molecular sensors for monitoring the progress of cationic polymerization processes by FPT, using the fluorescence intensity ratio (R) as the progress indicator. However, a closer look at Fig. 7a reveals that some of the sensors in the S-Ph series have limitations. That is, the sensors in this series showed a slight decrease of the ratio (R) upon prolonged irradiation. This does not mean that the degree of monomer polymerization decreased; it is just an artifact resulting from slow photolysis of the sensor. When one of the photolysis products is fluorescent and emits at a longer wavelength than the sensor itself, an overlap of the fluorescence spectrum of the side product with the spectrum of the sensor at the long wavelength side causes an apparent increase of the intensity I(λ2) that results in a gradual decrease of the ratio (R) in time, when the polymerization is over. Interestingly, in the case of the S-ST series of sensors no disturbance of the curing profiles was observed (Fig. 7b). Therefore, the S-Ph series of sensors will be more suitable for monitoring rapid cationic polymerization processes, where the sensor photolysis effect is negligible, while the S-ST series can be expected to be suitable also for slowly polymerizing systems.
| Sensor | Substituent | λ max-b [nm] | I max-b [a.u.] | λ max-a [nm] | I max-a [a.u.] | Δλmax [nm] | S [%] | ΔI/Ib [%] |
|---|---|---|---|---|---|---|---|---|
| Free-radical photopolymerization of TEEGDA | ||||||||
| S-Ph-1 | H | 431 | 3734 | 418 | 1976 | −13 | 135 | −47 |
| S-Ph-2 | CN | 435 | 3220 | 422 | 2182 | −14 | 216 | −32 |
| S-Ph-3 | OMe | 432 | 3749 | 420 | 2930 | −12 | 194 | −22 |
| S-Ph-4 | CF3 | 435 | 2242 | 421 | 1703 | −14 | 203 | −24 |
| S-Ph-5 | SMe | 490 | 2568 | 424 | 3163 | −66 | 1260 | 23 |
| S-Ph-6 | F | 432 | 2922 | 419 | 2346 | −13 | 187 | −20 |
| S-Ph-7 | Me | 431 | 2525 | 418 | 1844 | −13 | 189 | −27 |
| Free-radical photopolymerization of TEEGDMA | ||||||||
| S-Ph-1 | H | 431 | 2094 | 418 | 1533 | −14 | 192 | −27 |
| S-Ph-2 | CN | 436 | 3202 | 422 | 2330 | −14 | 230 | −27 |
| S-Ph-3 | OMe | 431 | 3991 | 419 | 2758 | −12 | 214 | −31 |
| S-Ph-4 | CF3 | 435 | 2816 | 420 | 1579 | −15 | 220 | −44 |
| S-Ph-5 | SMe | 440 | 4125 | 421 | 3752 | −19 | 1390 | −9 |
| S-Ph-6 | F | 432 | 2414 | 418 | 1425 | −14 | 199 | −41 |
| S-Ph-7 | Me | 431 | 3194 | 417 | 1991 | −15 | 207 | −38 |
Fig. 8 indicates that all of the S-Ph sensors perform well in monitoring the progress of free radical polymerization processes. Regular photopolymerization profiles have been obtained without any artefacts, even though in the case of free radical polymerization, the fluorescence intensity of the sensors studied slightly decreased (except for S-Ph-5), probably due to some side reaction of the sensors with the free radicals involved in the polymerization process (Table 3). The diacrylate monomer (TEEGDA) polymerized faster than the dimethacrylate monomer (TEEGDMA), as indicated by about three times shorter irradiation time required to reach a plateau in the curing profiles of TEEGDA compared to those of TEEGDMA (Fig. 8). This comes from a lower propagation rate constant of the addition of methacrylate functional groups to growing macroradicals, compared to the addition of acrylates, due to higher steric hindrance in the case of tertiary methacrylate-terminated macroradicals, compared to secondary acrylate-terminated macroradicals.
The relative increase of the fluorescence intensity ratio upon monomer polymerization, defined as the sensor sensitivity (S) by eqn (2), exceeded 100%, which is high enough to measure the progress of free radical polymerization precisely (Table 3). The sensor S-Ph-5, containing a methylsulfanyl substituent, is exceptional in the S-Ph series. Its sensitivity to changes in its environment during free radical polymerization of monomers is much higher than the sensitivity of the other sensors. This means that the S-Ph-5 sensor can be used in cases where extremely high sensitivity is required, for example, for tracing postcure processes occurring in the dark after photopolymerization, or changes occurring in polymers upon aging. In these applications, using the fluorescence intensity ratio (R) as an indicator of the changes is an additional advantage of the S-Ph-5 sensor, compared to S-ST-2, because the ratio R does not depend on the geometrical factors of the sample, so the sample may be moved between consecutive long-term measurements. Moreover, R does not depend on the changes of excitation light intensity that may cause errors in measurements. However, in the case of monitoring the entire polymerization processes starting from a monomer and ending in a polymer, too high sensor sensitivity is not necessarily an advantage, because when the fluorescence spectrum of a sensor shifts too much, the intensity at the shorter wavelength may pass through a maximum and start decreasing before the polymerization is complete. Then the relationship between the fluorescence intensity ratio (R) and the functional group conversion may become highly non-linear, which may complicate the interpretation of the curing profiles.
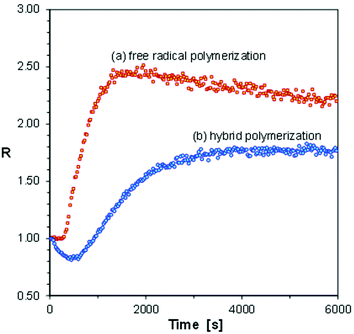
Glycidyl methacrylate (GlyMA, Fig. 2) is a bifunctional monomer containing an epoxy group capable of cationic (but not free radical) polymerization, and a methacrylate group capable of free radical (but not cationic) polymerization. Depending on the initiator type, different linear polymer structures can be obtained from the same GlyMA monomer. Moreover, when both cationic and free radical initiators are used simultaneously, or when initiating radicals and cations are generated simultaneously from the same initiator, a hybrid polymerization is possible, where a crosslinked three-dimensional polymer network can be obtained by two parallel mechanisms. Hence, from the same GlyMA monomer three different polymers of different properties can be synthesized. On the other hand, it is well known that diaryliodonium and triarylsulfonium photoinitiators are capable of initiation of both free radical and cationic polymerization processes. So, first we selected a GlyMA monomer in combination with different photoinitiators to test whether the m-terphenyl derivatives would distinguish between purely free radical and hybrid photopolymerization processes. The sensor S-Ph-1 was selected for that purpose. The results are shown in Fig. 9.
Fig. 9 indicates that the free radical polymerization of the GlyMA monomer, initiated with a typical free radical photoinitiator, 2,2-dimethoxy-2-phenylacetophenone, was faster than the corresponding hybrid photopolymerization, initiated with diphenyliodonium hexafluorophosphate, at the same molar concentration of the photoinitiators. This comes from the higher extinction coefficient of the former photoinitiator than that of the latter one at the excitation wavelength. However, in the case of free radical polymerization of GlyMA, a regular curing profile was obtained, while in the case of the hybrid photopolymerization, the fluorescence intensity ratio (R) of the S-Ph-1 sensor initially went down to reach a minimum and then increased to a plateau when the polymerization was over (Fig. 9). Moreover, a characteristic short induction period was observed in the case of free radical polymerization, while in the case of hybrid polymerization the ratio changes started immediately after starting irradiation with UV light. This indicates that in the case of the diphenyliodonium photoinitiator, the cationic polymerization of the epoxy groups of GlyMA started immediately, causing an initial decrease of the ratio (R), while the free radical polymerization started later on, when the traces of inhibitors present in the monomer (including dissolved oxygen) were used up. As the ratio span caused by free radical polymerization is much higher than that caused by cationic polymerization, after the free radical polymerization induction period, both polymerization types occurred in parallel, but the ratio change was dominated by the ratio increase caused by the free radical polymerization. For example, the fluorescence spectrum of the S-Ph-1 sensor would slightly shift towards longer wavelengths, causing a decrease of the fluorescence intensity ratio during the initial purely cationic polymerization period, where the free radical polymerization mode was yet inhibited. What is noteworthy is that the ratio span between the minimum and maximum values is higher in the case of purely free radical polymerization of GlyMA than that achieved in the case of hybrid polymerization (Fig. 9). This can be explained by the fact that there is only one methacrylic group per GlyMA molecule. Hence, purely free radical polymerization of the GlyMA monomer leads to a linear polymer that can be called glycidyl poly(methacrylate), where the polymerized methacrylic groups form the polymer main chain, while the glycidyl groups are pending. Monofunctional monomers can be polymerized with even up to 100% monomer conversion. On the other hand, in the case of hybrid polymerization, GlyMA behaves as a bifunctional monomer that forms a crosslinked poly(glycidyl methacrylate) polymer network, where glycidyl poly(methacrylate) chains are crosslinked with poly(glycidyl) methacrylate segments (or vice versa). Bifunctional monomers never polymerize to 100% conversion of the functional groups, unless the groups are separated by a long flexible spacer. Similar hybrid photopolymerization of the GlyMA monomer, but initiated with triarylsulfonium salts, was reported previously by Abadie et al.54
A second example of hybrid polymerization is a simultaneous polymerization of a mixture of a multifunctional monomer, polymerizable only by free radical polymerization, with another multifunctional monomer, polymerizable only by a cationic polymerization mechanism. Such hybrid polymerization leads to interpenetrating polymer networks (IPN), where one crosslinked polymer network, formed by one polymerization mechanism, is incorporated within another polymer network formed by another polymerization mechanism, while the component networks are not linked together by chemical bonds. We selected trimethylolpropane triacrylate (TMPTA) as the free radical monomer and 3,4-epoxycyclohexylmethyl 3,4-epoxy-cyclohexanecarboxylate (CADE) as the monomer polymerizing only by cationic polymerization. Diphenyliodonium hexafluorophosphate (HIP) was selected as the photoinitiator, because it generates both free radical and cationic species capable of simultaneous initiation of free radical and cationic polymerization processes upon irradiation with 320 nm (or shorter) wavelengths of UV light.
Fig. 10 shows the photopolymerization profiles obtained by FPT, using the S-Ph-1 sensor, at various contents of TMPTA in TMPTA/CADE monomer mixtures. Comparison of the profiles obtained for pure CADE and pure TMPTA monomers indicates that the S-Ph-1 sensor is much less sensitive to changes occurring during cationic polymerization of CADE than those occurring during free radical polymerization of TMPTA. However, the ratio span between the cured and uncured states of CADE is still large enough to be monitored by FPT. The ratio span of the TMPTA/CADE mixtures between the cured and uncured states increased with an increase of the TMPTA content. This indicates that also the contents of poly(TMPTA) in the interpenetrating network increased proportionally and confirms that the free radical and cationic photopolymerization processes occurred simultaneously, though not necessarily at the same rate.
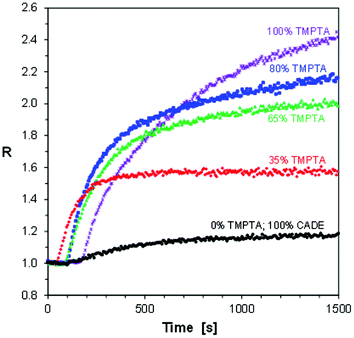 | ||
| Fig. 10 Progress of hybrid photopolymerization of TMPTA/CADE compositions at various contents of TMPTA monomer (expressed in % by weight), monitored by FPT, using S-Ph-1 as the fluorescent sensor. | ||
In order to take a closer look at the composition of the IPN polymer after photopolymerization, in Fig. 11 we have plotted the final fluorescence intensity ratio (Rmax), corresponding to 1500 s of irradiation time, as a function of the volume fraction of TMPTA in the TMPTA/CADE monomer mixtures.
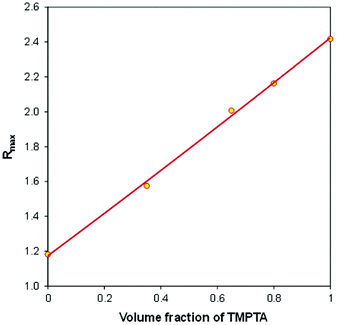 | ||
| Fig. 11 The relationship between the final fluorescence intensity ratio (Rmax), achieved after photopolymerization, and the initial composition of a TMPTA/CADE monomer mixture. | ||
It can be noticed that in the case of the TMPTA/CADE system the Rmax is linearly proportional to the volume fraction of TMPTA in the monomer mixture. The relationship can be described by the following eqn (3):
 | (3) |
The linearity of the relationship between the fluorescence intensity ratio (Rmax) and the mixture composition proves that each monomer polymerized independently of the other one. Moreover, it means that during the hybrid polymerization of TMPTA/CADE mixtures, each monomer polymerized with the same conversion as it would in its pure form, causing an overall change of the medium micropolarity proportional to its content. If it was not so and if, for example, in the mixture, one of the monomers polymerized with higher conversion than in its pure state, the contribution of that monomer to the overall polarity change of the mixture would be higher and the relationship would not be linear.
The third example of the hybrid polymerization we decided to study by the FPT, using S-Ph-1 as an example versatile sensor, was the most complex one. It was a hybrid copolymerization of the CADE monomer with glycidyl methacrylate (GlyMA). Both monomers contain epoxy groups capable of undergoing cationic polymerization or copolymerization, while the GlyMA monomer additionally contains a methacrylic group capable of free radical polymerization. The epoxy groups in CADE are more strained due to their location directly on the cyclohexane rings (Fig. 2). Therefore, the CADE monomer usually polymerizes faster by cationic polymerization than any epoxy monomer based on glycidyl functionalities. However, the reactivity difference between the epoxy groups in CADE and GlyMA is not as high as, for example, between epoxy groups and vinyl ether groups to prevent their cationic copolymerization. Hence, one can expect that the hybrid copolymerization of CADE/GlyMA mixtures will form a peculiar polymer network, composed of a crosslinked poly(CADE-co-Gly) methacrylate backbone, formed by the cationic copolymerization, additionally crosslinked with poly(methacrylate) segments, formed by free radical polymerization of the methacrylic groups. So, it was interesting to see whether any valuable information about the hybrid copolymerization reaction can be deduced from FPT results. The photopolymerization profiles obtained for different compositions of CADE/GlyMA mixtures (expressed in % by weight) are shown in Fig. 12.
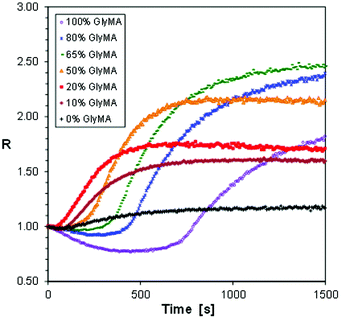 | ||
| Fig. 12 Photopolymerization profiles of CADE/GlyMA monomer mixtures, initiated with diphenyliodonium haxafluorophosphate under 320 nm UV light. | ||
The hybrid photopolymerization of CADE/GlyMA monomer mixtures behaves differently from that of CADE/TMPTA. At high GlyMA contents (i.e., 65% and 80% of GlyMA), the curing profiles showed a period below the initial R value, characteristic of hybrid polymerization of the pure GlyMA monomer (Fig. 9). However, the magnitude of the R values that was below the initial value quickly decreased with the increase of CADE contents, and at about 1![[thin space (1/6-em)]](https://www.rsc.org/images/entities/char_2009.gif) :
:![[thin space (1/6-em)]](https://www.rsc.org/images/entities/char_2009.gif) 1 mass ratio of GlyMA/CADE (i.e., at 50% of GlyMA that corresponds to about 64 mol% of GlyMA), only values above the initial value are observed. This indicates that rapid cationic copolymerization of the CADE monomer with glycidyl groups of GlyMA started at the initial stages of the hybrid copolymerization, before the large ratio increase caused by free radical polymerization of methacrylic groups of GlyMA started dominating. The final ratio (Rmax), achieved after 1500 s of the photopolymerization, initially increased with the increase of GlyMA contents, reached a maximum at about 65% of GlyMA and then slightly decreased (Fig. 12). This means that the overall conversions of both epoxy and methacrylic groups in the copolymers were higher than those in the corresponding homopolymers.
1 mass ratio of GlyMA/CADE (i.e., at 50% of GlyMA that corresponds to about 64 mol% of GlyMA), only values above the initial value are observed. This indicates that rapid cationic copolymerization of the CADE monomer with glycidyl groups of GlyMA started at the initial stages of the hybrid copolymerization, before the large ratio increase caused by free radical polymerization of methacrylic groups of GlyMA started dominating. The final ratio (Rmax), achieved after 1500 s of the photopolymerization, initially increased with the increase of GlyMA contents, reached a maximum at about 65% of GlyMA and then slightly decreased (Fig. 12). This means that the overall conversions of both epoxy and methacrylic groups in the copolymers were higher than those in the corresponding homopolymers.
Fig. 13 shows the relationship between the final ratio (Rmax) and the GlyMA contents in CADE/GlyMA mixtures, in the same coordinate system as that used previously for the TMPTA/CADE compositions. In the case of CADE/GlyMA the relationship is not linear. The broken line in Fig. 13 represents the ratio (Rmax) that would be achieved if the CADE and GlyMA monomers polymerized independently, as in the case of TMPTA/CADE compositions. Higher Rmax ratios achieved after photopolymerization of CADE/GlyMA mixtures than those calculated from eqn (3) indicate that higher overall conversions of the reactive functional groups present in monomers (i.e., both the epoxy and methacrylic groups) were achieved in the case of mixtures compared to the homopolymerization of pure monomers. This is an important observation, because it is well known that multifunctional monomers do not polymerize with 100% conversion of reactive functional groups. Residues of non-polymerized functional groups may cause problems, in particular in the case of photocurable polymer coatings. For example, unsaturated bonds, left in a polymer coating after polymerization, decrease stain resistance of the coating, because double bonds are more polar and show stronger interaction with environmental contaminants (including dyes) than saturated bonds formed upon polymerization. On the other hand, when residual double bonds in a polymer coating are located at alpha-positions relative to some carbons attached to hydrogen atoms (e.g., to methyl, methylene or methine groups), the coating becomes susceptible to allylic oxidation in air, which causes faster aging of the coating and lowers its durability.
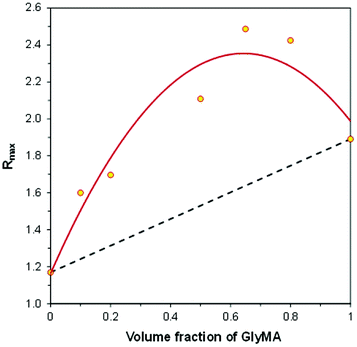 | ||
| Fig. 13 The relationship between the final fluorescence intensity ratio (Rmax), achieved after hybrid photopolymerization and the initial composition of the GlyMA/CADE monomer mixture. | ||
The linearity of the relationship shown in Fig. 11 and strong deviation from linearity observed in Fig. 13 also shed light on how fluorescent molecular sensors respond to changes occurring in their environment during hybrid polymerization processes. That is, what is measured by the FPT and indicated by the change of the fluorescence intensity ratio (ΔR) is the average polarity change that contains contributions resulting from the polymerization of particular types of functional groups. Dipole–dipole interactions that are responsible for the shift of the sensor fluorescence spectrum along the wavelength scale are very short-range interactions, because it is well known that the dipole–dipole interaction energy is inversely proportional to the third power of the distance between interacting dipoles and quickly decays to zero with the distance increase. A single excited sensor molecule may sense no more than one (or possibly maximum two) closest dipoles or polarized bonds. If it is assumed that the sensor molecules are distributed uniformly within the entire volume of the material, some sensor molecules are located in the vicinity of one type of functional group, while the other ones are located in the vicinity of other types of functional groups in monomers or polymer. Hence, what is observed as the sensor response is the average response from the entire population of the sensor molecules interacting with different functional groups. In such cases, the relative sensor response (ΔR), measured as the ratio increase (or decrease), relative to its initial value before polymerization (i.e., ΔR = R − Rb), is the volume average of the relative responses of the sensor molecules to conversions of different types of functional groups located in their vicinity, proportionally to the monomer contents, which in the case of a two-monomer system can be expressed by eqn (4).
| ΔR = ΔR1·φ1 + ΔR2·φ2 | (4) |
There is some evidence that when the monitoring wavelengths used in the FPT for measurement of the ratio (R) are selected so as to correspond to half height of the fluorescence spectrum of a sensor, then the relationship between the ratio (R) and conversion of reacting functional groups is linear.29 Then the ratio change induced by the polymerization of each particular functional group (ΔRi, i = 1 or 2) can be expressed by eqn (5):
| ΔRi = ΔRi(100%)·αi | (5) |
| ΔR = ΔR1(100%)α1φ1 + ΔR2(100%)α2φ2 | (6) |
It has to be pointed out that only in the case where the particular functional group conversions (αi) in the monomer mixture are the same as the corresponding conversions achieved in pure monomers upon monomer polymerization under identical polymerization conditions, the relationship represented by eqn (6) is linear relative to the volume fraction of one of the components, as observed in the case of the TMPTA/CADE system. In fact, when it is noticed that the relationships between the variables in eqn (6) and those in eqn (3) are represented by eqn (7)–(11), substitution of eqn (7)–(11) to eqn (6) leads to theoretical derivation of eqn (3) that was found experimentally.
| ΔR = Rmax − 1 | (7) |
| ΔR1(100%)α1 = Rmax\_pureTMPTA − 1 | (8) |
| ΔR2(100%)α2 = Rmax\_pureCADE − 1 | (9) |
| φ1 = φTMPTA | (10) |
| φ2 = 1 − φTMPTA | (11) |
On the other hand, the high nonlinearity observed in the case of the GlyMA/CADE system (Fig. 13) may be explained by the fact that when functional groups present in different monomers (e.g., glycidyl groups in GlyMA and epoxycyclohexyl groups in CADE) copolymerize with each other, the kinetics of the copolymerization is different from the kinetics of particular homopolymerizations of pure monomers. Then the functional group conversions (i.e., α1 and α2), achieved upon homopolymerization of pure monomers, are not the same as the corresponding conversions achieved in the monomer mixtures under identical polymerization conditions. Consequently, the overall polarity change caused by the polymerization of particular functional groups in the GlyMA/CADE monomer mixtures is different from that achieved in the case of pure monomers and ΔR does not follow the linear relationship analogical to eqn (3). Moreover, in the case of the GlyMA/CADE system, the situation is further complicated, because in hybrid polymerization it behaves as a ternary system, where three different functional groups (i.e., glycidyl, epoxycyclohexyl and methacrylic) participate in the hybrid photopolymerization, so a third component would have to be added to eqn (6).
Conclusions
The meta-terphenyl derivatives reported in this paper can be applied as versatile fluorescent molecular sensors for monitoring the progress of free radical, cationic and hybrid polymerization processes by the FPT. The versatility of these sensors enables monitoring the progress of hybrid polymerization processes that was not possible with traditional fluorescent probes suitable only for one type of polymerization. All of the sensors (except for S-ST-2) exhibit high enough sensitivity and stability in polymerizing media to measure the polymerization progress precisely, using the fluorescence intensity ratio (R) as the progress indicator.Among the sensors studied, the S-Ph-5 sensor, containing a methylsulfanyl group in its structure, shows extremely high sensitivity to polarity changes occurring during cationic and free radical polymerization of monomers. In the case of cationic polymerization, the m-terphenyl derivatives containing electron-donating substituents at a conjugated position relative to one of the cyano groups present in their structure show higher sensitivity than those containing electron-withdrawing groups. The push–pull effect between electron-donating and electron-withdrawing substituents in the sensor structure, which increases the dipole moment of the sensor's excited state, also increases the sensor's sensitivity to polarity changes in its environment.
When diphenyliodonium hexafluorophosphate is used as a photoinitiator, glycidyl methacrylate (GlyMA) undergoes hybrid polymerization (i.e., both cationic and free radical polymerization simultaneously). In the presence of a 2,2-dimethoxy-2-phenylacetophenone photoinitiator only free radical polymerization of the methacrylic groups of GlyMA occurs.
Hybrid photopolymerization of TMPTA/CADE mixtures induced by diphenyliodonium hexafluorophosphate leads to an ideal interpenetrating network, where the poly(TMPTA) network is formed by the free radical polymerization mechanism, while a poly(CADE) network is formed by cationic polymerization. During the hybrid polymerization of TMPTA/CADE mixtures, each monomer polymerizes independently and reaches the same final conversion as that achieved during the polymerization of the pure monomer. This leads to a linear relationship between the final fluorescence intensity ratio of a sensor and the volume fraction of one of the monomers in the mixture.
Hybrid photopolymerization of GlyMA/CADE mixtures leads to a crosslinked copolymer, where glycidyl groups of GlyMA are copolymerized with epoxycyclohexyl groups of CADE by cationic copolymerization, while methacrylic groups present in GlyMA form additional crosslinks by free radical polymerization. The overall final functional group conversions in the GlyMA/CADE copolymer are higher than the conversions achieved in the corresponding homopolymerization processes.
Photopolymerization profiles, obtained by the FPT using the sensors studied, show the difference between different types of polymerization processes involved in the hybrid polymerization of monomers. The implementation of the proposed fluorescent molecular sensors may be useful for the monitoring and control of complex processes such as the formation of interpenetrating polymer networks (IPNs) or copolymerizations involved in new applications, such as 3D printing.
Author contributions
Conceptualization, J. Ortyl and R. Popielarz; software, R. Popielarz; investigation, M. Bilut and W. Tomal; data curation, W. Tomal, P. Szymaszek, and R. Popielarz; writing—original draft preparation, W. Tomal, R. Popielarz., P. Szymaszek and T. Świergorz; writing—review and editing, W. Tomal, R. Popielarz, and J. Ortyl; supervision, J. Ortyl; funding acquisition, J. Ortyl and W. Tomal.Conflicts of interest
There are no conflicts to declare.Acknowledgements
This research was funded by the Foundation for Polish Science (Warsaw Poland) – TEAM TECH project Grant No. TEAM TECH/2016-2/15 (POIR.04.04.00-00-204B/16-00). The project: “WAY TO EXCELLENCE – a comprehensive university support program” implemented under the Operational Program Knowledge Education Development 2014-2020 co-financed by the European Social Fund WND-POWR.03.05.00-00-Z214/18 funded the publication of this manuscript in open access resources.Notes and references
- V. Perez-Puyana, M. Jiménez-Rosado, A. Romero and A. Guerrero, Polymer, 2020, 12, 1566 CAS.
- E. Barrett-Catton, M. L. Ross and P. Asuri, Polymer, 2021, 13, 856 CAS.
- K. Szczepanowicz, T. Kruk, W. Świątek, A. M. Bouzga, C. R. Simon and P. Warszyński, Colloids Surf., B, 2018, 166 DOI:10.1016/j.colsurfb.2018.03.020.
- A. J. Nathanael and T. H. Oh, Polymer, 2020, 12, 3061 CAS.
- M. Szczęch, N. Łopuszyńska, W. Tomal, K. Jasiński, W. P. Węglarz, P. Warszyński and K. Szczepanowicz, Langmuir, 2020, 36 DOI:10.1021/acs.langmuir.0c01512.
- S. Mejlsøe and A. Kakkar, Molecules, 2020, 25, 3995 CrossRef PubMed.
- Y. Yagci, S. Jockusch and N. J. Turro, Macromolecules, 2010, 43, 6245–6260 CrossRef CAS.
- S. Chatani, C. J. Kloxin and C. N. Bowman, Polym. Chem., 2014, 5, 2187–2201 RSC.
- P. Xiao, J. Zhang, F. Dumur, M. A. Tehfe, F. Morlet-Savary, B. Graff, D. Gigmes, J. P. Fouassier and J. Lalevée, Prog. Polym. Sci., 2015, 41, 32–66 CrossRef CAS.
- N. Corrigan, J. Yeow, P. Judzewitsch, J. Xu and C. Boyer, Angew. Chem., Int. Ed., 2019, 58, 5170–5189 CrossRef CAS PubMed.
- I. Kamińska, J. Ortyl and R. Popielarz, Polym. Test., 2016, 55, 310–317 CrossRef.
- D. Nowak, J. Ortyl, I. Kamińska-Borek, K. Kukuła, M. Topa and R. Popielarz, Polym. Test., 2017, 64, 313–320 CrossRef CAS.
- D. Nowak, J. Ortyl, I. Kamińska-Borek, K. Kukuła, M. Topa and R. Popielarz, Polym. Test., 2018, 67, 144–150 CrossRef CAS.
- K. Kostrzewska, J. Ortyl, R. Dobosz and J. Kabatc, Polym. Chem., 2017, 8, 3464–3474 RSC.
- J. P. Fouassier, X. Allonas and D. Burget, Prog. Org. Coat., 2003, 47, 16–36 CrossRef CAS.
- P. Glöckner and National Paint and Coatings Association, Radiation curing: coatings and printing inks: technical basics, applications and trouble shooting, Vincentz Network, 2008 Search PubMed.
- W. Arthur Green, Industrial Photoinitiators - A Technical Guide, 2010 Search PubMed.
- Z. Czech, A. Kowalczyk, J. Ortyl and J. Swiderska, Pol. J. Chem. Technol., 2013, 15, 12–14 CrossRef CAS.
- B. Strehmel, S. Ernst, K. Reiner, D. Keil, H. Lindauer and H. Baumann, Z. Phys. Chem., 2014, 228, 129–153 CrossRef CAS.
- C. Schmitz, Y. Pang, A. Gülz, M. Gläser, J. Horst, M. Jäger and B. Strehmel, Angew. Chem., Int. Ed., 2019, 58, 4400–4404 CrossRef CAS PubMed.
- Z. Wang, W. Huang, P. Peng and D. E. Fennell, Chemosphere, 2010, 78, 147–151 CrossRef CAS PubMed.
- K. Nakamura, Photopolymers: Photoresist Materials, Processes, and Applications, CRC Press, 1st edn, 2014 Search PubMed.
- H. Chen, G. Noirbent, K. Sun, D. Brunel, D. Gigmes, F. Morlet-Savary, Y. Zhang, S. Liu, P. Xiao, F. Dumur and J. Lalevée, Polym. Chem., 2020, 11, 4647–4659 RSC.
- W. Tomal, D. Krok, A. Chachaj-Brekiesz, P. Lepcio and J. Ortyl, Addit. Manuf., 2021, 48, 102447 CAS.
- H. Mokbel, D. Anderson, R. Plenderleith, C. Dietlin, F. Morlet-Savary, F. Dumur, D. Gigmes, J. P. Fouassier and J. Lalevée, Prog. Org. Coat., 2019, 132, 50–61 CrossRef CAS.
- K. Lee, N. Corrigan and C. Boyer, Angew. Chem., Int. Ed., 2021, 60, 8839–8850 CrossRef CAS PubMed.
- Z. Zhang, N. Athaniel Corrigan, A. Bagheri, J. Jin and C. Boyer, Angew. Chem., 2019, 131, 18122–18131 CrossRef.
- P. Fiedor, M. Pilch, P. Szymaszek, A. Chachaj-Brekiesz, M. Galek and J. Ortyl, Catalysts, 2020, 10, 284 CrossRef CAS.
- E. Hola, M. Topa, A. Chachaj-Brekiesz, M. Pilch, P. Fiedor, M. Galek and J. Ortyl, RSC Adv., 2020, 10, 7509–7522 RSC.
- E. Hola, M. Pilch, M. Galek and J. Ortyl, Polym. Chem., 2020, 11, 480–495 RSC.
- J. Ortyl, P. Fiedor, A. Chachaj-Brekiesz, M. Pilch, E. Hola and M. Galek, Sensors, 2019, 19, 1668 CrossRef CAS PubMed.
- K. Sawicz-Kryniger, P. Niezgoda, P. Stalmach, K. Starzak, A. Wysocka, T. Świergosz and R. Popielarz, Eur. Polym. J., 2022, 162, 110933 CrossRef CAS.
- J. Ortyl, M. Galica, R. Popielarz and D. Bogdał, Pol. J. Chem. Technol., 2014, 16, 75–80 CrossRef CAS.
- M. Topa, J. Ortyl, A. Chachaj-Brekiesz, I. Kamińska-Borek, M. Pilch and R. Popielarz, Spectrochim. Acta, Part A, 2018, 199, 430–440 CrossRef CAS PubMed.
- A. J. Lees, Organometallic complexes as luminescence probes in monitoring thermal and photochemical polymerizations, 1998, vol. 177 Search PubMed.
- J. Ortyl, M. Topa, I. Kamińska-Borek and R. Popielarz, Eur. Polym. J., 2019, 116, 45–55 CrossRef CAS.
- S. Hu, R. Popielarz and D. C. Neckers, Fluorescence Probe Techniques (FPT) for Measuring the Relative Efficiencies of Free-Radical Photoinitiators, 1998 Search PubMed.
- M. E. Jolley, Fluorescence Polarization: An Analytical Tool for Immunoassay and Drug Discovery 1999 Search PubMed.
- J. C. Owicki, J. Biomol. Screening, 2000, 5, 297–306 CrossRef CAS PubMed.
- M. Z. Jonaghani, H. Zali-Boeini, R. Taheri, H. A. Rudbari and B. Askari, RSC Adv., 2016, 6, 34940–34945 RSC.
- K. Zhou, M. Ren, B. Deng and W. Lin, New J. Chem., 2017, 41, 11507–11511 RSC.
- J. Ortyl, K. Sawicz and R. Popielarz, J. Polym. Sci., Part A: Polym. Chem., 2010, 48, 4522–4528 CrossRef CAS.
- M. A. Haidekker, T. P. Brady, D. Lichlyter and E. A. Theodorakis, J. Am. Chem. Soc., 2006, 128, 398–399 CrossRef PubMed.
- P. Bosch, F. Catalina, T. Corrales and C. Peinado, Chem. – Eur. J., 2005, 11, 4314–4325 CrossRef CAS PubMed.
- I. Kamińska, J. Ortyl and R. Popielarz, Polym. Test., 2015, 42, 99–107 CrossRef.
- W. P. Ambrose, P. M. Goodwin, J. H. Jett, A. van Orden, J. H. Werner and R. A. Keller, Chem. Rev., 1999, 99, 2929–2956 CrossRef CAS PubMed.
- J. R. Lakowicz, Principles of fluorescence spectroscopy, Springer, 2006 Search PubMed.
- D. L. Andrews, Encyclopedia of applied spectroscopy, Wiley-VCH, 2009 Search PubMed.
- W. Tomal, M. Pilch, A. Chachaj-Brekiesz, M. Galek, F. Morlet-Savary, B. Graff, C. Dietlin, J. Lalevée and J. Ortyl, Polym. Chem., 2020, 11, 4604–4621 RSC.
- J. Ortyl and R. Popielarz, J. Appl. Polym. Sci., 2013, 128, 1974–1978 CAS.
- J. Ortyl, J. Wilamowski, P. Milart, M. Galek and R. Popielarz, Polym. Test., 2015, 48, 151–159 CrossRef CAS.
- J. Ortyl, M. Galek, P. Milart and R. Popielarz, Polym. Test., 2012, 31, 466–473 CrossRef CAS.
- J. Ortyl, K. Sawicz and R. Popielarz, J. Polym. Sci., Part A: Polym. Chem., 2010, 48, 4522–4528 CrossRef CAS.
- M. J. M. Abadie and L. Jonescu-Vasii, Recent Advances in Cationic Photoinitiators – Application to the Photopolymerization of Epoxides and Vinyl Ethers, Proceedings of RadTech Asia '95 Radiation Curing Conference, Guilin, China, 1995, pp. 53–58 Search PubMed.
Footnote |
| † This paper is dedicated to the memory of Tomasz Świergosz who passed away on June 30, 2022, at the age of 36. |
| This journal is © The Royal Society of Chemistry 2022 |

