
 Open Access Article
 This Open Access Article is licensed under a Creative Commons Attribution-Non Commercial 3.0 Unported Licence
Metallosupramolecular polymers as precursors for platinum nanocomposites†
Claudio
Cappelletti
 a,
Luis M.
Olaechea
a,
Alessandro
Ianiro
a,
Cristina
Prado-Martínez
a,
Emad
Oveisi
b,
Christoph
Weder
*a and
Stephen
Schrettl
*a
a,
Luis M.
Olaechea
a,
Alessandro
Ianiro
a,
Cristina
Prado-Martínez
a,
Emad
Oveisi
b,
Christoph
Weder
*a and
Stephen
Schrettl
*a
aAdolphe Merkle Institute, University of Fribourg, Chemin des Verdiers 4, 1700 Fribourg, Switzerland. E-mail: christoph.weder@unifr.ch; stephen.schrettl@unifr.ch
bInterdisciplinary Centre for Electron Microscopy, EPFL, 1015 Lausanne, Switzerland
First published on 7th March 2022
Abstract
Nanocomposites comprising a polymer matrix and metallic nanoparticles (NPs) can merge the structural features of the matrix material with the functional characteristics of the NPs. While such materials are promising for a wide range of applications, their preparation typically requires multi-step processes that can be difficult to control. Alternatively, materials with NPs can be directly accessed in a controlled manner by exploiting zero-valent metallosupramolecular polymer (MSP) precursors. We here report how the nature of the polymer and its molecular weight affect the nanocomposite formation and structure. Poly(tetrahydrofuran)-based macromonomers with suitable ligands are used to prepare MSPs based on bis(η2-alkyne)platinum(0) complexes. Heating these materials causes disassembly of the complexes and, upon the release of Pt0-atoms, Pt-NPs form in the matrix polymer. The Pt content in the MSP influences the NP formation and thereby the characteristics of the nanocomposites. It is also possible to trigger the complex dissociation and NP formation by exposure to UV light. This allows photolithographic processing and thus the preparation of nanocomposites that contain Pt-NPs in a spatially controlled manner.
Introduction
Nanocomposites that merge a polymer matrix and metal nanoparticles (NPs) represent a growing family of materials that combine the processability and properties of polymers with the functional characteristics of inorganic NPs.1–7 Depending on the NPs employed, such materials are potentially useful for applications that range from catalysis to sensing to flexible electronics and optical materials.8–14 The preparation of nanocomposites with metallic NPs is typically achieved by either first preparing the NPs and mixing them with a polymer or by the in situ reduction of a metal salt embedded in the polymer.5,15–20 These general approaches have furnished a range of materials with attractive properties.21–25 However, since the size, distribution, and specific location of the NPs significantly affects plasmonic,26 catalytic,27 magnetic,28 and other properties, achieving better control over the NP formation is desirable.29,30 One possibility to achieve this, is the controlled decomposition of polymers featuring metal–ligand coordination complexes.15–17,31 For example, in a study by Rowan, Sankaran, and coworkers,31 a metallosupramolecular polymer (MSP)32 was used that was assembled by combining a Pt(II) salt with telechelic macromonomers carrying the well-known 2,6-bis(N-methylbenzimidazoyl)pyridine (Mebip) ligand at the termini. Pt-NPs were then generated in situ by exposure of the polymer films to an atmospheric plasma, which caused the reduction of the Pt(II) salt. To enable the preparation of nanocomposites under milder conditions and with improved control, some of us recently reported that MSPs with zerovalent metal–ligand complexes can serve as precursor.33 In this case, the formation of metal NPs in the polymer matrix only requires the application of a stimulus that dissociates the complexes and releases the metal atoms. Building on earlier reports on low-molecular weight,34–37 as well as polymeric zerovalent platinum complexes,38,39 the chain ends of a poly(ethylene-co-butylene) (PEB) telechelic were modified to carry diphenylacetylene ligands. The chain-extension through the formation of bis(η2-alkyne)Pt0 complexes then furnished a MSP.33 Heating or exposure to UV light led to the dissociation of the complexes and the formation of clusters of Pt atoms, which upon annealing coalesced into platinum nanoparticles (Pt-NPs). The approach allows photolithographic processing and thus the preparation of nanocomposites that contain Pt-NPs in a controlled manner, without the need for additional reagents or harsh reduction conditions. We now report a detailed investigation on how the nature and molecular weight of the macromonomers employed affect the size, distribution, and density of the Pt-NPs in the nanocomposites.Results and discussion
In the present study, bis-hydroxyl functionalized poly(tetrahydrofuran) (PTHF) of three different molecular weights (1000, 2000, and 2900 g mol−1) was used to prepare telechelic macromonomers functionalized with diphenylacetylene (DPA) ligands. These building blocks were assembled into MSPs through the previously reported ligand-exchange reaction with Pt(styrene)3,33,37,38 which afforded bis(η2-alkyne)Pt0 complexes (Fig. 1). Macromonomers 1–3 were prepared by the reaction of p-toluenesulfonyl chloride with PTHF, which was followed by nucleophilic substitution with 4-(phenylethynyl)phenol (Fig. S1, see the ESI† for a detailed description). The macromonomers 1–3 were characterized by nuclear magnetic resonance (NMR) spectroscopy and size exclusion chromatography (SEC). The data corroborate the successful functionalization of PTHF with diphenylacetylene (DPA) ligands at the termini (Fig. S2–S5†).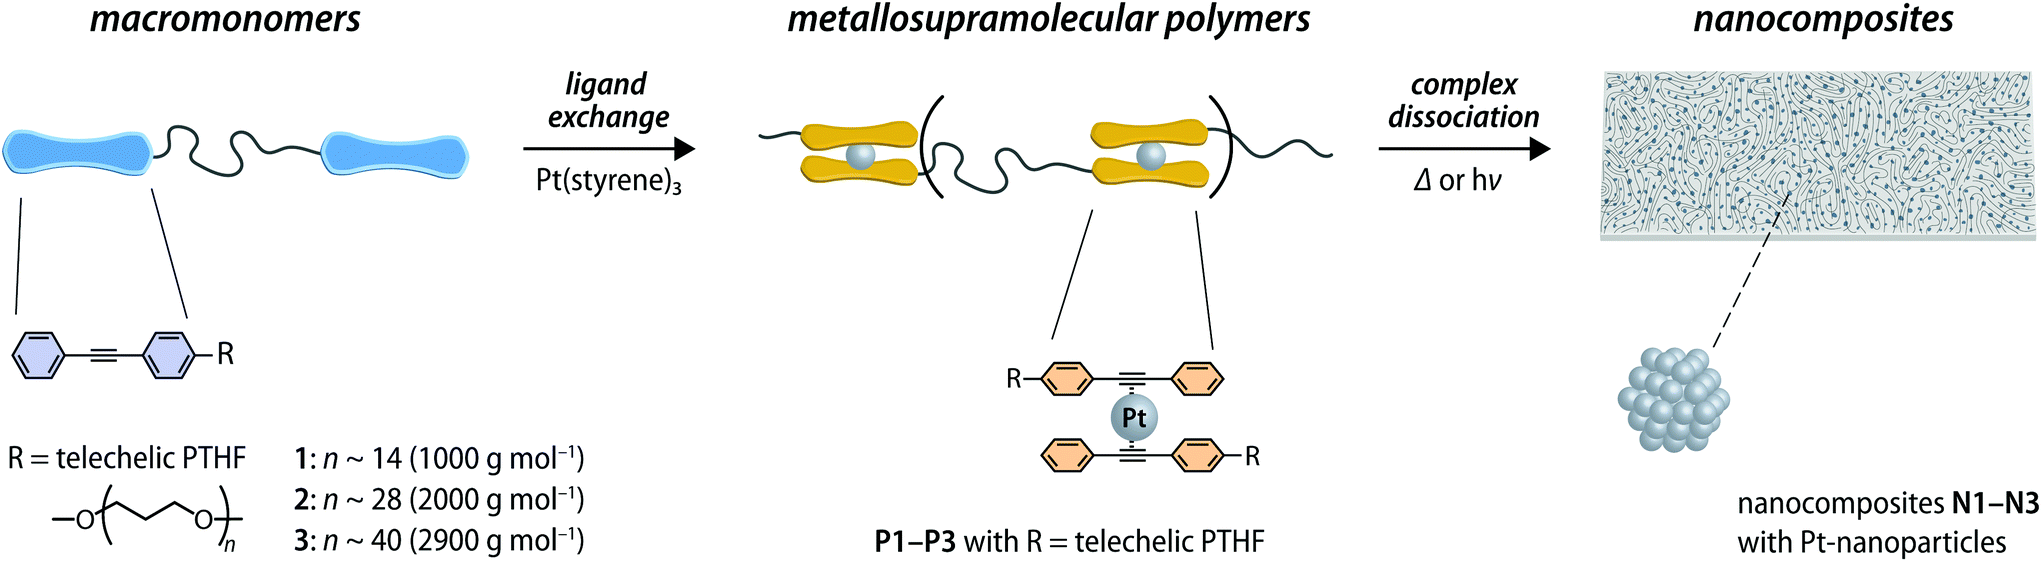 | ||
| Fig. 1 Schematic representation of the preparation of metallosupramolecular polymers (MSPs) assembled through zerovalent Pt complexes and their use as precursors for nanocomposites containing Pt nanoparticles. The ligand-exchange reaction between telechelic poly(tetrahydrofuran) macromonomers with terminal diphenylacetylene ligands (1–3) and Pt(styrene)3 leads to the formation of the MSPs (P1–P3). Heating or UV irradiation dissociates the complexes and leads to the nucleation and growth of Pt-NPs, furnishing nanocomposites (N1–N3). | ||
To probe the ligand-exchange, solutions of macromonomers 1–3 in CHCl3 (c = (1) 12.6, (2) 10.9, or (3) 16.3 μmol L−1) were titrated with aliquots of Pt(styrene)3 solutions in styrene (c = 0.7, 0.8, or 1.1 mmol L−1, for titrations with 1–3) and the exchange was monitored by UV-vis absorption spectroscopy. The spectra show that upon addition of Pt(styrene)3, the absorption band at 310 nm, which is characteristic of the DPA ligand, shifts to 330 nm, diagnostic for the formation of bis(η2-alkyne)Pt0 complexes (Fig. 2a and S6†).33 Plots of the amount of added platinum against the absorption intensity at 330 nm show that the shift is complete for all macromonomers at a stoichiometric 1![[thin space (1/6-em)]](https://www.rsc.org/images/entities/char_2009.gif) :2 metal-to-ligand ratio (Fig. 2b and S6†). Based on the results of previous investigations,33 these findings corroborate that a complete ligand-exchange reaction occurs that leads to chain extension into the corresponding MSPs P1–P3via formation of the Pt-bis(η2-diphenylacetylene) complexes. To prepare solid samples, solutions of 1–3 and Pt(styrene)3, in which a stoichiometric 1:2 metal-to-ligand ratio had been established by spectrophotometric titrations, were cast onto glass or poly(tetrafluoroethylene) (PTFE) substrates (see ESI† for a detailed description). After drying in vacuo for 48 h, P1–P3 were obtained as tacky, yellow-coloured films (Fig. S7†). Note that the ligand replaced (styrene) is the same as the solvent, highly volatile and thus fully removed upon drying. The prepared MSPs can be readily re-dissolved in non-polar organic solvents, and an exemplary characterization of P1 (c(CDCl3) ≈ 1 μmol L−1) by NMR spectroscopy further corroborates the formation of the bis(η2-alkyne)Pt0 complexes (Fig. S8†). Indeed, the characteristic peaks of the ligands are shifted, with only a minor signal for the unbound DPA ligand of 1 remaining, which can be ascribed to the dynamic character of the metal–ligand complexes in solution.
:2 metal-to-ligand ratio (Fig. 2b and S6†). Based on the results of previous investigations,33 these findings corroborate that a complete ligand-exchange reaction occurs that leads to chain extension into the corresponding MSPs P1–P3via formation of the Pt-bis(η2-diphenylacetylene) complexes. To prepare solid samples, solutions of 1–3 and Pt(styrene)3, in which a stoichiometric 1:2 metal-to-ligand ratio had been established by spectrophotometric titrations, were cast onto glass or poly(tetrafluoroethylene) (PTFE) substrates (see ESI† for a detailed description). After drying in vacuo for 48 h, P1–P3 were obtained as tacky, yellow-coloured films (Fig. S7†). Note that the ligand replaced (styrene) is the same as the solvent, highly volatile and thus fully removed upon drying. The prepared MSPs can be readily re-dissolved in non-polar organic solvents, and an exemplary characterization of P1 (c(CDCl3) ≈ 1 μmol L−1) by NMR spectroscopy further corroborates the formation of the bis(η2-alkyne)Pt0 complexes (Fig. S8†). Indeed, the characteristic peaks of the ligands are shifted, with only a minor signal for the unbound DPA ligand of 1 remaining, which can be ascribed to the dynamic character of the metal–ligand complexes in solution.
 | ||
| Fig. 2 (a) UV-vis absorption spectrum of macromonomer 3 (c(CHCl3) = 16.3 μmol L−1, blue line) and spectra recorded upon addition of aliquots (4 μL) of Pt(styrene)3 (c = 1 mmol L−1) with formation of P3 (orange line). (b) A plot of the absorbance at λmax = 330 nm and the molar ratio of Pt and 3 shows that the formation of bis(η2-alkyne)Pt0 complexes is complete at a 1:2 metal-to-ligand ratio. (c) Comparison of the thermogravimetric analysis traces of the three macromonomers 1–3 (dashed lines) and the three metallosupramolecular polymers P1–P3 (solid lines). (d) Differential scanning calorimetry (DSC) heating and cooling traces of P3 in a first (red line) and second heating and cooling scan (black line). (e) Comparison of the first DSC heating traces of samples of P1–P3. All traces display an exotherm above temperatures of 120 °C. (f) UV-vis absorption spectra of thin films of P3 (dark red), and spectra recorded after heating in a nitrogen atmosphere to 120 °C for 1 h (violet), to temperatures of 140, 160 and 180 °C (grey), and after annealing at 200 °C for 1 h (black). All TGA and DSC experiments were carried out with heating and cooling rates of 10 °C min−1. | ||
The macromonomers 1–3 and MSPs P1–P3 were characterized by thermogravimetric analysis (TGA) as well as differential scanning calorimetry (DSC). The TGA traces of 1–3 show an onset of degradation with a 5% weight loss at ca. 360 °C, whereas such a weight loss is already observed at temperatures of ca. 256, 240, and 279 °C for P1–P3, respectively (Fig. 2c). A comparison of the weight loss of the macromonomers and MSPs at a temperature of 600 °C shows that the residual masses of P1–P3 are higher than those of 1–3 (Fig. 2c, Table 1). Gratifyingly, the differences agree very well with the calculated weight fraction of Pt in the MSPs. The DSC heating and cooling traces of 1–3 mirror each other and show a reversible melting transition (Tm) of the PTHF backbone at ca. 21 °C as well as a transition associated with its crystallization (Tc) at ca. −3 °C (Fig. S9†). These characteristic transitions of the PTHF backbone are also observed in the DSC traces of P2 and P3, but are absent in those of P1 (Fig. 2d, e and S10†), indicating that the crystallization of the MSP with a low-molecular weight PTHF core is stifled. The first heating traces of P1–P3 also feature a pronounced and broad exothermic transition with an onset starting at ca. 120 °C and a maximum at ca. 188–194 °C, which is absent in subsequent heating scans (Fig. 2e). In line with previous investigations,33 the exotherm is ascribed to an irreversible oligomerization reaction of the DPA ligands upon dissociation of the bis(η2-alkyne)Pt0 complexes. As expected, the enthalpy of the exothermic reaction scales with the weight fraction of the complexes in the MSP and is thus highest in the case of P1 (Table 1, Fig. S11†).
The comparison of the UV-vis absorption spectra acquired before and after heating thin films of P1–P3 shows that the characteristic absorption band of the metal–ligand complex at 330 nm is reduced after heating to 120 and 140 °C (Fig. 2f, and S12†), and completely vanishes when samples are heated to temperatures above 160 °C, i.e., above the onset temperature of the exotherm observed by DSC (Fig. S13†). The spectra, hence, further corroborate that the Pt(η2-alkyne)2 coordination complexes dissociate upon heating and that a conversion into the corresponding nanocomposites occurs (N1–N3). Moreover, the appearance and mechanical properties of the materials also drastically change upon heating. While the as-prepared P1–P3 are yellow-coloured and viscous, heating to 120 °C for 1 h, affords N1–N3 as elastic, self-standing films. Tensile tests on samples of uniform thickness and dimensions show that the mechanical properties correlate with the Mn of the polymer core. For example, the Young's modulus decreases from 20 MPa (N1) to 9 MPa (N3) (Fig. S14, and Table S1†), reflecting a lower density of cross-links formed by the reaction of DPA moieties upon dissociation as the Mn of the macromonomer increases and the concentration of DPA ligand decreases from P1 to P3.
The morphology of solvent-cast films of P1–P3 was characterized by small- and wide-angle X-ray scattering (SAXS/WAXS) measurements. Confirming the DSC data, the analysis of the scattering data shows that P1 is amorphous and structurally homogeneous, as asserted by the absence of distinctive features in the small-angle regime with only the diffuse peak at q ≅ 14 nm−1 (Fig. 3a). Consistent with the melting transitions observed by DSC, the diffractograms of P2 and P3 show peaks that corroborate the presence of crystalline PTHF domains (Fig. 3a). Indeed, the d-spacings of 3.7 and 4.5 Å calculated from the q positions of the diffraction peak maxima (d = 2π/qmax) are consistent with the spacings reported for semicrystalline PTHF samples.40 The additional structural features observed in the SAXS region indicate small inhomogeneities at the mesoscale, which are presumably a consequence of the presence of the crystalline domains. The SAXS/WAXS diffractograms of solvent-cast samples of P1–P3 that were heated to the onset of the exotherm of 120 °C for 1 h show new features, while the peaks associated with the PTHF domains are absent in these profiles of N1–N3 (Fig. 3b). In the wide-angle regime, all scattering profiles of the heated samples display a broad peak centred at q ≅ 27 nm−1. The position of the peak is in excellent agreement with the expected lattice distance for the (111) plane of face-centred cubic Pt crystals,41 but its broad nature suggests that these Pt clusters are disordered (amorphous). A comparison of the features observed in the 1 < q < 10 nm−1 region with calculations based on a sphere form factor42 indicates that the thermal treatment (120 °C, 1 h) leads to the formation of spherical Pt clusters with an average radius of RP ≅ 3.5 ± 0.5 Å. The inflection in the scattering intensities of all samples at 0.2 < q < 2 nm−1 can be interpreted as a structure factor contribution that is caused by a relatively homogeneous distribution of the clusters. This causes the appearance of shallow peaks q* (Fig. 3b), from which the average nearest neighbour distances (dexpnn) between clusters can be estimated. The structural data are reported in Table 2, along with theoretically predicted values (dprednn). The latter were calculated based on the assumption that all platinum atoms are converted into non-disperse particles with radius RP and are homogeneously distributed in the sample. Under these assumptions, it can be shown that dprednn = RPϕP−1/3, where ϕP is the volume fraction of particles in the sample (see ESI† for a detailed description). Experimentally measured and predicted dnn values are in striking agreement (Table 2), suggesting that upon heating P1–P3 to the onset of the exotherm observed by DSC (120 °C), most of the Pt(η2-alkyne)2 coordination complexes dissociate and release the Pt-atoms, which aggregate into clusters that are homogeneously distributed within the polymeric matrix.
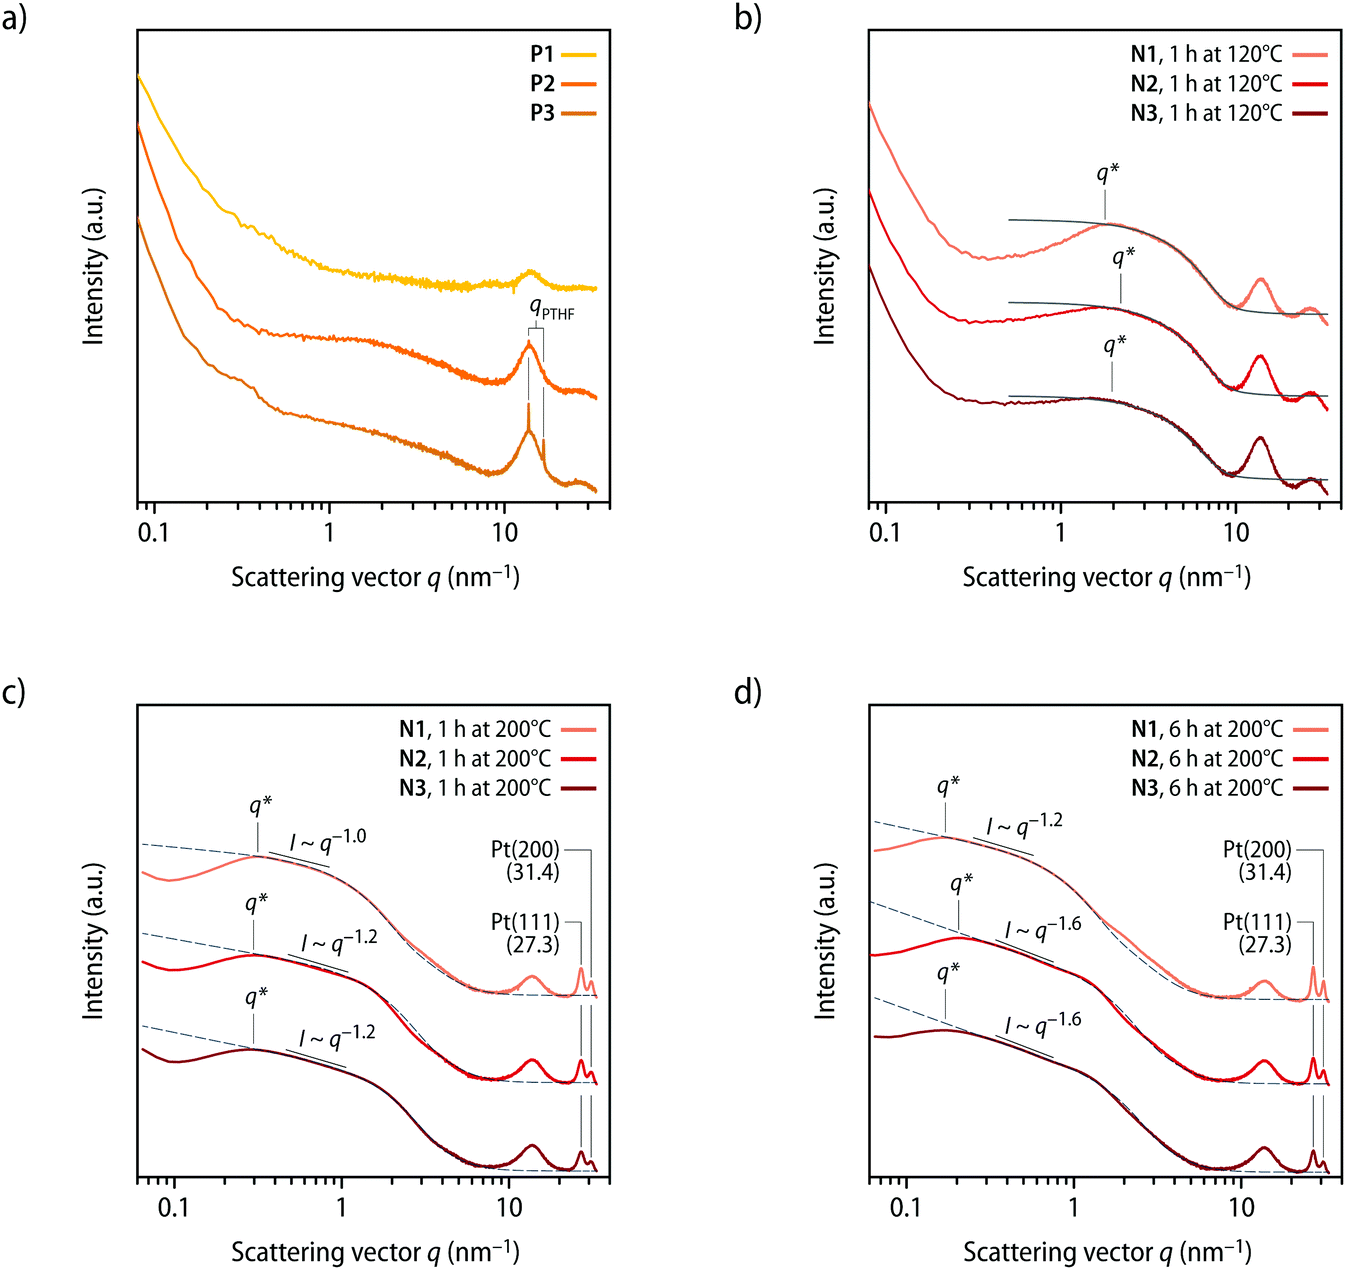 | ||
| Fig. 3 Characterization of the metallosupramolecular polymers P1–P3 and the nanocomposites N1–N3 by X-ray scattering. (a and b) Small- and wide-angle scattering profiles recorded (a) after solvent casting P1–P3 and (b) after heating P1–P3 to a temperature of 120 °C for 1 h and formation of N1–N3. The grey lines in (b) are the form factors of polydisperse spheres42 with radii (RP) of ca. 3.5 ± 0.5 Å. (c and d) Comparison of the scattering profiles of samples of N1–N3 after heating to a temperature of 200 °C for (c) 1 h and (d) 6 h. The grey dotted lines are the computed profiles of fractal aggregates44 with particles radii (Rp) of (c) ca. 2.6 ± 0.8 nm (N1), 1.8 ± 0.5 nm (N2), and 1.7 ± 0.5 nm (N3) and (d) of 3.7 ± 1.1 nm (N1), 2.1 ± 0.6 nm (N2), and 1.9 ± 0.6 nm (N3). See Table 2 for the fractal dimensions (df) and Fig. S15† for a comparison with fits with sphere form factors. The indicated q* values were used to calculate the nearest neighbour distances dexpnn reported in Table 2. Scattering curves are vertically shifted for clarity. The broad maximum observed in the scattering profiles at ca. 12–16 nm−1 corresponds to the amorphous halo and the background of the polyimide (Kapton) substrate. | ||
| Sample | Preparation protocol | Volume fraction Pt | Particle radius | Fractal dimension | Distance exp. | Distance pred. |
|---|---|---|---|---|---|---|
|
φ
P
|
R
P
(nm) |
d f |
d
expnnc (nm) |
d
prednnc (nm) |
||
| a Theoretical particle volume fractions (φP) were calculated assuming non-disperse particles and using the macromonomer to metal stoichiometry as well as the density values ρPt = 21.45 g cm−3 and ρ = 1.00 g cm−3 for the polymer matrix (see ESI† for details). b Scattering curves were fitted either with a sphere form factor model (120 °C/1 h) or with theoretical models for the scattering of fractal aggregates (all others) to determine particle radii. The standard deviation was determined by multiplication of the radii (Rp) by the dispersity index of the adopted model. c Average nearest neighbour distances were experimentally determined (dexpnn) based on the shallow peaks in the scattering profiles and theoretically calculated (dprednn) by assuming a homogenous distribution of the NPs. | ||||||
| N1 | 120 °C/1 h | 0.35 ± 0.05 | — | 3.5 | 3.5 | |
| 200 °C/1 h | 0.0078 | 2.6 ± 0.8 | 0.6 | 20 | 15.1 | |
| 200 °C/6 h | 3.7 ± 1.1 | 1.2 | 36 | 24.2 | ||
| N2 | 120 °C/1 h | 0.35 ± 0.05 | — | 3.6 | 4.3 | |
| 200 °C/1 h | 0.0041 | 1.8 ± 0.5 | 1.0 | 21 | 16.1 | |
| 200 °C/6 h | 2.1 ± 0.6 | 1.7 | 29 | 20.2 | ||
| N3 | 120 °C/1 h | 0.35 ± 0.05 | — | 4.0 | 5.2 | |
| 200 °C/1 h | 0.0025 | 1.7 ± 0.5 | 1.1 | 22 | 16.2 | |
| 200 °C/6 h | 1.9 ± 0.6 | 1.7 | 33 | 20.6 | ||
| N2 | UV/15 min | 0.0041 | 2.7 ± 0.5 | 1.1 | — | — |
| UV/30 min | 2.7 ± 0.5 | 2.0 | — | — | ||
While the release of Pt-atoms and the formation of Pt clusters can be achieved by heating P1–P3 to a temperature of 120 °C, it is known that the formation of crystalline Pt-NPs only proceeds rapidly at temperatures of ca. 200 °C.43 To achieve such NP formation, compression-molded (120 °C, 1 h, 3 tons) films of N1–N3 with a thickness of ca. 100 μm were heated to a temperature of 200 °C for 1 h. Gratifyingly, this leads indeed to the formation of crystalline Pt-NPs, as evident from the appearance of distinct reflections in the WAXS region (Fig. 3c). The scattering peaks observed at 27.3 and 31.4 nm−1 correspond to 2θ values of 39.09 and 45.44°, which are in excellent agreement with the expected positions for the reflections of the (111) and (200) planes of Pt-NPs with a face-centred cubic crystal structure.41 The formation of the NPs is also apparent from marked changes in the SAXS region of the diffractograms, i.e., a significant increase in the scattering intensity and the development of a broad q* peak (Fig. 3c). The scattering data of samples that were heated to 200 °C for 1 h are complex, but they present features in the intermediate q regime that are consistent with the presence of nanometric spherical scatterers (i.e., the Pt-NPs), as supported by a comparison with a sphere form factor (Fig. S15†).42 However, the predictions of the model deviate from the experimental data at low q values, indicating that the NPs are partially aggregated or inhomogenously distributed. Further analysis of the scattering profiles of samples N1–N3 (200 °C, 1 h) shows that the intensities (I) in the 0.3 < q < 1 nm−1 region display a roughly constant scaling factor j > 0 with respect to q (I ∼ q−j). The scaling exponent (j) can be interpreted as an estimation of the fractal dimension of the scattering objects, with a value of j ≈ 0 expected in this SAXS regime for ideally spherical scatterers. The observation that the intensities scale approximately with q−1 corroborates the conclusion that the Pt-NPs have, at least in part, the tendency to arrange into chain-like clusters (Fig. 3c). To account for the presence of anisotropic domains with higher particles densities, experimental scattering data were compared with theoretical models for the scattering of fractal aggregates.44 Good fits between the scattering profiles of N1–N3 (200 °C, 1 h) and models for the scattering of fractal aggregates (Fig. 3c, dotted lines) are obtained with primary particle radii (Rp) of 2.6 ± 0.8, 1.8 ± 0.5, and 1.7 ± 0.5 nm and fractal dimensions df of 0.6, 1.0, and 1.1 for N1, N2, and N3, respectively (Table 2). The fractal dimensions established for samples of N1–N3 are in agreement with the determined scaling exponents (j) and confirm the tendency of the NPs to arrange into chain-like clusters. Since the Pt-NPs are inhomogenously distributed, the intensity maxima q* in the SAXS region of the scattering profiles do not represent average distances between individual nanocrystals (Fig. 3c), but rather relate to the average distance between NP clusters. The interpretation is further supported by the fact that the apparent cluster spacings (dexpnn) that are calculated from the SAXS maxima (q*) exceed the theoretical values (dprednn; see Table 2 and ESI†) that were predicted based on the assumption that individual particles with radii Rp are homogeneously dispersed.
The SAXS/WAXS scattering profiles of samples N1–N3 that were heated to 200 °C for 6 h mirror those recorded after 1 h at 200 °C and the WAXS peaks confirm the presence of Pt-NPs with a face-centred cubic crystal structure (Fig. 3d). However, a shift of the intensity maxima (q*) to lower values is observed, which suggests that a further agglomeration of NPs into domains occurs upon prolonged heating at 200 °C. In line with this interpretation, the theoretically expected particle spacing (dprednn) more significantly exceeds the values calculated from the SAXS maxima (q*) for the cluster spacings (dexpnn; see Table 2), corroborating an inhomogeneous distribution of Pt-NPs in the polymer matrix. The scattering profiles of N1–N3 (200 °C, 6 h) were accordingly analysed as fractal aggregates,44 and a good fit of the experimental SAXS data with the theoretical scattering curve44 was obtained with particle radii (Rp) of 3.7 ± 1.1, 2.1 ± 0.6, and 1.9 ± 0.6 nm and fractal dimensions (df) of 1.2, 1.7, and 1.7 for N1, N2, and N3, respectively (Fig. 3d, dotted lines; Table 2). These data are in excellent agreement with the increased scaling exponents (j) observed for the scattering intensities (I) in the 0.3 < q < 1 nm−1 region (Fig. 3d). For N1 (200 °C, 6 h), a scaling of I ∼ q−1.2 is observed, indicating that the clusters mostly retain a chain-like structure. Conversely, the Pt-NPs clusters in samples of N2 and N3 (200 °C, 6 h) feature scaling relations of I ∼ q−1.6 (Fig. 3d), suggesting that the aggregates become more ramified and compact upon prolonged heating at 200 °C. The analysis of the SAXS/WAXS data for samples of N1–N3, hence, corroborates that crystalline Pt-NPs are reliably formed upon heating to temperatures of 200 °C. The radius of the nanocrystals thereby directly correlates with the molar mass of the polymers and the relative Pt content (see Tables 1 and 2), i.e., Pt-NPs of decreasing radii are obtained at lower Pt concentrations and with an increasing molecular weight of the macromonomers. Whereas the clear size correlation suggests a limited particle diffusivity in the polymer matrix,45 an apparent aggregation of the NPs into domains of higher density is observed. With increased annealing time, the scattering profiles suggest that individual Pt-NPs aggregate into bigger and more compact clusters.
The Pt-NP formation was further monitored by scanning transmission electron microscopy (STEM). After subjecting samples of P1–P3 to the heating protocol described above, ultramicrotomy was used to prepare specimen for STEM measurements (see ESI† for details). STEM micrographs recorded after heating P1 to 200 °C for 1 h (N1) show a distribution of crystalline Pt-NPs (Fig. 4a and S16†), whereas high-resolution STEM images reveal the lattice fringes of individual Pt-NPs (Fig. 4b and S16†), further corroborating the crystalline nature of the particles produced by heating the MSP to 200 °C. The composition of the particles was further confirmed by energy-dispersive X-ray (EDX) spectroscopy (Fig. 4c and S17†), which unambiguously demonstrates that Pt-NPs are formed. STEM images of samples of N2 and N3 that were heated to 200 °C for 1 h also show crystalline Pt-NPs (Fig. 4d, e and S18, S19†), but a lower particle density than N1. Indeed, an analysis of the STEM images reveals that the density of Pt-NPs correlates with the length of the polymer core, as indicated by increasing mean particle distances of 6.2 ± 2.0, 8.0 ± 3.0, and 12.0 ± 6.5 nm for samples of N1, N2, and N3, respectively (Table S2†). Moreover, the average radii of the Pt-NPs were determined by image analysis to be 2.2 ± 0.2, 1.4 ± 0.3, and 1.2 ± 0.2 nm for samples of N1, N2, and N3, respectively (Fig. 4f and S20–S23†). The analysis of the STEM images, hence, matches excellently with the scattering data (see Table S2†).
 | ||
| Fig. 4 Characterization of the nanocomposites N1–N3 produced by heating MSPs P1–P3 at 200 °C for 1 h by scanning transmission electron microscopy (STEM). (a and b) High-angle annular dark field STEM images of samples of N1 (200 °C, 1 h). (c) Image showing an overlay of a STEM micrograph of N1 (200 °C, 1 h) and the corresponding elemental map for platinum (green) as determined by energy-dispersive X-ray spectroscopy. (d and e) STEM images of samples of N2 and N3 (200 °C, 1 h) at different magnifications. (f) Distribution of radii of Pt-NPs in N1–N3 as determined by analysis of the STEM images. | ||
The STEM images of samples N1–N3 that were heated at 200 °C for a total of 6 h show that prolonged heating leads to the formation of larger, elongated agglomerates of Pt-NPs (Fig. 5 and S24–S26†). The aggregation of Pt-NPs is accompanied by an apparent phase separation into NP-rich and NP-depleted domains and a concomitant increase of the average nearest neighbour distance (Fig. 5a–c). While the aggregation of NPs impedes an analysis of the average radii from the STEM images, a dimensional analysis of the STEM images of samples N1–N3 (200 °C, 6 h) yields mean distances between NP agglomerates of 12.7 ± 4.9, 15.1 ± 6.0, and 18.0 ± 8.0 nm for N1, N2, and N3, respectively (Table S2†). The values for the spacing of NP domains determined from the STEM images are lower than those obtained by analysis of the scattering profiles (vide supra), which is readily explained by the loss of depth information in the STEM images. More generally, the observations by STEM imaging unambiguously corroborate the analysis of the SAXS/WAXS scattering profiles of increased NP spacings and the formation of chain-like NP aggregates upon prolonged thermal annealing of samples of N1–N3 (Fig. 5d–f).
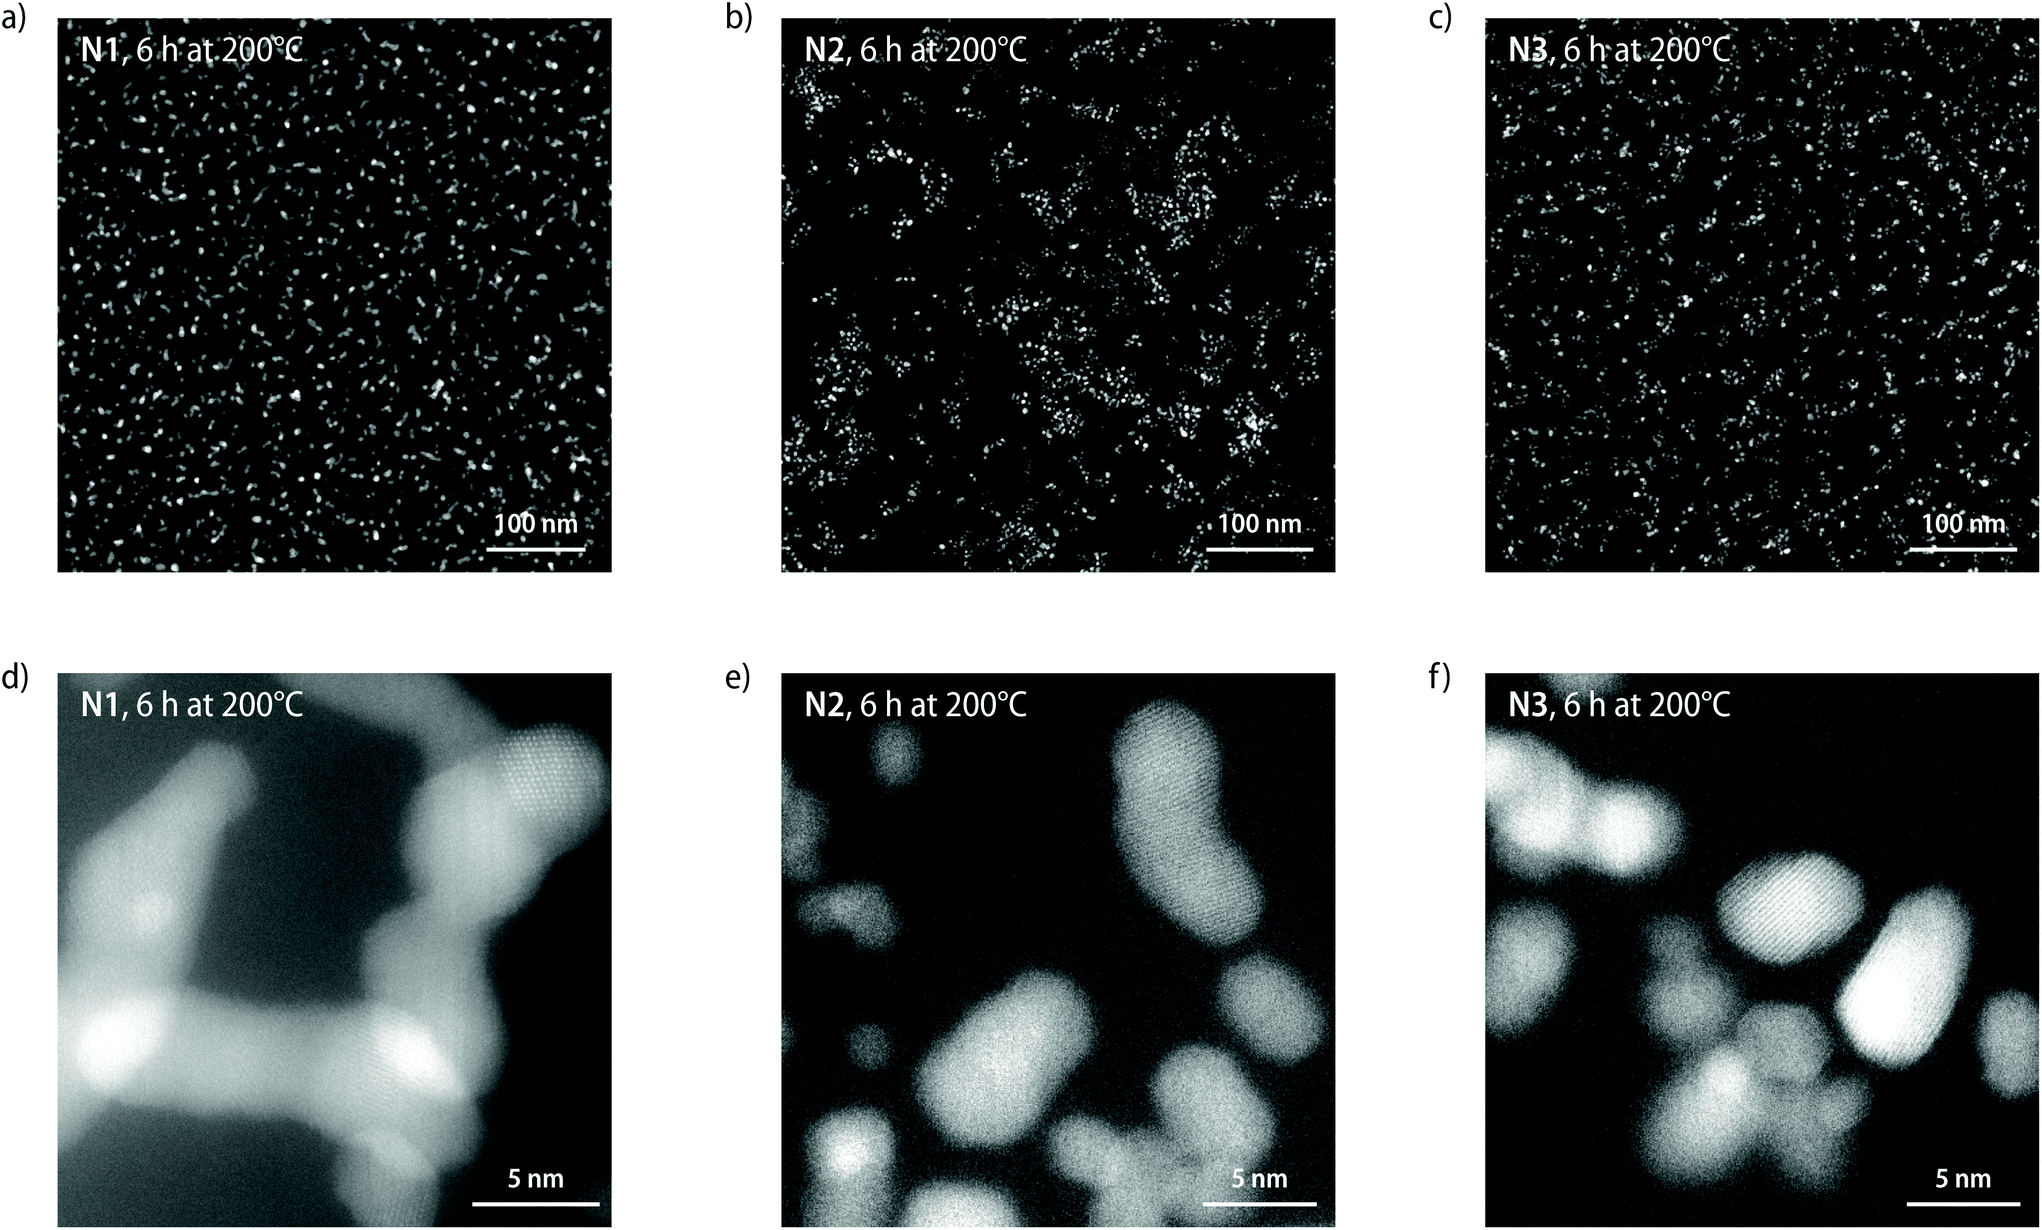 | ||
| Fig. 5 Analysis of the nanocomposites N1–N3 produced by heating MSPs P1–P3 at 200 °C for 6 h by scanning transmission electron microscopy (STEM). (a–f) High-angle annular dark field STEM images of samples of (a and d) N1, (b and e) N2, and (c and f) N3 at different magnifications. | ||
The preparation of nanocomposites in which the NPs are not randomly produced, but instead created in a spatially resolved manner can be achieved by triggering the dissociation of zerovalent MSP precursors by a suitable localized stimulus.32 To explore the utility of the here-reported PTHF-based MSPs for the UV-light induced formation of nanocomposites, solvent-cast films of P2 were prepared, partially covered with aluminium foil, and subjected to UV light irradiation (320–360 nm; 900 mW cm−2). The temperature was monitored with an IR camera, which showed that the temperature in the exposed sample region increased to 180 °C within 30 s on account of light-to-heat conversion. The exposed portions of the sample were rendered insoluble upon UV-light irradiation, indicating effective cross-linking upon UV irradiation by oligomerization of the diphenylacetylene ligands. By contrast, a solvent wash with ethyl acetate readily dissolved the non-irradiated regions of the solvent-cast films (Fig. S27†). The formation of Pt-NPs was demonstrated by SAXS/WAXS measurements of the irradiated sample. Scattering profiles recorded after 15 min of UV irradiation (320–360 nm; 900 mW cm−2) show a good fit with the theoretical model of fractal aggregates with radii of 2.7 ± 0.5 nm, and the characteristic reflections in the WAXS region (2θ = 39.09°, 45.44°) of the (111) and (200) plane of Pt-NPs with a face-centred cubic crystal structure (Fig. S27†).41 Diffractograms of samples of P2 that were irradiated for 30 min show the same characteristic peaks for crystalline Pt-NPs in the WAXS region in the scattering profile, and the form factor again matches with fractal aggregates with average radii of 2.7 ± 0.5 nm (Fig. S27†). Whereas the radii after 15 and 30 min of UV irradiation mirror each other, the fractal dimensions used to achieve the fit increase from 1.1 after 15 min to 2.0 after 30 min, suggesting that the Pt-NPs aggregate into extended structures without changing their characteristic radii. Irradiated samples, hence, feature nanostructures that are larger than those observed after thermal treatment at temperatures of 200 °C, perhaps, because the intense UV light leads to an increased heating rate and higher temperatures are reached upon prolonged exposure.33,46,47
The irradiation of samples with UV light through a photolithography mask was used to create patterned nanocomposites. After casting solutions of P1 (c = 0.5 mol L−1) onto quartz glass substrates followed by drying in ambient atmosphere overnight, the samples were exposed to UV irradiation (15 min; 320–360 nm; 900 mW cm−2) using a photomask (Fig. 6a, see Fig. S28† for a microscopy image of the photomask). The non-irradiated portions were selectively removed by simply rinsing the samples with ethyl acetate (ca. 10 mL, Fig. S28†), leaving only the exposed N1 on the glass substrate (Fig. 6b). Solvent residues from the wash were then removed by drying and the remaining portions were annealed by heating to 200 °C (Fig. 6c). Scanning electron microscopy with EDX spectroscopy was used to confirm the formation of the nanocomposite (Fig. S29†). The micrographs recorded after the ethyl acetate wash unambiguously show that a Pt-containing residue remains, whose shape matches the pattern of the photomask. To further demonstrate the potential of lithographic processing, solvent-cast samples of P2 (thickness ca. 100 μm) were exposed to irradiation by a laser engraving machine (λex = 400–460 nm; Fig. S30†). The SAXS/WAXS scattering profiles recorded after exposure of the sample to intense laser irradiation above ca. 450 mW show the appearance of the characteristic reflections in the WAXS region of crystalline Pt-NPs, corroborating that irradiation at the absorption edge of the MSPs is sufficient to induce the nanocomposite formation. Laser based processing greatly simplifies the production of defined nanocomposite patterns (Fig. S30†).
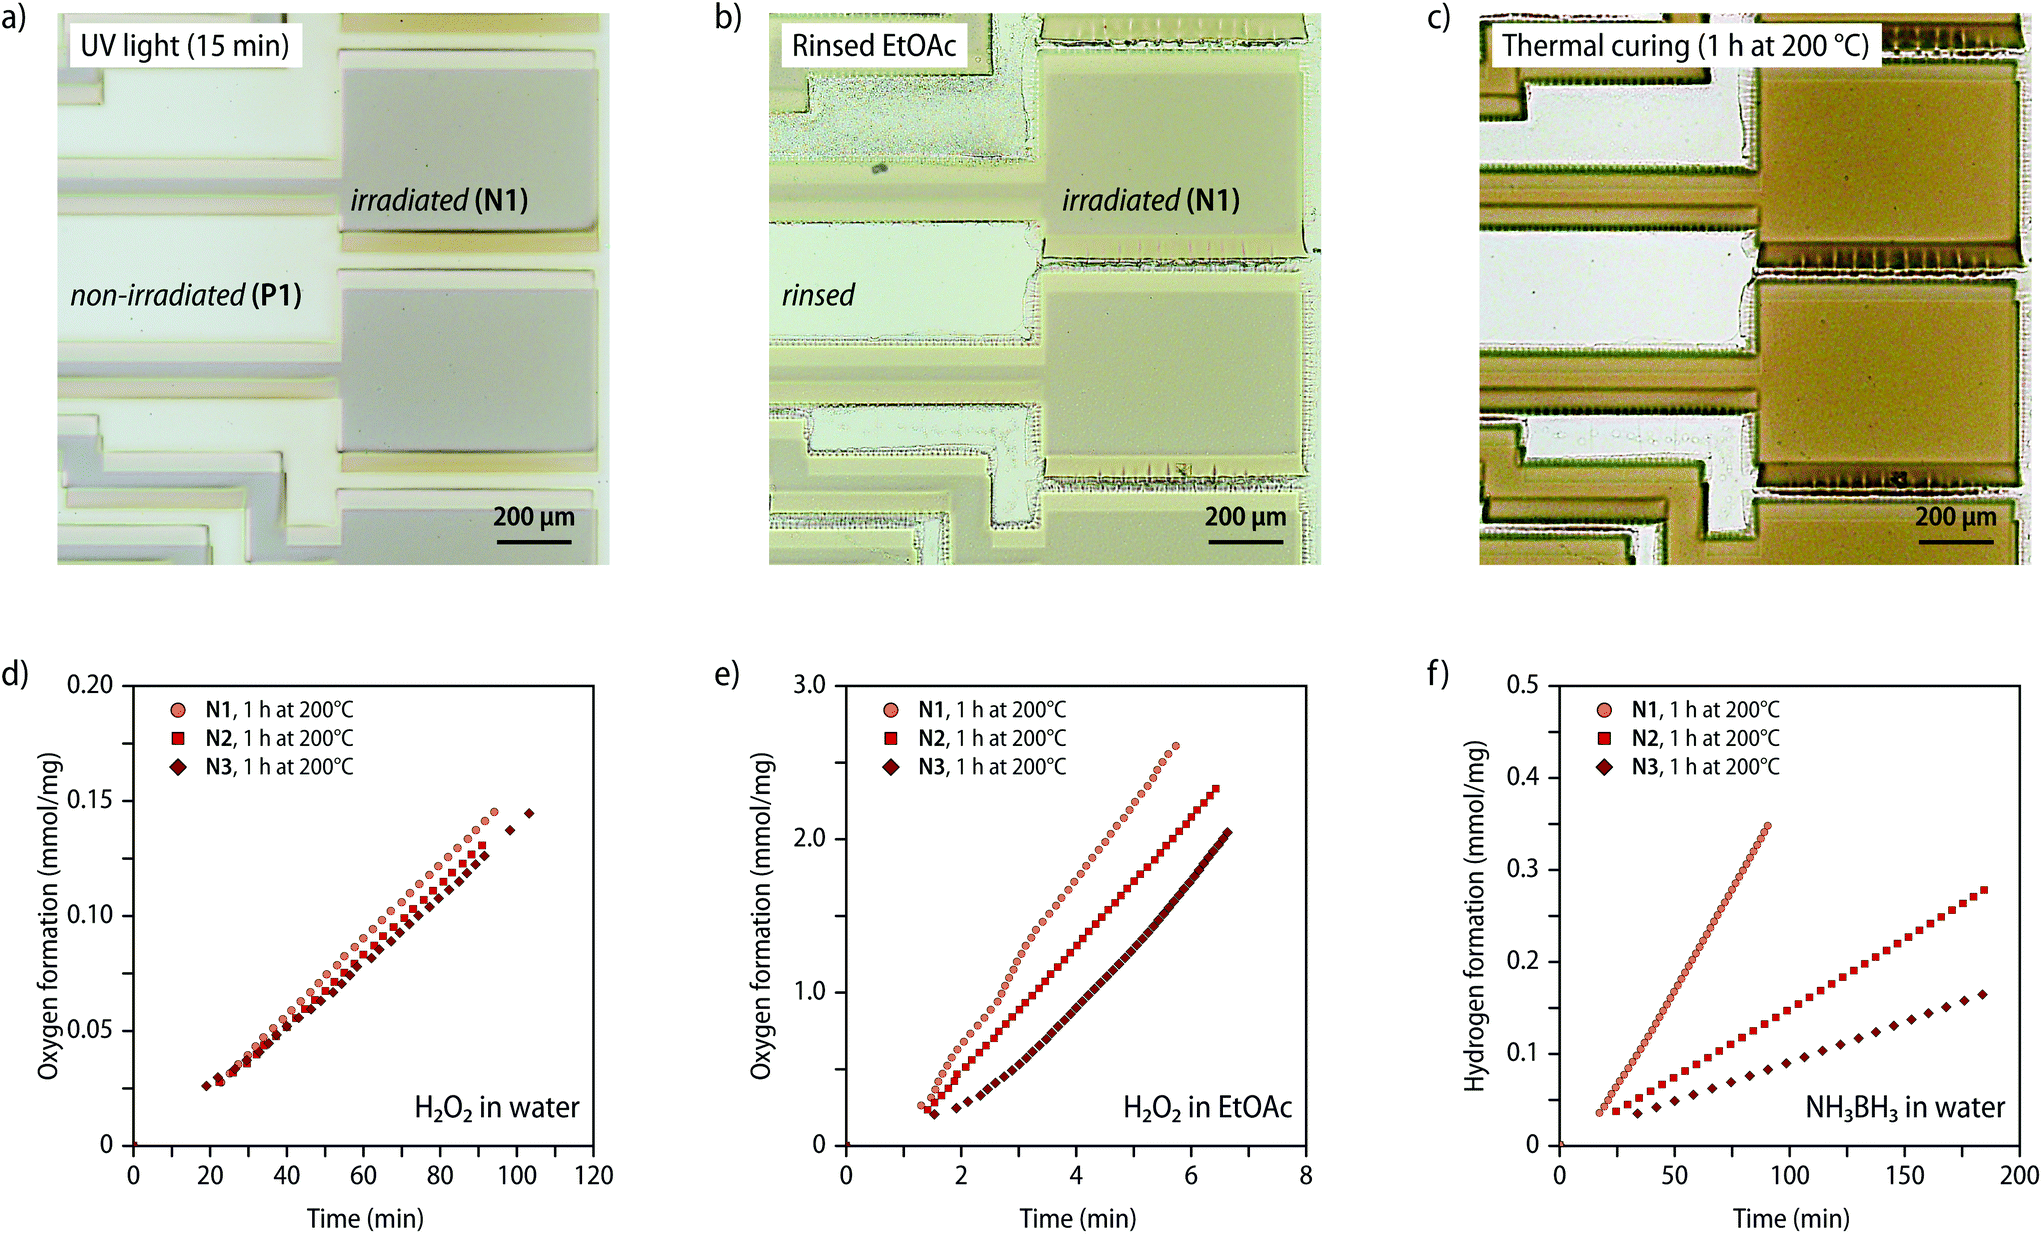 | ||
| Fig. 6 Photolithographic processing of the MSPs and catalytic properties of the nanocomposites. (a–c) Microscopy images of a sample of P1 that was solvent-cast on a quartz glass substrate and subjected to photolithographic processing to prepare nanocomposite samples with a controlled structure. The micrographs show (a) the sample after irradiation with UV light (15 min, 320–360 nm, 900 mW cm−2) through a photomask, (b) after subsequently rinsing the sample with ethyl acetate to remove non-irradiated P1, and (c) after heating the residue to 200 °C for 1 h in an inert nitrogen atmosphere. (d and e) Plots of the oxygen evolution over time for the different nanocomposites N1–N3 as observed in the hydrogen peroxide degradation reaction in (d) aqueous and (e) ethyl acetate solutions. N1–N3 were used as dip-catalysts in the hydrogen peroxide solutions (c(H2O2) = 7.3 mol L−1). (f) Plot of the hydrogen evolution over time for the different nanocomposites N1–N3 as observed in the ammonia borane hydrolysis reaction in aqueous solution (c(NH3BH3) = 0.5 mol L−1). | ||
To further demonstrate the utility of nanocomposites containing Pt-NPs, we explored the use of N1–N3 as heterogenous dip-catalysts in the decomposition reaction of hydrogen peroxide48 and the hydrolysis reaction of ammonia borane.49 To explore the catalytic activity for the decomposition reaction of hydrogen peroxide ca. 5 mg of samples of N1–N3 (1 h, 200 °C) were inserted either into ethyl acetate or aqueous solutions containing H2O2 (c = 7.3 mol L−1) and the formation of O2 was followed volumetrically (Fig. 6d, e and S31, see ESI† for details). For the reaction in aqueous H2O2 solutions, plots of the gas evolution against time indicate that samples with varying Pt-NP content display a comparable catalytic activity of ca. of 1.5 μmol min−1 mg−1 (Fig. 6d). By contrast, the reactivity in ethyl acetate solutions was found to significantly increase for samples with a higher weight fraction of the Pt-NPs from 398 μmol min−1 mg−1 for N3 up to 517 μmol min−1 mg−1 with samples of N1 (Fig. 6e). These findings suggest that the catalysis in aqueous solution is presumably limited by the slow diffusion of hydrogen peroxide through the polymer matrix, whereas the catalytic activity in ethyl acetate, which swells the polymer considerably, shows a direct correlation with the weight fraction of the NPs. The varying slope observed in ethyl acetate solutions supports that a diffusion-limited process governs, since the accessible fraction of NP will vary with increased swelling over time. Pt-NPs can also catalyse the hydrolysis reaction of ammonia borane into H2 and borate. To explore the use of N1–N3 in this context, samples (ca. 5 mg, 1 h, 200 °C) were placed in aqueous NH3BH3 solutions (c = 0.5 mol L−1) and the gas evolution was monitored volumetrically. In this case, the catalytic rate was found to increase linearly with the Pt content in the nanocomposite (Fig. 6f), reaching a hydrogen production rate of up to 4.2 μmol min−1 mg−1 for N1 (Table S5†). The data seem to suggest that the diffusion of NH3BH3 into the polymer is preferred over that of H2O2, so that in this case the rate is not similarly affected by the diffusion of NH3BH3 into the polymer matrix, but directly depends on the Pt-NP content.
Conclusions
In summary, we report the use of linear MSPs with in-chain zerovalent Pt complexes as stable precursors to Pt-NP composites. The materials can be readily processed from solution and undergo an irreversible decomplexation reaction when heated above a threshold temperature or upon irradiation with UV light. The application of such stimuli causes the release of Pt atoms from the metal–ligand complexes and the in situ formation of Pt-NPs. The degree of polymerization of the macromonomers allows one to precisely control the concentration of Pt in the precursors, and thereby the content of NPs in the resulting composite, without the need for additional processing, stabilizing surfactants, or reducing agents. The growth of Pt-NPs is directly influenced by the employed stimulus. Independent of the Pt-concentration in the precursor, heating to 200 °C for 1 h leads to the controlled formation of individual Pt-NPs that are uniformly dispersed throughout the nanocomposite. Continued annealing at 200 °C or UV irradiation, which results in higher temperatures, leads to the coalescence of NPs into extended nanostructures, showcasing the potential of the developed approach for the control of the NP formation process. Moreover, UV irradiation also enables a spatially controlled formation of nanocomposites, as demonstrated by the creation of patterned structures and the facile removal of residual MSPs by a solvent wash. The utility of such Pt-NP composites was further demonstrated by their use as dip-catalysts for the formation of oxygen from aqueous hydrogen peroxide solutions and the production of hydrogen gas from aqueous ammonia borane.In comparison to previous investigations with an apolar poly(ethylene-co-butylene) macromonomer,33 the process of particle formation was found to be significantly accelerated in polar PTHF matrices. For example, heating of the poly(ethylene-co-butylene) precursor for 1 h to 200 °C furnished NPs with average particle radii of only ca. 0.5 nm, much smaller than the radii of Pt-NP of ca. 1.7 nm observed upon applying the same treatment to samples of P3 that feature a similar Pt concentration. Prolonged heating or the irradiation with UV light similarly furnished smaller particles from the apolar precursor, and barely any larger NP agglomerates were observed in such samples. These findings suggest that the polar backbone allows for a significantly faster diffusion of released Pt atoms, while possibly also stabilizing formed NPs and accelerating the nucleation and growth process itself. Next to the faster process of NPs formation, PTHF-based precursors also facilitate lithographic processing. Non-exposed PTHF precursor materials can be selectively removed by a simple solvent wash, which was more challenging to achieve in the case of previously investigated poly(ethylene-co-butylene) materials without damaging the structural integrity of the exposed sample regions. Finally, the enhanced diffusion of reagents through polar PTHF matrices renders these materials suitable for versatile applications as catalysts. Thus, a tangible catalytic activity of poly(ethylene-co-butylene) composites for the decomposition reaction of hydrogen peroxide was only observed in ethyl acetate solutions, in which PTHF composites display an increased activity, while also catalysing the reaction in aqueous solutions. Our findings, hence, show that the nature of the macromonomer influences both the formation of NPs and the properties of the nanocomposites, readily enabling a tailored preparation of versatile composite materials under relatively mild conditions.
Author contributions
C.C., L.M.O., C.W., and S.S. developed the original concept for the study and designed the materials and experiments. C.C. synthesized and characterized the materials and performed the experiments with help from L.M.O. and C.P.M. E.O. performed HR-TEM imaging experiments. A.I. analysed the SAXS measurements and helped with the determination of particle size distributions. All authors discussed the results and contributed to the interpretation of the data. C.C., A.I., C.W., and S.S. wrote the paper. All authors contributed to editing of the manuscript.Conflicts of interest
The authors declare no conflicts of interest.Acknowledgements
The authors gratefully acknowledge Bodo Wilts and Andrea Palumbo (Adolphe Merkle Institute) for helpful discussions. C. C., L. M. O., S. S., and C. W. gratefully acknowledge financial support through the Swiss National Science Foundation (Grant No. 200020_172619) and the Adolphe Merkle Foundation. A. I. acknowledges funding by the European Union's Horizon 2020 research and innovation programme under the Marie Skłodowska-Curie grant agreement no. 891084.References
- J. Kao, K. Thorkelsson, P. Bai, B. J. Rancatore and T. Xu, Chem. Soc. Rev., 2013, 42, 2654–2678 RSC.
- R. Shenhar, T. B. Norsten and V. M. Rotello, Adv. Mater., 2005, 17, 657–669 CrossRef CAS.
- F. Faupel, V. Zaporojtchenko, T. Strunskus and M. Elbahri, Adv. Eng. Mater., 2010, 12, 1177–1190 CrossRef CAS.
- J. Xu, L. Chen, H. Choi, H. Konish and X. Li, Sci. Rep., 2013, 3, 1–5 Search PubMed.
- S. Fu, Z. Sun, P. Huang, Y. Li and N. Hu, Nano Mater. Sci., 2019, 1, 2–30 CrossRef.
- Z. Zou, C. Zhu, Y. Li, X. Lei, W. Zhang and J. Xiao, Sci. Adv., 2018, 4, 1–9 Search PubMed.
- A. C. Balazs, T. Emrick and T. P. Russell, Science, 2006, 314, 1107–1110 CrossRef CAS PubMed.
- J. Zhu and M. C. Hersam, Adv. Mater., 2017, 29, 1603895 CrossRef PubMed.
- H. J. Kwon, K. Shin, M. Soh, H. Chang, J. Kim, J. Lee, G. Ko, B. H. Kim, D. Kim and T. Hyeon, Adv. Mater., 2018, 30, 1704290 CrossRef PubMed.
- X. Tian, X. Zhao, Y. Q. Su, L. Wang, H. Wang, D. Dang, B. Chi, H. Liu, E. J. M. Hensen, X. W. Lou and B. Y. Xia, Science, 2019, 366, 850–856 CrossRef CAS PubMed.
- M. T. Y. Paul and B. D. Gates, Sci. Rep., 2019, 9, 4161 CrossRef PubMed.
- T. Hanemann and D. V. Szabó, Materials, 2010, 3, 3468–3517 CrossRef CAS.
- M. L. Kung, P. Y. Lin, S. W. Peng, D. C. Wu, W. J. Wu, B. W. Yeh, M. H. Tai, H. S. Hung and S. Hsieh, Appl. Mater. Today, 2016, 4, 31–39 CrossRef.
- J. Sarfraz, T. Gulin-Sarfraz, J. Nilsen-Nygaard and M. K. Pettersen, Nanomaterials, 2021, 11, 1–27 Search PubMed.
- Q. Dong, Z. Meng, C. L. Ho, H. Guo, W. Yang, I. Manners, L. Xu and W. Y. Wong, Chem. Soc. Rev., 2018, 47, 4934–4953 RSC.
- Q. Dong, G. Li, C. L. Ho, M. Faisal, C. W. Leung, P. W. T. Pong, K. Liu, B. Z. Tang, I. Manners and W. Y. Wong, Adv. Mater., 2012, 24, 1034–1040 CrossRef CAS PubMed.
- Q. Dong, G. Li, C. L. Ho, C. W. Leung, P. W. T. Pong, I. Manners and W. Y. Wong, Adv. Funct. Mater., 2014, 24, 857–862 CrossRef CAS.
- Q. Dong, G. Li, H. Wang, P. Wing-Tat Pong, C. W. Leung, I. Manners, C. L. Ho, H. Li and W. Y. Wong, J. Mater. Chem. C, 2015, 3, 734–741 RSC.
- Y. Pan, R. Jia, J. Zhao, J. Liang, Y. Liu and C. Liu, Appl. Surf. Sci., 2014, 316, 276–285 CrossRef CAS.
- N. J. S. Costa, M. Guerrero, V. Collière, É. Teixeira-Neto, R. Landers, K. Philippot and L. M. Rossi, ACS Catal., 2014, 4, 1735–1742 CrossRef CAS.
- I. Pastoriza-Santos, C. Kinnear, J. Pérez-Juste, P. Mulvaney and L. M. Liz-Marzán, Nat. Rev. Mater., 2018, 3, 375–391 CrossRef.
- K. J. Si, D. Sikdar, L. W. Yap, J. K. K. Foo, P. Guo, Q. Shi, M. Premaratne and W. Cheng, Adv. Opt. Mater., 2015, 3, 1710–1717 CrossRef CAS.
- D. P. Song, C. Li, W. Li and J. J. Watkins, ACS Nano, 2016, 10, 1216–1223 CrossRef CAS PubMed.
- D. P. Song, A. Naik, S. Li, A. Ribbe and J. J. Watkins, J. Am. Chem. Soc., 2016, 138, 13473–13476 CrossRef CAS PubMed.
- J. W. Barnett and S. K. Kumar, Soft Matter, 2019, 15, 424–432 RSC.
- L. Guo, J. A. Jackman, H. H. Yang, P. Chen, N. J. Cho and D. H. Kim, Nano Today, 2015, 10, 213–239 CrossRef CAS.
- L. Liu and A. Corma, Chem. Rev., 2018, 118, 4981–5079 CrossRef CAS PubMed.
- B. Shen and S. Sun, Chem. – Eur. J., 2020, 26, 6757–6766 CrossRef CAS PubMed.
- P. Chen, Y. Liu, J. S. Du, B. Meckes, V. P. Dravid and C. A. Mirkin, J. Am. Chem. Soc., 2020, 142, 7350–7355 CrossRef CAS PubMed.
- Z. Meng, F. Xiao, Z. Wei, X. Guo, Y. Zhu, Y. Liu, G. Li, Z. Q. Yu, M. Shao and W. Y. Wong, Nano Res., 2019, 12, 2954–2959 CrossRef.
- S. W. Lee, J. R. Kumpfer, P. A. Lin, G. Li, X. P. A. Gao, S. J. Rowan and R. M. Sankaran, Macromolecules, 2012, 45, 8201–8210 CrossRef CAS.
- A. Winter and U. S. Schubert, Chem. Soc. Rev., 2016, 45, 5311–5357 RSC.
- L. M. Olaechea, L. Montero de Espinosa, E. Oveisi, S. Balog, P. Sutton, S. Schrettl and C. Weder, J. Am. Chem. Soc., 2020, 142, 342–348 CrossRef CAS PubMed.
- W. Caseri and P. S. Pregosin, Organometallics, 1988, 7, 1373–1380 CrossRef CAS.
- M. Gianini, W. R. Caseri and U. W. Suter, J. Phys. Chem. B, 2001, 105, 7399–7404 CrossRef CAS.
- K. P. Pernstich, M. Schenker, F. Weibel, A. Rossi and W. R. Caseri, ACS Appl. Mater. Interfaces, 2010, 2, 639–643 CrossRef CAS PubMed.
- C. Huber, A. Kokil, W. R. Caseri and C. Weder, Organometallics, 2002, 21, 3817–3818 CrossRef CAS.
- C. Huber, F. Bangerter, W. R. Caseri and C. Weder, J. Am. Chem. Soc., 2001, 123, 3857–3863 CrossRef CAS PubMed.
- A. Kokil, I. Shiyanovskaya, K. D. Singer and C. Weder, J. Am. Chem. Soc., 2002, 124, 9978–9979 CrossRef CAS PubMed.
- H. Takeshita, M. Poovarodom, T. Kiya, F. Arai, K. Takenaka, M. Miya and T. Shiomi, Polymer, 2012, 53, 5375–5384 CrossRef CAS.
- J. Boita, L. Nicolao, M. C. M. Alves and J. Morais, Phys. Chem. Chem. Phys., 2014, 16, 17640–17647 RSC.
- A. Fournet and G. Guinier, Small-Angle Scattering of X-Rays, John Wiley & Sons, Inc., New York, 1955 Search PubMed.
- P. J. Chupas, K. W. Chapman, G. Jennings, P. L. Lee and C. P. Grey, J. Am. Chem. Soc., 2007, 129, 13822–13824 CrossRef CAS PubMed.
- J. Teixeira, J. Appl. Crystallogr., 1988, 21, 781–785 CrossRef.
- J. J. De Yoreo, P. U. P. A. Gilbert, N. A. J. M. Sommerdijk, R. L. Penn, S. Whitelam, D. Joester, H. Zhang, J. D. Rimer, A. Navrotsky, J. F. Banfield, A. F. Wallace, F. M. Michel, F. C. Meldrum, H. Cölfen and P. M. Dove, Science, 2015, 349, aaa6760 CrossRef PubMed.
- M. Burnworth, L. Tang, J. R. Kumpfer, A. J. Duncan, F. L. Beyer, G. L. Fiore, S. J. Rowan and C. Weder, Nature, 2011, 472, 334–337 CrossRef CAS PubMed.
- J. Sautaux, F. Marx, I. Gunkel, C. Weder and S. Schrettl, Nat. Commun., 2022, 13, 356 CrossRef CAS PubMed.
- R. Serra-Maia, M. Bellier, S. Chastka, K. Tranhuu, A. Subowo, J. D. Rimstidt, P. M. Usov, A. J. Morris and F. M. Michel, ACS Appl. Mater. Interfaces, 2018, 10, 21224–21234 CrossRef CAS PubMed.
- S. Özkar, Dalton Trans., 2021, 50, 12349–12364 RSC.
Footnote |
| † Electronic supplementary information (ESI) available: Fig. S1–S31, Tables S1–S5, and a comprehensive account of all experimental details, including synthetic procedures, analytical data, and NMR spectra. See DOI: 10.1039/d2py00071g. The source data of this study are available from the Zenodo repository at DOI: 10.5281/zenodo.6342050. |
| This journal is © The Royal Society of Chemistry 2022 |