Biomass derived self-assembled DNA-dot hydrogels for enhanced bacterial annihilation

Suman Nayak a, Prakash Kumar b, Ravi Shankar a, Asish Kumar Mukhopadhyay c, Debabrata Mandal b and Prolay Das *a
aDepartment of Chemistry, Indian Institute of Technology Patna, Patna-801103, Bihar, India. E-mail: prolay@iitp.ac.in
bDepartment of Biotechnology, National Institute of Pharmaceutical Education and Research, Hajipur-844102, Bihar, India
cDivision of Bacteriology, ICMR-National Institute of Cholera and Enteric Diseases, Kolkata, India

Received 12th July 2022 , Accepted 7th October 2022

First published on 7th October 2022


Abstract

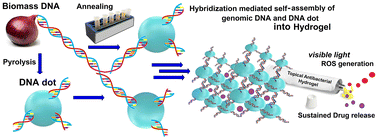
Nanotization of biomass for interesting biomedical applications is still in the nascent stage with no visible market available products. While products derived from biomass DNA and protein have unquestionable biocompatibility, induction of desired properties needs careful manipulation of the biomolecules. Herein, for the first time, we report the transformation of onion derived biomass DNA into DNA-dots through its partial hydrothermal pyrolysis to induce improved mechanical and photophysical properties. The DNA-dots were further used as crosslinkers to create a hydrogel through hybridization-mediated self-assembly with untransformed genomic DNA. The DNA dot–DNA hydrogel sustainably delivers the ciprofloxacin antibiotic as well as produces on-demand reactive oxygen species (ROS) with visible light irradiation. This prompted us to explore the hydrogel as a topical formulation for combination antibiotic Antibacterial-Photodynamic Therapy (APDT) applications. Remarkable annihilation of E. coli and S. aureus, and most importantly two drug-resistant strains of E. coli, shows the success of our sustainable approach.


Introduction

The non-genetic aspects of DNA are most frequently demonstrated in its use as a generic polymer to design scaffolds, dendrimers, nano-assemblies, hydrogels, and mechanical meta gels.1–4 Careful selection of the DNA sequence and its subsequent synthesis is a prerequisite for creating functional biomaterials.5 However, the cost factor associated is obvious that comes as a barrier to a smooth laboratory-to-market transition. In contrast, nature has gifted us with rich sources of DNA which are essentially biomass. Using biomass as a steady source of DNA is not only cost-effective, but also extremely environmentally friendly compared to the energy requirement of laboratory or industrial scale synthesis,6,7 as an example, the exceptionally high content of DNA in onion, which is cheap (50 cents to 2 USD per kg) and available across the globe and throughout the year. The DNA extraction from onion requires minimal chemicals and is fast and easy and the procedure is well established that could be easily scaled up at the industrial level. Even the major ingredient of extraction (ethanol) could be easily recycled and the biomass waste after extraction can be processed for use in the food industry (dry onion powder), cattle feed, or organic fertilizers. This essentially points to a sustainable plant source of DNA for its use in nano-formulations for novel applications. However, it requires a sustained effort to manipulate biomass DNA to suit the application for which needful chemical transformations are warranted. Herein, for the first time, we report the creation of a topical hydrogel from onion biomass DNA through hybridization-mediated self-assembly, but not before transforming the DNA into DNA-dots inducing interesting properties to the hydrogel.

Opinions regarding the clinical efficacy of topical antibiotics are inconsistent. Given the increasing antimicrobial resistance and targeted availability of drugs at the desired site, the use of topical antibiotic therapy is still predominant in clinical practice.8,9 The matrix of topical antibiotic gels differs from one formulation to another with paraffin or petrolatum, mineral oil, and waxy/fatty alcohol combinations being the dominant candidates and parabens as stabilizers.10 However, many of these can trigger allergic reactions to sensitive and damaged skin, usher in endocrine disruption, and show expedited absorption in the skin but not in damaged skin or open wounds.11 Moreover, the antibiotics embedded within them have to diffuse from the hydrophobic matrix to the affected cells which may be time-consuming with compromised efficacy. Thus with ample scope for improvement, we hypothesize that a sustainable formulation may be at hand where DNA derived from biomass (onion, a plant source) could be used in a hydrogel formulation for topical applications.

In recent decades, DNA has been used as functional macromolecules for the construction of a variety of polymeric materials including DNA hydrogels, dendrimer-like DNA, and DNA nanoparticles that are structurally programmable and biodegradable.6,7,12,13 Outstanding biocompatibility, biodegradability, nutrient permeability, self-healing ability, adjustable viscoelastic properties, protease stability, and multi-stimuli responsiveness are some of the advantages that come along with it.14,15 Because of the strongly hydrophilic polyelectrolyte content, DNA can absorb large amounts of water, attracting interest in DNA-based hydrogel designing.14,16,17 With regard to topical antimicrobials, DNA-hydrogels were created through the noncovalent assimilation of DNA and tetrakis (hydroxymethyl) phosphonium sulfate (THPS) as a topical antibacterial agent for wound healing application.18 Peptide-loaded cross-linked DNA nanostructures were also developed for similar applications.19 Salmon sperm DNA and oligo (phenylene ethynylene) (OPE) based DNA hydrogels were reported for antimicrobial Photodynamic Therapy (PDT) with OPEs acting as a photosensitizer.20 A series of DNA-based hybrid hydrogels through covalent conjugation with protoporphyrin IX (PpIX) and/or Carbon Dots (CDs) were self-assembled, which exhibited light-triggered ROS generation for antibacterial PDT (APDT) applications.21–23 However, in all the nano-assemblies reported, none of them used plant genomic DNA (biomass DNA). Also, to the best of our knowledge, none of the DNA-based hydrogels developed so far could act against drug-resistant bacterial strains from clinical isolates.

Due to the lower mechanical strength of only DNA-based hydrogels, organic crosslinkers with organic solvents/high temperature are introduced for enhanced strength and stability.6,7,24,25 Few DNA-based hydrogels with carbon nanoparticles as cross-linkers were reported to impart interesting properties to the hydrogel although these may not be free from toxicological implications.22,23,26,27 We envisioned the use of DNA itself to transform them into DNA nanoparticles (DNA derived dots, represented as DNA dots herein, similar to the carbon dot terminology), through their partial pyrolysis. DNA dots not only act as crosslinkers in the hybridization-mediated self-assembly with untransformed genomic DNA, but also add photoluminescence properties to the hydrogel for tracking. The photophysics of the hydrogel was further enriched through PpIX intercalation in DNA during the partial pyrolysis process. PpIX is an established photosensitizer for PDT applications with ubiquitous plant and animal sources.28,29 This hints toward the potential application of the hydrogel in combination with antibacterial therapy following the loading of the hydrogel with relevant antibiotics. Needless to mention here is that the potency of the formulation could be tuned by adjusting the PpIX content, time of light irradiation, antibiotic loading, and others, giving us a big window for personalized superficial wound management.

Results and discussion

Synthesis and characterization of onion DNA and DNA dots

An aqueous solution of the DNA extracted from onion showed a characteristic peak at 260 nm in UV-Vis spectra from which the concentration was determined (OD = 0.5, 1 mg mL−1) (Fig. S1, ESI).21–23 A calculated amount of PpIX was intercalated to the DNA by incubation before the DNA is transformed into DNA dots. The synthesis of DNA nanoparticles or DNA dots using the biomass DNA was achieved by the hydrothermal method at 150 °C that primarily involves the bond breaking and making process followed by partial carbonization (Scheme 1). The DNA dots intended for downstream applications were obtained after purification by centrifugation, syringe filtration, and dialysis to eliminate big aggregates, un-intercalated PpIX, etc.23
image file: d2nr03810b-s1.tif
Scheme 1 Schematic representation of the synthesis of DNA dots from biomass DNA, the formation of a hydrogel through hybridization of DNA dot–genomic DNA and potential application in enhanced bacterial annihilation including resistant strains.

The success of the transformation of biomass DNA into DNA dots was first ascertained through agarose gel electrophoresis (Fig. 1A) where a discrete band was observed other than the band for untransformed genomic DNA and PpIX.12 The absence of the PpIX band in the DNA dot band is noteworthy which proves that PpIX is not loosely present in the DNA dot solution and is eliminated during purification. Another interesting observation is that, unlike genomic DNA, the DNA dot band does not need any ethidium bromide staining to be visible under transillumination due to its intrinsic fluorescence. However, the band does take mild ethidium bromide staining which points to the presence of DNA on the surface of the DNA dots. The formation of DNA dots was also established by RP-HPLC (Fig. 1B), where the retention time of the DNA dots (∼7 min) was found to be distinctly different from that of only DNA (∼11.5 min) with an in-house developed Tris·HCl and acetonitrile solvent system.


image file: d2nr03810b-f1.tif
Fig. 1 (A) Agarose gel electrophoresis showing bands corresponding to genomic DNA, PpIX, and DNA dots before (left) and after (right) ethidium bromide staining. (B) RP-HPLC shows a distinct retention time of genomic DNA and DNA dots. (C) DLS study to obtain the average hydrodynamic radii of DNA dots. (D) TEM image of DNA dots and the corresponding size distribution histogram (inset) of DNA dots. (E) TEM image of DNA dots in higher resolution. (F) AFM image and height profile (inset) of DNA dots.

The DLS study of DNA dots showed a broad size distribution, having an average hydrodynamic diameter of ∼65 nm (Fig. 1C). Due to the presence of DNA strands on the surface, the overall zeta potential of DNA dots was negative (−5 mv), although understandably less negative than untransformed DNAs (−43 mv) (Fig. S2, ESI). The morphology and structure of the DNA dots were characterized by TEM and AFM studies. TEM analysis of the synthesized DNA dot showed the presence of polydispersed particles and an average diameter of ∼21 nm (Fig. 1D and E).26 A high-resolution TEM (HRTEM, Fig. S3, ESI) image suggests that a single nanoparticle may also possess domains of different structures attributed to controlled yet random pyrolysis of the genomic DNA.30 The AFM image confirms the presence of spherical and well-dispersed particles having an average height of ∼10 nm (Fig. 1F and S4A, ESI). The DNA dots were synthesized at comparatively lower temperatures and for a shorter time duration than normal carbon dot synthesis. This resulted in partial carbonization of the DNA and ensures the presence of DNA strands on the surface of the DNA-dots, required for downstream hydrogel formation through annealing. Because of partial carbonization, heterogeneous particle distribution was observed in the TEM and AFM images.

The powder XRD diffractogram of the DNA dots showed two peaks at around 29.2° (002) and 41.4° (100), but the broadness of the peaks suggests that the as-synthesized DNA dots have significant amorphous nature (Fig. S4B, ESI).30 This is well correlated with the results obtained from the Selected Area Electron Diffraction (SAED) pattern of TEM analysis where the amorphous nature of the DNA dot was also observed (Fig. S4C, ESI). This is further supported by Raman spectra where two peaks with less intensity were observed at 1320 cm−1 and 1530 cm−1 corresponding to the disordered D and crystalline G band, respectively (Fig. S4D, ESI), indicating the presence of amorphous carbon within the DNA-dot structure.31 The energy dispersive spectrometry (EDS) analysis of the DNA dot confirmed the presence of Carbon (C), Nitrogen (N), Phosphorus (P), and Oxygen (O) in it (Fig. S5, ESI).

The Fourier transform infrared spectroscopy (FT-IR) of both onion genomic DNA and DNA dots showed almost similar vibrational bands (Fig. 2A).7 A broad peak near ∼3300 cm−1 (O–H, N–H stretching), 2925 cm−1 (C–H stretching), 1650 cm−1 (C[double bond, length as m-dash]O stretching), 1393 cm−1 (C–O stretching), and 1257 cm−1 (N–O bending) and strong bands around 1112 cm−1 and 985 cm−1 (P[double bond, length as m-dash]O stretching and O–P–O bending) were observed in both genomic DNA as well as DNA dots, indicating the presence of –C[double bond, length as m-dash]O, –OH, –NH2 and –PO4 functional groups on the surface of DNA dots as well. The resemblance is important since it proves that the DNA dots also have DNA fragments on their surface resulting from incomplete pyrolysis of biomass DNA which was done only at 150 °C making it conducive for downstream annealing and crosslinking. Signature positive and negative peaks at 276 nm and 246 nm respectively corresponding to the B-conformation of DNA were observed for the biomass genomic DNA (Fig. 2B) in circular dichroism spectra.32 Similar peaks were observed for DNA dots, albeit noisier, indicating the presence of DNA fragments as a fallout of partial carbonization of few DNA strands during the transformation of DNA dots, which nicely correlated with the FTIR findings.


image file: d2nr03810b-f2.tif
Fig. 2 (A) FTIR spectra of only DNA and DNA dots. (B) Circular dichroism spectra of DNA and DNA dots. (C) UV-Vis spectra of genomic DNA, DNA dots, PpIX, and genomic DNA + PPIX physical mixture. (D) Excitation-dependent fluorescence emission of DNA dots. (E) Fluorescence lifetime of the DNA dots.

The DNA dots exhibited a peak at 260 nm in the UV-Vis absorption spectra with a broad absorption band at 450 nm (Fig. 2C).21–23 While the 260 nm absorption corresponds to DNA fragments on the surface of the DNA dots, absorption at a higher wavelength is attributed to the n–π*/π–π* electron transfer from the different fluorophore (C[double bond, length as m-dash]O, –NH2, C–O) as well as from the energy levels of the trapped PpIX present in the DNA dots. The fluorescence quantum yield of DNA dots was found to be ∼4.1% with respect to quinine sulfate (QY = 0.55) in 0.5 M H2SO4, as a standard.33 The DNA dots showed optimal excitation and emission wavelengths at 450 nm and 550 nm, respectively (Fig. 2D) with weak cyan-colored visible fluorescence on a transilluminator upon 365 nm irradiation. Excitation-dependent fluorescence was observed due to the presence of plentiful fluorophores residing in a different chemical environment in the DNA dots, very similar to polymer dots.34 The fluorescence lifetime (Fig. 2E and Table 1, ESI) of the DNA dots showed tri-exponential fitting with an average lifetime of 4.1 ns, which also indicates the presence of diverse fluorophores. Such lifetime decay is not applicable to pure genomic DNA, which is indirect proof of the chemical transformation of the genomic DNA through pyrolysis.

Characterization of the DNA-hydrogel

The DNA hydrogel was fabricated by annealing the DNA dots and untransformed biomass genomic DNA by heating at 95 °C for 10 minutes followed by slow cooling that engages genomic DNA and surface DNA fragments of the DNA dot to crosslink by hybridization. Consequently, the slow cooling transforms the sol state into the gel state of the self-assembled DNA dot and DNA. The DNA dot–DNA hydrogel appeared as a pale yellowish-white semi-solid material showing weak yellow fluorescence upon UV light exposure (Fig. 3A). Once again, we employed agarose gel electrophoresis and RP-HPLC to ascertain the self-assembly where the restricted mobility of the DNA dot–DNA band and higher retention time were observed respectively due to the formation of a longer polymeric network, with an increased effective mass of the sample compared to free genomic DNA or DNA dots (Fig. 3B and Fig. S6A, ESI). The DNA dot–DNA self-assembly showed a shoulder peak at ∼260 nm in the UV-Vis spectra (Fig. S6B, ESI), whereas it showed emission at ∼550 nm upon 450 nm excitation with a similar average lifetime (4.1 ns) to DNA dots (Fig. S6C and S6D and Table 1, ESI), confirming their retention in the annealed product. The conformation of the annealed product also showed signature positive and negative peaks at 270 nm and 240 nm respectively corresponding to the B-conformation of DNA (Fig. S7, ESI) in circular dichroism.
image file: d2nr03810b-f3.tif
Fig. 3 (A) Digital images of the synthesized DNA hydrogel under normal and UV light. (B) Gel electrophoresis image of the DNA dot–DNA, before and after staining. (C) FE-SEM image of the DNA hydrogel (0.5 mg ml−1 of DNA dots). (D) Frequency sweep test of the hydrogel (1 mg ml−1 of the DNA dot) at 0.1% strain.

Hydrogels (5%), with different concentrations of the DNA dot (0, 0.3, 0.5, 0.7, 1 mg ml−1, 100 μl), showed different stiffness that increased with increasing concentration of the DNA dot indicating its crosslinking role (Fig. S8, ESI). The non-porous morphology of the gel assembled with only genomic DNA is evident in FESEM studies (Fig. S9A, ESI) that drastically changed with the appearance of a larger porous network when the hydrogel was assembled with both genomic DNA and DNA dots (0.3 mg ml−1) (Fig. S9B, ESI).22,23 More interestingly, with an increase in the concentration of DNA dots (0.5 mg ml−1 or more), a highly porous matrix with a smaller pore size was observed due to enhanced crosslinking by the DNA dots (Fig. 3C and Fig. S9C, ESI). The rheological behavior and mechanical strength of the hydrogel were investigated by evaluating the storage modulus (G′) and the loss modulus (G′′) as a function of frequency, which characterize the elasticity, rigidity, and plasticity of the hydrogels.22 In the hybrid hydrogel, with an increase in the concentration of the DNA dot, the mechanical properties increase, where the higher G′ value compared to G′′ suggested the elastic nature of the hydrogels (Fig. 3D and Fig. S10, ESI).

The responsiveness of the DNA hydrogel towards different stimuli was studied concerning temperature, DNase, pH and redox. An increase in the temperature of the DNA-hydrogel to 95 °C essentially strips off the hydrogen bonds in DNA transforming the hydrogel into the sol form, while the gel form was obtained through slow cooling after reinstating the hydrogen bonds. Thus, the thermo responsive sol–gel transition was achievable through heating and cooling cycles (Fig. S11, ESI). The sensitivity of the DNA hydrogel (200 μL) towards DNase was studied after its incubation with DNase enzyme (50 μL, conc. 200 μg mL−1) for 30 min.22 A noteworthy reduction in the stiffness of the hydrogel is observed where DNAse provides the hydrogel with a quasi-liquid semi-solid matrix due to the hydrolytic cleavage of phosphodiester linkages in the DNA backbone (Fig. S12, ESI).

We also studied the pH responsiveness of the hydrogel by varying the pH from 2 to 11. At pH 2, no hydrogel was formed, and only agglomeration of the DNA was observed, because of depurination at acidic pH. Similarly, at pH 11, no hydrogel formulation was observed because of the denaturation of the DNA strand due to the abundance of hydroxide ions. However, due of the stability of the DNA molecule in the pH range 5 to 9, better mechanical stability of the DNA dot–DNA hydrogel formulation was obtained similar to that of neutral pH as shown by rheological studies (Fig. S13A and B, ESI). The redox responsiveness of the synthesized hydrogel was studied by adding an external oxidizing and reducing agent. Sodium hypochlorite was used as an oxidizing agent and significant reduction in the stiffness of the hydrogel was observed after its addition due to irreversible oxidative DNA damage. Furthermore, ascorbic acid was used as a reducing agent where no significant stiffness changes were observed (Fig. S13C, ESI). Overall, the pH and redox responsiveness of the hydrogel is not noteworthy that could do value addition to that of the temperature responsiveness.

Study of the in vitro drug release and ROS generation hydrogel

Ciprofloxacin (Cpfx) was encapsulated in the DNA dot–DNA hybrid hydrogel by simple incubation in the solution phase. The hydrogel was found to have a high loading efficiency of ∼96% for Cpfx that was determined spectrophotometrically.22,35 Furthermore, Cpfx loading in the hydrogel was monitored by a change in its UV-Vis absorption in the solution by UV-Vis spectroscopy. The Cpfx gets trapped in close cavities of the hydrogel by virtue of the interaction with its functional groups with the DNA nucleobases.

To determine the release profile of encapsulated Cpfx, the hydrogel was incubated in a PBS buffer of pH 7.4 (normal physiological pH).35 The PBS solution was collected and replaced with fresh buffer for drug release at different time intervals. The digital images of the gel obtained during the drug release study revealed the changes in the size of the hydrogel due to degradation with time and subsequent release of the drug from the gel mostly through erosion (Fig. 4A). The release of the drug from the gel was calculated from the absorbance of the total drug encapsulated in the hydrogel and the absorbance of PBS buffer containing Cpfx, collected at different time intervals, and was found to be dependent on the extent of cross-linking and interaction of the drug with DNA. The interaction of Ciprofloxacin with double-strand DNA is intercalative, which is why an initial burst release is observed for the first fifteen minutes or so when the concentration of Cpfx is very high and the hydrogel is fully swelled. But this initial burst release observation is not due to the availability of free Cpfx in the hydrogel. The gradual decrease of Cpfx concentration in the hydrogel was observed due to the slow degradation of the gel through erosion. The sustained release was observed for the gel incubated at pH 7.4 for 5 days which amounts to a cumulative ∼97% of the total encapsulated Cpfx (Fig. 4B).


image file: d2nr03810b-f4.tif
Fig. 4 (A) Digital images of the hydrogel at a different time interval during the drug release. (B) Release kinetics of Cpfx from the DNA–DNA dot hydrogel at physiological pH. (C) Fluorescence spectra of ROS generation in the presence of 123-DHR by DNA dots in hydrogel formulation, under the visible light. (D) MTT assay of only hydrogel (Hg) and the Cpfx loaded hydrogel (Hg-Cpfx) against THP-1 cells, under different conditions.

Previous research has shown that many carbon dots (CDs) are adept at ROS generation on irradiation with normal light in the visible region.22,23,33 Assuming the considerable pyrolization of the DNA into DNA dots similar to CDs, this prompted us to irradiate the DNA-dots in hydrogels with visible light from a tungsten source (100 Watts) to evaluate ROS generation using non-fluorescent DHR 123 as a probe that is converted to fluorescent rhodamine 123 on exposure to ROS (Fig. 4C). Although the amount of ROS generated from DNA-dots present in the DNA-hydrogel was found to be consistently lower than that from pristine DNA-dots, the ROS generation ability of the DNA-dots is still significantly retained in the hydrogel.

Cytotoxicity assay

It is important to assess the host-cell toxicity of a topical formulation for its intended use in humans. Toxicological evaluations through the MTT assay were performed with only hydrogel (represented as HG in the figure), Cpfx, and the hydrogel loaded with Cpfx (represented as HG–Cpfx in the figure) (Fig. 4D and Fig. S14, ESI). After 72 h of incubation of THP-1 as well as Peripheral Blood Mononuclear Cells (PBMC cells) with different concentrations of Cpfx in Hg-Cpfx, it was observed that cell survival was practically unaltered with a concentration of Cpfx less or equal to 20 μg ml−1 (100 μl of HG–Cpfx solution contain ∼50 μg of DNA dots) under dark conditions. An insignificant drop in survival (∼88%) was noted at a Cpfx concentration of 20 μg ml−1, with 1 h of light irradiation with a 100 W tungsten lamp. However, AmB used as a positive control showed a significant decrease in cell survival to ∼65 and ∼50% of viability with 5 and 10 μM concentration of AmB as expected.36 Thus, the formulation showed a minimal toxicity effect conducive to topical applications.

Study of the antibacterial activity of the hydrogel formulation

The antibacterial activity of the hydrogel was studied in four strains, viz. E. coli (DH5α), E. coli Norfloxacin resistant (K12), E. coli multidrug-resistant (IDH 12138) and S. aureus (Fig. 5A–E). The effect of only Cpfx is the least in the E. coli resistant strain IDH12138 that showed ∼88 and ∼71% survival in the presence of 0.05 μg and 0.1 μg of Cpfx. S. aureus showed ∼31% and ∼12% survival in the presence of only Cpfx (0.05 μg and 0.1 μg respectively) quite similar to E. coli (DH5α) and E. coli Norfloxacin resistant (K12) strains. The hydrogel was loaded with Cpfx and further evaluated for its antibacterial activity in the presence and absence of light after required dilution. As expected, the hydrogel without Cpfx and any light exposure (dark, HG-D) used as a control does not show any significant killing (∼97% survival). A light exposed hydrogel (100 W tungsten lamp for 1 hour, HG-L) without Cpfx showed ∼69, ∼75, ∼81, and ∼87% survival for E. coli (DH5α), E. coli Norfloxacin resistant (K12), E. coli multidrug-resistant (IDH 12138) and S. aureus, respectively.
image file: d2nr03810b-f5.tif
Fig. 5 Antibacterial activity of only hydrogel and the drug-loaded hydrogel against (A) E. coli, (B) S. aureus, (C) E. coli resistant strain (K12), and (D) E. coli resistant strain (IDH12138), and (E) digital images correspond to the E. coli resistant strain (IDH12138) under different conditions.

The killing effect was drastically enhanced in our experimental conditions irrespective of the bacterial strains when the hydrogel was loaded with Cpfx (HG–Cpfx) and irradiated with a tungsten light source. Experiments are carried out under both dark (HG–Cpfx-D) and light irradiated (HG–Cpfx-L) conditions that demonstrated a ∼25 and ∼50-fold increase in killing efficacy against the S. aureus and E. coli multi-drug resistant strain IDH 12138 respectively while ∼60-fold enhanced activity was recorded for both E. coli (DH5α) and E. coli Norfloxacin resistant strains (K12) with light irradiation. This is encouraging since less than ∼2% survival was recorded with all the strains using the combination of light and Cpfx loaded in the hydrogel. We achieved ∼8-fold higher efficacy of bacterial cell killing with the light and Cpfx combination than Cpfx alone (0.1 μg) for S. aureus. But ∼15-fold increased efficacy was observed for E. coli (DH5α) and E. coli Norfloxacin resistant (K12) strains under similar conditions. Thus, increased potency was observed against the E. coli and Norfloxacin resistant strain (K12) compared to the S. aureus and E. coli multi-drug resistant strain (IDH 12138).

The assay was done after serial dilution of Hg-Cpfx but it was still enough to produce the ROS necessary to kill the bacteria by >97% in the presence of Cpfx. It is important to note that the multidrug-resistant strain (which is also Cpfx resistant) is significantly resistant to treatment with Cpfx alone or light irradiated HG, but in combination with Cpfx and light the killing is ∼98% (>50-fold increase in efficacy compared to Cpfx or HG alone) and almost similar to other strains (Fig. 5D). A similar trend was observed in the case of the Norfloxacin-resistant K12 strain where 1.3 to 13-fold killing was witnessed for HG dots and Cpfx alone. However, in HG–Cpfx (containing the same amount of DNA dots and Cpfx), under light irradiation, the killing efficacy is increased to ∼204 fold (Fig. 5C). This indicates that there is synergism in killing efficacy due to the presence of Cpfx and DNA dots which produces ROS. The membrane damaging effect of ROS generated from HG–Cpfx, even in low concentrations is enough to kill the drug-resistant bacteria under light irradiation due to increased local concentration of the Cpfx internalized through the damaged membrane of Gram-negative bacteria.37 Furthermore, the killing is equally effective against the bacteria irrespective of whether it is Gram-positive or Gram-negative (Fig. 5A and B). The killing efficacy of the hydrogel under low intensity and a shorter time duration of light source was evaluated against the multi-drug resistant strain since both factors contribute to the bacterial killing and PDT.38 CFU analysis indicates that when the light source intensity was decreased from 100 W to 20 W (5 fold reduction), cell survival only increased ∼3 fold for the Cpfx loaded hydrogel (Fig. S15, ESI). These data suggest that light intensity is important but even more important is the synergetic action of ROS and Cpfx that could affect significant bacterial cell killing with reduced ROS. When light exposure was reduced from 1 h to 12 minutes (5-fold reduction), there is no significant change in killing either where the cell viability increased marginally from ∼1.7 to ∼2.1% with reduced time. Under similar conditions, for HG–Cpfx (0.05 μg ml−1), the killing efficacy changed from ∼18 to ∼21% (Fig. S16, ESI). Therefore, the effectiveness of transient ROS in damaging the bacterial membrane and the synergism of ROS and Cpfx are the reasons for high efficacy in killing even in a shorter time duration of light exposure.

We also performed the minimal inhibitory concentration (MIC) experiment and found more efficacy in light-induced HG–Cpfx in comparison to uninduced and only Cpfx which is well correlated with the CFU data. The MIC of Cpfx alone is ∼5 times higher than the MIC of light irradiated HG–Cpfx (Table 2, ESI). Furthermore, the MIC of HG–Cpfx (under darkness) is ∼50 times higher than that of Hg-Cpfx (under light) against DH5α and K12 strains. Also, against the multidrug-resistant strain, the MIC of HG–Cpfx (under light) is ∼100 times lower than that of HG–Cpfx (under darkness). Since the strain is Cpfx-resistant, Cpfx alone has a MIC ∼250 times higher than light irradiated HG–Cpfx having the same loaded concentration of Cpfx. This indicates again the effect of light-induced ROS generation from DNA dots as the important factor in bacterial killing irrespective of the nature of the bacterial strain used. The zone of inhibition assay (ZOI) (Fig. S17, ESI) with resistant K12 strains proves that the hydrogel having a very low concentration of Cpfx can kill the bacteria under light-irradiated conditions significantly more than in the dark. HG–Cpfx under light with 0.5 μg per 100 μl of Cpfx creates a clear ZOI of 22.3 mm which is absent in the dark (Fig. S17B and C, ESI). The size of the ZOI does not increase significantly even with increasing dose, for example 22.3 and 31.6 nm of ZOI for 0.5 and 5 μg per 100 μl of HG–Cpfx indicates that 0.5 μg per 100 μl of HG–Cpfx under light irradiated conditions is enough to kill most of the bacteria as observed from CFU (Fig. 5C and S15, S16, ESI). We have observed very high killing of bacteria with doses of 0.05–0.1 μg of Cpfx in the HG–Cpfx hydrogel under light but negligible cytotoxicity even with 20 μg of Cpfx containing HG–Cpfx (Fig. 4D and Fig. S14, ESI). The hydrogel dose used for the cytotoxicity assay is ∼200-fold of the dose used for the CFU assay (Fig. 4A–D); therefore, this hydrogel is highly biocompatible and can be explored for a topical formulation for combination antibiotic APDT.39

Conclusions

Onion is one of the cheapest sources of biomass DNA, the extraction procedure of which is so well established that it finds mention in the curriculum of many undergraduate laboratory experiments in several universities and educational institutes throughout the world. Surprisingly, such a three-decade-long established procedure has not found any takers for furthering research with this inexpensive DNA source for meaningful applications. This prompted us to perform the nanotization of onion-extracted DNA and explore its suitability for developing formulations for topical biomedical applications. This was achieved through the hydrothermal pyrolysis of onion genomic DNA into DNA dots and subsequent hybridization mediated self-assembly with normal DNA to produce a hydrogel. The DNA dots and the hydrogel were well characterized and found to contain thermo-responsive sol–gel properties. The pre-intercalation of Protoporphyrin IX into the DNA destined for DNA dot transformation is our novel intervention to enrich the photophysics of the hydrogel for ROS generation. Cpfx was chosen as a model drug that was encapsulated in the DNA dot–DNA hybrid hydrogel to study its release kinetics. The hydrogel exhibited sustained release of the drug for 5 days owing to the dissolution of the hydrogel under physiological conditions. The hydrogel was instrumental in the effective annihilation of both Gram-positive and Gram-negative bacteria and most importantly could act against drug-resistant clinical isolates. Importantly, significant killing was observed even with a lower intensity of light or a shorter time of light irradiation due to the combined action of ROS and consequent internalization of Cpfx inside the bacterial cells. Therefore, irrespective of bacterial surface properties or drug resistance, the effect of APDT was very evident and supported by both CFU killing and MIC data. Thus, DNA dot–DNA-based stimuli-responsive hydrogels could be envisioned as an inexpensive topical formulation that uses a combination of antibiotics and APDT for effective superficial wound management even for multibacterial along with drug-resistant bacterial infections. The biomass-derived hydrogel platform also hints toward the prospects of loading growth factors or other relevant drugs for various relevant topical applications.

Experimental section

Materials

Protoporphyrins IX, ciprofloxacin, glycerol, bromophenol blue, ethidium bromide, and agarose was procured from Sigma-Aldrich. Ethanol and buffers were obtained from Sisco Research Laboratories (SRL, India). Chemicals are used as received. Nanopure water was used for synthesis and dilutions during spectroscopic analysis. Human THP1 cells were obtained commercially from NCCS, Pune and PBMCs were isolated from rats.

Instrumentation

Powder XRD (pXRD) analysis of the DNA dots was done with a Cu-Kα (λ = 1.54 A°) X-ray source on Empyrean, Malvern Panalytical instrument at a scanning rate of 2° per minute and a voltage of 10 kV in the 2θ range of 4° to 70°. Transmission Electron Microscopy (TEM) images were acquired on a JEM-F200 (Jeol, Japan) operating at 100 kV voltage with samples deposited on carbon-coated copper grids. Fourier transform-infrared spectroscopy (FTIR) experiment was done using a Parkin Elmer Spectrum-400 using a KBr pellet in the range of 400–4000 cm−1. Rheological studies of the hydrogel were carried out on a modular compact rheometer (Anton Paar, MCR 302, Austria) by sweeping the frequency from 0.1 to 100 rad. s−1, at a constant strain of 0.1% at room temperature. UV-Visible absorption and steady-state fluorescence spectra were recorded on a UV-2550 spectrophotometer (Shimadzu, Japan) and Fluoromax-400 spectrofluorometer (Horiba, Japan), respectively. Field emission scanning electron microscopy (FESEM) images were obtained on a GeminiSEM 500 microscope (ZEISS) where lyophilized samples were placed on a carbon tap and further coated with Au. The AFM image was obtained by casting a small volume of freshly prepared DNA dots on APS mica and stretching it with a glass plate. Images were captured in intermittent non-contact mode atomic force microscopy (ACAFM) using a Keysight 5500 Scanning Probe Microscope using silicon nitride cantilevers (force constant 40 N m−1, Micromesh, Bulgaria) and the resonance frequency of cantilever oscillation ranging from 265 to 410 kHz. The confirmation of the onion DNA was done using circular dichroism spectra on a J-1500 spectropolarimeter (Jasco, Japan). Dynamic Light scattering (DLS) experiments were performed on Beckman Coulter, Desla™ Nano C Particle Analyzer. The zeta potential of the samples was analyzed using an Anton Paar (Litesizer 500) instrument. Digital images were obtained on a Canon D60 digital camera.

Synthesis and purification of DNA dots from onion DNA

DNA was extracted from an onion using standard procedures using sodium bicarbonate buffer and sodium lauryl sulphate,40 precipitated using sodium acetate and purified multiple times with ethanol wash, air-dried, and stored at 4 °C for further downstream processes.

DNA dots were synthesized by the hydrothermal method by dissolving DNA (20 mg) in 2 mL of water followed by the addition of glycerol (200 μL) and incubation with PpIX (100 μL, 10 mM). The resulting solution was transferred into a 5 ml Teflon-lined autoclave and heated at 150 °C for 6 h in an oven. The solution obtained was diluted to 10 mL with water and centrifuged at 10[thin space (1/6-em)]000 rpm, supernatant collected, and filtered through a 0.22 μm syringe filter to remove large aggregates. The synthesized DNA dot was further purified by dialysis with a dialysis membrane having a MWCO of 2 kDa with occasional water change for 48 h or until the complete removal of PpIX as confirmed by UV-Vis spectroscopy.

Hydrogel creation through self-assembly of DNA dot–DNA

Synthesis of the DNA hydrogel was achieved through hybridization of the DNA-dots with untransformed DNA (normal, purified onion DNA). 5 mg of normal DNA and 100 μl of DNA-dot solution with a series of dilutions (0, 0.3, 0.5, 0.7, or 1 mg ml−1) were heated at 95 °C for 10 min and allowed to cool slowly (0.1 °C min−1) to produce 5% hydrogel.7,41 The hydrogels thus obtained were subjected to various characterization studies.

Characterization of the DNA dot/hydrogel by gel electrophoresis and reverse phase HPLC

1% agarose gel electrophoresis was performed using TAE (Tris-Acetate-EDTA) buffer of pH 8, for 45 min at 90 volts and DNA bands were visualized after ethidium bromide staining.22,33 However, DNA dots and PpIX control did not require any staining and could be visible with UV transillumination. Gel images were captured with a digital camera.

Reverse Phase High-Performance Liquid Chromatography (RP-HPLC) was done on a Shimadzu Prominence analytical HPLC system (Shimadzu, Japan) that is connected with a controller (CBM-20Alite), pump (LC-20AD), and PDA detector (SPD-M20A) using a C18G (250 × 4.6 mm) column. Elution was done using an in-house developed profile particularly suitable to elute DNA. The mobile phase contained (95[thin space (1/6-em)]:[thin space (1/6-em)]5)% of 10 mM Tris·HCl buffer (pH 7.4) as eluent A and acetonitrile as eluent B. The flow rate was 0.2 ml min−1 with 25 ± 1 °C column temperature and 10 μl injection volumes.

Quantum yield calculation

To determine the quantum yield (QY) of the purified DNA dots comparatively, the following equation was employed:33
Φx = Φs × (Ixfsηx2/Isfxηs2)
where subscript x and s denote test and standard sample respectively; Φ is the fluorescence quantum yield; I is the integrated fluorescence intensity; f is the absorption factor (f = 1–10-A, where A = absorbance); and η is the refractive index of the solvent (1.33 for water). Quinine sulfate (QY = 0.55) in 0.5 M H2SO4 was used as a standard.
fs = 0.06, Is = 1.23 × 10⁸, fx = 0.07, Ix = 1.067 × 10⁷

Cpfx loading in DNA dot–DNA hydrogels and study of the release kinetics

300 μg (20 μl, 15 mg ml−1) of ciprofloxacin·HCl drug was added to DNA dot–DNA solution (5%) during the annealing process to trap the drug molecules within the 3D scaffold of the hydrogel. After the hydrogel formation, free drug molecules were removed by washing with phosphate buffer solution, and the encapsulation efficiency of the drug within the hydrogel framework was measured (eqn (1)). The loading capacity of Cpfx within the hydrogel was calculated by measuring the absorbance of the drug in the supernatant with a UV-Vis spectrophotometer.22
 
image file: d2nr03810b-t1.tif(1)

In vitro drug release from the hydrogel was studied at physiological pH (7.4) by immersing it in 200 μl phosphate buffered saline (PBS) with the removal of 100 μl of the buffer and replenishing it with fresh buffer (100 μl) at various intervals of time. The release profile (%) was calculated by subtracting the amount of drug released from the total amount of Cpfx absorbed in the hydrogel. Digital images of the hydrogel during the drug release process were also acquired to display the changes in the size of the hydrogel.

Study of the ROS generation efficiency

The efficiency of DNA dots, as well as the hydrogel for ROS generation, was studied in the presence of 5 μl, 2.5 nM dihydrorhodamine 123 (DHR123).22,23,33 The samples were irradiated with a tungsten bulb (Philips, 100 W) at approx. 15 cm distance on the ice pack to maintain the temperature of the solution. The buffer solution from the reaction medium was withdrawn for spectroscopic measurements at a fixed interval of time. The non-fluorescent DHR123 was oxidized to green fluorescent rhodamine 123 in the presence of ROS generated from the DNA dot. The fluorescence spectra were recorded in the wavelength range of 490–600 nm, at different time intervals (480 nm excitation wavelength).

Cytotoxicity assays

Cytotoxicity was measured against human THP-1 cells and PBMC cells by the MTT assay. Briefly, PBMC cells were isolated from the blood using histopaque washed with PBS and transferred in RPMI-1640 medium while THP-1 cells are grown in the RPMI medium with 10% FBS in a 5% CO2 incubator with humidity. Both cells are taken in 96 well plates (1 × 10⁶ per well) and treated with the hydrogel (HG) under both dark and light conditions. In HG–Cpfx, the Cpfx amount was 5, 10, and 20 μg ml−1 in 200 μl of medium (equivalent to 5, 10 and 20 μl of HG containing 2.5, 5 and 10 μg of DNA dots). Cpfx alone (10 and 20 μg ml−1) and AmB, as a positive control (5 and 10 μM), were also used and treatment was continued for 72 h.

Antibacterial activity

Plate count assay for bacterial viability. The resistant strain IDH-12138 (resistant against ciprofloxacin and other drugs as mentioned in ESI, Table 3) and K12 (Norfloxacin-resistant) are obtained from the NICED Kolkata. The plate count method was used to determine the antibacterial activity of HG and HG–Cpfx after measuring the Colony Forming Units (CFUs) of bacteria in agar plates with different dilutions. Escherichia coli DH5α (Gram-negative), E. coli resistant strain (K12), E. coli multi-drug resistant strain (IDH 12138), and Staphylococcus aureus ATCC 25923 (Gram-positive) cells were grown in LB and TSB, respectively, until the OD600 value reached ∼1.0 (∼109 CFU ml−1). Cells were pelleted, washed, and the concentration adjusted to ∼1–3 × 10⁶ CFU mL−1 for S. aureus and ∼1–5 × 10⁷ CFU mL−1 for E. coli strains in sterile phosphate buffer (0.1 M, pH 7.4), and 1 mL was then added per well in a microtiter plate. Hydrogels are diluted based on the Cpfx concentration where 100 μl of HG contains 50 μg of DNA dots and 20 μg of Cpfx. HG are diluted 1[thin space (1/6-em)]:[thin space (1/6-em)]20 in PBS and then 5 and 10 μl of that diluted solution was added in 1 ml of PBS containing the bacterial cells. Therefore, the cells were mixed with only the hydrogel (containing 0.25 μg DNA dots per ml), HG–Cpfx (having 0.05 μg ml−1 and 0.1 μg ml−1 of Cpfx containing 0.125 μg ml−1 and 0.25 μg ml−1 DNA dots respectively) in the antibacterial assay. Then the cells are either kept in the dark or exposed to visible light (100 W tungsten bulb, for 1 h). Cpfx-treated (0.05 and 0.1 μg) and untreated cells as controls were also included. S. aureus strain was treated similarly. After incubation, 0.1 mL of cells were taken and serially diluted (101–104) in phosphate buffer, and 0.1 mL of diluted cells were plated in Luria–Bertani (LB) agar and Tryptic Soya agar (TSA) plates for all E. coli strains and S. aureus cells, respectively, in triplicate. Agar plates were further incubated for 24 h at 37 °C. CFU counts from the untreated cells were considered 100%, and reduction in CFU for hydrogel-treated cells was presented on a percentage scale. Plates containing 200 > CFU > 20 were considered for counting. E. coli multi-drug resistant strain (IDH 12138) was used to evaluate the effect of a low-intensity and shorter exposure time of light source on cell killing. For the low intensity effect we used a 20 W bulb for 1 h and for a shorter time we used a 100 W bulb for 12 min. All other conditions of the experiment remained the same as earlier. Error bars were generated by calculating the standard deviation from the average of three data points, and the statistical significance between samples was evaluated by performing unpaired t-test analyses. Data were considered statistically significant and highly significant when P < 0.05 and P < 0.001, respectively (*, P < 0.05; **, 0.05 < P < 0.01; ***, 0.01 < P < 0.001).

Minimal inhibitory concentration (MIC) determination and zone of inhibition assay

The action of the hydrogel formulation on bacteria was tested in a 0.3 ml 96-well plate. First, E. coli, E. Coli resistant strain, and S. aureus cells were cultivated in LB broth medium to the late log phase (1-OD). After that, the culture was serially diluted until the cell count reached 1 × 10⁶ cells per milliliter. Each well received 100 μl of culture, plus an additional 100 μl of medium containing the formulation of HG and HG–Cpfx (containing 0.005, 0.01, 0.05, 0.1, 1, 5, 10 μg Cpfx). An untreated culture well was taken as a negative control; however, the Cpfx (0.005, 0.01, 0.05, 0.1, 1, 5, 10 μg) treated well was considered a positive control. All treated and untreated wells were sampled in triplicate to ensure accurate data. The plate was incubated for 24 h at 37 °C in an incubator. The turbidity of the culture was evaluated at 600 nm with a UV-Vis Spectrophotometer, and the MIC was determined based on the growth of treated and untreated wells. The concentration which inhibits the growth completely with no change in turbidity was considered MIC for that well. For zone of inhibition (ZOI) Assay, resistant E. coli (K12) cells were spread uniformly over LB Plates and dried for 1 h. The zones are loaded with 100 μl of diluted HG in PBS having varying Cpfx concentrations (0.05, 0.1, 0.25, and 0.5 μg in 100 μl), only HG (5 μl diluted in 95 μl of PBS), only DNA dots (0.5 μg per 100 μl), and free Cpfx (0.5 μg per 100 μl). Plates that have been kept in the dark are wrapped in black paper and placed in an incubator overnight. Plates that have been exposed to light are treated as stated previously. As a control, wells with sterile water were used. After 20–24 h of incubation at 37 °C, the diameter of the ZOI was calculated.

Author contributions

Suman Nayak: Conceptualization, methodology, validation, formal analysis, investigation, data curation, writing – original draft, and visualization. Prakash Kumar: Methodology, validation, antibacterial study, investigation, data curation, and writing – original draft. Ravi Shankar: Formal analysis, investigation, and data curation. Asish Kumar Mukhopadhyay: Provided the resistant bacterial strain, data curation, and validation. Debabrata Mandal: Conceptualization, writing – review & editing, and supervision. Prolay Das: Conceptualization, resources, writing – review and editing, visualization, and supervision.

Conflicts of interest

There are no conflicts to declare.

Acknowledgements

The authors thank IIT Patna for infrastructure and experimental facilities. All the biological work was done at NIPER Hajipur and ICMR-National Institute of Cholera and Enteric Diseases, Kolkata and both the institutes is greatly acknowledged. SN is thankful to IIT Patna for the fellowship.

References

  1. A. Gangrade, N. Stephanopoulos and D. Bhatia, Nanoscale, 2021, 13, 16834–16846 RSC.
  2. H. M. Meng, X. Zhang, Y. Lv, Z. Zhao, N. N. Wang, T. Fu, H. Fan, H. Liang, L. Qiu, G. Zhu and W. Tan, ACS Nano, 2014, 8, 6171–6181 CrossRef CAS PubMed.
  3. J. Song, K. Im, S. Hwang, J. Hur, J. Nam, G. O. Ahn, S. Hwang, S. Kim and N. Park, Nanoscale, 2015, 7, 9433–9437 RSC.
  4. J. B. Lee, S. Peng, D. Yang, Y. H. Roh, H. Funabashi, N. Park, E. J. Rice, L. Chen, R. Long, M. Wu and D. Luo, Nat. Nanotechnol., 2012, 7, 816–820 CrossRef CAS PubMed.
  5. A. Samanta and I. L. Medintz, Nanoscale, 2016, 8, 9037–9095 RSC.
  6. J. Han, Y. Guo, H. Wang, K. Zhang and D. Yang, J. Am. Chem. Soc., 2021, 143, 19486–19497 CrossRef CAS PubMed.
  7. D. Wang, J. Cui, M. Gan, Z. Xue, J. Wang, P. Liu, Y. Hu, Y. Pardo, S. Hamada, D. Yang and D. Luo, J. Am. Chem. Soc., 2020, 142, 10114–10124 CrossRef CAS PubMed.
  8. E. Peterson and P. Kaur, Front. Microbiol., 2018, 9, 2928 CrossRef PubMed.
  9. D. Bonamonte, A. De Marco, R. Giuffrida, C. Conforti, C. Barlusconi, C. Foti and P. Romita, Dermatol. Ther., 2020, 33, 13824 CrossRef PubMed.
  10. M. X. Chen, K. S. Alexander and G. Baki, J. Pharm., 2016, 2016, 5754349 Search PubMed.
  11. D. A. Williamson, G. P. Carter and B. P. Howden, Clin. Microbiol. Rev., 2017, 30, 827–860 CrossRef CAS PubMed.
  12. N. Mohajeri, E. Mostafavi and N. Zarghami, J. Photochem. Photobiol., B, 2020, 209, 111944 CrossRef CAS PubMed.
  13. Y. Li, Y. D. Tseng, S. Y. Kwon, L. d'Espaux, J. S. Bunch, P. L. McEuen and D. Luo, Nat. Mater., 2004, 3, 38–42 CrossRef CAS PubMed.
  14. X. Xiong, C. Wu, C. Zhou, G. Zhu, Z. Chen and W. Tan, Macromol. Rapid Commun., 2013, 34, 1271–1283 CrossRef CAS PubMed.
  15. J. S. Kahn, Y. Hu and I. Willner, Acc. Chem. Res., 2017, 50, 680–690 CrossRef CAS PubMed.
  16. Y. Hu, W. Guo, J. S. Kahn, M. A. Aleman-Garcia and I. Willner, Angew. Chem., 2016, 128, 4282–4286 CrossRef.
  17. C. H. Lu, W. Guo, Y. Hu, X. J. Qi and I. Willner, J. Am. Chem. Soc., 2015, 137, 15723–15731 CrossRef CAS PubMed.
  18. X. Jiang, M. Li, X. Guo, H. Chen, M. Yang and A. Rasooly, ACS Appl. Bio Mater., 2019, 2, 1262–1269 CrossRef CAS PubMed.
  19. S. Obuobi, H. K. L. Tay, N. D. T. Tram, V. Selvarajan, J. S. Khara, Y. Wang and P. L. R. Ee, J. Controlled Release, 2019, 313, 120–130 CrossRef CAS PubMed.
  20. A. Cao, Y. Tang, Y. Liu, H. Yuan and L. Liu, Chem. Commun., 2013, 49, 5574–5576 RSC.
  21. R. Kumari, M. I. Khan, S. Bhowmick, K. K. Sinha, N. Das and P. Das, J. Photochem. Photobiol., B, 2017, 172, 28–35 CrossRef CAS PubMed.
  22. S. Nayak, S. R. Prasad, D. Mandal and P. Das, ACS Appl. Bio Mater., 2020, 3, 7865–7875 CrossRef CAS PubMed.
  23. S. Kumari, S. R. Prasad, D. Mandal and P. Das, J. Colloid Interface Sci., 2019, 553, 228–238 CrossRef CAS PubMed.
  24. L. Zhou, X. Jiao, S. Liu, M. Hao, S. Cheng, P. Zhang and Y. Wen, J. Mater. Chem. B, 2020, 8, 1991–2009 RSC.
  25. V. Morya, S. Walia, B. B. Mandal, C. Ghoroi and D. Bhatia, ACS Biomater. Sci. Eng., 2020, 6, 6021–6035 CrossRef CAS PubMed.
  26. P. K. Pandey, K. Rawat, T. Prasad and H. B. Bohidar, J. Mater. Chem. B, 2020, 8, 1277–1289 RSC.
  27. S. Singh, A. Mishra, R. Kumari, K. K. Sinha, M. K. Singh and P. Das, Carbon, 2017, 114, 169–176 CrossRef CAS.
  28. J. Kou, D. Dou and L. Yang, Oncotarget, 2017, 8, 81591 CrossRef PubMed.
  29. J. C. Kennedy and R. H. Pottier, J. Photochem. Photobiol., B, 1992, 14, 275–292 CrossRef CAS.
  30. X. Sun, J. He, Y. Meng, L. Zhang, S. Zhang, X. Ma, S. Dey, J. Zhao and Y. Lei, J. Mater. Chem. A, 2016, 4, 4161–4171 RSC.
  31. X. Wang, P. Yang, Q. Feng, T. Meng, J. Wei, C. Xu and J. Han, Polymers, 2019, 11, 616 CrossRef PubMed.
  32. A. Suram, J. K. Rao, K. S. Latha and M. A. Viswamitra, NeuroMol. Med., 2002, 2, 289–297 CrossRef CAS.
  33. S. Nayak and P. Das, ACS Omega, 2021, 6, 21425–21435 CrossRef CAS PubMed.
  34. C. Xia, S. Zhu, T. Feng, M. Yang and B. Yang, Adv. Sci., 2019, 6, 1901316 CrossRef CAS PubMed.
  35. P. K. Sharma, M. Halder, U. Srivastava and Y. Singh, ACS Appl. Bio Mater., 2019, 2, 5313–5322 CrossRef CAS PubMed.
  36. P. Kumar, P. Shivam, S. Mandal, P. Prasanna, S. Kumar, S. R. Prasad, A. Kumar, P. Das, V. Ali, S. K. Singh and D. Mandal, Int. J. Nanomed., 2019, 14, 6073–6101 CrossRef CAS PubMed.
  37. F. Cieplik, D. Deng, W. Crielaard, W. Buchalla, E. Hellwig, A. Al-Ahmad and T. Maisch, Crit. Rev. Microbiol., 2018, 44, 571–589 CrossRef CAS PubMed.
  38. M. M. Kim and A. Darafsheh, Photochem. Photobiol., 2020, 96, 280–294 CrossRef CAS PubMed.
  39. N. Ptaszyńska, K. Gucwa, K. Olkiewicz, M. Heldt, M. Serocki, A. Stupak, D. Martynow, D. Dębowski, A. Gitlin-Domagalska, J. Lica and A. Łęgowska, Int. J. Mol. Sci., 2020, 21, 4696 CrossRef PubMed.
  40. S. Singh, M. K. Singh and P. Das, Sens. Actuators, B, 2018, 255, 763–774 CrossRef CAS.
  41. J. Bush, C. H. Hu and R. Veneziano, Appl. Sci., 2021, 11, 1885 CrossRef CAS.

Footnote

Electronic supplementary information (ESI) available. See DOI: https://doi.org/10.1039/d2nr03810b

This journal is © The Royal Society of Chemistry 2022