A simple solution to the problem of self-assembling cubic diamond crystals

Lorenzo Rovigatti *ab, John Russo *a, Flavio Romano cd, Michael Matthies e, Lukáš Kroc e and Petr Šulc *e
aDipartimento di Fisica, Sapienza Università di Roma, P.le Aldo Moro 5, 00185 Rome, Italy. E-mail: lorenzo.rovigatti@uniroma1.it; john.russo@uniroma1.it
bCNR-ISC Uos Sapienza, Piazzale A. Moro 2, IT-00185 Roma, Italy
cDipartimento di Scienze Molecolari e Nanosistemi, Università Ca’ Foscari di Venezia Campus Scientifico, Edificio Alfa, via Torino 155, 30170 Venezia Mestre, Italy
dEuropean Centre for Living Technology (ECLT) Ca’ Bottacin, 3911 Dorsoduro Calle Crosera, 30123 Venice, Italy
eSchool of Molecular Sciences and Center for Molecular Design and Biomimetics, The Biodesign Institute, Arizona State University, 1001 South McAllister Avenue, Tempe, Arizona 85281, USA. E-mail: psulc@asu.edu

Received 28th June 2022 , Accepted 11th September 2022

First published on 12th September 2022


Abstract

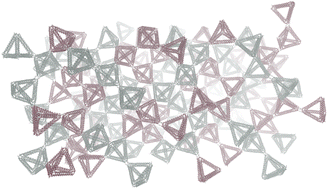
The self-assembly of colloidal diamond (CD) crystals is considered as one of the most coveted goals of nanotechnology, both from the technological and fundamental points of view. For applications, colloidal diamond is a photonic crystal which can open new possibilities of manipulating light for information processing. From a fundamental point of view, its unique symmetry exacerbates a series of problems that are commonly faced during the self-assembly of target structures, such as the presence of kinetic traps and the formation of crystalline defects and alternative structures (polymorphs). Here we demonstrate that all these problems can be systematically addressed via SAT-assembly, a design framework that converts self-assembly into a Boolean satisfiability problem (SAT). Contrary to previous solutions (requiring four or more components), we prove that the assembly of the CD crystal only requires a binary mixture. Moreover, we use molecular dynamics simulations of a system composed by nearly a million nucleotides to test a DNA nanotechnology design that constitutes a promising candidate for experimental realization.


The bottom-up realization of complex structures from elementary components has been the main goal of nanotechnology since Feynman first imagined “What would happen if we could arrange the atoms one by one the way we want them”.1 In the last decade, one of the most sought-after arrangements is that of a cubic diamond (CD) crystal. Realizing a diamond structure at the colloidal scale would in fact open the doors to the realization of optical metamaterials.2,3 In analogy to semiconductors, which have an electronic band gap, a metamaterial lattice can be designed to possess an optical band gap, which prevents the transport of photons within a specific range of wavelengths through the material. If such a lattice can be assembled with cavity sizes comparable to the wavelength of visible or infrared light, it would open new possibilities of manipulating such radiation in the same way semiconductors manipulate electrons.

Efforts to reliably produce diamond structures have spanned many decades of research and have employed a variety of techniques, from traditional top-down approaches like lithography and holography,4 to bottom-up strategies like the self-assembly of liquid crystals, nanoparticles and colloidal particles.5,6 To reach the lengthscales that are required for photonic materials, self-assembly has emerged as one of the most promising routes for the realization of diamond cubic structure. Notwithstanding recent successes,6–8 realizing a diamond lattice remains notoriously difficult, and the reasons are manyfold.

The first major problem is represented by the low volume fraction of the CD crystal. The CD crystal is an open crystalline structure which is mechanically stable at volume fractions that are almost half those of ordinary closed packed structures, like fcc and bcc. This makes the assembly particularly difficult for the isotropic and short-range potentials that typically govern colloidal particles, and which tend to favour close-packed structures. To overcome this problem, one of the most promising approaches has been to use anisotropic interactions,9 and in particular colloidal particles with tetrahedrally arranged bonding sites. These particles are termed Patchy Particles (Fig. 1a) and they acquire anisotropic interactions either via their shape10 or through chemical patterning of their surface.11–18


image file: d2nr03533b-f1.tif
Fig. 1 Proposed realization of the CD lattice crystal. (a) Finite size cluster of 128 patchy particles (the 16-particle cubic diamond unit cell is multiplied 2 × 2 × 2), which interact anisotropically through colored patches according to the interaction matrix provided by SAT-assembly. (b) Mean structure of the CD lattice assembled from two distinct types of DNA origamis, as represented by the oxDNA model.

The second common problem with the assembly process is that during the nucleation process different crystalline phases (called polymorphs) can nucleate.19,20 Systems that can assemble a CD lattice are often found to be able to assemble into the hexagonal diamond (HD) lattice, resulting in imperfect crystals with defects and stacking faults. Avoiding or minimizing the formation of polymorphs requires specific solutions: to avoid the formation of stacking faults in CD formations usually requires either torsional interactions21,22 or hierarchical assembly.22–25 Importantly, some of these solutions lack a convincing experimental counterpart.

The final obstacle to a successful self-assembly strategy is the presence of kinetic traps. Despite the reversible nature of the bonds between different particles, the thermodynamic equilibrium of self-assembling systems can be easily derailed by locally stable minima that force the system to stay in a kinetically trapped state. Multiple strategies have emerged to avoid kinetic traps, from suppressing local motifs found in kinetic traps but not in the desired structures (such as odd-numbered rings26) to designing specific protocols that steer the non-equilibrium assembly in the correct direction.27–30

Recently we have introduced a novel framework, named SAT-assembly,31,32 to design patchy particle systems that can assemble into any desired structure. Through a mapping to a Boolean satisfiability problem (SAT), the structure is encoded into the interaction map describing the bonds that can be formed between the different particles. Crucially, the interaction map can also encode the avoidance of alternative structures, which can be both competing polymorphs or commonly occurring kinetic traps. We can then use highly optimized SAT-solver algorithms to find solution in terms of interaction matrix between patchy particles that assemble target lattice and avoid specified alternative structures. Here we systematically explore the space of solutions that can form the CD crystal while avoiding the HD polymorph. We use a modified version of the MiniSAT algorithm to exhaustively search the design space for a given number of distinct particle species and interaction types, and implement a differentiable version of the Kern–Frenkel patchy particle model on GPU, allowing us to speed-up the Molecular Dynamics simulations to test different solutions for their ability to nucleate the CD lattice without defects. Using this upgraded framework, we demonstrate that the minimum number of particle species required for the defect-free assembly of CD is only 2. We thus present the binary mixture solution that encodes this design, and propose a possible realization as a DNA origami design, which we study with oxDNA, a coarse-grained model of DNA33–36 (Fig. 1b). Via molecular simulations, we explore the nucleation pathway of the solution and reveal that it occurs through a two-step nucleation process aided by gas–liquid demixing. Requiring the minimal number of components (a binary mixture), together with its facile crystallizability, the solution is the most promising candidate for experimental realization of a colloidal diamond crystal yet using patchy particles without torsional modulation of their interacting patches, which allows for realization e.g. with gold nanoparticles or colloids with patches realized as spatially localized DNA brushes37 or with DNA origamis with patches as single-stranded overhangs.38

The minimal solution

Since it is desirable to keep the number of distinct particle types as low as possible for ease of manufacturing and experimental preparation, we seek to find the minimum set of particle species that can assemble into a CD lattice without any defects or alternative assemblies. We formulate the design problem as a SAT problem,31,32 which is a collection of Boolean clauses (see Methods and ESI Table S1) that encode the topology as given by the 16-particle unit cell for CD lattice (ESI Table S2). For a given number of different patchy particle species (Ns) and patch colors (Ns) that are required to be used in the solution, we gradually enumerate all possible solutions by augmenting the set of conditions by additional clauses that contain negations of already discovered solutions, so that the SAT problem finds new previously unknown solutions. We then test each discovered solution for its ability to assemble the hexagonal diamond lattice with 32 sites in the unit cell (ESI Table S3).

The SAT procedure proves that it is not possible to obtain a solution that would avoid hexagonal diamond formation with a single particle type (Ns = 1 and 1 ≤ Nc ≤ 4). Therefore, we next scanned all patchy particle systems with Ns = 2 and Nc = 8 and found that there exists a solution to the SAT-assembly problem that is able to form a CD cubic lattice 16-particle unit cell and avoids at the same time formation of the HD lattice with 32-particle unit cell. The solution is listed in Table 1. Each of the two particle types have the same stoichiometry in the CD lattice, so for the full crystal assembly they are mixed in equal concentrations.

Table 1 Designed patchy particles for self-assembly into a cubic diamond crystal lattice. It consists of 2 patchy particle species and 8 colors. The patch coloring is in format (patch number, patch color), where patches are numbered from 1 to 4, and colors are assigned a letter from A to H. The color interaction then lists all pairs of interacting colors, where colors B and C are self-complementary
PP species Patch coloring
1: (1,A) (2,B) (3,C) (4,D)
2: (1,E) (2,F) (3,G) (4,H)
Color interactions
(A,H), (B,B), (C,C), (D,F), (E,G)


DNA lattice simulation

We start by mapping the minimal solution in the oxDNA model to simulate a proposed tetrahedral design realization (Fig. 1b). The DNA tetrahedron has single-stranded overhangs in each of its vertices that correspond to the DNA patches. As strands in each vertex are identical, they do not impose any torsional restraint in terms of orientations at which two particles can bind to each other, as opposed to e.g. shape complementary DNA origami designs,39 which presents larger experimental challenge to assemble and correctly optimize the structure design to ensure pairing of the shape complementary regions.40 Patches of complementary colors would correspond to Watson–Crick base pairing complementary single-stranded DNA overhangs, and self-complementary color would correspond to a palindromic DNA sequence. After assembling the CD lattice cluster out of individual DNA origamis as described in Methods, we ran a sampling molecular dynamics simulations at T = 293 K. The system consists of 951[thin space (1/6-em)]040 bases, making it the largest oxDNA system production simulation that has been realized to date. The mean structure is the assembled cluster obtained from the MD simulation and it is shown in Fig. 1b. Its projection in Fig. 2 shows how the centre of mass of each DNA origami moves relative to its mean structure throughout the simulation. Our oxDNA model shows that the target lattice is an energy minima of the proposed design (i.e. it is mechanically stable), and is a candidate for experimental realization.
image file: d2nr03533b-f2.tif
Fig. 2 Projection of the mean structure of Fig. 1b on the x–y plane. The z coordinate of each particle is encoded in the coloring. Red markers represent the centre of mass of every DNA origami particle computed using the mean structure. The blue point cloud around the red markers corresponds to the centre of mass positions of the structures during the production run, aligned to the centre of mass position of the mean structure (red markers).

We note that despite oxDNA model being highly coarse-grained, representing each nucleotide as a single rigid body, sampling the kinetics of assembly of individual origamis into the target lattice is still out of reach. In the following section we address these limitations by adopting a more efficient (and more coarse-grained) patchy particle model.

Patchy particle simulation results

To demonstrate the correct assembly of a CD crystal from our design, in Fig. 3 we show results from molecular dynamics simulations at temperature kBT/ε = 0.095 and number density ρσ3 = 0.2 for N = 10[thin space (1/6-em)]000 particles using a generalization of the Kern–Frenkel patchy particle model with differentiable interaction potentials (dKF model, described in Methods). We note that the units of the patchy particle model do not have a direct correspondence to ESI units, and are hence treated as empirical parameters. The value of kBT/ε for simulation was obtained empirically, where we first scanned a range of values to find a temperature at which successful nucleation was observed in MD simulation. The correspondence between experimental and ESI temperature units could be established e.g. by relating dimer melting temperature in simulation to experimental measurements for a particular DNA origami design. The number density 0.2 was used in our prior work to study nucleation of patchy particle models31 and was found to be tracktable with Molecular Dynamics code. For the system studied here, we observed nucleation within one to two weeks of runtime on a V100 NVIDIA GPU card. The typical concentrations used for DNA origami experiments are order of 10 nanomolar concentration. With the radius of the DNA wireframe origami from Fig. 3a being about 25 nm, the corresponding number density of a DNA origami assembly experiment would be around 10−4, which is smaller than what can be studied in patchy particle MD simulation. Nevertheless, the patchy particle model, even highly coarse-grained, still allows us to gain insight into the formation of nucleus and the kinetics of the nanostructure assembly and helps to identify plausible solutions for experimental realization. Fig. 3a plots the potential energy as a function of the simulated time for a significant trajectory. The trajectory quickly reaches a transient state (partially colored in red), where the energy relaxation is very slow, followed by an abrupt change towards a low-energy state (partially colored in cyan). A comparison of the structure factor S (q) for these two states (inset in Fig. 3a) shows that the first one is characterized by an amorphous structure at high q-vectors (short distance), but a large inhomogeneity at small q-vectors (with a peak appearing at → 0), characteristic of a phase-separated system. The low-energy state shows a similar density inhomogeneity, but it is also characterized by sharp peaks at finite q, typical of a crystalline state. These observations are confirmed by a visual inspection of these states (Fig. 3b and c). Fig. 3b is a snapshot taken in the phase-separated state. Particles in crystalline environments are depicted in blue for the CD crystal, and in orange for the HD crystal. Particles in disordered environments are represented with bond lines. The snapshot shows that the system has phase-separated into a liquid phase (top part of the simulation box) and a gas phase (bottom half of the simulation box). Inside the liquid phase there is an equilibrium population of pre-critical crystalline clusters that constantly form and dissolve. Note that for these small clusters the hexagonal symmetry (orange particles) is still present, albeit only on the surface of the nuclei. Fig. 3c shows the final crystalline state into which the system self-assembles. A single CD crystal is formed, and an enveloping surface is drawn to highlight the different crystalline planes. The snapshot shows the lateral growth of the (1,1,1) plane.
image file: d2nr03533b-f3.tif
Fig. 3 Nucleation run at kBT/ε = 0.095 and ρσ3 = 0.2. (a) Potential energy as a function of simulation time steps. Parts of the trajectory are highlighted in red for the metastable liquid phase and in cyan for the crystalline phase. (inset) Structure factor corresponding to the highlighted parts of the trajectory. (b) Snapshot of a configuration in the metastable liquid phase. Particles in crystalline environments are depicted in blue for the CD crystal, and orange for the HD crystal. The color shade represents the distance from the surface. Particles in disordered environments are hidden and only bonds between them are represented with black lines. (c) Snapshot of a configuration in the crystal phase. A single CD crystal is formed, for which we plot a surface mesh to highlight the growth of crystalline planes.

The nucleation pathway described so far is akin to a two-step nucleation process in which nucleation is preceded by the condensation of dense liquid droplets. To better analyse the nucleation pathway we map the gas–liquid phase diagram of the system via direct-coexistence simulations. The system is first equilibrated in the liquid state at a density ρ and then put in an elongated box (Lx = 3Ly = 3Lz), where the slab of liquid is bounded by two interfaces with the gas parallel to the yz plane. Simulations are then run at constant density and constant temperature until liquid–gas equilibrium is reached. A snapshot from an equilibrated configuration is shown in Fig. 4a. We run direct coexistence simulations at densities ρσ3 = 0.5, 0.55, 0.6 and temperature ranging from kBT/ε = 0.008 and kBT/ε = 0.1. At the highest temperature, kBT/ε = 0.1, the final equilibrium state consist of a single fluid phase (supercritical state) while the other temperatures maintain the liquid-slab configuration. From these we can measure equilibrium concentration and densities of the two phases. In Fig. 4b we plot the isoplethic phase diagram at constant mole fraction x = 0.5 between the two species: the black line indicates the coexistence density of the gas (left black branch) and liquid (right black branch) phases. In order to nucleate, the system is quenched inside the coexistence region, where the formation of liquid droplets favours the nucleation process. This is tested with several independent simulations of N = 10[thin space (1/6-em)]000 patchy particles prepared in a homogeneous state and then quenched inside at kBT/ε = 0.095 at different densities. Each simulation is represented as a point in Fig. 4b joined by the horizontal dashed line. Open red symbols represent simulations which did not crystallize within the simulation time, while blue full symbols represent systems that spontaneously nucleated. Fig. 4b suggests that the nucleation rate has a maximum inside the coexistence region, possibly located close to the critical point. We also quench several systems at ρσ3 = 0.1 at different temperatures (joined by the vertical dashed line). These simulation indicate that the nucleation rate also has a maximum in temperature. A snapshot of a slab of the system at (ρσ3 = 0.1, kBT/ε = 0.092) is shown in Fig. 4c, which highlights the typical formation of a cubic crystal. While lowering the temperature guarantees a smaller nucleation barrier for nucleation, at low temperature (kBT/ε ≤ 0.09) the dynamics of the system becomes arrested and instead of compact liquid droplets the system is frozen in a gel-state. A snapshot of this state at (ρσ3 = 0.1, kBT/ε = 0.08) is shown in Fig. 4d.


image file: d2nr03533b-f4.tif
Fig. 4 (a and b) Isoplethic phase diagram at equimolar concentration obtained via direct coexistence simulations (see snapshot a). Black lines are the liquid–gas coexistence densities. Error bars represent the dispersion over three independent trajectories at total density ρσ3 = 0.5, 0.55, 0.6. The horizontal dashed line connect simulations runs at kBT/ε = 0.095 starting from homogeneous conditions, while the vertical dashed line connects the points at ρσ3 = 0.1. Full (blue) symbols represent trajectories that crystalline spontaneously, while open (red) symbols represent states that remain in a disordered phase. Slabs of width 10σ for ρσ3 = 0.1 and (c) kBT/ε = 0.092 and (d) kBT/ε = 0.08.

Discussion and conclusions

We have used an inverse design framework based on formulating the design problem as a Boolean Satisfiability Problem to obtain the minimum set of patchy particles that, without torsional potential, can assemble into a Cubic Diamond (CD) lattice. We have demonstrated that at least two different types of patchy particles are required to obtain a system that self-assembles into the desired lattice and avoid the competing hexagonal diamond geometry, and have provided an explicit solution with two species and eight colours. We have observed that in the patchy particle simulations the system first forms a metastable liquid phase, from which the cubic diamond then crystallizes. Finally, we have showed a possible realization of the CD lattice made out of DNA tetrahedrons designed and verified using tools for DNA nanotechnology and coarse-grained simulations.

Our methods can also be used to design a system that avoids certain kinetic intermediates, thus possibly using SAT-assembly approach to optimize not only the yield of the target structure, but also the assembly kinetics. The rearrangement from a metastable liquid phase into the crystal lattice is a slow process, and our future work will explore if the SAT solver can be used to design interactions that further destabilize the liquid phase, thus enhancing the rate of formation of crystal lattice, as well as the effects of changing the number of different species and distinct patch colors onto the overall phase diagram of the system.

Our inverse design approach can be further generalized to other geometries, including finite-size 2D or 3D multicomponent nanostructures, with applications to biotemplated self-assembly and optical metamaterial manufacturing.

A more efficient model would be needed to capture the assembly kinetics of the DNA tetrahedrons, such as an intermediate multiscale model between patchy particle and oxDNA representation, which might represent part of the structure at the nucleotide level (such as ssDNA overhangs) and part of the structure as a rigid body. Studies and development of such models will be the focus of future work.

Methods

SAT-assembly

We use the SAT-assembly framework to find the colorings of patches of the patchy particles which are compatible with the desired target structure. The procedure has been described in detail in ref. 31 and 32 Briefly, we formulate the inverse design problem as a Boolean Satisfiability Problem. The parameters of the SAT-assembly are the number of species of patchy particles (Ns = 2 in our case), and the number of colors Nc that the patchy particles will use. The interaction between particles is then determined by the color interaction matrix, which sets which patch colors can bind to each other (also allowing for self-complementarity). In the case of realization of patchy particles with DNA nanostructures such as DNA origami,38,41 complementary coloring of patches would corresponds to e.g. a single-stranded DNA overhangs with complementary sequences that can hybridize into a duplex. Self-complementary colors would then correspond to palindromic DNA sequences.

To formulate the Boolean Satisfiability problem, each possible coloring and color interaction is assigned a Boolean variable which can be either true or false. Furthermore, we define Boolean variables that correspond to which positions in the target CD lattice are occupied by what type of particle, and how each respective patchy particle needs to be placed in each of the lattice positions as specified by its assigned orientation (out of the possible No = 12 orientations, as specified in ESI Tables S1 and Table S4). The Boolean variables and clauses are listed in ESI Table S1 and described in section SI in ESI.

We developed a modified version of the MiniSAT SAT-solver tool42 to enumerate all possible solutions for a given combination of Ns and Nc that can form a DC lattice, and then tests all generated solutions for their ability to assemble a specified undesired lattice (HD 32-unit cell in our case) to quickly filter out the desired solution that can form the DC unit cell but is unable to be arranged into the HD unit cell in a way that satisfies all bonds.

DNA system simulations

We setup the oxDNA simulations starting from a finite cluster of 128 particles (Fig. 1), where the unit cell of 16 elements is repeated two times along each axis. The Athena43 and oxView44 design tools were used to construct a plausible tetrahedral DNA origami monomer which is aligned to the idealized lattice positions of the cluster using the Biopython SVDSuperimposer package.45 Prior to molecular dynamics simulation, the pre-assembled system needs to be relaxed to correct for possible overlaps or overstretched bonds that were created during the placing of the DNA origamis onto the patchy particle representation. For each of the paired bases in the system an additional pairwise attractive potential was generated using the generate_force script of the oxDNA_analysis_tools package44 with the stiffness parameter of the trap set to stiff = 3. This potential is active during the entire relaxation process. For simulations we chose the oxDNA2 model with averaged sequence interaction strength and a salt concentration of 1 M. The system was first relaxed using a short Monte Carlo simulation in the canonical NVT ensemble with T = 300 K. The relaxation then continued using MD simulation for 7400[thin space (1/6-em)]000 steps with time step dt = 0.001 using the Bussi Thermostat46 with the τ value set to 1, T = 293 K and oxDNA's options max_backbone_force = 10, max_density_multiplier = 4. Next, we equilibrated the system without the max_backbone_force parameter and the pairwise attractive potential for 175[thin space (1/6-em)]400[thin space (1/6-em)]000 simulation steps using the Langevin thermostat. The final production run performed 142[thin space (1/6-em)]400[thin space (1/6-em)]000 MD steps which, taking into account the value of the diffusion constant set in the simulation (D0 = 1 in oxDNA units), corresponds to about 0.6 ms.33

Mean structure calculation

The oxDNA_analysis_tools44 scripts were used to obtain a mean structure of the production run: every configuration in the production trajectory is aligned to a randomly chosen configuration from the production run using the Biopython SVDSuperimposer package.45 This is done to maximize overlap between the sampled states. Next we compute an average of all coordinates describing the system. The final result is in an artificial structure that is a good global descriptor of the analysed trajectory.

Patchy particle simulations

In this work, we employ a generalization of the Kern–Frenkel potential47 to describe the directional interaction between patches. While the Kern–Frenkel potential is discontinous and designed for use in Monte Carlo simulations, we use here its differentiable version (dKF potential) that makes it possible to implement it with a Molecular Dynamics (MD) code for simulation of the assembly kinetics, and also allows for efficient implementation on GPUs, thus allowing us to study much longer timescales and larger systems sizes of the nucleating system.

Patchy particles feel a mutual repulsion modelled through a WCA interaction:48

 
image file: d2nr03533b-t1.tif(1)
where r is the centre-to-centre particle distance, ε is the energy scale and σ is the particle diameter. We take the latter two quantities as units of measurements of energy and length, respectively.

The patch–patch interaction is a square-well-like attractive potential modulated by an orientation-dependent function. The range of the interaction is set by the parameter δ, while its (half) angular width is controlled by cos[thin space (1/6-em)]θmax. The interaction between patch i on particle α, identified by the unit vector image file: d2nr03533b-t2.tif, and patch j on particle β, identified by the versor image file: d2nr03533b-t3.tif, is given by

 
image file: d2nr03533b-t4.tif(2)
where image file: d2nr03533b-t5.tif, image file: d2nr03533b-t6.tif, image file: d2nr03533b-t7.tif and Ω is a steep modulating function that takes into account the orientation of a patch with respect to the unit vector connecting the particles’ centres and takes the following form:
 
image file: d2nr03533b-t8.tif(3)

In this work we set δ = 0.2 and cos[thin space (1/6-em)]θmax = 0.97 so that patches can be involved in no more than one bond at a time.

Conflicts of interest

There are no conflicts to declare.

Acknowledgements

JR acknowledges support from the European Research Council Grant DLV-759187. PŠ acknowledges support from the ONR Grant N000142012094. JR and PŠ acknowledge support from the Università Ca’ Foscari for a Visiting Scholarship and from NSF 1931487 – ERC DLV-759187 research collaboration grant. PŠ and MM further acknowledge the use of the Extreme Science and Engineering Discovery Environment (XSEDE), which is supported by National Science Foundation grant number TG-BIO210009.

References

  1. R. Feynman, There's plenty of room at the bottom, in Feynman and computation, CRC Press, 2018, pp. 63–76 Search PubMed.
  2. C. M. Soukoulis and M. Wegener, Optical metamaterials–more bulky and less lossy, Science, 2010, 330, 1633–1634 CrossRef CAS PubMed.
  3. T. Ngo, C. Liddell, M. Ghebrebrhan and J. Joannopoulos, Tetrastack: Colloidal diamond-inspired structure with omnidirectional photonic band gap for low refractive index contrast, Appl. Phys. Lett., 2006, 88, 241920 CrossRef.
  4. M. H. Werts, M. Lambert, J.-P. Bourgoin and M. Brust, Nanometer scale patterning of Langmuir- Blodgett films of gold nanoparticles by electron beam lithography, Nano Lett., 2002, 2, 43–47 CrossRef CAS.
  5. É. Ducrot, M. He, G.-R. Yi and D. J. Pine, Colloidal alloys with preassembled clusters and spheres, Nat. Mater., 2017, 16, 652–657 CrossRef PubMed.
  6. W. Liu, M. Tagawa, H. L. Xin, T. Wang, H. Emamy, H. Li, K. G. Yager, F. W. Starr, A. V. Tkachenko and O. Gang, Diamond family of nanoparticle superlattices, Science, 2016, 351, 582–586 CrossRef CAS.
  7. A. Michelson, B. Minevich, H. Emamy, X. Huang, Y. S. Chu, H. Yan and O. Gang, Three-dimensional visualization of nanoparticle lattices and multimaterial frameworks, Science, 2022, 376, 203–207 CrossRef CAS.
  8. M. He, J. P. Gales, É. Ducrot, Z. Gong, G.-R. Yi, S. Sacanna and D. J. Pine, Colloidal diamond, Nature, 2020, 585, 524–529 CrossRef CAS PubMed.
  9. J. Russo, F. Leoni, F. Martelli and F. Sciortino, The physics of Empty Liquids: from Patchy particles to Water, Rep. Prog. Phys., 2021, 016601 Search PubMed.
  10. G. van Anders, N. K. Ahmed, R. Smith, M. Engel and S. C. Glotzer, Entropically patchy particles: engineering valence through shape entropy, ACS Nano, 2013, 8, 931–940 CrossRef PubMed.
  11. Z. Zhang and S. C. Glotzer, Self-assembly of patchy particles, Nano Lett., 2004, 4, 1407–1413 CrossRef CAS.
  12. A. B. Pawar and I. Kretzschmar, Fabrication, assembly, and application of patchy particles, Macromol. Rapid Commun., 2010, 31, 150–168 CrossRef CAS.
  13. E. Bianchi, R. Blaak and C. N. Likos, Patchy colloids: state of the art and perspectives, Phys. Chem. Chem. Phys., 2011, 13, 6397–6410 RSC.
  14. F. Romano and F. Sciortino, Colloidal self-assembly: patchy from the bottom up, Nat. Mater., 2011, 10, 171 CrossRef CAS PubMed.
  15. K. Suzuki, K. Hosokawa and M. Maeda, Controlling the number and positions of oligonucleotides on gold nanoparticle surfaces, J. Am. Chem. Soc., 2009, 131, 7518–7519 CrossRef CAS PubMed.
  16. J.-W. Kim, J.-H. Kim and R. Deaton, DNA-Linked Nanoparticle Building Blocks for Programmable Matter, Angew. Chem., Int. Ed., 2011, 50, 9185–9190 CrossRef CAS PubMed.
  17. Y. Wang, Y. Wang, D. R. Breed, V. N. Manoharan, L. Feng, A. D. Hollingsworth, M. Weck and D. J. Pine, Colloids with valence and specific directional bonding, Nature, 2012, 491, 51 CrossRef CAS PubMed.
  18. L. Feng, R. Dreyfus, R. Sha, N. C. Seeman and P. M. Chaikin, DNA patchy particles, Adv. Mater., 2013, 25, 2779–2783 CrossRef CAS PubMed.
  19. N. A. Mahynski, L. Rovigatti, C. N. Likos and A. Z. Panagiotopoulos, Bottom-up colloidal crystal assembly with a twist, ACS Nano, 2016, 10, 5459–5467 CrossRef CAS PubMed.
  20. F. Leoni and J. Russo, Non-classical nucleation pathways in stacking-disordered crystals, arXiv preprint arXiv:2105.05506, 2021.
  21. F. Romano and F. Sciortino, Patterning symmetry in the rational design of colloidal crystals, Nat. Commun., 2012, 3, 975 CrossRef PubMed.
  22. D. F. Tracey, E. G. Noya and J. P. K. Doye, Programming patchy particles to form complex periodic structures, J. Chem. Phys., 2019, 151, 224506 CrossRef PubMed.
  23. D. Morphew, J. Shaw, C. Avins and D. Chakrabarti, Programming hierarchical self-assembly of patchy particles into colloidal crystals via colloidal molecules, ACS Nano, 2018, 12, 2355–2364 CrossRef CAS PubMed.
  24. N. Patra and A. V. Tkachenko, Programmable self-assembly of diamond polymorphs from chromatic patchy particles, Phys. Rev. E, 2018, 98, 032611 CrossRef CAS.
  25. Y. Ma and A. L. Ferguson, Inverse design of self-assembling colloidal crystals with omnidirectional photonic bandgaps, Soft Matter, 2019, 15, 8808–8826 RSC.
  26. A. Neophytou, D. Chakrabarti and F. Sciortino, Facile self-assembly of colloidal diamond from tetrahedral patchy particles via ring selection, Proc. Natl. Acad. Sci. U. S. A., 2021, 118, e2109776118 CrossRef CAS.
  27. G. Bisker and J. L. England, Nonequilibrium associative retrieval of multiple stored self-assembly targets, Proc. Natl. Acad. Sci. U. S. A., 2018, 115, E10531–E10538 CrossRef CAS.
  28. S. Whitelam and I. Tamblyn, Learning to grow: Control of material self-assembly using evolutionary reinforcement learning, Phys. Rev. E, 2020, 101, 052604 CrossRef CAS PubMed.
  29. S. Whitelam and I. Tamblyn, Neuroevolutionary learning of particles and protocols for self-assembly, Phys. Rev. Lett., 2021, 127, 018003 CrossRef CAS.
  30. A. Bupathy, D. Frenkel and S. Sastry, Temperature Protocols to Guide Selective Self-Assembly of Competing Structures, arXiv preprint arXiv:2110.11274, 2021.
  31. F. Romano, J. Russo, L. Kroc and P. Šulc, Designing patchy interactions to self-assemble arbitrary structures, Phys. Rev. Lett., 2020, 125, 118003 CrossRef CAS PubMed.
  32. J. Russo, F. Romano, L. Kroc, F. Sciortino, L. Rovigatti and P. Šulc, SAT-assembly: A new approach for designing self-assembling systems, J. Phys.: Condens. Matter, 2022, 34, 354002 CrossRef.
  33. B. E. Snodin, F. Romano, L. Rovigatti, T. E. Ouldridge, A. A. Louis and J. P. Doye, Direct simulation of the self-assembly of a small DNA origami, ACS Nano, 2016, 10, 1724–1737 CrossRef CAS PubMed.
  34. L. Rovigatti, P. Šulc, I. Z. Reguly and F. Romano, A comparison between parallelization approaches in molecular dynamics simulations on GPUs, J. Comput. Chem., 2015, 36, 1–8 CrossRef CAS.
  35. T. E. Ouldridge, A. A. Louis and J. P. Doye, Structural, mechanical, and thermodynamic properties of a coarse-grained DNA model, J. Chem. Phys., 2011, 134, 02B627 CrossRef PubMed.
  36. P. Šulc, F. Romano, T. E. Ouldridge, L. Rovigatti, J. P. K. Doye and A. A. Louis, Sequence-dependent thermodynamics of a coarse-grained DNA model, J. Chem. Phys., 2012, 137, 5101 CrossRef.
  37. Y. Xiong, S. Yang, Y. Tian, A. Michelson, S. Xiang, H. Xin and O. Gang, Three-dimensional patterning of nanoparticles by molecular stamping, ACS Nano, 2020, 14, 6823–6833 CrossRef CAS PubMed.
  38. Y. Tian, J. R. Lhermitte, L. Bai, T. Vo, H. L. Xin, H. Li, R. Li, M. Fukuto, K. G. Yager and J. S. Kahn, et al., Ordered three-dimensional nanomaterials using DNA-prescribed and valence-controlled material voxels, Nat. Mater., 2020, 19, 789–796 CrossRef CAS PubMed.
  39. T. Gerling, K. F. Wagenbauer, A. M. Neuner and H. Dietz, Dynamic DNA devices and assemblies formed by shape-complementary, non–base pairing 3D components, Science, 2015, 347, 1446–1452 CrossRef CAS.
  40. S. H. Park, H. Park, K. Hur and S. Lee, Design of DNA origami diamond photonic crystals, ACS Appl. Bio Mater., 2019, 3, 747–756 CrossRef.
  41. P. W. K. Rothemund, Folding DNA to create nanoscale shapes and patterns, Nature, 2006, 440, 297–302 CrossRef CAS PubMed.
  42. N. Een, Proc. SAT-05: 8th Int. Conf. on Theory and Applications of Satisfiability Testing, 2005, pp. 502–518.
  43. H. Jun, X. Wang, M. Parsons, W. Bricker, T. John, S. Li, S. Jackson, W. Chiu and M. Bathe, Rapid prototyping of arbitrary 2D and 3D wireframe DNA origami, Nucleic Acids Res., 2021, 49, 10265–10274 CrossRef CAS PubMed.
  44. E. Poppleton, J. Bohlin, M. Matthies, S. Sharma, F. Zhang and P. Šulc, Design, optimization and analysis of large DNA and RNA nanostructures through interactive visualization, editing and molecular simulation, Nucleic Acids Res., 2020, 48, e72–e72 CrossRef CAS PubMed.
  45. P. J. A. Cock, T. Antao, J. T. Chang, B. A. Chapman, C. J. Cox, A. Dalke, I. Friedberg, T. Hamelryck, F. Kauff, B. Wilczynski and M. J. L. de Hoon, Biopython: freely available Python tools for computational molecular biology and bioinformatics, Bioinformatics, 2009, 25, 1422–1423 CrossRef CAS PubMed.
  46. G. Bussi, D. Donadio and M. Parrinello, Canonical sampling through velocity rescaling, J. Chem. Phys., 2007, 126, 014101 CrossRef PubMed.
  47. N. Kern and D. Frenkel, Fluid–fluid coexistence in colloidal systems with short-ranged strongly directional attraction, J. Chem. Phys., 2003, 118, 9882–9889 CrossRef CAS.
  48. J. D. Weeks, D. Chandler and H. C. Andersen, Role of repulsive forces in determining the equilibrium structure of simple liquids, J. Chem. Phys., 1971, 54, 5237–5247 CrossRef CAS.

Footnote

Electronic supplementary information (ESI) available. See DOI: https://doi.org/10.1039/d2nr03533b

This journal is © The Royal Society of Chemistry 2022