 Open Access Article
Multi-scale modeling of folic acid-functionalized TiO2 nanoparticles for active targeting of tumor cells†
Edoardo
Donadoni
a,
Paulo
Siani
a,
Giulia
Frigerio
a and
Cristiana
Di Valentin
 *ab
*ab
aDipartimento di Scienza dei Materiali, Università di Milano-Bicocca, via R. Cozzi 55, 20125 Milano, Italy. E-mail: cristiana.divalentin@unimib.it
bBioNanoMedicine Center NANOMIB, University of Milano-Bicocca, Italy
First published on 8th August 2022
Abstract
Strategies based on the active targeting of tumor cells are emerging as smart and efficient nanomedical procedures. Folic acid (FA) is a vitamin and a well-established tumor targeting agent because of its strong affinity for the folate receptor (FR), which is an overexpressed protein on the cell membranes of the tumor cells. FA can be successfully anchored to several nanocarriers, including inorganic nanoparticles (NPs) based on transition metal oxides. Among them, TiO2 is extremely interesting because of its excellent photoabsorption and photocatalytic properties, which can be exploited in photodynamic therapy. However, it is not yet clear in which respects direct anchoring of FA to the NP or the use of spacers, based on polyethylene glycol (PEG) chains, are different and whether one approach is better than the other. In this work, we combine Quantum Mechanics (QM) and classical Molecular Dynamics (MD) to design and optimize the FA functionalization on bare and PEGylated TiO2 models and to study the dynamical behavior of the resulting nanoconjugates in a pure water environment and in physiological conditions. We observe that they are chemically stable, even under the effect of increasing temperature (up to 500 K). Using the results from long MD simulations (100 ns) and from free energy calculations, we determine how the density of FA molecules on the TiO2 NP and the presence of PEG spacers impact on the actual exposure of the ligands, especially by affecting the extent of FA–FA intermolecular interactions, which are detrimental for the targeting ability of FA towards the folate receptor. This analysis provides a solid and rational basis for experimentalists to define the optimal FA density and the more appropriate mode of anchoring to the carrier, according to the final purpose of the nanoconjugate.
1. Introduction
Inorganic nanoparticles (NPs) based on transition metal (TM) oxides have been gaining much attention in recent years as theranostic agents for cancer therapy because of their versatile and unique physico-chemical properties and high biocompatibility.1 Among these, titanium dioxide (TiO2) NPs are very promising materials because they can act as photocatalysts for tissue oxidation processes or for photodynamic therapy, under UV-visible light irradiation.2Nanoparticles with appropriate dimensions (5–300 nm) can be internalized by tumor cells through the passive diffusion following the looser vascularization of the tumor tissues, also known as the enhanced permeability and retention (EPR) effect.3 However, the non-specific accumulation of the NPs at the tumoral sites represents the major drawback of this kind of nanomedical approach, leading to undesired and potentially harmful side effects.4 As a consequence, novel therapeutic strategies are based on the active targeting of the tumor cells, i.e. they use functionalized nanoparticles with ad hoc biomolecules, which are capable of recognizing specific receptors that are overexpressed by the tumor cells.5,6
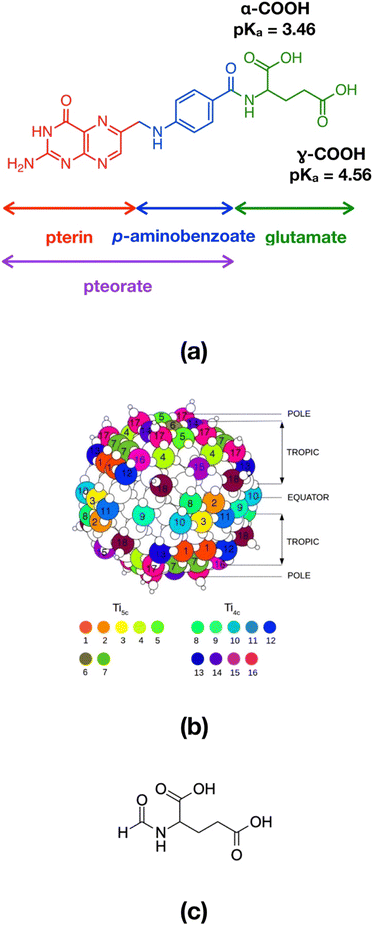
For instance folic acid (FA, also known as vitamin B9), whose chemical structure comprises a pterin portion, a p-aminobenzoate group and a glutamate residue (Fig. 1a), is recognized as a promising and efficient tumor targeting agent, because of a series of advantages, including its low molecular weight, water solubility, stability at different temperature and pH conditions, biocompatibility, good tissue penetration, excellent conjugation chemistry and, most of all, strong interaction with its receptor.7 In particular, folic acid shows high affinity for the folate receptor (FR), a membrane protein that is expressed by neoplastic cells, such as those of epithelial, ovarian, breast, lung, kidney and brain tumors.8 The folate cellular internalization is proven to happen via receptor-mediated endocytosis through endosome formation.9
A large number of nanosystems loaded with FA and drug molecules or contrast agents have been reported to be efficiently delivered to the tumor sites, and these include liposomes, polymeric micelles, dendrimers and inorganic NPs.10–13 The latter, in particular, have superior efficacy for biofunctionalization, because of their high surface to volume ratio and greater surface modification potential with respect to organic NPs. Different TM oxide nanoparticles, including copper,14 cobalt,15 silicon,16 and superparamagnetic iron17 oxide NPs, have been successfully functionalized with folic acid, in order to combine the optical and/or catalytic properties of the inorganic nanoparticles with the targeting ability of FA, that is proven to be retained also after surface grafting.
TiO2/FA nanoconjugates have also shown an excellent ability to reach folate receptors in FR(+) cancer cells. For example, Ai et al.18 report that TiO2/FA nanoparticles have better capability of inducing reactive oxygen species (ROS) formation with higher cell apoptosis in osteosarcoma cancer cells than bare TiO2 NPs, and that is related to the enhanced cellular uptake of these nanoconjugates mediated by FR in the presence of FA. Furthermore, Liang et al.19 have combined the tumor targeting property of FA and the light harvesting capability of phthalocyanine (Pc) by synthetizing TiO2/FA/Pc complexes for targeted photodynamic therapy (PDT). As an alternative, the light absorption frequency of TiO2 can also be shifted from the UV to the visible range by its nitrogen doping.20 Lai et al.21 prepared FA-decorated TiO2 NPs at different FA/TiO2 weight ratios and found out that a value of 0.2 could yield nanoparticles having higher cytotoxicity under photoexcitation.
The strategy to use FA targeting ligand was successfully applied not only to PDT based on TiO2 NPs but also on other inorganic photosensitizers, such as semiconducting black phosphorous nanosheets,22 metal porphyrins23 and metal phthalocyanines,24,25 resulting in more efficient cancer therapy.
It is also common practice in nanomedicine to decorate the nanoparticles with biocompatibility enhancing agents, such as polyethylene glycol (PEG) chains, that increase the blood circulation time of the nanosystems by shielding them from the activity of the reticuloendothelial system (RES), improving the NPs’ so-called “stealth properties”.26 Devanand et al.27 succeeded in loading the antitumor drug paclitaxel on PEG-grafted and FA-functionalized TiO2 NPs: the authors report a reduced paclitaxel loading on the nanoconjugates, because of the hindrance of PEG and FA, but an increased overall biocompatibility of the NPs and a sustained drug release phase. Moreover, their cytotoxicity assays demonstrated that the tumor cells’ viability, induced by the nanoparticles, is concentration dependent. Naghibi et al.,28 instead, combined the stealth properties provided by PEG, the targeting ability by FA and the tumor killing function by DOX on a TiO2 NP. In particular, they found out that the optimal PEG/TiO2 and FA/TiO2 weight ratios are 2 and 0.5, respectively, to get the best targeting action against HFF2 human fetal foreskin fibroblasts and SKBR3 human breast cancer cells. At last, Shah et al.29 synthetized cobalt- and/or nitrogen-doped bare or PEGylated TiO2 nanoparticles, in the presence or without folic acid. They found out that the metal and non-metal doping boosted the photoactivation of the NPs in the Vis/NIR region, although the photokilling of the tumor cells was reduced with respect to the one induced by PEGylated undoped TiO2 nanoparticles under UV/Vis radiation.
According to several experimental works, partly cited above, folate-targeted therapies have turned out to be remarkably successful approaches. However, to the best of our knowledge, only a few theoretical studies have dealt with the computational simulation of folic acid-tagged inorganic nanosystems as targeting nanosystems. In this work, for the first time, we have designed and built models of fully decorated folic acid-functionalized TiO2 nanoparticles (∼3000 atoms) by quantum chemical modeling, evaluating their thermal stability through simulated annealing calculations (Section 3.1) and their dynamical behavior in water through molecular dynamics (MD) simulations by means of classical mechanics-based methods (Section 3.2). Moreover, in Section 3.3 we present the MD study of a PEGylated TiO2 nanoparticle, where FA molecules are attached to the end group of some selected PEG chains, together with some free energy calculations, to determine the role played by a spacer on the FA exposure to the surrounding environment. At last, in Section 3.4 we analyze the results from the MD simulations of some selected systems in a more realistic physiological environment.
2. Theoretical and computational methods
In this work, we adopted a combination of computational techniques that are based both on Quantum Mechanics (QM) and on Molecular Mechanics (MM).2.1. Self Consistent Charge Density Functional Tight Binding (SCC-DFTB)
At the QM level, we used the Self Consistent Charge Density Functional Tight Binding (SCC-DFTB) method,30 for full atomic relaxation and Born–Oppenheimer Molecular Dynamics (MD) simulations. DFTB is an approximated Density Functional Theory (DFT) approach, where the total energy of the system, EDFTBtot, is calculated as: | (1) |
All the DFTB calculations were carried out using the DFTB+ open-source code.31 We employed the MATORG parameterization set32 for the pairwise interactions of the atoms of both the TiO2 nanoparticle and the adsorbed FA molecules. The description of the hydrogen bonding was further improved with the inclusion of the empirical HBD correction33 (ζ = 4). Full geometry optimization calculations were performed through the conjugate gradient algorithm, where the forces were relaxed to less than 10−4 a.u. and the threshold for the convergence of the SCC procedure was set to 10−6 a.u.
Born–Oppenheimer molecular dynamics simulations were performed within the canonical ensemble (NVT). The Newton equations of motion were integrated with the velocity Verlet algorithm,34 using an Andersen thermostat,35 a timestep of 0.5 fs and a SCC tolerance of 10−3 a.u. Initial velocities were assigned according to the Maxwell–Boltzmann distribution. Being the dimension of our systems challenging in the view of a quantum chemical description, our DFTB-MD simulations were limited to a total sampling time of 20 ps, which allowed an affordable computational cost.
The TiO2 NP model was designed by our group in previous works36,37 and consists of a spherical anatase nanoparticle, carved from the crystalline bulk anatase structure and fully relaxed, first at the DFTB level of theory with a simulated annealing procedure, followed then by a DFT-B3LYP optimization. The stoichiometry of the NP is (TiO2)223·10H2O and it is characterized by an equivalent diameter of 2.2 nm (700 atoms, Fig. 1b). In the simulations presented in this study we started from the DFTB-optimized NP to which we added as many N-formylglutamic acid (FGA, Fig. 1c) molecules as possible (52 or 48 depending on the COOH group used to anchor the surface) to reach the highest coverage admissible by the surface available Ti sites and the steric hindrance between attached molecules. FGA is a smaller molecule but analogous to FA. The FGA-functionalized models underwent some thermal treatment through MD simulations and were then fully relaxed at the DFTB level of theory. After that, we converted FGA molecules into FA and only performed partial DFTB geometry optimization (for further details see below).
The FGA or FA molecular adsorption energy on the spherical nanoparticle, Emolads, is defined as:
 | (2) |
![[thin space (1/6-em)]](https://www.rsc.org/images/entities/char_2009.gif) or
or![[thin space (1/6-em)]](https://www.rsc.org/images/entities/char_2009.gif) FA, ENP and EFGA
FA, ENP and EFGA![[thin space (1/6-em)]](https://www.rsc.org/images/entities/char_2009.gif) or
or![[thin space (1/6-em)]](https://www.rsc.org/images/entities/char_2009.gif) FA are, respectively, the DFTB total energy of the whole system, of the bare NP and of a single FGA or FA molecule in the gas phase and nFGA
FA are, respectively, the DFTB total energy of the whole system, of the bare NP and of a single FGA or FA molecule in the gas phase and nFGA![[thin space (1/6-em)]](https://www.rsc.org/images/entities/char_2009.gif) or
or![[thin space (1/6-em)]](https://www.rsc.org/images/entities/char_2009.gif) FA is the number of adsorbed FGA or FA molecules.
FA is the number of adsorbed FGA or FA molecules.
The TiO2/PEG model was obtained by our group in previous studies,38,39 where the nanoparticle was grafted with 50 PEG molecules and fully optimized through MD simulations and atomic relaxation at the DFTB level of theory with the MATORG parameterization set. On this model we added either 10 or 20 FA molecules, as randomly distributed as possible, by a covalent linkage through an ester bond involving the terminal C of PEG and the FA γ-carboxylic group. The FA-functionalized PEGylated TiO2 systems were only partially relaxed at the DFTB level of theory.
2.2. Molecular Mechanics/Molecular Dynamics (MM/MD)
The Molecular Mechanics/Molecular Dynamics method is a classical approach, where the electrons are not described explicitly, and the total potential energy of the system is calculated as a function of a set of empirical parameters and potentials that constitute a force field (FF). In this work, all the classical MD simulations were carried out employing the LAMMPS (19 Aug 2019 version) open-source code.40 The TiO2 NP was described by an improved Matsui–Akaogi FF, reparametrized by Brandt and Lyubartsev,41 while the CGenFF42–44 was chosen for the adsorbed FA molecules and the TIP3P water molecules. We simulated several TiO2/FA systems, with different FA coverages and binding modes to the NP, both in vacuum and in water. The TiO2/FA topologies were generated by means of the Moltemplate45 package for LAMMPS and the systems were immersed in a 100 × 100 × 100 Å3 cubic water box, built up with the Packmol46 software. During all the atomistic MD simulations, we fixed the position of the FA atoms directly bound to the NP at the DFTB geometry and we treated the nanoparticle as a rigid body, as previously done by some of us,47 free to translate and rotate as a whole, fixing its internal degrees of freedom at the DFTB-optimized geometry through the RIGID package48 in LAMMPS. The remaining atoms of the FA molecules and the solvent molecules, instead, were free to evolve in time, at 303 K (NVT ensemble), making use of a constant 2 fs timestep for the integration of the Newton's equations of motion, where the SHAKE algorithm49 imposed holonomic constraints on all the covalent bonds involving hydrogen atoms. Periodic boundary conditions were used.In the case of the TiO2/PEG/FA systems, we fixed the position of the nanoparticle and of the binding hydroxyl group of the PEG chains at the DFTB geometry and we made use of a 135 × 135 × 135 Å3 water box. Long-range electrostatic interactions were evaluated by the particle–particle particle-mesh (PPPM) solver, using a real-space cutoff of 12 Å. Short-range Lennard-Jones interactions were smoothly truncated with a 12 Å cutoff by means of a switching function applied beyond 10 Å. A hundred minimization steps ensured that no overlaps between the atoms occurred, then a 1 ns equilibration followed and finally the phase space was explored for a total production time of 100 ns.
2.3. Simulation analysis
Atomic radial distribution functions (rdf) were computed with the radial distribution function plugin of VMD,50 considering all the atoms at a given distance r from the reference and falling in a spherical crown with a thickness of 0.1 Å.The hydrogen bonds analysis was carried out by means of the hydrogen bonds tool50 provided by VMD. The criteria for the H-bonds classification were set as 3.5 Å for the maximum donor–acceptor distance and 30° for the maximum acceptor–donor-hydrogen angle.
Average interatomic distances and radius of gyration were computed exploiting the interdist tool, included in the open-source software LOOS 3.1.51 In particular, for all the systems we analyzed:
• the distance between the N atom of the amine group of the FA pterin and the six-fold Ti6c atom in the center of the NP, d NFA − NPcenter
• the distance between the FA center of mass (com) and the closest Ti atom of the NP surface, d comFA − NPsurface
For the TiO2/PEG/FA systems, we also evaluated:
• the end-to-end distance of the PEG chains, 〈h2〉½![[thin space (1/6-em)]](https://www.rsc.org/images/entities/char_2009.gif) PEG, i.e. the mean distance between the first and the last heavy atom of each PEG chain (oxygen of the –OH head and carbon of the –CH3 tail)
PEG, i.e. the mean distance between the first and the last heavy atom of each PEG chain (oxygen of the –OH head and carbon of the –CH3 tail)
• the end-to-end distance of the PEG–FA chains, 〈h2〉½![[thin space (1/6-em)]](https://www.rsc.org/images/entities/char_2009.gif) PEG–FA, i.e. the average distance between the first and the last heavy atom of each PEG–FA chain (oxygen of the –OH head of PEG and nitrogen of the –NH2 group of the FA pterin)
PEG–FA, i.e. the average distance between the first and the last heavy atom of each PEG–FA chain (oxygen of the –OH head of PEG and nitrogen of the –NH2 group of the FA pterin)
• the mean distance from the surface of the PEG chains, MDFSPEG, and of the PEG–FA chains, MDFSPEG–FA, i.e. the distance between the center of mass of each PEG residue and the closest Ti atom of the NP surface, for the PEG and the PEG–FA chains, respectively
• the radius of gyration of the PEG and the PEG–FA chains, RPEGg and RPEG–FAg, i.e. the root-mean-square distance between each atom in the chain and the center of mass of the chain itself, normalized by the number of atoms:
 | (3) |
The calculations of the non-bonding interaction energies (vdW and electrostatic) were performed through the USER-TALLY package, implemented in the LAMMPS code.40
The root-mean-square deviation (RMSD) of atomic positions was estimated using the VMD RMSD Trajectory Tool package.50
The diffusion coefficients, D, of the TiO2/FA and TiO2/PEG/FA nanosystems were estimated from the Einstein equation:
| MSD = 2nDt | (4) |
The free energy profile to transfer one FA molecule, covalently bonded to a PEG chain (500 Da, 11 monomeric units) attached to the NP, from the NP surface (10 Å from the NP center) towards the farthest distance compatible with the PEG chain length (40 Å from the NP center) was determined by the Adaptive Biasing Force (ABF) method.52 The mean force, 〈Fξ〉ξ, exerted along the transition coordinate, ξ, is related to the free energy first derivative according to:
 | (5) |
3. Results and discussion
3.1. Building up the TiO2/FA models through quantum mechanical calculations
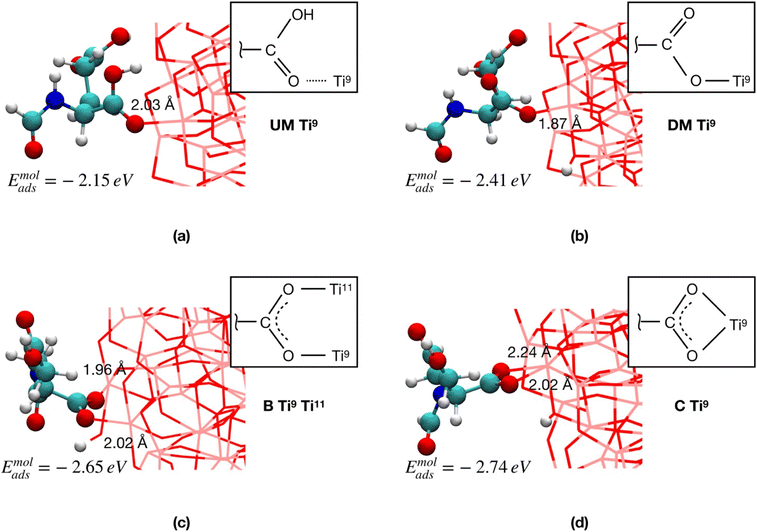
In Fig. 2, we compare four FGA binding modes involving the α-COOH group and the equatorial four-fold Ti sites (Ti9 and Ti11 in Fig. 1b, which were proven to be the most reactive56,57) of the TiO2 NP: undissociated monodentate (UM), dissociated monodentate (DM), bidentate (B) and chelated (C), using the FGA molecular adsorption energy (eqn (2)) as a criterion for the relative stability of these different adsorption modes. For all the dissociative mechanisms, the dissociated proton from FGA was transferred to the nearest two-fold oxygen atom (O2c) of the NP.
The results clearly show that the dissociative adsorption modes are always favored with respect to the non-dissociative ones: in particular, Emolads is 0.26 eV more negative for DM with respect to UM. Moreover, the B and the C coordination modes result, in the order, the most advantageous FGA binding modes with an Emolads that is, respectively, 0.24 and 0.33 eV more negative than that of DM.
On the basis of the results on FGA in this section, we conclude that, by extension, FA would preferentially have the anchoring carboxylic group dissociated on the TiO2 surface, and that the ligand would likely form chelate coordinative bonds with Ti4c atoms and/or bidentate ones with Ti4c or Ti5c atoms, since these adsorption modes are energetically more stable. We rationalize these results as due to the greater energy stabilization by formation of two Ti–O bonds instead of one.
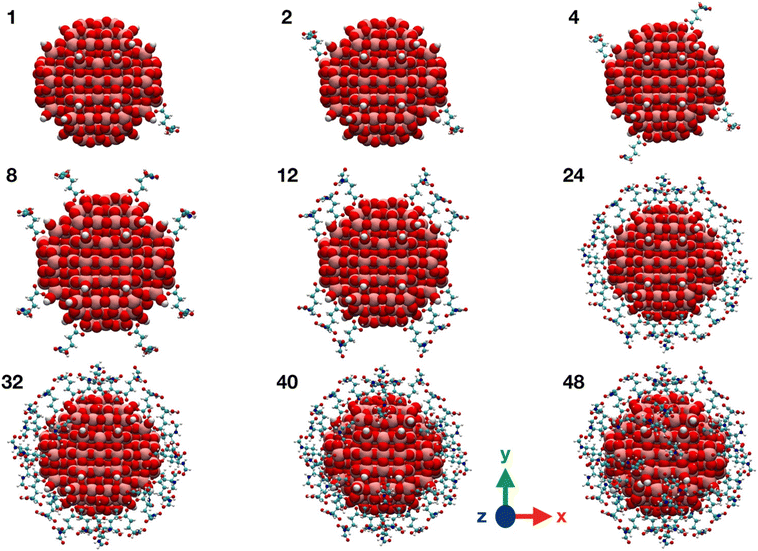 | ||
| Fig. 3 Graphical representations of TiO2/n-FGA-γ system along the FGA covering process. Titanium is shown in pink, oxygen in red, carbon in cyan, nitrogen in blue and hydrogen in white. | ||
| FGA molecular adsorption energies | |||
|---|---|---|---|
| TiO2/n-FGA-α | TiO2/n-FGA-γ | ||
| n FGA | E molads (eV) | n FGA | E molads (eV) |
| 1 | −2.57 | 1 | −2.46 |
| 2 | −2.57 | 2 | −2.44 |
| 4 | −2.50 | 4 | −2.42 |
| 8 | −2.54 | 8 | −2.47 |
| 16 | −2.61 | 12 | −2.77 |
| 24 | −2.59 | 24 | −2.57 |
| 32 | −2.79 | 32 | −2.54 |
| 42 | −2.65 | 40 | −2.34 |
| 52 | −2.56 | 48 | −2.31 |
We observe from Table 1 that the addition of any further FGA molecule is accompanied by a decrease in the adsorption energy, although the effect is not large. This is true until the positions at the NP equator are filled in (12 FGA molecules, TiO2/12-FGA). Then, we considered the tropics of the NP and added FGA molecules both in a chelated and a bidentate fashion: in particular, 16 chelated and 16 bidentate for binding model α, whereas 8 chelated and 20 bidentate for binding model γ. These combinations were dictated by the general aim to get the highest coverage reducing the steric hindrance as much as possible. An increase in the coverage results in a larger adsorption energy, and that is due to the formation of intermolecular hydrogen bonds among the FGA molecules, which become more abundant with increasing adsorbed ligands. Finally, we saturated the Ti atoms at the poles with 8 FGA molecules, 4 chelated and 4 bidentate, in both models. At the end of the process, TiO2/n-FGA systems are characterized by the following composition: binding model α has n = 52 FGA molecules (32 chelated and 20 bidentate), whereas binding model γ has n = 48 FGA molecules (24 chelated and 24 bidentate).
Moreover, from the analysis of data in Table 1, one can notice that the FGA coordination through the α-COOH (binding model α) is energetically more advantageous, reflecting the greater acidity of the α-COOH group, being closer to the electronegative N atom that exerts an electron-withdrawing polar effect. However, it is worth pointing out that the TiO2/12-FGA-γ system is characterized by a notably negative adsorption energy (−2.77 eV), that is the result of an extended network of intermolecular H-bonds among the amide groups of the FGA molecules (see Fig. S1†), which would guide the arrangement of the ligands around the NP equator. Finally, comparing the adsorption energies at highest coverages, the FGA average adsorption energy for TiO2/52-FGA-α results more negative (by 0.25 eV) with respect to that for TiO2/48-FGA-γ.
Therefore, to conclude, although the coordination of any further FGA molecule is always energetically less convenient with respect to the adsorption of the first molecule, the intermolecular FGA–FGA H-bonds can make the average FGA adsorption energy more negative and, thus, contribute to the stabilization of the overall structure. Moreover, according to our results, the α-COOH group of FGA is found to be a better anchoring group than γ-COOH.
| FGA molecular adsorption energies | ||
|---|---|---|
| E molads (eV) | ||
| TiO2/52-FGA-α | TiO2/48-FGA-γ | |
| OPT/DFTB initial | −2.56 | −2.31 |
| MD/DFTB | −2.57 | −2.30 |
| OPT/DFTB final | −2.66 | −2.37 |
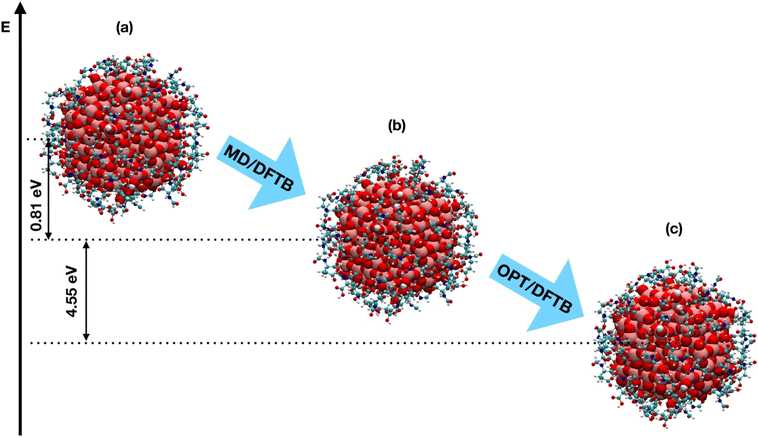
At a first sight, one would observe that the overall arrangement of the ligands around the nanoparticle is not significantly perturbed during the simulation. Nevertheless, as an indicator of the chemical stability of the nanoconjugates, we computed the average distances between the carbon atom of the FGA carboxyl group (α-COOH for TiO2/52-FGA-α system and γ-COOH for TiO2/48-FGA-γ) and the corresponding coordinated Ti atom of the NP, as a function of the simulation time: the trends are shown in Fig. S3.† The plots indicate that the mean C–Ti distances decrease during the heating step, they fluctuate more in the following equilibration phase and, finally, they increase again along the cooling steps. These distance values are compatible with the formation of a bond between the carboxylic group of FGA and a Ti atom of the nanoparticle, therefore we can conclude that the O–Ti bonds between FGA and the NP Ti atoms are preserved all over the simulated annealing simulation.
The observed chemical stability agrees with thermogravimetric analysis (TGA) by Devanand et al.27 on PEGylated FA-functionalized TiO2 NPs and by Mallakpour et al.58 on FA-decorated TiO2 NPs dispersed into a poly(vinyl alcohol) (PVA) polymeric matrix, where FA decomposition occurs in a temperature range of 200–800 °C.
Another quantitative parameter that we could extract from the simulations is the number of established hydrogen bonds: in Fig. S4† we report the time evolution of the H-bonds between FGA–NP fragments and FGA–FGA fragments. Moreover, the advantage of a Born–Oppenheimer MD relies on the fact that during the simulation it is possible to observe bonds breaking and formation and indeed, during the annealing, we could register a proton transfer in TiO2/52-FGA-α system, from the free carboxylic group of one FGA molecule to a near O2c atom of the NP, with the formation of one NP–FGA Ti–O bond in a monodentate configuration (Fig. S5†).
From the results in this section, we conclude that the O–Ti bonds between FGA and the TiO2 NP are stable, even at high temperatures, such as those simulated in the annealing process, and that some proton transfers from FGA to TiO2 may spontaneously occur.
3.2. Classical MD simulations of TiO2/FA systems
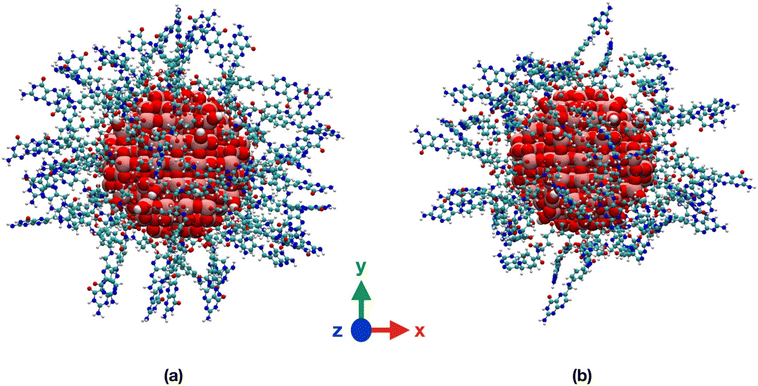
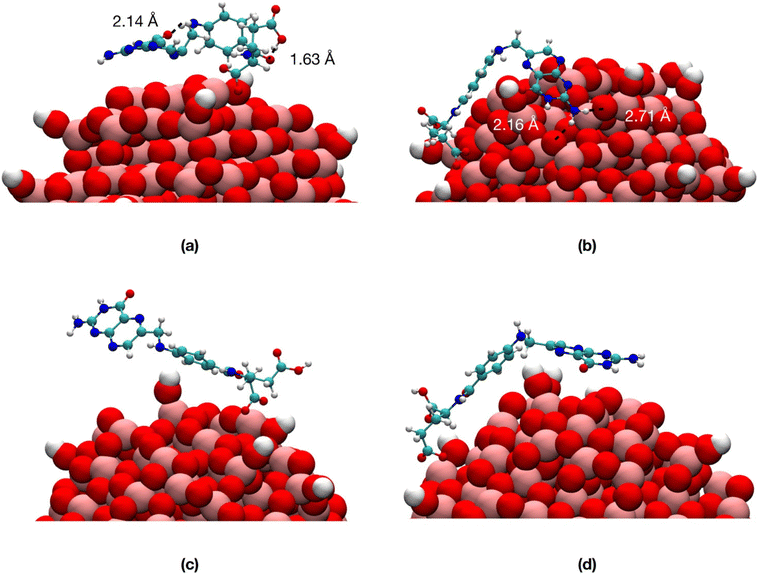
We observe that, in vacuum, FA stays closer to the NP (Fig. 6a and b) with the pterin bent to the TiO2 surface, forming H-bonds with the NP in Fig. 6b and intramolecular H-bonds in Fig. 6a. On the contrary, in water, the ligand is more involved in interactions with the solvent (Fig. 6c and d).
In Table S1† we present the average values of some structural parameters we calculated along the 100 ns simulations, including atomic distances, hydrogen bonds and non-bonding interaction energies. In water, both the center of mass of FA and the terminal amine group of the pterin lie at greater distances from the NP surface and center, respectively, with respect to vacuum. The NP–FA vdW interactions are comparable in vacuum and in water, but that is not true for the electrostatic ones. Indeed, we observe a substantial decrease in the magnitude of the NP–FA electrostatic interactions in water, as the solvent competes with the ligand for the interactions with the NP: this is demonstrated by the magnitude of the NP–water and FA–water electrostatic interactions. On the contrary, in vacuum, the NP–FA electrostatic interactions are stronger and for the TiO2/1-FA-γ system they become even more relevant than the vdW ones.
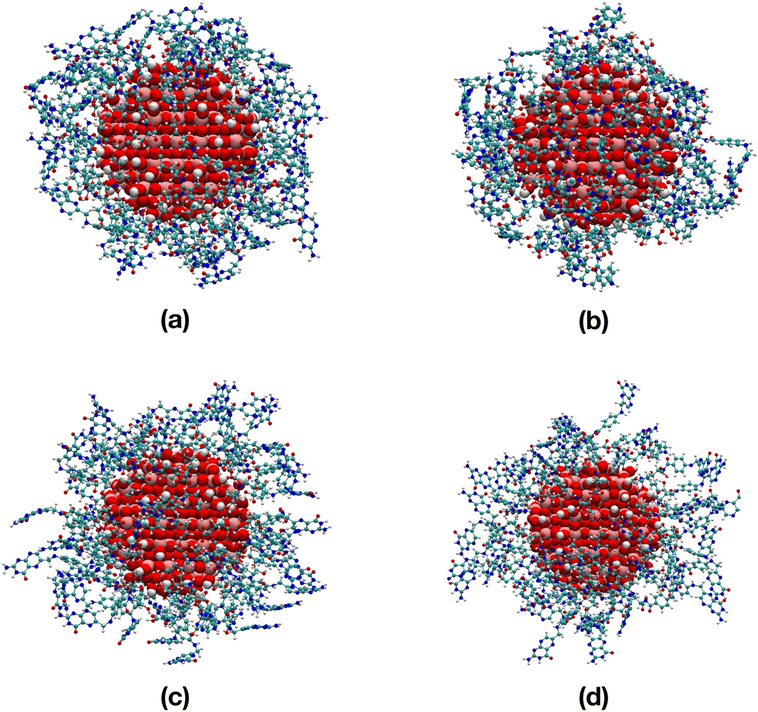
We considered two systems where all the equatorial four-fold Ti10 and Ti11 sites are saturated by 8 FA molecules, which chelate either by the α-COOH or the γ-COOH, respectively. These two structures were obtained from the corresponding TiO2/8-FGA-α and TiO2/8-FGA-γ DFTB-optimized geometries by the substitution of the eight FGA molecules with FA ones. In Fig. S6† the last snapshots of the 100 ns production MD simulations, in vacuum and in water at 303 K, are shown. Along the whole simulation and for both models, the ligands stick to the surface and they self-interact to a greater extent in vacuum than in water, where they can establish favorable interactions with the solvent molecules.
To quantify all these interactions, in Table S2† we list the average atomic distances, hydrogen bonds and non-bonding interaction energies along the 100 ns MD simulations. Once again, in vacuum the FA molecules are found to keep closer to the NP surface, and that is supported by the higher number of NP–FA H-bonds. Also, the interaction among ligands is more pronounced in vacuum, as indicated by the magnitude of the FA–FA H-bonds. The FA–FA interactions are mostly of an electrostatic nature. On the contrary, in water, the FA–FA vdW interactions become predominant in the TiO2/8-FA-γ system and they are the highest (i.e. less favorable) in the TiO2/8-FA-α system, where they are comparable to the electrostatic interactions. Regarding the NP–FA interactions, in all the cases they are predominantly of hydrophobic type. In water we also observe a decrease in the magnitude of the NP–FA vdW interactions and a more significant drop in the magnitude of the electrostatic interactions, compensated by stabilizing ligand–solvent interactions.
Despite the high ligand density, when in vacuum again, the FA molecules bend towards the NP surface in order to maximize the interactions, whereas, in water we observe a competition between the FA–NP and the FA–water interactions.
To quantitatively evaluate this consideration that comes from a first visual inspection, in Table S3† the average atomic distances, hydrogen bonds and non-bonding interaction energies along the 100 ns MD simulations are reported. We notice that the distance of the amine group of the pterin from the center of the nanoparticle only slightly increases when switching from vacuum to an aqueous environment. In line, we do not register an effective variation in the NP–FA H-bonds. What makes the difference, instead, is the extent of the FA–FA H-bonds, which decrease of about 75% from vacuum to water (the greater numbers for the TiO2/52-FA-α system are due to the intrinsic higher number of adsorbed FA molecules). Indeed, the FA–FA electrostatic energy becomes less negative in water, as well as the NP–FA electrostatic energy. Finally, with respect to the TiO2/8-FA systems, the FA–water interactions (per FA molecule) decrease from 115–113 kcal mol−1 (α and γ in Table S2,† respectively) to 95–99 kcal mol−1 (α and γ in Table S3,† respectively). These results clearly indicate a more effective exposure of FA molecules at low coverage with FA/TiO2 weight ratio of 0.2, in line with the experimental findings by Lai et al.21
The increase in the total FA–water interaction energy (van der Waals and electrostatic, Tables S1–S3†) at increasing FA density on the TiO2 NP suggests that the water solubility, and thus dispersibility, of the nanosystems improves as the number of adsorbed ligand molecules increases. Indeed, according to Xie et al.,20 the surface coating of TiO2 NPs with folic acid determines an increase in the magnitude of their zeta potential, up to a value that is close to the threshold of 30 mV, above which NPs are considered to be stably dispersed in the solvent.59
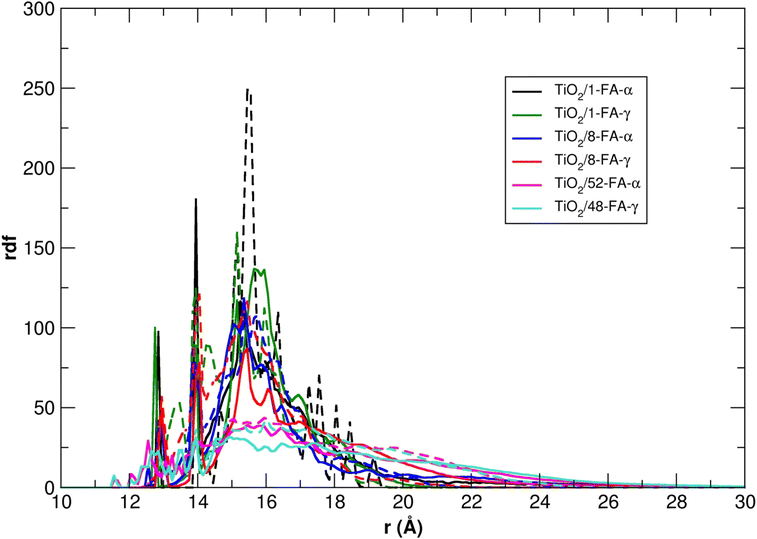
To compare all the TiO2/FA systems considered so far, in Fig. 8 we report the rdf of the FA center of mass with respect to the six-fold coordinated Ti atom at the center of the NP, for each model, averaged over the 100 ns of the MD simulations.
The shape of the rdf curves becomes broader with the increase in the density of adsorbed folic acid molecules, whereas the maximum intensity, located at about 15–16 Å from the NP center, decreases. In addition, the radial distribution of the ligands around the nanoparticle is always broader in water than in vacuum, because the FA molecules have more potential stable conformations due to the interaction with the solvent molecules.
Finally, we study the dynamical properties of the nanoconjugates in an aqueous environment. In Fig. S7,† the root-mean-square deviation of atomic positions (RMSD) plots of the NP + FA systems along the 100 ns MD simulations are shown with respect to the 0 ns-reference atomic positions. The slope of the RMSD vs. time curves is related to the diffusion coefficient of the system. In particular, the slope of the curve relative to the TiO2 systems grafted with a single folic acid molecule (TiO2/1-FA-α) is the highest, which means that this nanoconjugate diffuses through the aqueous medium at the highest velocity. Then, for the other systems, we observe lower slopes of the curves mostly due to the increase in the number of the adsorbed ligands, as the total mass of the NP + FA moiety increases.
The diffusion of the nanoconjugates is a crucial aspect to be studied, as the functionalized nanoparticles, after injection, must reach their cellular target, thus the rate of the transport will influence the efficiency (and therefore, the efficacy) of the nanomedical process. To this purpose, in Table S4† we also report the estimated diffusion coefficients of all the TiO2/n-FA-α systems under investigation in water, computed by the OLS method at MD trajectory intervals showing a linear dependence between the MSD of atomic positions and time (see Section 2.3 for more details). We observe that the values for all systems are of the same order of magnitude (i.e. 10−10 m2 s−1). Moreover, the diffusion coefficients decrease with increasing FA density on the NP.
Overall, the computed diffusion coefficients qualitatively agree with the experimental findings of Domingos et al.,60 who determined the diffusion coefficients of bare and organic acid-functionalized TiO2 nanoparticles (with a diameter of 5 nm) being in the order of magnitude of 10−11 m2 s−1.
3.3. Classical MD simulations of TiO2/PEG systems functionalized with FA molecules
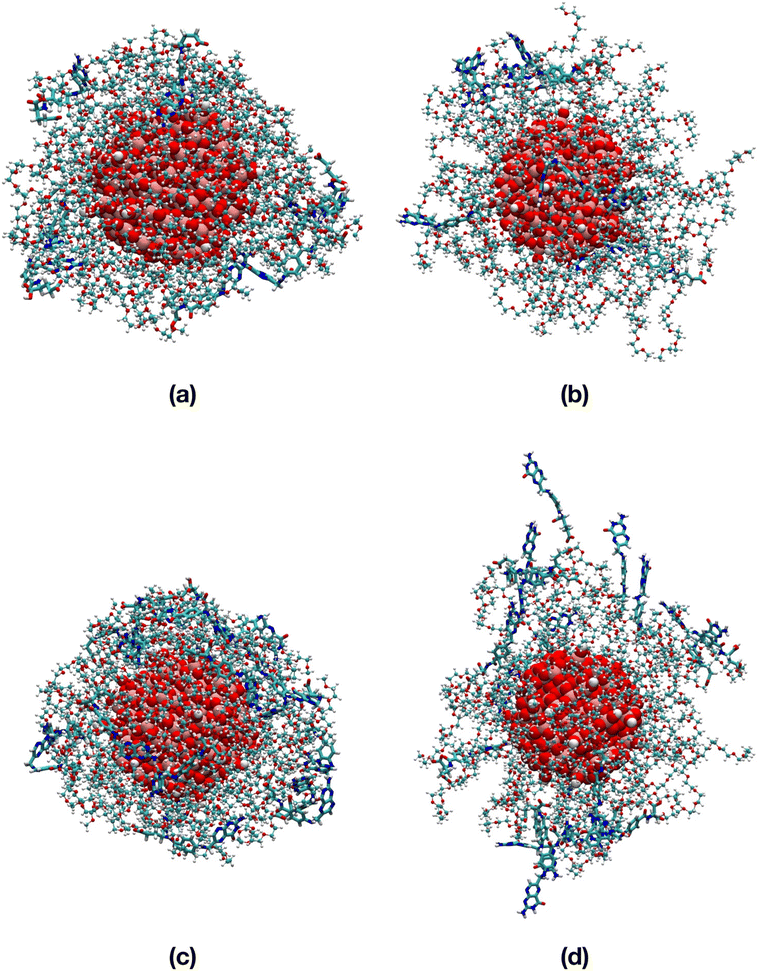
To support our findings, in Table S5† we present an analogue structural analysis that we performed for the TiO2/n-FA systems, evaluating several structural indicators averaged over the 100 ns MD simulations of the TiO2/PEG/10-FA and TiO2/PEG/20-FA systems. We confirm that in vacuum the FA molecules are closer to the TiO2 surface than in water on the basis of the shorter distances between the amine group of the FA pterin and the Ti atom at the center of the NP, as well as the shorter distances of the FA center of mass from the closest Ti atom on the NP surface and the MDFS of the PEG–FA chains or, alternatively, on the basis of the more stabilizing NP–FA vdW and electrostatic interaction energies. Moreover, there is not a big difference in the values of the distance indicators that we obtained for the TiO2/PEG/10-FA and for the TiO2/PEG/20-FA systems. The values of the PEG and PEG–FA radius of gyration reflect the tendency of the PEG polymer chains to surround the NP, i.e. reduced Rg numbers, in line with the end-to-end distances. As a consequence, the NP–PEG and especially the PEG–PEG interaction energies are more negative in vacuum than in water. Finally, it is interesting to point out that the FA–FA interactions play a significant role in the TiO2/PEG/20-FA systems, affecting the interaction energies more than the H-bonds, where the FA–FA vdW energy is respectively 10 and 5 times greater in magnitude both in vacuum and in water compared to the TiO2/PEG/10-FA systems, whereas the FA–FA electrostatic energy is even 400 times more negative in vacuum but just 6 times more negative in water than for the TiO2/PEG/10-FA systems. A similar behavior was reported by us in another work61 for another targeting moiety, i.e. cyclic RGD peptide (cRGD), which we investigated at comparable ligand densities to those considered here for FA and conjugated to the same PEGylated TiO2 nanoparticle.
The FA–FA interactions could play a critical role in the recognition process of FA by the folate receptor on the cell membrane. The FA ligand must well fit into the protein's binding pocket, which could be hampered or prevented by excessive FA–FA interactions.
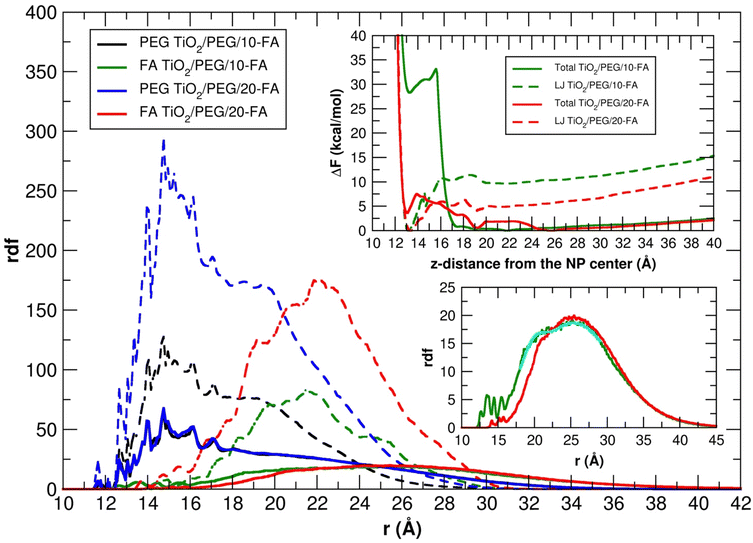
In Fig. 10 we also report the rdf of the PEG and FA center of mass with respect to the six-fold coordinated Ti atom at the center of the nanoparticle, averaged over the 100 ns MD simulations, together with the total and LJ free energy profiles to transfer a FA molecule covalently attached to a PEG chain, from the NP surface towards the farthest distance compatible with the PEG chain length (see Section 2.3 for more details).
The distribution of the PEG molecules is similar in vacuum and in water for both the TiO2/PEG/10-FA and TiO2/PEG/20-FA models, with the maximum of the curves centered at about 15 Å from the Ti atom at the center of the NP. The trends of the FA ligands, instead, look different. In vacuum, the profiles present a principal peak and a few shoulders around it: for the TiO2/PEG/10-FA and the TiO2/PEG/20-FA systems, the maximum peaks are centered at about 21.5 Å and 22 Å from the NP center, respectively. In water, the two FA rdfs are broader: while the TiO2/PEG/20-FA curve has a global maximum centered at 25.5 Å from the center of the NP (red plot in the bottom-right inset of Fig. 10), the TiO2/PEG/10-FA rdf profile (in green) is characterized by a principal peak, centered at 25 Å from the NP center, and a shoulder, located at 21 Å, as obtained from a double-Gaussian fitting of the curve (the fitting trend is shown in cyan). Moreover, there are several more ligands in the range of 10–15 Å in TiO2/PEG/10-FA than in TiO2/PEG/20-FA. These results suggest that in TiO2/PEG/20-FA the FA molecules are more exposed towards the bulk water phase, which nicely agrees with the experimental findings by Naghibi et al.28 of maximized targeting activity for the corresponding weight ratio of 0.5, as mentioned above.
We can gain some valuable insight by comparing the FA rdf profile with that we obtained in another work for the cRGD peptide,61 as mentioned above, in terms of ligand presentation and exposure on the same PEGylated TiO2 NP surface. In Fig. 11a, we overlay the FA rdf profile of the TiO2/PEG/10-FA model (red line) with the one of TiO2/PEG/10-cRGD (blue line), where 10 out of 50 PEG chains are conjugated with the targeting ligands. On the one hand, we observe a higher amount of FA ligands buried in the PEG inner region (12.5–25.0 Å) compared to cRGD ligands. On the other hand, we see that cRGD ligands remain more exposed in the PEG outer region than FA ligands (25.0–40.0 Å). These predictions, based on the MD simulations, remarkably agree with the experimental work by Valencia et al.,62 who found that cRGD peptide stays more exposed on the PEGylated NP surface while FA tends to be more internalized into the polymeric NP, probably due to its higher hydrophobicity compared to cRGD.
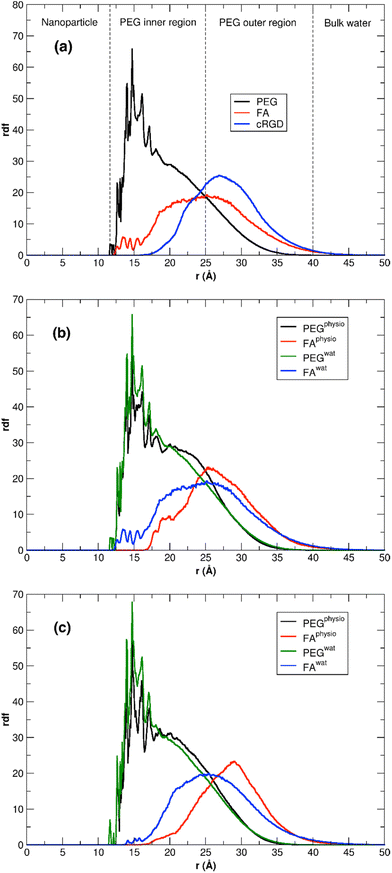 | ||
| Fig. 11 (a) Comparison of FA and cRGD radial distribution function when conjugated to PEGylated TiO2 NPs. PEG and FA profiles are the ones calculated in this work for TiO2/PEG/10-FA model, while the cRGD profile was taken from our recent work61 for the TiO2/PEG system conjugated with the same number of targeting ligands (10 out of 50 PEG chains are conjugated with cRGD). For the sake of comparison, the cRGD profile is normalized in order to get the same integral as the FA profile. PEG inner and outer regions are separated by the point in which PEG and FA profiles cross, while bulk-water phase starts where PEG density goes to zero. (b, c) Comparison of the PEG and FA rdf profiles in water and under physiological conditions for TiO2/PEG/10-FA (b) and TiO2/PEG/20-FA (c) models. | ||
In the top-right inset, the results of the free energy calculations are reported (refer to Section 2.3 for computational details). The LJ profiles of both the TiO2/PEG/10-FA and the TiO2/PEG/20-FA systems (dashed-green and dashed-red lines, respectively) present a global minimum at z-distances of about 13 and 13.5 Å from the NP center, which correspond to the restrained, uncharged FA molecule (see Section 2.3) interacting with the NP surface by short-range vdW forces. Moreover, for the TiO2/PEG/20-FA system, the position of this minimum (dashed-red line) coincides with that of a local minimum in the total free energy curve (solid-red line), whose global minimum, however, is set at z-distance of about 25.5 Å, in good agreement with the position of the maximum (solid-red line) in the corresponding rdf profile (at about 25.5 Å). Differently, the total free energy profile of the TiO2/PEG/10-FA system (solid-green line) is characterized by a first local minimum at a z-distance of about 13.5 Å from the NP center and another global minimum at about 22 Å, which well justifies the shoulder of the relative rdf curve (solid-green line, at about 21 Å).
To better understand this behavior, in Fig. S10† we report some representative snapshots of the TiO2/PEG/10-FA system from the MD/ABF calculations, with the FA molecule restrained at different z-distances from the NP surface. In particular, we observe that the p-aminobenzoate ring changes its orientation from parallel (z-distance 10–15 Å, Fig. S10a†) to perpendicular (z-distance 15–20 Å, Fig. S10b†) with respect to the NP surface: we believe that this second configuration is associated to a higher free energy. For the sake of completeness, in Fig. S11† we also report the snapshots of the TiO2/PEG/20-FA MD simulations. It is noteworthy to point out that the free energy profiles of Fig. 10 do not reach a plateau at increasing z-distance from the NP center: this is because the restrained FA molecule is covalently linked to a PEG chain, therefore pushing FA at high z-distances from the NP causes an increase of the free energy that comes from the constraint imposed by attached PEG chain, which in turn is covalently bound to the NP.
Finally, we analyze the dynamical properties of the TiO2/PEG/FA nanoconjugates in an aqueous environment. In Fig. S12,† the root-mean-square deviation (RMSD) plots of the NP + PEG + FA system's atomic positions along the 100 ns MD simulations, with respect to the 0 ns-reference atomic positions, are shown. The trends of RMSD vs. time are similar: the slopes of the two curves have comparable magnitudes, which suggests that, according to our simulations, the two systems, i.e. the TiO2/PEG/10-FA and the TiO2/PEG/20-FA ones, diffuse in water with equivalent velocities. This is reasonable, since the two systems differ only for the number of the FA molecules, while the core of the nanosystem, i.e. the TiO2 nanoparticle functionalized with the 50 PEG molecules, which mainly contributes to the mass of the whole structures, is the same.
To confirm these considerations, in Table S6† we report the estimated diffusion coefficients of the two TiO2/PEG/FA systems in water, computed by the OLS method at MD trajectory intervals showing a linear dependence between MSD and time. Once again, as in Section 3.2.3, the diffusion coefficient values are in the order of magnitude of 10−10 m2 s−1. In addition, the diffusion results slightly slower when the FA density is higher.
3.4. MD simulations in physiological environment
This last section presents the MD results for the high-coverage TiO2/n-FA and the TiO2/PEG/n-FA systems under physiological conditions (0.15 M NaCl aqueous solution). Here, we aim at understanding how the introduction of some ionic strength affects the structural and dynamical properties of the nanoconjugates. For this purpose, we have performed the same structural analysis as previously done in Sections 3.2.1 to 3.3.2 for the TiO2/52-FA-α, TiO2/48-FA-γ, TiO2/PEG/10-FA, and TiO2/PEG/20-FA systems in pure water, over the last 100 ns of MD production phase, as detailed in Table S7 of the ESI.† In the case of the TiO2/52-FA-α and TiO2/48-FA-γ models, no significant changes are observed, in particular, in the rdf profiles of FA in Fig. S13,† suggesting that the distribution of FA molecules tethered on the NP surface is little affected by the presence of ions in solution (Tables S7 vs. S3†). This was quite predictable considering the lower number of degrees of freedom for TiO2/n-FA systems, where FA molecules are directly anchored to the NP surface, than for TiO2/PEG/n-FA. In this respect, we would expect more significant changes for the PEGylated systems. Indeed, according to data in Table S7,† we observe an enhancement in the FA-solution interactions, evidenced by a higher number of H-bonds and more favorable intermolecular interaction energies. On the other hand, the NP–FA interactions, which are already weak in pure water, become essentially null under physiological conditions. In Fig. 11b and c, rdf profiles for TiO2/PEG/n-FA with n = 10 or 20, respectively, in pure water and in physiological conditions are superimposed. It is evident that the rdf profiles of FA are narrower and more shifted towards the bulk-water phase in the presence of NaCl in solution, where FA can interact with the ions, and, also, that this effect is more pronounced in the TiO2/PEG/20-FA system. Moreover, under physiological conditions, the intensity of the FA rdf is null in the region closer to the NP surface for both systems with n = 10 and n = 20, whereas in the PEG inner region is lower compared to the simulations in pure water. Our findings are encouraging, as they suggest that in more realistic conditions (e.g. in a solution with ionic strength) these functionalized and PEGylated nanoconjugates would serve as more efficient nanomedical devices, being the FA moieties less interacting with the NP surface and more exposed to the extracellular fluid and, hence, to the folate receptors.Finally, in Table S8† we report the estimated diffusion coefficients for the high-coverage TiO2/n-FA and for the TiO2/PEG/n-FA systems under physiological conditions. All the values are in the order of magnitude of 10−10 m2 s−1, similar to the ones predicted in pure water (Tables S4 and S6†). Our results show that the presence of ions in solution has little impact on the diffusion of the nanoconjugates in solution.
4. Conclusions
In this work, we have simulated the dynamics of titanium dioxide nanoparticles, when these are functionalized with folic acid, which is an efficient targeting agent of several tumor cell lines. First, we have built, through quantum mechanical modeling at the DFTB level of theory, several TiO2/n-FA systems, with increasing folic acid density and considering both the carboxylic groups of the ligand as anchoring groups. Our results reveal that the dissociative chelated and bidentate binding modes are energetically more advantageous and that the α-COO− is the best anchoring carboxylate group. Moreover, the DFTB simulated annealing calculations confirmed the chemical stability of the nanoconjugates, when the effect of the temperature (500 K) is considered. Using the DFTB-optimized geometries as a starting point, we have performed long classical molecular dynamics simulations (100 ns) both in vacuum, pure water and under physiological conditions. In general, we have observed a strong interplay in vacuum between folic acid molecules and the NP surface through hydrophobic and electrostatic interactions, whereas in water there is a fair competition between ligand/NP and ligand/solvent interactions. We have also determined the dynamical properties of the nanoconjugates by computing their diffusion coefficients in water and observed a nice correlation with the total mass of the systems.Due to the fact that the close contact and the large interaction of folic acid molecules with the NP surface could hamper its binding to the folate receptor, we have decided to design models where a spacer is introduced between the NP and the FA molecule. In particular, we prepared two models where the NP is grafted by 50 PEG chains, among which some (10 or 20) were selected to be covalently bonded to folic acid molecules at the opposite end. Based on the classical MD simulations of these two models and on some free energy calculations we could prove that the introduction of the molecular spacer reduces the extent of the NP–folic acid interactions, which becomes even less pronounced under physiological conditions.
However, we have noticed that the folic acid content is a crucial parameter that highly affects the amount of the FA–FA intermolecular interactions but not much the diffusion coefficient of the nanosystems. According to our results and in agreement with the experiments,21,28 an optimal fairly low density of FA molecules in the nanoconjugates (FA/TiO2 weight ratio of about 0.2 for TiO2/n-FA and of about 0.5 for TiO2/PEG/n-FA) is expected to boost more efficiently their performance in targeting tumor cells, due to a more pronounced availability of the ligands for the folate receptor.
Conflicts of interest
The authors declare no conflict of interest.Acknowledgements
The authors are grateful to Lorenzo Ferraro for his technical support and to Enrico Bianchetti for useful suggestions. The project has received funding from the European Research Council (ERC) under the European Union's HORIZON2020 research and innovation programme (ERC Grant Agreement No. [647020]) and from the University of Milano-Bicocca FAQC 2020 for the project “Photodynamic therapy for brain tumors by multifunctional particles using in situ Cerenkov and radioluminescence light”.References
- M. Liong, J. Lu, M. Kovochich, T. Xia, S. G. Ruehm, A. E. Nel, F. Tamanoi and J. I. Zink, ACS Nano, 2008, 2, 889–896 CrossRef CAS.
- H. Shi, R. Magaye, V. Castranova and J. Zhao, Part. Fibre Toxicol., 2013, 10, 15 CrossRef CAS PubMed.
- A. K. Iyer, G. Khaled, J. Fang and H. Maeda, Drug Discovery Today, 2006, 11, 812–818 CrossRef CAS PubMed.
- M. Ajdary, M. Moosavi, M. Rahmati, M. Falahati, M. Mahboubi, A. Mandegary, S. Jangjoo, R. Mohammadinejad and R. Varma, Nanomaterials, 2018, 8, 634 CrossRef PubMed.
- Z. Tang, D. Li, H. Sun, X. Guo, Y. Chen and S. Zhou, Biomaterials, 2014, 35, 8015–8027 CrossRef CAS PubMed.
- W. Chen, Z. Sun and L. Lu, Angew. Chem., Int. Ed., 2021, 60, 5626–5643 CrossRef CAS PubMed.
- C. P. Leamon and P. S. Low, Drug Discovery Today, 2001, 6, 44–51 CrossRef CAS.
- J. Sudimack and R. J. Lee, Adv. Drug Delivery Rev., 2000, 41, 147–162 CrossRef CAS PubMed.
- T. M. Allen, Nat. Rev. Cancer, 2002, 2, 750–763 CrossRef CAS.
- A. Gabizon, Adv. Drug Delivery Rev., 2004, 56, 1177–1192 CrossRef CAS PubMed.
- H. Wang, P. Zhao, X. Liang, X. Gong, T. Song, R. Niu and J. Chang, Biomaterials, 2010, 31, 4129–4138 CrossRef CAS.
- A. Patri, J. Kukowskalatallo and J. Baker Jr., Adv. Drug Delivery Rev., 2005, 57, 2203–2214 CrossRef CAS.
- F. Porta, G. E. M. Lamers, J. Morrhayim, A. Chatzopoulou, M. Schaaf, H. den Dulk, C. Backendorf, J. I. Zink and A. Kros, Adv. Healthcare Mater., 2013, 2, 281–286 CrossRef CAS.
- D. Laha, A. Pramanik, S. Chattopadhyay, S. k. Dash, S. Roy, P. Pramanik and P. Karmakar, RSC Adv., 2015, 5, 68169–68178 RSC.
- S. Chattopadhyay, S. K. Dash, T. Ghosh, D. Das, P. Pramanik and S. Roy, Cancer Nanotechnol., 2013, 4, 103–116 CrossRef PubMed.
- S. Rajkumar and M. Prabaharan, Colloids Surf., B, 2020, 186, 110701 CrossRef.
- Y. Zhang, N. Kohler and M. Zhang, Biomaterials, 2002, 23, 1553–1561 CrossRef CAS.
- J. Ai, B. Liu and W. Liu, Mater. Sci. Eng., C, 2017, 76, 1181–1187 CrossRef CAS PubMed.
- X. Liang, Y. Xie, J. Wu, J. Wang, M. Petković, M. Stepić, J. Zhao, J. Ma and L. Mi, J. Photochem. Photobiol., B, 2021, 215, 112122 CrossRef CAS.
- J. Xie, X. Pan, M. Wang, L. Yao, X. Liang, J. Ma, Y. Fei, P.-N. Wang and L. Mi, Nanomaterials, 2016, 6, 113 CrossRef.
- T.-Y. Lai and W.-C. Lee, J. Photochem. Photobiol., A, 2009, 204, 148–153 CrossRef CAS.
- W. Tao, X. Zhu, X. Yu, X. Zeng, Q. Xiao, X. Zhang, X. Ji, X. Wang, J. Shi, H. Zhang and L. Mei, Adv. Mater., 2017, 29, 1603276 CrossRef.
- M. E. Alea-Reyes, M. Rodrigues, A. Serrà, M. Mora, M. L. Sagristá, A. González, S. Durán, M. Duch, J. A. Plaza, E. Vallés, D. A. Russell and L. Pérez-García, RSC Adv., 2017, 7, 16963–16976 RSC.
- Z. Zhen, W. Tang, W. Zhang and J. Xie, Nanoscale, 2015, 7, 10330–10333 RSC.
- S. Yan, Q. Huang, J. Chen, X. Song, Z. Chen, M. Huang, P. Xu and J. Zhang, Int. J. Nanomed., 2019, 14, 6799–6812 CrossRef CAS PubMed.
- J. V. Jokerst, T. Lobovkina, R. N. Zare and S. S. Gambhir, Nanomedicine, 2011, 6, 715–728 CrossRef CAS.
- G. Devanand Venkatasubbu, S. Ramasamy, V. Ramakrishnan and J. Kumar, Adv. Powder Technol., 2013, 24, 947–954 CrossRef CAS.
- S. Naghibi, H. R. Madaah Hosseini, M. A. Faghihi Sani, M. A. Shokrgozar and M. Mehrjoo, Ceram. Int., 2014, 40, 5481–5488 CrossRef CAS.
- Z. Shah, S. Nazir, K. Mazhar, R. Abbasi and I. M. Samokhvalov, Photodiagn. Photodyn. Ther., 2019, 27, 173–183 CrossRef CAS PubMed.
- M. Elstner, D. Porezag, G. Jungnickel, J. Elsner, M. Haugk, Th. Frauenheim, S. Suhai and G. Seifert, Phys. Rev. B: Condens. Matter Mater. Phys., 1998, 58, 7260–7268 CrossRef CAS.
- B. Aradi, B. Hourahine and Th. Frauenheim, J. Phys. Chem. A, 2007, 111, 5678–5684 CrossRef CAS PubMed.
- D. Selli, G. Fazio, G. Seifert and C. Di Valentin, J. Chem. Theory Comput., 2017, 13, 3862–3873 CrossRef CAS.
- H. Hu, Z. Lu, M. Elstner, J. Hermans and W. Yang, J. Phys. Chem. A, 2007, 111, 5685–5691 CrossRef CAS.
- L. Verlet, Phys. Rev., 1967, 159, 98–103 CrossRef CAS.
- H. C. Andersen, J. Chem. Phys., 1980, 72, 2384–2393 CrossRef CAS.
- G. Fazio, L. Ferrighi and C. Di Valentin, J. Phys. Chem. C, 2015, 119, 20735–20746 CrossRef CAS.
- D. Selli, G. Fazio and C. Di Valentin, J. Chem. Phys., 2017, 147, 164701 CrossRef.
- D. Selli, M. Tawfilas, M. Mauri, R. Simonutti and C. Di Valentin, Chem. Mater., 2019, 31, 7531–7546 CrossRef CAS PubMed.
- D. Selli, S. Motta and C. Di Valentin, J. Colloid Interface Sci., 2019, 555, 519–531 CrossRef CAS PubMed.
- S. Plimpton, J. Comput. Phys., 1995, 117, 1–19 CrossRef CAS.
- E. G. Brandt and A. P. Lyubartsev, J. Phys. Chem. C, 2015, 119, 18110–18125 CrossRef CAS.
- K. Vanommeslaeghe, E. Hatcher, C. Acharya, S. Kundu, S. Zhong, J. Shim, E. Darian, O. Guvench, P. Lopes, I. Vorobyov and A. D. Mackerell, J. Comput. Chem., 2009, 31, 671–690 Search PubMed.
- I. Soteras Gutiérrez, F.-Y. Lin, K. Vanommeslaeghe, J. A. Lemkul, K. A. Armacost, C. L. Brooks and A. D. MacKerell, Bioorg. Med. Chem., 2016, 24, 4812–4825 CrossRef.
- K. Vanommeslaeghe, E. P. Raman and A. D. MacKerell, J. Chem. Inf. Model., 2012, 52, 3155–3168 CrossRef CAS PubMed.
- A. I. Jewett, D. Stelter, J. Lambert, S. M. Saladi, O. M. Roscioni, M. Ricci, L. Autin, M. Maritan, S. M. Bashusqeh, T. Keyes, R. T. Dame, J.-E. Shea, G. J. Jensen and D. S. Goodsell, J. Mol. Biol., 2021, 433, 166841 CrossRef CAS.
- L. Martínez, R. Andrade, E. G. Birgin and J. M. Martínez, J. Comput. Chem., 2009, 30, 2157–2164 CrossRef.
- P. Siani and C. Di Valentin, Nanoscale, 2022, 14, 5121–5137 RSC.
- H. Kamberaj, R. J. Low and M. P. Neal, J. Chem. Phys., 2005, 122, 224114 CrossRef CAS.
- J.-P. Ryckaert, G. Ciccotti and H. J. C. Berendsen, J. Comput. Phys., 1977, 23, 327–341 CrossRef CAS.
- W. Humphrey, A. Dalke and K. Schulten, J. Mol. Graphics, 1996, 14, 33–38 CrossRef CAS.
- T. D. Romo, N. Leioatts and A. Grossfield, J. Comput. Chem., 2014, 35, 2305–2318 CrossRef CAS.
- J. Hénin, G. Fiorin, C. Chipot and M. L. Klein, J. Chem. Theory Comput., 2010, 6, 35–47 CrossRef.
- P. Siani, E. Donadoni, L. Ferraro, F. Re and C. Di Valentin, Biochim. Biophys. Acta, Biomembr., 2022, 1864, 183763 CrossRef CAS.
- Z. Wu, X. Li, C. Hou and Y. Qian, J. Chem. Eng. Data, 2010, 55, 3958–3961 CrossRef CAS.
- M. Fernández, F. Javaid and V. Chudasama, Chem. Sci., 2018, 9, 790–810 RSC.
- G. Fazio, D. Selli, L. Ferraro, G. Seifert and C. Di Valentin, ACS Appl. Mater. Interfaces, 2018, 10, 29943–29953 CrossRef CAS PubMed.
- C. Ronchi, M. Datteo, M. Kaviani, D. Selli and C. Di Valentin, J. Phys. Chem. C, 2019, 123, 10130–10144 CrossRef CAS.
- S. Mallakpour and B. Seyfi, Mater. Chem. Phys., 2022, 281, 125809 CrossRef CAS.
- D. H. Everett, Basic Principles of Colloid Science, Royal Society of Chemistry, London, 1988 Search PubMed.
- R. F. Domingos, N. Tufenkji and K. J. Wilkinson, Environ. Sci. Technol., 2009, 43, 1282–1286 CrossRef CAS PubMed.
- P. Siani, G. Frigerio, E. Donadoni and C. Di Valentin, J. Colloid Interface Sci., 2022, 627, 126–141 CrossRef CAS.
- P. M. Valencia, M. H. Hanewich-Hollatz, W. Gao, F. Karim, R. Langer, R. Karnik and O. C. Farokhzad, Biomaterials, 2011, 32, 6226–6233 CrossRef CAS.
Footnote |
| † Electronic supplementary information (ESI) available. See DOI: https://doi.org/10.1039/d2nr02603a |
| This journal is © The Royal Society of Chemistry 2022 |

