
 Open Access Article
 This Open Access Article is licensed under a Creative Commons Attribution-Non Commercial 3.0 Unported Licence
Quantitative electrostatic force tomography for virus capsids in interaction with an approaching nanoscale probe†‡
Christopher D.
Cooper§
 ab,
Ian
Addison-Smith
a and
Horacio V.
Guzman§
*cd
ab,
Ian
Addison-Smith
a and
Horacio V.
Guzman§
*cd
aDepartment of Mechanical Engineering, Universidad Técnica Federico Santa María, 2390123 Valparaíso, Chile
bCentro Científico Tecnológico de Valparaíso (CCTVal), 2390123 Valparaíso, Chile
cDepartment of Theoretical Physics, Jožef Stefan Institute, Jamova 39, 1000 Ljubljana, Slovenia. E-mail: horacio.guzman@ijs.si
dDepartamento de Física Teórica de la Materia Condensada, Universidad Autónoma de Madrid, E-28049 Madrid, Spain
First published on 3rd August 2022
Abstract
Electrostatic interactions are crucial for the assembly, disassembly and stability of proteinaceous viral capsids. Moreover, at the molecular scale, elucidating the organization and structure of the capsid proteins in response to an approaching nanoprobe is a major challenge in biomacromolecular research. Here, we report on a generalized electrostatic model, based on the Poisson–Boltzmann equation, that quantifies the subnanometric electrostatic interactions between an AFM tip and a proteinaceous capsid from molecular snapshots. This allows us to describe the contributions of specific amino acids and atoms to the interaction force. We show validation results in terms of total electrostatic forces with previous semi-empirical generalized models at available length scales (d > 1 nm). Then, we studied the interaction of the Zika capsid with conical and spherical AFM tips in a tomography-type analysis to identify the most important residues and atoms, showing the localized nature of the interaction. This method can be employed for the interpretation of force microscopy experiments in fundamental virological characterization and in diverse nanomedicine applications, where specific regions of the protein cages are aimed to electrostatically interact with molecular sized functionalized inhibitors, or tailoring protein-cage functional properties for nucleic acid delivery.
Introduction
A nanoscale description of electrostatic interactions is crucial for understanding and controlling function in biological systems. In particular, the interactions at the atomistic and molecular (subnanometric) resolutions are of predominant interest in proteinaceous capsids, membranes and whole viruses.1–8 For a few decades, the physical virology community has employed diverse experimental techniques, like force microscopy, to learn more about the mechanical and electrostatic properties of biomacromolecular systems.9–19 However, the amount of viruses that are electrostatically characterized at the nanoscale (i.e. few nanometers) are scarce, where we can highlight the pioneering work from de Pablo and co-workers.11 One of the limiting factors for measuring the electrostatic force between an AFM tip and a virus capsid lies on the subtle balance required between the size of the tip and the spatial resolution that can be achieved. In other words, for sharper tips the interacting surface is smaller, and hence, the capacitance between the tip and surface also decreases. Nonetheless, there are additional techniques20–22 that can be applied to overcome this issue of resolution and, for example, distinguish motifs of different axis of icosahedral virus particles, such as the five-fold (S5), three-fold (S3), and two-fold (S2) symmetries.7 A challenging aspect in the measurement of the electrostatic forces with scanning probe techniques is the identification of the symmetry of the virus surface with a reasonable accuracy, and a quantitative interpretation of the experimental observations, which has been only provided for mechanical characterization.23 Such an aspect can be only tackled by reconstructing the amino acid based and also atomistic contributions of the local proteins to the detected force by the nanoprobe.Here, we developed a computational approach to determine the electrostatic force arising from the interaction between a spherical/conical nanoprobe and a viral capsid. We use a Poisson–Boltzmann model that considers an implicit solvent, but has an atomistic description of the virus capsid. The novelty of this method is the quantification between the different contributions to the total electrostatic force sensed by the nanoprobe, namely, from the partial charges of the biomacromolecule, from the dielectric jump on the molecular surface, and from the osmotic pressure due to the ions in the solvent. In addition, this analysis allows us to identify the contribution of each amino acid in the interplay between the capsid and the nanoprobe. This paves the way for detailed studies of electrostatic-based recognition processes at the nanoscale, such as investigating virus symmetry based on its charge distribution, the binding of molecular inhibitors to proteinaceous capsids, and the envisioned design of next generation nanocarriers with optimized electrostatic properties.24
Methods
The Poisson–Boltzmann model
The Poisson–Boltzmann equation arises from applying continuum electrostatics on a dielectric that contains mobile ions. This has a direct application in biomolecular simulations, as biologically relevant systems consider solvents with salt that are free to move according to the local electric field. In fact, the Poisson–Boltzmann model is widely used to compute mean-field potentials and solvation free energies of biomolecules.25,26 It has also been applied to simulate forces in AFM experiments of flat membranes,27 proving it as an appropriate approximation in this setting, especially at values ≤20 mM.This continuum approach allows us to generate a so-called implicit-solvent model28,29 (see Fig. 1) that describes a dissolved molecule as a low-dielectric, salt-free cavity inside an infinite “solvent” domain (Ωw in Fig. 1). The “solute” region (Ωm in Fig. 1) also contains a set of Dirac delta functions to represent the partial charges. These two regions are interfaced by some definition of a molecular surface (Γm in Fig. 1), in our case, the solvent-excluded surface. In this work, we study the interaction between a biomolecule (the virus capsid) and a AFM tip (Γt in Fig. 1), which is included as a charged surface. For the case of electrostatics, this can be represented mathematically as:

 | (1) |
 | ||
| Fig. 1 Setup of computational experiments for capsid-tip electrostatic interaction calculations. | ||
Rather than solving the system of partial differential equations in eqn (1) directly, we use the boundary integral approach in the PyGBe code.30 PyGBe has already been validated in settings with proteins interacting with charged surfaces,31,32 and is capable of simulating full viral structures accurately in reasonable time.33 Here, equations are solved numerically on the molecular and tip surfaces only with a boundary element method (BEM), allowing an accurate representation of the molecular structure, and the potential decays exactly to zero at infinity by construction. With PyGBe, we compute the so-called reaction potential: ϕr=ϕm − ϕc, with ϕc the Coulomb potential from the point-type partial charges, which remains constant in all simulations. Further details on the Poisson–Boltzmann solver are contained in the ESI.‡
Electrostatic forces with Poisson–Boltzmann
There are a variety of ways to compute the electrostatic forces using the Poisson–Boltzmann model.34 Here, we decompose the total force as: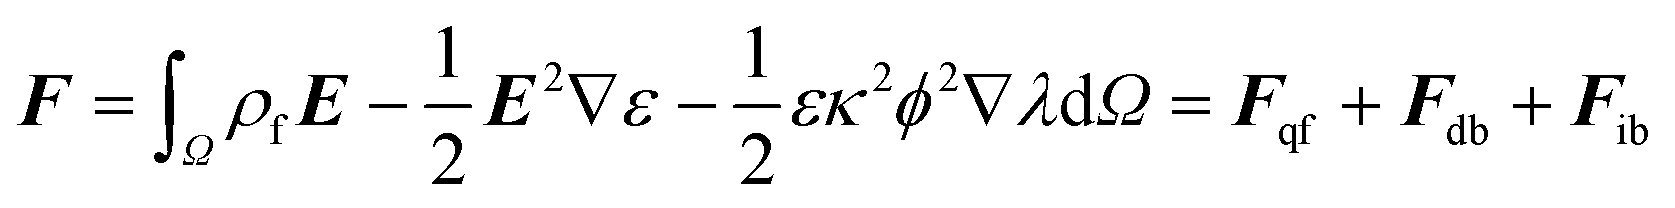 | (2) |
 | (3) |
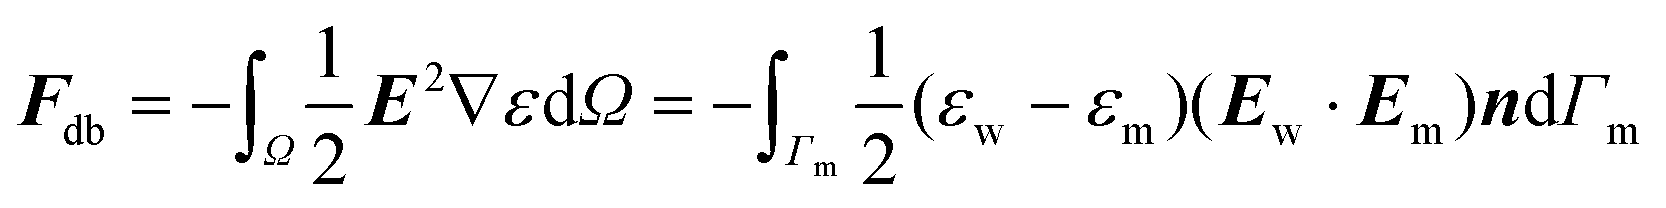
On the other hand, Fdb corresponds to the pressure due to the dielectric jump on the interface. This is usually computed as a volume integral,35 but it can be written as a boundary integral, which is convenient for our BEM scheme:
 | (4) |
The third term in eqn (2) arises from the sudden jump in ionic concentration on the molecular surface (from κ = 0 inside the molecule to κ = 0.046 Å−1 in the solvent):
 | (5) |
Computational experiments
We parameterized a Zika structure available on the protein data bank (PDB code 6CO836) using the Amber force field to determine the charges and atomic radii inside the solute region (Ωm in Fig. 1), considering a pH = 7 to determine the protonation state with PROPKA. We represented the AFM tip as a cone with a 15 nm-rounded point with surface charge σtip = −2.5 mC m−2, which corresponds to the charge induced on a surface immerse in water at pH 7.37 The solvent had 20 mM of salinity. Initially, we performed simulations of the Zika structure and the sphere over 150 nm away as a reference state, and then placed them at different distances (d in Fig. 1) in the +x axis, to examine how the electrostatic force changed as they get closer. There are only a few detailed studies of the Zika protein constituents,38,39 therefore the relevance of complementing those with the whole capsid electrostatic interactions. All simulations were static, and we did not consider any conformational changes of the capsid throughout. However, this method can be combined to further snapshots from MD trajectories.33 After parameterizing the structure, we meshed the solvent-excluded surface with 3.5 elements per Å2 using Nanoshaper.40 The molecular structure and mesh were inputs for PyGBe to compute the interaction force between the capsid and the AFM tip represented as a sphere, placed at different distances.41Results and discussion
In order to quantify the total electrostatic force we calculated the difference in force on the capsid with the tip close-by and far away. These results are presented in Fig. 2, where we see a repulsive force that slowly drops as the tip moves away. As a reference, we included the interaction force computed with an semi-empirical relation.11 This relation was fitted with experimental results for the minute virus of mice, which has a similar charge and size to Zika. We observed a dominant interaction force is on the charges (Fqf), whereas the forces on the dielectric boundary Fdb are greater in magnitude than the ionic force Fib. Note also that Fdb is an attractive contribution to the force, while Fib remains repulsive. | ||
| Fig. 2 Components of the electrostatic force. The segmented line corresponds to the total force computed with a semi-empirical approach.11 | ||
One advantage of the Poisson–Boltzmann model is the fine-grain representation of the molecular geometry, which allows us to determine the distribution of force across atoms with eqn (3).
Fig. 3(a) shows the per-atom interaction force (force magnitude normalized by the total ![[F with combining macron]](https://www.rsc.org/images/entities/b_i_char_0046_0304.gif) qf), indicating that the atoms located closer to the tip are also concentrating most of the contribution to the total force (close-up view of Fig. 3(a) in Fig. S1(a)‡ of the SM). Note that the nanoprobe approaches from the right end in the x-axis. From the experimental AFM viewpoint, the dependence on the distance is a well-known observable of the sensed molecular interactions. In order to cover this aspect from the theoretical perspective, we analyzed the atoms corresponding to each amino acid based on 5 Å thick slices (normal to the x-direction), which resembles the tip-capsid distance in a similar form as AFM subsurface imaging.42 This feature also facilitated the interpretation of the depth of the tip effect inside the virus capsid (Fig. 3(b) shows a cross-section cut at x = 210 Å). Remarkably, such a small slice contains 8053 atoms, however only 228 of them are subject to a force equal or greater to 5% of the total fq. Even though this may seem an expected behavior, it means that there is a strong locality in the tip-capsid interaction. Fig. 3(c) is a close up of Fig. 3(b), but also recognizes the three amino acids (GLU, ASP and LYS) that sense the highest force. Here, we remark the capabilities and novelty of our fine-grain computational approach.
qf), indicating that the atoms located closer to the tip are also concentrating most of the contribution to the total force (close-up view of Fig. 3(a) in Fig. S1(a)‡ of the SM). Note that the nanoprobe approaches from the right end in the x-axis. From the experimental AFM viewpoint, the dependence on the distance is a well-known observable of the sensed molecular interactions. In order to cover this aspect from the theoretical perspective, we analyzed the atoms corresponding to each amino acid based on 5 Å thick slices (normal to the x-direction), which resembles the tip-capsid distance in a similar form as AFM subsurface imaging.42 This feature also facilitated the interpretation of the depth of the tip effect inside the virus capsid (Fig. 3(b) shows a cross-section cut at x = 210 Å). Remarkably, such a small slice contains 8053 atoms, however only 228 of them are subject to a force equal or greater to 5% of the total fq. Even though this may seem an expected behavior, it means that there is a strong locality in the tip-capsid interaction. Fig. 3(c) is a close up of Fig. 3(b), but also recognizes the three amino acids (GLU, ASP and LYS) that sense the highest force. Here, we remark the capabilities and novelty of our fine-grain computational approach.
 | ||
| Fig. 3 Relative magnitude of qf on atoms located in a 5 Å slice centered at the z = 0 Å plane (top) and the x = 210 Å plane (middle). The bottom pane is a close-up view of the middle pane, and identifies atoms that belong to the amino acids with the highest force in that plane (GLU, LYS, and ASP). In these plots, the distance between the molecular surface of the capsid and the tip was d = 2 Å. | ||
In experiments, the force on the AFM tip depends on the direction of approximation of the nanoprobe to the capsid (i.e. along the S2, S3, or S5 symmetries), allowing to recognize symmetries in the capsid structure. Our computational model enables a quantitative verification of the electrostatic driven forces on different symmetries of the capsid, and also vice versa, when simulations of upcoming viral structures may trigger experimental validations.
The contribution of the atoms from specific amino acids is reflected in the force tomography profiles in Fig. 4(a) and (b). In particular, we identify 5 amino acids that are more sensitive to the nanoprobe, namely, LYS, ASP, GLU, ARG and ILE. Those amino acids have different net charges depending on the pH of the medium where they are located, whereby Fig. 4(b) shows that for LYS and ARG the interactions are attractive, while for both ASP and GLU are of a repulsive nature. Nonetheless, the case of ILE is much more sensitive to the slice where they are located. At pH 7, ILE is an uncharged residue, however if they are sliced by the tomography-type analysis (the whole amino acid is distributed across several slices), the sensed polarity by the nanoprobe depends on the exact charges of the atoms of the specific slice (Fig. 4(b)). This explains the observed transitions from repulsive to attractive interactions and vice versa. Interestingly, the non monotonically increasing force profile of the bars in Fig. 4(b) is explained by the uneven number of atoms in each slice. Dividing by the number of atoms of the corresponding amino acid yields a monotonically increasing average per-atom force (Fig. S2(a)‡ of the SM).
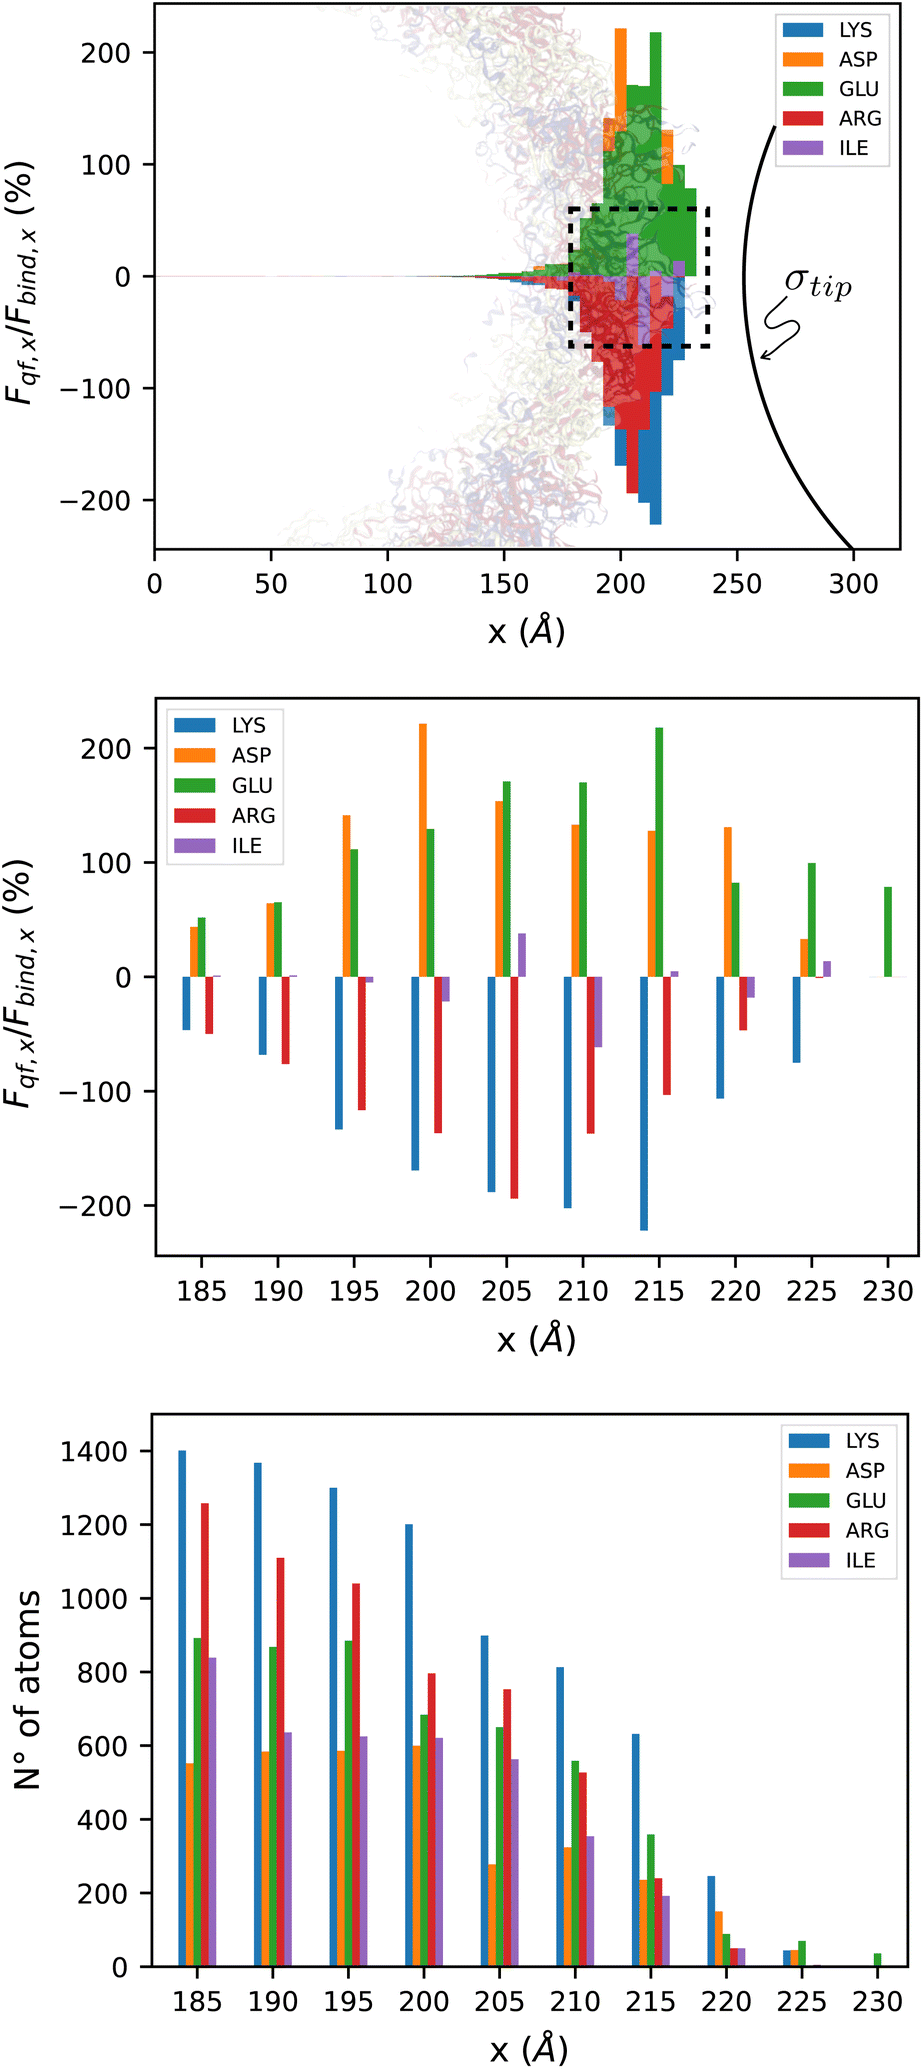 | ||
| Fig. 4 The top pane shows the x-component of the interaction force (normalized) on atoms that belong to the 5 amino acids that contribute the most to the force (LYS, ASP, GLU, ARG, and ILE, in that order) on 5 Å-thick slices. As reference, we show the Zika capsid structure in the background, and the AFM tip, which is placed 2 Å away. The dotted line indicates the region of the close-up view in the middle and bottom panes, which correspond to the normalized force (x-component) and number of atoms, respectively. | ||
Fig. 4(c) shows the number of atoms of the 5 more representative amino acids to the total force, sensed by the nanoprobe. Further details of the values illustrated in Fig. 4(b) and (c) can be found in Tables S2 and S3 of the ESI.‡ The present results were discussed in the context of virus capsids, however, they also apply for other AFM measurements performed with proteinaceous ensembles.
In the ESI‡ we include further tests that study the effect of the tip's geometry, by performing the same analysis for a spherical tip (Fig. S6, S7, and S8‡), and solvent's salt concentration, at higher κ (Fig. S3, S4, and S5‡). We observed that even though a different geometry does not change which are the 5 amino acids that contribute more to the force, and the value of the force is similar, the order of this list is slightly altered. On the other hand, we see that low salinity has a strong impact on the forces, as the influence of the tip reaches further distances into the capsid shell, comparing Fig. 3(a) with Fig. S3(a),‡ and the top 5 amino acids that contribute more to the force also change.
In summary, we showed that a simple electrostatic model based on the Poisson–Boltzmann equation provide useful insights of fine-grain mechanisms in the interaction between an AFM tip and a virus capsid. In particular, we demonstrate that the electrostatic force originated from a proteinaceous capsid and detected by a nanoprobe depends on both the precise distribution of charges inside the amino acids and the tip-capsid distance. Our results highlight the strong locality of the total interaction force with the amino acids as it approaches the nanoprobe. On interfaces formed by 5 Å slices of charged amino acids, the interaction also reflects the polarity of the amino acids. On the other hand, for uncharged amino acids, the interaction switches polarity and depends on the loci (and also the thickness) of the slice. As a consequence, the electrostatic component of the force requires higher levels of resolution when modeling and interpreting heterogeneous surfaces, like the ones of virus capsids.
Another aspect of this work is to bring our computational models closer to the AFM community, hence we have implemented it onto an open virtual environment that can be used on the cloud or on workstation systems. Based on these pillars, we also envision to combine our model in a future work with a coarse representation of nucleic acids43 and evaluate the most favorable predicted RNA tertiary structures. Other aspects that could be considered in the future are the effect of the salt concentration44 and capsid-tip distance on the protonation state.7
In addition, we expect to motivate the electrostatic study via force microscopy experiments11,12 of virus capsids, with focus on detecting the electrostatic weak/strong spots in the proteinaceous virus structure, and connect this information with its biological role during the delivery of nucleic acids.
Author contributions
H.V.G. designed the research; H.V.G. performed the PB simulations; C.D.C. wrote the force calculation code; H.V.G., C.D.C. and I.A.S., analyzed the data and developed the method; H.V.G. and C.D.C. wrote the paper; and H.V.G. supervised the research.Conflicts of interest
There are no conflicts to declare.Acknowledgements
We are thankful to R. Perez, H. Kobayashi and W. Menacho for fruitful discussions. H. V. G. thanks the financial support of the Slovenian Research Agency (Funding No. P1-0055). H. V. G. acknowledge the financial support of the Community of Madrid and the European Union through the European Regional Development Fund (ERDF), financed as part of the Union response to Covid-19 pandemic. C. D. C. acknowledges the support from Universidad Técnica Federico Santa María (Project PI-LIR-2020-10), and from CCTVal through ANID PIA/APOYO AFB180002.References
- C. Rotsch and M. Radmacher, Langmuir, 1997, 13, 2825–2832 CrossRef CAS.
- H.-J. Butt, Biophys. J., 1992, 63, 578–582 CrossRef CAS PubMed.
- Y. Yang, K. M. Mayer and J. H. Hafner, Biophys. J., 2007, 92, 1966–1974 CrossRef CAS PubMed.
- R. M. Adar, D. Andelman and H. Diamant, Adv. Colloid Interface Sci., 2017, 247, 198–207 CrossRef CAS PubMed.
- N. Patel, E. Wroblewski, G. Leonov, S. E. V. Phillips, R. Tuma, R. Twarock and P. G. Stockley, Proc. Natl. Acad. Sci. U. S. A., 2017, 114, 12255–12260 CrossRef CAS PubMed.
- F. Vascon, M. Gasparotto, M. Giacomello, L. Cendron, E. Bergantino, F. Filippini and I. Righetto, Comput. Struct. Biotechnol. J., 2020, 18, 1774–1789 CrossRef CAS PubMed.
- R. Zandi, B. Dragnea, A. Travesset and R. Podgornik, Phys. Rep., 2020, 847, 1–102 CrossRef CAS.
- T. G. W. Edwardson, M. D. Levasseur, S. Tetter, A. Steinauer, M. Hori and D. Hilvert, Chem. Rev., 2022, 122(9), 9145–9197 CrossRef CAS PubMed.
- R. F. Garmann, M. Comas-Garcia, M. S. T. Koay, J. J. L. M. Cornelissen, C. M. Knobler, W. M. Gelbart and A. Simon, J. Virol., 2014, 88, 10472–10479 CrossRef PubMed.
- P. Ares, C. Garcia-Doval, A. Llauro, J. Gomez-Herrero, M. Van Raaij and P. De Pablo, Phys. Rev. E: Stat., Nonlinear, Soft Matter Phys., 2014, 89, 052710 CrossRef CAS PubMed.
- M. Hernando-Pérez, A. Cartagena-Rivera, A. L. Božič, P. J. Carrillo, C. San Martín, M. G. Mateu, A. Raman, R. Podgornik and P. De Pablo, Nanoscale, 2015, 7, 17289–17298 RSC.
- M. Marchetti, G. Wuite and W. Roos, Curr. Opin. Virol., 2016, 18, 82–88 CrossRef CAS PubMed.
- A. Llauró, D. Luque, E. Edwards, B. L. Trus, J. Avera, D. Reguera, T. Douglas, P. J. d. Pablo and J. R. Castón, Nanoscale, 2016, 8, 9328–9336 RSC.
- P. Buzón, S. Maity and W. H. Roos, WIREs Nanomed. Nanobiotechnol., 2020, 12, e1613 Search PubMed.
- Á. Ortega-Esteban, C. P. Mata, M. J. Rodríguez-Espinosa, D. Luque, N. Irigoyen, J. M. Rodríguez, P. J. de Pablo, J. R. Castón and S. López, J. Virol., 2020, 94, e01542–e01520 CrossRef PubMed.
- N. Martín-González, P. Ibáñez Freire, A. Ortega-Esteban, M. Laguna-Castro, C. San Martín, A. Valbuena, R. Delgado-Buscalioni and P. J. de Pablo, Phys. Rev. X, 2021, 11, 021025 Search PubMed.
- M. Krieg, G. Fläschner, D. Alsteens, B. M. Gaub, W. H. Roos, G. J. Wuite, H. E. Gaub, C. Gerber, Y. F. Dufrêne and D. J. Müller, Nat. Rev. Phys., 2019, 1, 41–57 CrossRef.
- J. Snijder, C. Uetrecht, R. J. Rose, R. Sanchez-Eugenia, G. A. Marti, J. Agirre, D. M. A. Guérin, G. J. L. Wuite, A. J. R. Heck and W. H. Roos, Nat. Chem., 2013, 5, 502–509 CrossRef CAS PubMed.
- P. J. de Pablo, Semin. Cell Dev. Biol., 2018, 73, 199–208 CrossRef CAS PubMed.
- L. Stühn, J. Auernhammer and C. Dietz, Sci. Rep., 2019, 9, 17755 CrossRef PubMed.
- B. W. Hoogenboom, Nat. Struct. Mol. Biol., 2021, 28, 629–630 CrossRef CAS PubMed.
- S. Benaglia, M. R. Uhlig, J. Hernández-Muñoz, E. Chacón, P. Tarazona and R. Garcia, Phys. Rev. Lett., 2021, 127, 196101 CrossRef CAS PubMed.
- M. Hernando-Pérez, E. Pascual, M. Aznar, A. Ionel, J. R. Castón, A. Luque, J. L. Carrascosa, D. Reguera and P. J. de Pablo, Nanoscale, 2014, 6, 2702–2709 RSC.
- G. Settanni, W. Brill, H. Haas and F. Schmid, Macromol. Rapid Commun., 2022, 43, 2100683 CrossRef CAS PubMed.
- J. P. Bardhan, Comput. Sci. Discovery, 2012, 5, 013001 CrossRef CAS.
- A. V. Onufriev and S. Izadi, Wiley Interdiscip. Rev.: Comput. Mol. Sci., 2018, 8, e1347 Search PubMed.
- H.-J. Butt, Biophys. J., 1991, 60, 777–785 CrossRef CAS PubMed.
- B. Roux and T. Simonson, Biophys. Chem., 1999, 78, 1–20 CrossRef CAS PubMed.
- S. Decherchi, M. Masetti, I. Vyalov and W. Rocchia, Eur. J. Med. Chem., 2015, 91, 27–42 CrossRef CAS PubMed.
- C. D. Cooper, J. P. Bardhan and L. A. Barba, Comput. Phys. Commun., 2014, 185, 720–729 CrossRef CAS PubMed.
- C. D. Cooper, N. C. Clementi and L. A. Barba, J. Chem. Phys., 2015, 143, 124709 CrossRef PubMed.
- C. D. Cooper and L. A. Barba, Comput. Phys. Commun., 2016, 23–32 CrossRef CAS.
- M. Martínez, C. D. Cooper, A. B. Poma and H. V. Guzman, J. Chem. Inf. Model., 2019, 60, 974–981 CrossRef PubMed.
- M. K. Gilson, M. E. Davis, B. A. Luty and J. A. McCammon, J. Phys. Chem., 1993, 97, 3591–3600 CrossRef CAS.
- Q. Cai, X. Ye and R. Luo, Phys. Chem. Chem. Phys., 2012, 14, 15917–15925 RSC.
- M. Sevvana, F. Long, A. S. Miller, T. Klose, G. Buda, L. Sun, R. J. Kuhn and M. G. Rossmann, Structure, 2018, 26, 1169–1177 CrossRef CAS PubMed.
- S. Basak and A. Raman, Appl. Phys. Lett., 2007, 91, 064107 CrossRef.
- S. A. Poveda-Cuevas, C. Etchebest and F. L. Barroso da Silva, ACS Omega, 2018, 3, 16212–16229 CrossRef CAS PubMed.
- S. A. Poveda-Cuevas, F. L. Barroso da Silva and C. Etchebest, J. Chem. Inf. Model., 2021, 61, 1516–1530 CrossRef CAS PubMed.
- S. Decherchi and W. Rocchia, PLoS One, 2013, 8, e59744 CrossRef CAS PubMed.
- C. D. Cooper, I. Addison-Smith and H. V. Guzman, Analysis of the Electrostatic Forces between an AFM tip and a virus capsid from PB simulations, https://github.com/pyF4all/eTipVirusForce Search PubMed.
- D. Ebeling, B. Eslami and S. D. J. Solares, ACS Nano, 2013, 7, 10387–10396 CrossRef CAS PubMed.
- S. Poblete and H. V. Guzman, Viruses, 2021, 13, 1555 CrossRef CAS PubMed.
- S. Cruz-León and N. Schwierz, Langmuir, 2020, 36, 5979–5989 CrossRef PubMed.
Footnotes |
| † Data set of all PB simulations can be found on the following Github link https://github.com/pyF4all/eTipVirusForce. |
| ‡ Electronic supplementary information (ESI) available. See DOI: https://doi.org/10.1039/d2nr02526d. |
| § These authors are contributed equally to this work. |
| This journal is © The Royal Society of Chemistry 2022 |