Electrodeposited Sn–Cu@Sn dendrites for selective electrochemical CO2 reduction to formic acid

Jinkyu Lim *ab, Angel T. Garcia-Esparza c, Jae Won Lee a, Gihun Kang a, Sangyong Shin a, Sun Seo Jeon a and Hyunjoo Lee *a
aDepartment of Chemical and Biomolecular Engineering, Korea Advanced Institute of Science and Technology, Daejeon 34141, South Korea. E-mail: azhyun@kaist.ac.kr
bLinac Coherent Light Source, SLAC National Accelerator Laboratory, Menlo Park, California 94025, USA. E-mail: jinkyu@slac.stanford.edu
cStanford Synchrotron Radiation Lightsource, SLAC National Accelerator Laboratory, Menlo Park, California 94025, USA

Received 22nd March 2022 , Accepted 2nd June 2022

First published on 2nd June 2022


Abstract

Large-scale CO2 electrolysis can be applied to store renewable energy in chemicals. Recent developments in gas diffusion electrodes now enable a commercially relevant current density. However, the low selectivity of the CO2 reduction reaction (CO2RR) still hinders practical applications. The selectivity of the CO2RR highly depends on the electrocatalyst. Sn catalysts are considered promising cathode materials for the production of formic acid. The selectivity of Sn catalysts can be regulated by controlling their morphology or alloying them with secondary metals. Herein, we enhanced the selectivity of CO2 reduction to formic acid by synthesizing Sn–Cu@Sn dendrites that have a core@shell architecture. The Sn–Cu@Sn dendrites were prepared by a scalable electro-deposition method. The electronic structure was modified to suppress a reaction pathway for CO production on the Sn surface. Notably, the Sn shell inhibited the cathodic corrosion of Cu during the CO2RR. On a gas diffusion electrode, the Sn–Cu@Sn dendrites exhibited 84.2% faraday efficiency to formic acid for 120 h with high stability.

Introduction

As a promising route for CO2 capture and conversion, the electrochemical CO2 reduction reaction (CO2RR) has attracted much attention.1,2 CO2 can be converted into useful chemical fuels by storing intermittent renewable power as stable chemical bonds.3 A CO2RR with high current density is now feasible with a gas diffusion electrode (GDE) that delivers CO2 gas to catalytically active sites at a solid–liquid–gas interface.4–6 At least 16 different small molecules (e.g. carbon monoxide, formic acid, methane, ethylene, etc.) can be produced from the CO2RR, and the product distribution is mainly determined by the electrocatalytic materials.7,8 Hence, catalysts highly selective toward high-value target products must be developed to upscale and deploy a practical CO2 conversion technology.9 The selectivity of the catalysts can be tuned by controlling the morphology of the catalyst, alloying it with other metals, or doping heteroatoms into the catalyst.1 These approaches change the adsorption energies or the orientations of the adsorbed reaction intermediates on the catalyst surface, which consequently alter the reaction pathways.10

Formic acid is a promising product that can be directly obtained from electrocatalytic CO2RR. The electrochemically produced formic acid can be used in direct fuel cells or utilized as a storage solution for renewable hydrogen.11 Furthermore, the reaction pathway to formic acid is comparatively simple because it only requires a two e transfer.12,13 A selective and active electrocatalyst is needed to decrease the high activation energy (i.e., the large CO2RR overpotential) and to suppress the competing hydrogen evolution reaction (HER) and CO production under the cathodic conditions.12

Sn has been identified as a Sabatier optimal metal for the CO2RR to formic acid14 because it has a near-optimum binding strength to *OCOH, which is generally known as a key reaction intermediate for formic acid.15 Sn nanoparticles,16 nanowires,17,18 and mesoporous sheets19,20 have all exhibited enhanced selectivity towards formic acid. Electrodeposited Sn electrodes with a dendritic shape or dense tips were also reported as selective CO2RR catalysts for formic acid.21,22 Alloying with a secondary metal provides a straightforward way to modulate the electronic structure of Sn and thus the selectivity.23 Cu is a particularly promising secondary metal for the CO2RR to formic acid when alloyed with Sn under certain compositions24 as both Cu and Sn are earth-abundant metals and are easy to supply. Zheng et al. performed in situ X-ray absorption experiments and showed that the alloyed Sn with Cu was more electrophilic than pristine Sn even under CO2 reducing conditions, which can suppress competing HER and CO production from the CO2RR.25 However, some Sn–Cu alloy compositions were alternatively reported to be selective toward CO formation,26–29 because the selectivity of Sn–Cu catalysts varies depending on the surface composition differences between the two metals.25,30 A. Vasileff et al. showed a linear relationship between formic acid selectivity and Sn content in Sn–Cu alloy catalysts.30 A Sn-rich surface is desired for selective formic acid formation.31 However, shape control of the catalyst nanostructure for activity or selectivity optimization and their degradation mechanism during the reaction have been scarcely studied for Sn–Cu alloy catalysts.

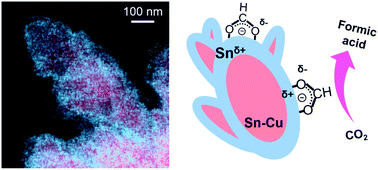
Herein, Sn–Cu@Sn dendrites were prepared by a scalable electrodeposition method. A Sn–Cu alloyed core was obtained with a Sn-rich surface layer. The electrophilic Sn at the surface readily adsorbed the nucleophilic *OCOH intermediate that can be further converted to formic acid. The dendritic shape made active sites more exposed and improved selectivity. Under the GDE cell configuration, the Sn–Cu@Sn dendrites showed enhanced activity and selectivity to formic acid when compared to Sn electrocatalysts. The stability of the alloyed electrocatalyst was also tested for operation on the GDE. The Sn shell suppressed the dissolution and re-electrodeposition of Cu during the CO2RR. A rapid degradation was observed once the shape of the catalysts was poorly controlled with exposure of the Cu core.

Experimental section

Cathode preparation with Sn–Cu@Sn dendrites

Sn–Cu@Sn dendrites were prepared by electrodeposition. To prepare a plating solution, solutions A and B were prepared separately. Solution A contained 0.5 M Na2SnO3·3H2O (95%, Sigma Aldrich) and 0.4 M NaOH (≥97.0%, Sigma Aldrich).21 Solution B contained 0.17 M CuSO4·5H2O (≥98.0%, Sigma Aldrich), 1.2 M lactic acid (≥85%, Sigma Aldrich), and 1.5 M NaOH (≥97.0%, Sigma Aldrich). Then, 50 ml of solution A and 25 ml of solution B were mixed via magnetic stirring to prepare the plating solution. The working electrode was a carbon cloth (CC, CeTech) and the back side of the CC was coated with polytetrafluoroethylene (PTFE) with a loading of 0.3 mgPTFE cm−2 to avoid contact with the plating solution and electrodeposition at the back. The CC was placed on a glass slide, and every edge was covered with an epoxy adhesive (Loctite® EA 9460™). The reference electrode was a Hg/HgO electrode (1 M NaOH, RE-61AP, ALS). The counter electrode was a graphite rod (WonATech). With a potentiostat (ZIVE BP2, WonATech) and a power booster (WonATech), a voltage of −4.0VHg/HgO was applied for 10 min for electrodeposition. The temperature of the plating solution was 25 °C. After the electrodeposition step, the working electrode was rinsed with deionized (DI) water and dried at 60 °C. The electrocatalysts on the electrode were collected with a disposable polypropylene knife, washed with 0.5 M NaOH solution, washed further with DI water, and dried in a vacuum oven at 50 °C. A cathode was prepared as a gas diffusion electrode (GDE) by a N2 spray method. The catalyst ink was prepared by dispersing 66 mg of catalysts into 5 ml of a mixture of isopropyl alcohol (>99.7%, Junsei) and ethyl alcohol (≤0.003% water, Sigma Aldrich) in a 3[thin space (1/6-em)]:[thin space (1/6-em)]1 volume ratio. A Nafion ionomer solution (69.9 μl; 10% aqueous solution, Sigma Aldrich) was added to the catalyst ink as a binder. The ink was N2 sprayed on a carbon paper (Sigracet 39 BB) with a catalyst loading of 1.5 mg cm−2 on a hot plate at 80 °C.

Electrochemical CO2 reduction

A customized GDE cell was used and its scheme is described in Fig. S1.[thin space (1/6-em)]21 The reference electrode was Ag/AgCl (3 M NaCl, BASi) and the anode was Ir oxide particles (99%, Alfa Aesar) deposited on a Ti diffusion layer (DL, Bekaert). An Ir oxide ink was prepared by dispersing 132 mg of Ir oxide in 5 ml of a mixture of isopropyl alcohol and ethyl alcohol in a 3[thin space (1/6-em)]:[thin space (1/6-em)]1 volume ratio. Then, 139.7 μl of the Nafion ionomer solution was added. After roll-pressing the Ti DL to a 180 μm thickness, the Ir oxide ink was sprayed on the pressed Ti DL with a catalyst loading of 3 mg cm−2. The geometric area of the electrode was 4 cm2. The electrolyte was CO2-saturated 1.0 M KHCO3(aq). A Nafion 212 membrane was used. The flow rate of the CO2 gas (99.999%) was 50 sccm. Each point on the jV curves was collected after holding at a fixed current density for more than 30 min. The voltage was described in a reversible hydrogen electrode (RHE) using the following equation with 85% iR correction:
 
image file: d2nr01563c-t1.tif(1)

For the electrochemical surface area (ECSA) estimation, double layer capacitance was measured by cyclic voltammetry (CV) cycles with scan rates of 10, 20, 40, 60, 80 and 100 mV s−1. A potentiostat (CHI 760E, CH Instruments) was used. A specific capacitance (CS) value of 0.033 mF cm−2 was used for the ECSA calculation as follows:21

 
ECSA = CDL/CS(2)

The commercial Sn nanoparticles (SnNP, Sigma Aldrich) were also tested as a benchmark. For the durability test, 250 ml of each electrolyte was circulated separately through the flow cell by two peristaltic pumps and galvanostatic CO2 electrolysis was performed at −30 mA cm−2 for 120 h. Gas products from the electrochemical reactions were analyzed via an online micro gas chromatograph (GC; Micro GC Fusion, Inficon) equipped with a Rt®-Molecular Sieve 5 Å and Rt®-Q-Bond columns (Inficon) with thermal conductivity detectors. The amount of formic acid produced in the electrolyte was quantified by a high-performance liquid chromatograph (HPLC; YL9100, Younglin) with a Hi-plex H column (Agilent) and a refractive index detector.

Characterization

Transmission electron microscopy (TEM) images were obtained with a Cs-corrected transmission electron microscope (Titan cubed G2 60-300, FEI) with energy-dispersive X-ray spectroscopy (EDS). The Sn–Cu@Sn dendrites were also characterized by scanning electron microscopy (SEM; Magellan 400, FEI) and inductively coupled plasma mass spectrometry (ICP-MS; iCAP RQ, Thermo Fisher Scientific). The X-ray photoelectron spectroscope (XPS; K-alpha+, Thermo VG Scientific) used a monochromated Al Kα X-ray source (12 kV, 3 mA). The binding energy was calibrated by locating the C 1s peak at 284.8 eV. The crystalline structure was analyzed using a powder X-ray diffractometer (XRD; SmartLab, Rigaku) with a Cu Kα X-ray source. X-ray absorption near edge structure (XANES) spectra of the Sn K-edge were measured at the 10C beamline of the Pohang Light Source (PLS-II). The incident X-ray was monochromated by a Si(311) double-crystal. The spectra were collected in a transmission mode with high-precision ionization chamber detectors. The X-ray energy was calibrated with a reference Sn foil. The XANES data were processed with Athena software.

Results and discussion

Sn-based dendrites were prepared by electrodeposition with a customized cell. Fig. 1(a) shows a low magnification SEM image of the morphology of the obtained dendrites. They were uniformly synthesized over the electrode area through electrodeposition in alkaline plating solutions. The dendrites were obtained on carbon cloth (CC) substrates by a single electrodeposition step with a plating solution that contained both Sn and Cu ions. The back side of the CC was coated with polytetrafluoroethylene (PTFE) to prevent electrodeposition at the back. The edges of the working electrode were blocked with an epoxy adhesive. Fig. S2 shows a photograph of the working electrode used for the electrodeposition. The geometric area of the exposed part was ∼6.5 cm2. The electrodeposition was performed for 10 min with a constant potential of −4.0VHg/HgO. The transient response of the current density is presented in Fig. S3. The current density increased during the deposition process, likely due to the increasing surface area while forming the dendritic structure. After the electrodeposition, the powders were collected with a disposable polypropylene knife, washed, and finally dried.
image file: d2nr01563c-f1.tif
Fig. 1 Characterization of electrodeposited Sn–Cu@Sn dendrites. (a) SEM image and (b) XRD pattern. Reference patterns for Sn1Cu1 alloy (PDF#03-065-3434) and Sn metal (PDF#00-004-0673) are displayed together. (c) HAADF-STEM image and (d) the corresponding EDS mapping image of Sn–Cu@Sn dendrites. Blue and red dots on the EDS map represent the signals from Sn and Cu, respectively. Single element distributions of (e) Sn and (f) Cu shown separately.

The XRD diffractogram of the dendrites in Fig. 1(b) was ascribed to the diffraction peaks corresponding to both Sn1Cu1 alloy and metallic Sn. A high angle annular dark field (HAADF) STEM image and its corresponding EDS mapping in Fig. 1(c) and (d) demonstrate the core–shell structure of the particles. Single elemental distributions are shown separately in Fig. 1(e) and (f). The elemental mapping result shows that the signals from Cu (red) were observed only at the core, while Sn was mostly detected at the surface. The microstructure of the surface is shown in the high resolution TEM (Fig. S4) and SEM (Fig. S5) images. The surface elemental composition was estimated as Sn74Cu26via the XPS survey spectrum (Fig. S6), while the overall composition of the dendrites was estimated to be Sn58Cu42via ICP-MS. The dendrites seem to have a core–shell structure consisting of a Sn–Cu alloy core with a Sn-rich shell, which is denoted as Sn–Cu@Sn below. When all the edges of the working electrode for electrodeposition were not sealed properly, a uniform core–shell structure was not obtained, as shown in Fig. S7.

The electronic structure of the dendrites was investigated by X-ray spectroscopy techniques. For comparison, commercial Sn nanoparticles (SnNP, <150 nm) were also characterized. Fig. S8 shows the SEM images of the benchmark SnNP. The Sn 3d XPS spectra in Fig. 2(a) present two prominent peaks at 486.4 (3d5/2) and 494.8 eV (3d3/2), which are assigned to Sn2+ in the Sn–Cu@Sn dendrites.32 Metallic Sn0 peaks were observed together at 484.9 (3d5/2) and 493.4 eV (3d3/2).32 The atomic fraction of Sn2+ on the Sn–Cu@Sn dendrites was 87.8% while the fraction of Sn0 was 10.6% and the fraction for Sn4+ was 1.6%. The Sn shell at the surface was moderately oxidized. On the other hand, SnNP exhibited mostly Sn4+ peaks at 487.0 (3d5/2) and 495.4 eV (3d3/2) with a fraction of 97.5% while the fraction of Sn0 was 0.4% and the fraction of Sn2+ was 2.1%, indicating that the surface of SnNP was heavily oxidized in the form of SnO2. It was previously shown that Sn2+ species could enhance the selectivity of the CO2RR toward formic acid and stay stable even after long-term operation.33–35


image file: d2nr01563c-f2.tif
Fig. 2 X-ray spectroscopy. (a) XPS spectra of the Sn 3d3/2 and 3d5/2 regions and (b) the Sn K-edge XANES spectra of the Sn–Cu@Sn dendrites and commercial SnNP catalysts. The inset image shows the pre-edge region of the spectra. Sn foil was used as a reference for XANES.

Fig. 2(b) shows X-ray absorption near-edge structure (XANES) spectra at the Sn K-edge that provides the average bulk information of the particles. The number of unoccupied states can be qualitatively compared based on the main peak (i.e., the white line intensity) from the XANES spectra. A higher white line intensity was observed for the Sn–Cu@Sn dendrites suggesting its oxidation state is higher than that of Sn foil or SnNP. Although the surface of the SnNP was more oxidized, the average oxidation state of SnNP was lower than Sn–Cu@Sn dendrites, implying that the SnNP has metallic a Sn core. The electron transfer from Sn to Cu enabled more electrophilic Sn in the Sn–Cu@Sn dendrites.

The CO2RR experiments were performed with a customized cell described in Fig. S1. The electrodeposited Sn–Cu@Sn dendrites were applied to the gas diffusion electrode (GDE) configuration, in which gaseous CO2 can directly meet the catalyst surface. The facile mass transport can enhance current density and productivity.6,21 The experimental assessments of the catalyst behavior of the GDE will facilitate the integrations of catalysts for an actual CO2 electrolyzer.5,36 After making a catalyst ink with isopropyl alcohol and ethanol solution, the ink was N2-sprayed onto a carbon paper (CP) with a catalyst loading of 1.5 mg cm−2. An Ag/AgCl electrode in 3 M NaCl was used as the reference electrode, an anode of Ir oxide NPs sprayed on a pressed Ti diffusion layer (DL) was used, and the catholyte and anolyte were separated by a Nafion 212 membrane. The SEM images of the bare Ti DL and Ir oxide nanoparticles coated on a Ti DL are presented in Fig. S9.

The electrocatalytic properties of the Sn–Cu@Sn dendrites were characterized under conventional CO2RR conditions with a CO2-saturated bicarbonate buffer electrolyte at room temperature. Fig. 3(a) shows the jV curves of the Sn–Cu@Sn dendrites, the SnNP, and the bare CP substrate. All the points were obtained after 30 min of galvanostatic operation. The CP substrate was almost inert with a current density of less than −10 mA cm−2, and the current came from the HER rather than the CO2RR. The Sn–Cu@Sn dendrites had significantly higher activity than the SnNP. To reach a current density of −30 mA cm−2, the Sn–Cu@Sn dendrites required only −0.68VRHE whereas the SnNP needed −0.92VRHE. The electrochemical surface area (ECSA) of each catalyst was estimated from the double layer capacitance measurements as shown in Fig. S10. With a given specific capacitance of 0.033 mF cm−2 for Sn electrodes,21 the Sn–Cu@Sn dendrites electrode had a 46% higher ECSA than the SnNP electrode (131.8 cm2 and 90.3 cm2, respectively) due to the three-dimensional dendritic shape. When the jV curves were normalized by the ECSA, specific current densities were compared as shown in Fig. S11. The Sn–Cu@Sn dendrites had higher specific activity. Facilitated activation of CO2 to the *OCOH intermediate on the electrophilic Sn surface can account for the higher intrinsic activity.25,30,31 In addition, the dendritic structure at the electrode surface is advantageous to increase the local pH near the electrode, which facilitates the CO2RR by suppressing the competing HER.37–39


image file: d2nr01563c-f3.tif
Fig. 3 Electrochemical CO2 reduction with Sn–Cu@Sn dendrites and SnNP catalysts on a GDE cathode. (a) jV curves. Each point was obtained after a galvanostatic operation for 30 min. Measured Faraday efficiency on (b) Sn–Cu@Sn dendrites and (c) SnNP catalysts at different potentials. Measurement conditions: 4 cm2 GDE, 1.5 mg cm−2 catalyst loading, 1.0 M KHCO3(aq), Ir oxide nanoparticles on pressed Ti DL as a counter electrode, Nafion 212 membrane, 25 °C.

Fig. 3(b) and (c) show product distributions at various potentials with the Sn–Cu@Sn dendrites and the SnNP, respectively. When the applied potential was more positive than −0.4VRHE, a competing side reaction, the hydrogen evolution reaction (HER) will dominate the Sn–Cu@Sn dendrites. Only a small amount of formic acid was accumulated in the catholyte while CO was barely observed. On the Sn–Cu@Sn dendrites, the Faraday efficiency to formic acid increased as a more negative potential was applied, and the highest selectivity of 84.2% was reached at −0.68VRHE. Above this potential, CO formation, which is another competing reaction of CO2RR, increased gradually. For the SnNP, both Faraday efficiencies to CO and formic acid increased as a more negative potential was applied. The Faraday efficiency at −0.92VRHE with a current density of −30 mA cm−2 was 54.8% on the SnNP benchmark catalyst. The Faraday efficiency increased slightly to 61.8% at a lower voltage of −1.34VRHE. The Sn–Cu@Sn dendrites were more selective than the SnNP for formic acid production. Fig. S12 compares the selectivity ratios of formic acid over CO products at various potentials and catalysts. The CO2RR to formic acid was favored more than CO production on the Sn–Cu@Sn, especially in the low overpotential region. The high local pH of the nanostructured Sn electrodes suppresses the HER but can cause significant CO formation.21 However, the CO2RR to CO was also suppressed by the Sn–Cu@Sn dendrites because of the rich Sn2+ species.35 The electrophilic Sn at the surface of the Sn–Cu@Sn dendrites was favorable for the adsorption of the *OCOH intermediate, which is a key reaction intermediate for formic acid production.12,15 The SnNP also had a rich oxidic Sn surface (Sn4+) due to the native oxide as confirmed in Fig. 2(a), but the CO2RR to formate was more favored on the Sn–Cu@Sn dendrites mainly with Sn2+ species at the surface that are known to give higher activation energy barriers to the competing reactions.35 The partial current densities toward each product at various potentials are compared in Fig. S13. The partial current density to formic acid reached −75.4 mA cm−2 at −0.82VRHE on the Sn–Cu@Sn dendrites while the SnNP had only −10.1 mA cm−2 at −0.85VRHE. In Table S1, the CO2RR parameters of the Sn–Cu@Sn dendrites for formic acid production were compared with those of the state of the art catalysts in the literature.

The durability of the Sn–Cu@Sn dendrites was tested by performing CO2 electrolysis on the GDE configuration. Fig. 4 shows the chronopotentiometry result at a current density of −30 mA cm−2 for 120 h. The voltage was stable at ∼−0.68VRHE, and there was only a minor decrease in the Faraday efficiency to formic acid from 82% to 77%. Fig. S14 shows the SEM images and XPS spectrum for the Sn–Cu@Sn dendrites after the durability test. Even after operation for 120 h, the dendritic morphology was barely changed. The atomic fraction of Sn2+ species on the surface was 86.6% after the reaction, consistent with that at the beginning, while the fraction of Sn4+ slightly increased to 5.2%.


image file: d2nr01563c-f4.tif
Fig. 4 Prolonged CO2RR using Sn–Cu@Sn dendrites in a customized GDE electrolysis cell for 120 h. Measurement conditions: 4 cm2 GDE, 1.0 M KHCO3(aq), Ir oxide nanoparticles on pressed Ti DL as a counter electrode, Nafion 212 membrane, 25 °C.

However, a poorly shape-controlled catalyst was not stable for the CO2RR. The electrodeposited particles shown in Fig. S7 were tested for the CO2RR using the GDE configuration and the results are shown in Fig. S15(a). Although the initial performance was similar, rapid degradation was observed in the product distribution. Faraday efficiency to parasitic HER increased from ∼5% to ∼25% during the 80 h test, while the Faraday efficiency to formic acid decreased to 48% after the first 16 h and then to 36% at the end of the 80 h test. Fig. S15(b) and (c) show an SEM image and the EDS mapping results of the catalysts after the durability test. The dendritic shape collapsed and Cu nanowhiskers were observed. The Cu surface exposed to the electrolyte underwent cathodic corrosion and then re-deposited on the electrode.40 For stable and selective CO2RR to formic acid, the Sn shell at the surface was required on the Sn–Cu alloy, which can prevent the cathodic corrosion of Cu.

Conclusions

Scalable and selective catalysts applicable to GDE should be developed for practical deployment of the CO2RR to formic acid. The Sn–Cu@Sn dendrites were prepared by a facile electrodeposition method in a single step. The dendrites are composed of a Sn–Cu alloy at the core and a Sn-rich shell at the surface. When the Sn–Cu@Sn dendrites were applied to a GDE, the activity and selectivity to formic acid were significantly enhanced compared with commercial SnNP. For the same current density of −30 mA cm−2, the Faraday efficiency to formic acid reached 84.2% at −0.68VRHE for the Sn–Cu@Sn dendrites, whereas Faraday efficiency was 54.8% at −0.92VRHE for SnNP. The electrophilic Sn surface may enable favorable adsorption of the nucleophile *OCOH intermediate that would be further converted to formic acid. The durability was checked by performing the CO2RR on the GDE for 120 h at −30 mA cm−2. Faraday efficiency, product distribution, and voltage were barely changed. The Sn shell enabled stable long-term operation by suppressing the cathodic corrosion of Cu and its subsequent re-deposition on the cathode. This work can contribute to the design of electrocatalysts for selective formic acid production through large-scale CO2RR.

Author contributions

J. Lim conceived the project, conducted most experiments, and wrote the manuscript. A. T. Garcia-Esparza contributed to data analysis and edited the manuscript. J. Lim, J. W. Lee, and G. Kang performed the electrochemical analysis. J. Lim, J. W. Lee, and S. Shin conducted the characterization experiments. J. Lim, J. W. Lee, and S. S. Jeon prepared the electrocatalysts. H. Lee supervised the project, provided the resources, and finalized the manuscript.

Conflicts of interest

There are no conflicts to declare.

Acknowledgements

This work was financially supported by the National Research Foundation of Korea (NRF-2016R1A5A1009592, 2017M3D1A1040692, and 2019M3D1A1079306).

Notes and references

  1. Y. Y. Birdja, E. Pérez-Gallent, M. C. Figueiredo, A. J. Göttle, F. Calle-Vallejo and M. T. M. Koper, Nat. Energy, 2019, 4, 732–745 CrossRef CAS.
  2. H. S. Whang, J. Lim, M. S. Choi, J. Lee and H. Lee, BMC Chem. Eng., 2019, 1, 9 CrossRef.
  3. P. De Luna, C. Hahn, D. Higgins, S. A. Jaffer, T. F. Jaramillo and E. H. Sargent, Science, 2019, 364, eaav3506 CrossRef CAS PubMed.
  4. D. Higgins, C. Hahn, C. Xiang, T. F. Jaramillo and A. Z. Weber, ACS Energy Lett., 2019, 4, 317–324 CrossRef CAS.
  5. T. Burdyny and W. A. Smith, Energy Environ. Sci., 2019, 12, 1442–1453 RSC.
  6. J. Lee, J. Lim, C.-W. Roh, H. S. Whang and H. Lee, J. CO2 Util., 2019, 31, 244–250 CrossRef CAS.
  7. S. Nitopi, E. Bertheussen, S. B. Scott, X. Liu, A. K. Engstfeld, S. Horch, B. Seger, I. E. L. Stephens, K. Chan, C. Hahn, J. K. Nørskov, T. F. Jaramillo and I. Chorkendorff, Chem. Rev., 2019, 119, 7610–7672 CrossRef CAS PubMed.
  8. K. P. Kuhl, E. R. Cave, D. N. Abram and T. F. Jaramillo, Energy Environ. Sci., 2012, 5, 7050–7059 RSC.
  9. O. S. Bushuyev, P. De Luna, C. T. Dinh, L. Tao, G. Saur, J. van de Lagemaat, S. O. Kelley and E. H. Sargent, Joule, 2018, 2, 825–832 CrossRef CAS.
  10. M. B. Ross, P. De Luna, Y. Li, C.-T. Dinh, D. Kim, P. Yang and E. H. Sargent, Nat. Catal., 2019, 2, 648–658 CrossRef CAS.
  11. S. Enthaler, J. von Langermann and T. Schmidt, Energy Environ. Sci., 2010, 3, 1207–1217 RSC.
  12. C. W. Lee, N. H. Cho, K. D. Yang and K. T. Nam, ChemElectroChem, 2017, 4, 2130–2136 CrossRef CAS.
  13. F. Proietto, A. Galia and O. Scialdone, ChemElectroChem, 2019, 6, 162–172 CrossRef CAS.
  14. Q. Li, X. Rao, J. Sheng, J. Xu, J. Yi, Y. Liu and J. Zhang, J. CO2 Util., 2018, 27, 48–59 CrossRef CAS.
  15. J. T. Feaster, C. Shi, E. R. Cave, T. Hatsukade, D. N. Abram, K. P. Kuhl, C. Hahn, J. K. Nørskov and T. F. Jaramillo, ACS Catal., 2017, 7, 4822–4827 CrossRef CAS.
  16. J. Gu, F. Héroguel, J. Luterbacher and X. Hu, Angew. Chem., Int. Ed., 2018, 57, 2943–2947 CrossRef CAS PubMed.
  17. B. Kumar, V. Atla, J. P. Brian, S. Kumari, T. Q. Nguyen, M. Sunkara and J. M. Spurgeon, Angew. Chem., Int. Ed., 2017, 56, 3645–3649 CrossRef CAS PubMed.
  18. S. Liu, J. Xiao, X. F. Lu, J. Wang, X. Wang and X. W. Lou, Angew. Chem., Int. Ed., 2019, 58, 8499–8503 CrossRef CAS PubMed.
  19. F. Wei, T. Wang, X. Jiang, Y. Ai, A. Cui, J. Cui, J. Fu, J. Cheng, L. Lei, Y. Hou and S. Liu, Adv. Funct. Mater., 2020, 30, 2002092 CrossRef CAS.
  20. F. Li, L. Chen, G. P. Knowles, D. R. MacFarlane and J. Zhang, Angew. Chem., Int. Ed., 2017, 56, 505–509 CrossRef CAS PubMed.
  21. J. Lim, P. W. Kang, S. S. Jeon and H. Lee, J. Mater. Chem. A, 2020, 8, 9032–9038 RSC.
  22. D. H. Won, C. H. Choi, J. Chung, M. W. Chung, E.-H. Kim and S. I. Woo, ChemSusChem, 2015, 8, 3092–3098 CrossRef CAS PubMed.
  23. X. Zhang, F. Li, Y. Zhang, A. M. Bond and J. Zhang, J. Mater. Chem. A, 2018, 6, 7851–7858 RSC.
  24. M. Morimoto, Y. Takatsuji, S. Iikubo, S. Kawano, T. Sakakura and T. Haruyama, J. Phys. Chem. C, 2019, 123, 3004–3010 CrossRef CAS.
  25. X. Zheng, Y. Ji, J. Tang, J. Wang, B. Liu, H.-G. Steinrück, K. Lim, Y. Li, M. F. Toney, K. Chan and Y. Cui, Nat. Catal., 2019, 2, 55–61 CrossRef CAS.
  26. J. Zeng, K. Bejtka, W. Ju, M. Castellino, A. Chiodoni, A. Sacco, M. A. Farkhondehfal, S. Hernández, D. Rentsch, C. Battaglia and C. F. Pirri, Appl. Catal., B, 2018, 236, 475–482 CrossRef CAS.
  27. Y. Zhao, C. Wang and G. G. Wallace, J. Mater. Chem. A, 2016, 4, 10710–10718 RSC.
  28. W. J. Dong, J. W. Lim, D. M. Hong, J. Y. Park, W. S. Cho, S. Baek, C. J. Yoo, W. Kim and J.-L. Lee, ACS Appl. Energy Mater., 2020, 3, 10568–10577 CrossRef CAS.
  29. S. Sarfraz, A. T. Garcia-Esparza, A. Jedidi, L. Cavallo and K. Takanabe, ACS Catal., 2016, 6, 2842–2851 CrossRef CAS.
  30. A. Vasileff, X. Zhi, C. Xu, L. Ge, Y. Jiao, Y. Zheng and S.-Z. Qiao, ACS Catal., 2019, 9, 9411–9417 CrossRef CAS.
  31. Q. Li, J. Fu, W. Zhu, Z. Chen, B. Shen, L. Wu, Z. Xi, T. Wang, G. Lu, J.-J. Zhu and S. Sun, J. Am. Chem. Soc., 2017, 139, 4290–4293 CrossRef CAS PubMed.
  32. J. Wu, X. Bai, Z. Ren, S. Du, Z. Song, L. Zhao, B. Liu, G. Wang and H. Fu, Nano Res., 2021, 14, 1053–1060 CrossRef CAS.
  33. Y.-W. Choi, F. Scholten, I. Sinev and B. Roldan Cuenya, J. Am. Chem. Soc., 2019, 141, 5261–5266 CrossRef CAS PubMed.
  34. R. Zhang, W. Lv and L. Lei, Appl. Surf. Sci., 2015, 356, 24–29 CrossRef CAS.
  35. X. An, S. Li, A. Yoshida, Z. Wang, X. Hao, A. Abudula and G. Guan, ACS Sustainable Chem. Eng., 2019, 7, 9360–9368 CrossRef CAS.
  36. M. F. Lagadec and A. Grimaud, Nat. Mater., 2020, 19, 1140–1150 CrossRef CAS PubMed.
  37. F. Scholten, I. Sinev, M. Bernal and B. Roldan Cuenya, ACS Catal., 2019, 9, 5496–5502 CrossRef CAS PubMed.
  38. A. S. Hall, Y. Yoon, A. Wuttig and Y. Surendranath, J. Am. Chem. Soc., 2015, 137, 14834–14837 CrossRef CAS PubMed.
  39. J. Lim, H. Lim, B. Kim, S. M. Kim, J.-B. Lee, K. R. Cho, H. Choi, S. Sultan, W. Choi, W. Kim and Y. Kwon, Electrochim. Acta, 2021, 139190 CrossRef CAS.
  40. P. De Luna, R. Quintero-Bermudez, C.-T. Dinh, M. B. Ross, O. S. Bushuyev, P. Todorović, T. Regier, S. O. Kelley, P. Yang and E. H. Sargent, Nat. Catal., 2018, 1, 103–110 CrossRef CAS.

Footnote

Electronic supplementary information (ESI) available. See DOI: https://doi.org/10.1039/d2nr01563c

This journal is © The Royal Society of Chemistry 2022