
 Open Access Article
 This Open Access Article is licensed under a Creative Commons Attribution-Non Commercial 3.0 Unported Licence
Polyoxometalate intercalated MXene with enhanced electrochemical stability†
Jun-Jie
Zhu
 a and
Pedro
Gomez-Romero
*ab
a and
Pedro
Gomez-Romero
*ab
aCatalan Institute of Nanoscience and Nanotechnology (ICN2), CSIC and BIST, Campus UAB, Bellaterra, 08193 Barcelona, Spain. E-mail: pedro.gomez@icn2.cat; Fax: +34 936917640; Tel: +34 937373608
bConsejo Superior de Investigaciones Científicas (CSIC), Spain
First published on 12th August 2022
Abstract
MXene/polyoxometalate (POM) hybrids are useful target materials for a variety of applications. Yet, the goal of preparing simple binary hybrids by intercalation of POMs into MXene has not been achieved. We propose and demonstrate here a method to intercalate POMs (phosphotungstate, PW12) into Ti3C2Tx MXene through the interaction between POM anions and pre-intercalated surfactant cations. A variety of quaternary ammonium cations have been used to expand Ti3C2Tx interlayer spacing. Cetyltrimethylammonium cations (CTA+) lead to an expansion of 2 nm while allowing intercalation of a considerable load (10 wt%) thanks to their tadpole-like shape and size. CTAPW12 has a layered structure compatible with Ti3C2Tx. The CTA+-delaminated Ti3C2Tx keeps the large interlayer spacing after being coupled with PW12. The PW12 clusters are dispersed and kept isolated thanks to CTA surfactant and the confinement into Ti3C2Tx layers. The redox reactions in CTA+-delaminated Ti3C2Tx/PW12 are diffusion-controlled, which proves the well-dispersed PW12 clusters are not adsorbed on the surface of Ti3C2Tx particles but within Ti3C2Tx layers. The CTA+- delaminated Ti3C2Tx/PW12 shows superior electrochemical stability (remaining redox active after 5000 cycles) over the other MXene/POM hybrids prepared in this work (inactive after 500 cycles). We associate this improved stability to the effective intercalation of PW12 within Ti3C2Tx layers helped by the CTA cations, as opposed to the external aggregation of PW12 clusters into micro or nanocrystals taking place for the other cations. The results provide a solid guide to help develop high-performance MXene/POM hybrid materials for a variety of applications.
Introduction
Since the discovery of Ti3C2Tx – the first MXene – in 2011 by Naguib et al.,1 the MXene family is flourishing. More than 30 new MXenes have been synthesized.2 MXenes have a general formula Mn+1XnTx, where M is a transition metal, X is carbon and/or nitrogen, n is an integer between 1 and 3, and Tx represents surface functional groups. Due to their two-dimensional structure, high conductivity, redox activity and hydrophilicity, MXenes have shown great potential in various applications, including energy storage,3 electromagnetic interference,4 sensors,5 water remediation,6 photocatalysis,7 radio-frequency antennas,8etc.Beyond the compositional richness of these MXene formulations, their anionic charge and layered structure have prompted the development of a variety of hybrids derived from them.9–13
Polyoxometalates (POMs) are a class of metal–oxide clusters consisting of multiple metal–oxide octahedra linked together by oxygen atoms to form nanoclusters with ordered and well-known structures. Their intrinsic nanosize, high surface-to-bulk ratio and fast and reversible redox activity have launched them for use in applications in various fields, such as energy storage,14,15 catalysis,16 sensors,17etc.
MXenes and POMs share some target applications while featuring complementary properties and dimensionalities which could lead to synergies. For example, 2D MXenes could provide an electronically conducting matrix, whereas 0D POMs could provide a pillaring effect opening the resulting structure and facilitating ion transport. Thus, POM-intercalated MXene hybrids seem interesting in their own right. And several laboratories have tried to synthesize this type of hybrid, although intercalation has proved to be elusive. Chen et al. anchored POMs on the surface of Ti3C2Tx with (ionic liquid) linkers. Their hybrid material was shown to deliver high specific capacitance long term in an aqueous electrolyte.18 Chao et al. reported the in situ growth of 10–20 nm Mo and Fe-based POM nanoparticles on Ti3C2Tx nanosheets. Their hybrid material showed excellent pseudocapacitive performance in lithium-ion capacitors and sodium-ion capacitors.9 Zhou et al. embedded phosphomolybdic acid and Ti3C2Tx in polypyrrole and built an impedimetric aptamer biosensor for osteopontin with an extremely low detection limit, and high selectivity and stability.10 MXene/POM hybrid materials not only show great potential in conventional fields, but also expand their application. For instance, Zong et al. developed GdW10-based polyoxometalates/Ti3C2Tx composite for contrast-enhanced computed tomography and magnetic resonance imaging.11 Therefore, it is a good idea to develop MXene/POM hybrid materials both to strengthen their properties and performance through synergies in conventional applications as well as to explore new fields and extend their use to new applications.
MXene/POM hybrid materials reported to date either deposit crystallized POM nanoparticles on the MXene surface or anchor POM nanoclusters on the MXene surface with linkers. It might seem that POMs can only adhere onto the MXene surface and not get intercalated.
The LiF/HCl-etched Ti3C2Tx has an interlayer spacing of ca. 1.2 nm.19 Using large cations during the delamination process can lead to an expansion of this interlayer distance. For instance, tetramethylammonium (TMA)-treated Ti3C2Tx has an interlayer distance of around 1.5 nm.19 With extended time, even larger cations can intercalate MXene, resulting in a larger interlayer distance. To date, various cations, including tetraethylammonium (TEA),20 tetrabutylammonium (TBA),21 1-ethyl-3-methylimidazolium (EMIM),22 dodecyltrimethylammonium (DTA),23 cetyltrimethylammonium (CTA)23etc. have been shown to intercalate MXene. The resulting interlayer distance can be as large as 2.7 nm. The Keggin POMs clusters are around 1 nm; thus, the interlayer space is large enough to accommodate POMs. However, this goal has not been accomplished yet due to several reasons.
The first obstacle is the electrostatic repulsion. Since MXene monolayers are terminated with negatively charged functional groups (e.g. OH−, F−, Cl−), only cations can easily enter the interlayers. Even with the assistance of an electric field, small anions (like Cl−, Br−) can hardly intercalate,24 not to mention the much larger POMs which are all polyanions. On the other hand, POM salts in which the negative charge of these anions is balanced by a suitable amount of counter-cations do not suffer electrostatic repulsion but tend to crystallize. The crystallized POM nanoparticles are too large to enter MXene interlayers and can only be adhered onto the surface. Furthermore, crystallization packs POM clusters into extended arrays, preventing the direct interaction of each cluster with a suitable substrate or electrolyte, which is the key to their success as catalysts or energy storage electrodes, respectively.
On the other hand, most of the cations used to expand the interlayer distance of MXenes can interact with POMs. And the fact that anionic POMs can interact with organic and inorganic cations can be used advantageously to control POM self-assembly, stabilization, solubility, and function.25 For example, tetraethylammonium phosphotungstate (TEAPW12) has been shown to improve the capacitive performance in organic electrolytes, where the activity of most inorganic POMs is less than optimal.26 CTA+, DTA+ and TBA+ can induce the reversible self-assembly of Wells–Dawson POMs (P2W17MnO62) into 1D nanowires and 2D superlattices with excellent catalytic activity.27 It would be fascinating to design and develop this kind of self-assembly reaction between POMs and cationic surfactants within the interlayer space of MXene.
We report here for the first time a method to intercalate POM clusters into MXene (Ti3C2Tx) layers by utilizing the interactions between POM anions and organic cations pre-intercalated into Ti3C2Tx. A variety of quaternary ammonium cations were used to expand the interlayer spacing and then react with POMs. The cations capable of expanding the interlayer space substantially enough to form nano lamellar structures were finally able to anchor isolated POM clusters between layers. This POM-intercalated MXene hybrid outperforms the hybrid materials based on POM nanoparticles/MXene mentioned above in electrochemical stability owing to the superior interlayer hybridization. This study shows a new strategy to design and synthesize MXene/POM hybrid materials to meet the demands for better performance in conventional applications (catalysts, sensors, energy storage) as well as to enable new, uncharted ones.
Experimental
Synthesis of MXene (Ti3C2Tx, MX)
Ti3C2Tx was synthesized through a LiF/HCl etching method. Thus, 1 g Ti3AlC2 (MAX phase) was added slowly into a Teflon vessel containing 1 g LiF and 20 mL 9 M HCl solution, stirred continuously for 24 h at 35 °C. The mixture was poured into a 50 mL centrifugation tube, centrifuged at 3500 rpm for 5 minutes, then washed with Milli-Q water. This process was repeated until the pH of the dark-green supernatant was >6. Finally, the mixture was centrifuged at 6000 rpm for 20 minutes. The sediment was collected and used in the following dispersion.0.1 g Ti3C2Tx sediment was dispersed in 50 mL Milli-Q water (shaken by hand), deaerated with Ar for 20 minutes, and stored in the fridge for future use. 20 mL of the Ti3C2Tx colloid was filtered on Celgard 3501 membrane, rinsed, dried in a vacuum oven at 60 °C and stored in an argon-filled glovebox, labeled as MX.
Synthesis of quaternary ammonium cations-delaminated MXene (TMAMX, TBAMX, DTAMX and CTAMX)
0.1 g Ti3C2Tx sediment was dispersed in each of four 50 mL 0.5 M quaternary ammonium solutions (tetramethylammonium hydroxide (TMAOH), tetrabutylammonium hydroxide (TBAOH), dodecyltrimethylammonium bromide (DTAB) and cetyltrimethylamonium bromide (CTAB)) (shaken by hand), deaerated with Ar for 20 minutes. The four mixtures were shaken for four days. Four kinds of cation-exchanged Ti3C2Tx colloids were obtained. 20 mL of each colloid was filtered on Celgard 3501 membrane, rinsed and dried with Ar flow. The films can be easily peeled off from the membrane, dried in a vacuum oven at 60 °C and stored in an argon-filled glovebox. As-prepared samples were named TMAMX, TBAMX, DTAMX and CTAMX, respectively.Synthesis of MXene/POM hybrids (TMAMX-PW12, TBAMX-PW12, DTAMX-PW12 and CTAMX-PW12)
20 mL of each cation-exchanged Ti3C2Tx colloid was filtered on Celgard 3501 membrane, and rinsed repeatedly. Then 20 mL of 20 mM phosphotungstic acid (PW12) was added on the filter cake, filtered, rinsed, and dried with Ar flow. The films were carefully peeled off, dried in a vacuum oven at 60 °C and stored in an argon-filled glovebox. As-prepared samples were named TMAMX-PW12, TBAMX-PW12, DTAMX-PW12 and CTAMX-PW12.Material characterization
Powder XRD patterns were collected on a PANalytical X'pert Pro-MRD diffractometer with Cu Kα radiation and PIXel detector. Scanning electron microscopy images were taken on a Quanta 650 FEG microscope. High-resolution transmission electron images (HR-TEM) and high-angle annular dark field scanning transmission electron microscopy (HAADF-STEM) images were taken on a FEI Tecnai G2 F20 microscope. Raman measurements were performed on a Horiba T64000 Raman spectrometer. A 532 nm laser (Cobolt Samba) was used to obtain the spectra. XPS measurements were performed with a Phoibos 150 analyzer (SPECS GmbH, Berlin, Germany) under ultra-high vacuum conditions (based pressure 10−10 mbar). Monochromatic Al Kα was used as X-ray source (1486.6 eV). All the high-resolution XPS spectra were fitted with CasaXPS version 2.3.1.Electrochemical characterization
Three-electrode characterizations were done in T-type Swagelok cells, in which Ag/Ag+ and overloaded activated carbon served as the reference electrodes and counter electrodes, respectively. 1 M TEABF4 in acetonitrile was used as the electrolyte. The three-electrode tests were carried out in an Argon-filled glovebox with the oxygen and water levels under 5 ppm. Two-electrode tests were carried out in coin cells. Overloaded activated carbon (5 times the mass of working electrodes) served as the positive electrode. Since the activated carbon electrodes have significantly larger specific capacitance and mass loading than MXene/POM hybrid electrodes, the MXene/POM hybrid electrodes undergo the vast majority of electrochemical potential shift. The specific capacitance can be calculated by eqn (1):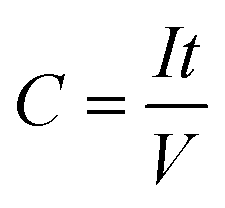 | (1) |
Results and discussion
We carried out thermogravimetric analyses (TGA) to estimate the amount of the quaternary ammonium cations in MXenes, as shown in Fig. 1. The pristine Ti3C2Tx (MX) suffers a slight weight loss (3.2%) before 500 °C, corresponding to the removal of some surface functional groups, e.g., –F, –OH and –O.28,29 All the quaternary ammonium cation-exchanged MXenes undergo relatively drastic weight losses when heating up to 450 °C, followed by a plateau. The quaternary ammonium cations can be completely removed before 450 °C under a nitrogen atmosphere.30 Thus, the extra weight loss of quaternary ammonium cation-exchanged MXenes is associated with the removal of these organic compounds.28 Among them, CTAMX presents the greatest amount of intercalated organic cation (10 wt%), and DTAMX has the smallest (3.8 wt%), as determined by comparison with the loss associated with pristine MXene. Since the quaternary ammonium cations will serve as the anchor sites in the reactions with PW12, we normalize the weight percentage by molecular weight and calculate the concentration of quaternary ammonium cation (mmol g−1) to estimate their potential capabilities of anchoring POMs. TMAMX has the highest concentration (0.83 mmol g−1) of quaternary ammonium cation among the four samples, more than twice that of TBAMX (0.35 mmol g−1) and three times that of CTAMX (0.27 mmol g−1). DTAMX has the lowest (0.12 mmol g−1). The different concentrations will lead to different morphologies and different PW12 loading masses once they interact with PW12.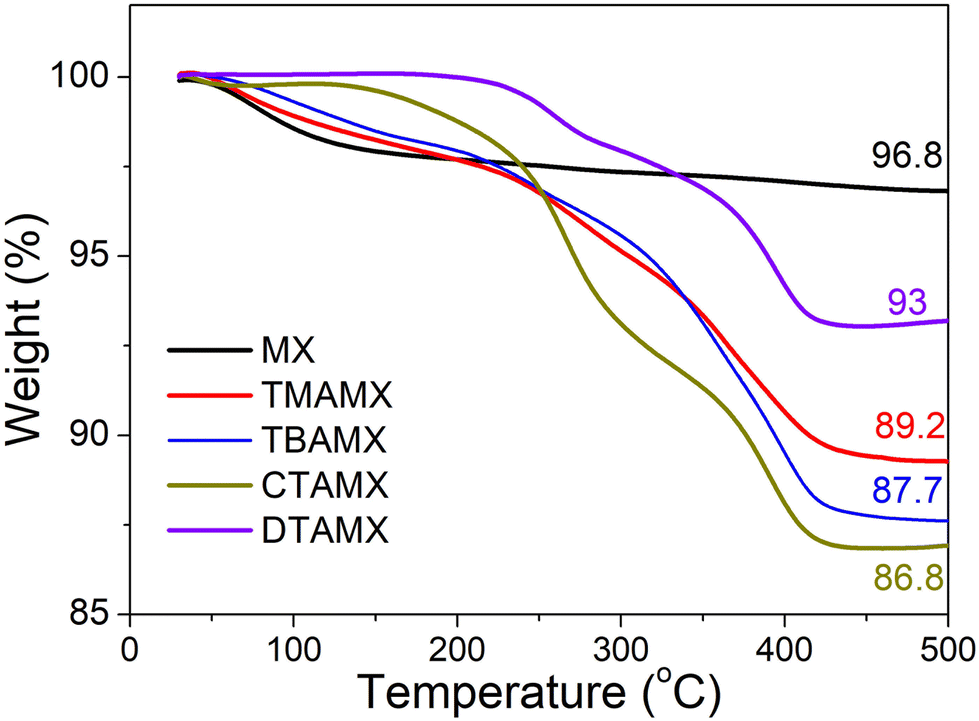 | ||
| Fig. 1 Thermogravimetric curves of MX, TMAMX, TBAMX, DTAMX and CTAMX in nitrogen at a heating rate of 10 °C min−1. | ||
We carried out powder XRD to characterize the crystal structure of the solid phases, as shown in Fig. 2. Table 1 presents the positions of (002) diffraction peaks and the interlayer distance. We can observe a significant expansion of the interlayer distance associated with large cations (TMA+, TBA+, DTA+ and CTA+) taking the place of Li+. Pristine Ti3C2Tx (MX) has the (002) diffraction peak at 7.76°, corresponding to an interlayer distance of 11.39 Å. TMA+ and TBA+ expand the interlayer distances to 14.53 Å and 14.95 Å, respectively. The degree of expansion agrees well with the size of the cations: TMA+ has four methyl groups while TBA+ has four butyls. Yet, both of them are isotropic.
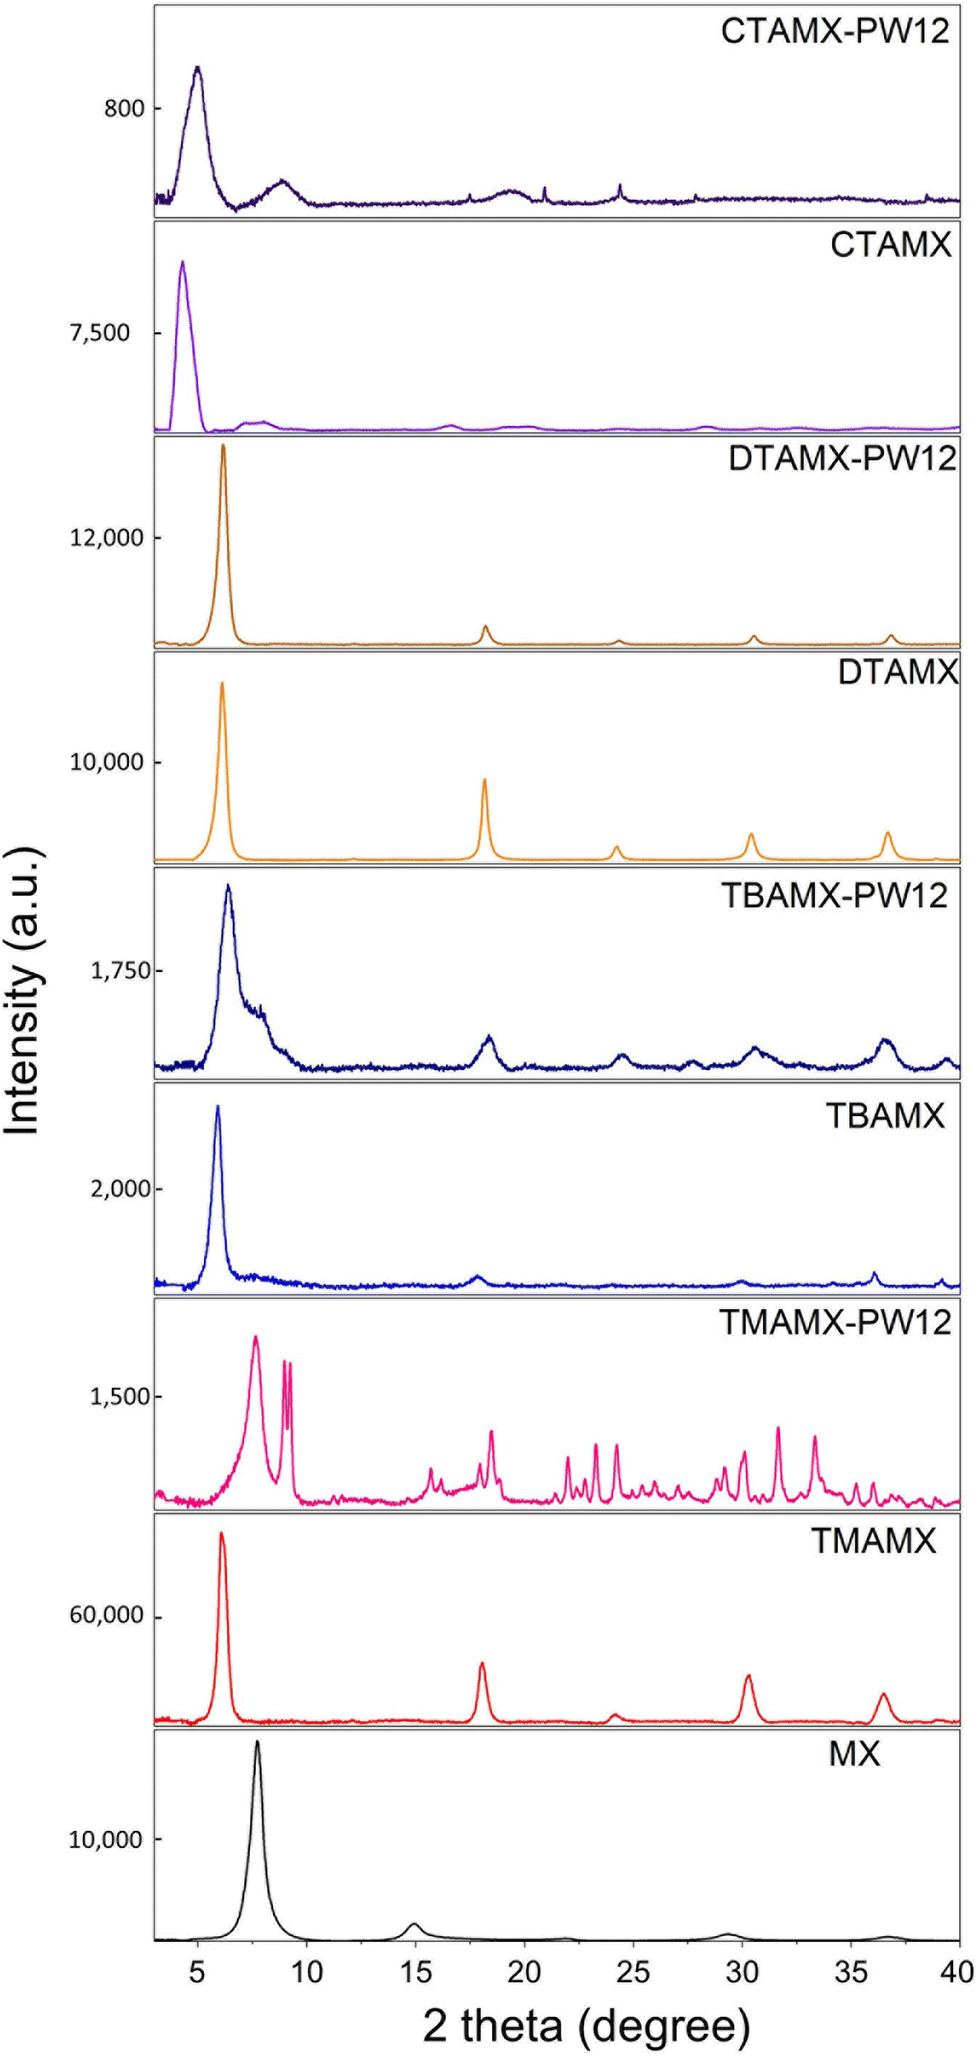 | ||
| Fig. 2 XRD patterns of pristine MXene (MX), cations delaminated MXene MXene (TMAMX, TBAMX DTAMX and CTAMX) and MXene/POM hybrids (TMAMX-PW12, TBAMX-PW12, DTAMX-PW12 and CTAMX-PW12). | ||
| 2θ values for (002) diffraction peaks/° | Interlayer distance/Å | |
|---|---|---|
| MX | 7.76 | 11.39 |
| TMAMX | 6.08 | 14.53 |
| TMAMX-PW12 | 7.62 | 11.58 |
| TBAMX | 5.90 | 14.95 |
| TBAMX-PW12 | 6.38 | 13.84 |
| DTAMX | 6.10 | 14.48 |
| DTAMX-PW12 | 6.16 | 14.34 |
| CTAMX | 4.26 | 20.70 |
| CTAMX-PW12 | 4.96 | 17.80 |
In the expansion of the interlayer distance we can distinguish two cases: isotropic and markedly anisotropic cations.
Considering the shape of cations, TMA+ and TBA+ are spherical, while DTA+ and CTA+ are tadpole-like. The former only have one way to get intercalated whereas the latter can suffer a certain degree of conformational variation. This could explain the relatively similar spacings of TBA and DTA intercalates. On the other hand, when we compare the cases of the two anisotropic cations we find the same trend. DTA+ and CTA+ both have three methyl groups and a long aliphatic chain. The tail of CTA+ (hexadecyl) is longer than DTA+ (dodecyl), leading to a larger interlayer distance (20.70 Å). It becomes more difficult for larger spherical quaternary ammonium cations to insert into the layers.19 Our TGA results also agree with that. Increasing spherical quaternary ammonium cation size can only expand the interlayer space slightly, since fewer cations get intercalated. By contrast, tadpole-like quaternary ammonium cations can easily insert into the layers even with a long tail. Some studies have confirmed that the interlayer space gets expanded remarkably with the increase of tail length.28,31 Indeed, the interlayer distance of CTAMX is 20.70 Å, larger than DTAMX (14.48 Å). It is the largest interlayer distance among all the samples.
After being coupled with PW12 clusters, the MXene/POM hybrids show a shrunken interlayer distance. The shrinkage of interlayer space must be associated with the extraction of cations during the reaction with PW12 and following the washing procedure. Among all the MXene/POM hybrids, only TMAMX-PW12 exhibits extra diffraction peaks. They match well with the XRD patterns of TMAPW12 (Fig. S1†). This confirms that the pre-intercalated quaternary ammonium cations can fasten PW12 anions to form organic PW12 compounds.
The PW12 anions have a high affinity toward the quaternary ammonium cations associated with a large lattice energy, which results in the precipitation of quaternary ammonium phosphotungstate salts when these two ions are mixed in aqueous solution (synthesis of quaternary ammonium phosphotungstate derivatives, in ESI†). This large lattice energy acted as the driving force to fasten PW12. Even though the other MXene/POM hybrids do not show distinct extra peaks from POM, this does not mean the absence of organic PW12 compounds. TMAMX has the highest cation concentration, anchoring more PW12 clusters and forming big enough PW12 crystals to present diffraction patterns. The other MXene/POM hybrids do not present characteristic diffraction patterns from POMs. Several reasons can explain this: low loading mass, nanocrystals, and intrinsically poor crystalline nature (Fig. S1†). Meanwhile, the interlayer distance of TMAMX-PW12 shrinks most significantly (from 14.53 Å to 11.58 Å), close to pristine MXene (11.39 Å), indicating that most of the TMA+ has been extracted. TBAMX-PW12 and DTAMX-PW12 only show a slight shrinkage of the interlayer distance. CTAMX-PW12 shows a visible decrease in the interlayer space as well as a lower crystallinity (indicated by broader peaks), but its interlayer distance (17.80 Å) is still larger than that of the others.
Electron microscopy and affiliated energy-dispersive X-ray spectroscopy can provide evidence to prove the existence as well as distribution of PW12 clusters. Fig. 3 presents the SEM images of the MXene/POM hybrids. In TMAMX-PW12 (Fig. 3a), we can discern many tiny particles corresponding to TMAPW12, spread everywhere: among Ti3C2Tx flakes and on the surface. By contrast, in TBAMX-PW12 (Fig. 3b), DTAMX-PW12 (Fig. 3c) and CTAMX-PW12 (Fig. 3d), we can hardly discern any such particles. The existence of small particles and nanosheets can explain why the XRD pattern of TMAMX-PW12 is a combination of both TMAPW12 and Ti3C2Tx diffraction patterns. Due to the high concentration of TMA+ in TMAMX and most of TMA+ being extracted when reacting with PW12, TMAPW12 has aggregated into micron-sized particles outside the Ti3C2Tx layers. The absence of such particles in the other MXene/POM hybrids confirms that PW12 clusters have not accumulated into extended microcrystals (therefore diffracting). But this does not mean that PW12 clusters are not attached to MXene. EDX analyses can verify this.
 | ||
| Fig. 3 SEM images of (a) TMAMX-PW12, (b) TBAMX-PW12, (c) DTAMX-PW12 and (d) CTAMX-PW12. | ||
Table 2 lists the titanium and tungsten concentration of the MXene/POM hybrids derived from EDX analysis. TMAMX-PW12 has the largest and DTAMX-PW12 has the smallest amount of W among the MXene/POM hybrids. This agrees well with our expectation: the concentration of the intercalated quaternary ammonium cations affects the capability to fasten PW12 clusters. A considerable amount of W can be discerned in the TBAMX-PW12 and CTAMX-PW12, confirming the effective anchoring of PW12 clusters. In principle, such a concentration of a constituent is high enough to present diffraction patterns if well crystallized. The absence of POM diffraction patterns in TBAMX-PW12, DTAMX-PW12 and CTAMX-PW12 is related to poor crystallinity, such as nanocrystals and long range disorder.
| W wt% | Ti wt% | |
|---|---|---|
| TMAMX-PW12 | 27.31 | 28.93 |
| TBAMX-PW12 | 15.93 | 53.50 |
| DTAMX-PW12 | 7.540 | 55.77 |
| CTAMX-PW12 | 19.01 | 41.45 |
To further investigate the distribution state of PW12 clusters in the MXene/POM hybrids that we cannot discern in SEM, we characterized them in HR-TEM and HAADF-STEM, as presented in Fig. 4.
 | ||
| Fig. 4 HR-TEM images of (a) TBAMX-PW12, (b) DTAMX-PW12 and (c) CTAMX-PW12 (the inset images are zoom-in areas for observing interlayer distance). HAADF-STEM images of (d) TBAMX-PW12, (e) DTAMX-PW12 and (f) CTAMX-PW12. | ||
All the HR-TEM images feature a layered structure. We can estimate the interlayer distance through the zoom-in HR-TEM images. TBAMX-PW12 shows an interlayer distance of 1.42 nm (Fig. 4a inset), and DTAMX-PW12 shows an interlayer distance of 1.41 nm (Fig. 4b inset). Both of them agree well with the interlayer distance derived from the XRD patterns. However, in CTAMX-PW12 HR-TEM images, we can discern different interlayer distances (1.47 nm and 1.97 nm in Fig. 4c inset), which are either larger or smaller than the interlayer distance (1.78 nm) from XRD. We speculate that the two interlayer distances correspond to two intercalations.
The smaller interlayer distance corresponds to Ti3C2Tx layers where a few CTA+ are extracted, and no PW12 clusters get in, leading to an interlayer distance close to TBAMX-PW12 and DTAMX-PW12. The larger interlayer distance corresponds to Ti3C2Tx layers with most CTA+ remaining and PW12 clusters intercalating, reacting with these CTA+.
HAADF-STEM can provide Z-contrast imaging, in which W would be more visible. TBAMX-PW12 (Fig. 4d) show the Ti3C2Tx nanosheets clearly, on which several small bright particles (<50 nm) are attached. These particles are TBAPW12 nanocrystals. Since the particles are much larger than the interlayer distance, it is impossible for them to insert within Ti3C2Tx layers. DTAMX-PW12 (Fig. 4e) shows a similar morphology. We can discern thin, semi-transparent Ti3C2Tx nanosheets with bright particles of 20 nm spreading. DTAPW12 must have aggregated outside of the Ti3C2Tx layers too. CTAMX-PW12 (Fig. 4f) exhibits a different morphology. Numerous tiny bright dots spread everywhere. The EDX spectrum in such an area reveals the coexistence of Ti and W, confirming it is hybridized (Fig. S2†). Meanwhile, these observed areas are still semi-transparent, meaning that they are still very thin. PW12 clusters do not form a continuous, dense aggregation; instead, there is a thin homogeneous discontinuous distribution.
Raman spectra and XPS were used to further investigate how POM crystals combine with MXene. Fig. 5(a) compares the Raman spectra of the pristine MXene, pristine PW12 salt (TMAPW12) and various MXene/POM hybrids (TMAMX-PW12: microcrystal POMs, TBAMX-PW12: nanocrystal POMs and CTAMX-PW12: nano-dispersed POMs). The broad-range scan (with less resolution) reveals that the Ti3C2Tx MXene has its characteristic peaks under 800 cm−1 and PW12 features an intense characteristic peak at around 1000 cm−1 which corresponds to W![[double bond, length as m-dash]](https://www.rsc.org/images/entities/char_e001.gif) O stretching vibration.32 However, in the high-resolution scan between 800 cm−1 and 1100 cm−1, only TMAMX-PW12 presents such intense peaks of PW12, while the other MXene/POM hybrids present hardly discernible broad features (i.e. CTAMX-PW12). The undetected WO stretching vibration peaks in TBAMX-PW12 and CTAMX-PW12 can be ascribed to their poor crystallinity,33 which agrees well with XRD results. The Raman spectra of Ti3C2Tx MXene can be separated into several regions.34 The inset high-resolution scan between 100 cm−1 and 1000 cm−1 presents them better. First comes the flake region consisting of A1g(Ti, C, O) mode, which corresponds to out-of-plane vibrations of titanium atoms in the outer layer as well as carbon and surface groups. Next is the region between 230 and 470 cm−1, representing in-plane (Eg(Tx)) vibrations of surface groups attached to titanium atoms. The last region between 580 and 730 cm−1 is related to carbon vibrations (both Eg(C) and A1g(C)). The Ti3C2Tx MXene with expanded interlayer distance is supposed to shift A1g(C) peaks to high wavenumber.34 However, MXene/POM hybrid materials of larger interlayer distance do not show A1g(C) of higher wavenumbers, which must be attributed to the increased defects. Furthermore, we can discern a slight shift of A1g(Ti, C, O) peaks to low wavenumbers in the case of MXene/POM hybrids. This phenomenon is associated with increased ratio of flake edges to the basal planes (i.e. defects) induced by long-term shaking. The increased defects lead A1g(C) as well as A1g(Ti, C, O) to shift to low wavenumbers.34
O stretching vibration.32 However, in the high-resolution scan between 800 cm−1 and 1100 cm−1, only TMAMX-PW12 presents such intense peaks of PW12, while the other MXene/POM hybrids present hardly discernible broad features (i.e. CTAMX-PW12). The undetected WO stretching vibration peaks in TBAMX-PW12 and CTAMX-PW12 can be ascribed to their poor crystallinity,33 which agrees well with XRD results. The Raman spectra of Ti3C2Tx MXene can be separated into several regions.34 The inset high-resolution scan between 100 cm−1 and 1000 cm−1 presents them better. First comes the flake region consisting of A1g(Ti, C, O) mode, which corresponds to out-of-plane vibrations of titanium atoms in the outer layer as well as carbon and surface groups. Next is the region between 230 and 470 cm−1, representing in-plane (Eg(Tx)) vibrations of surface groups attached to titanium atoms. The last region between 580 and 730 cm−1 is related to carbon vibrations (both Eg(C) and A1g(C)). The Ti3C2Tx MXene with expanded interlayer distance is supposed to shift A1g(C) peaks to high wavenumber.34 However, MXene/POM hybrid materials of larger interlayer distance do not show A1g(C) of higher wavenumbers, which must be attributed to the increased defects. Furthermore, we can discern a slight shift of A1g(Ti, C, O) peaks to low wavenumbers in the case of MXene/POM hybrids. This phenomenon is associated with increased ratio of flake edges to the basal planes (i.e. defects) induced by long-term shaking. The increased defects lead A1g(C) as well as A1g(Ti, C, O) to shift to low wavenumbers.34
 | ||
| Fig. 5 (a) Raman spectra of MX, TMAMX-PW12, TBAMX-PW12, CTAMX-PW12 and pristine TMAPW12 (inset (i) region for analyzing MXene with higher resolution; (ii) region for analyzing PW12 with higher resolution). (b) XPS full spectra, (c) C 1s spectra and Ti 2p spectra of MX and CTAMX-PW12. | ||
To further compare the bonding forming and element valence, we performed XPS analysis on the pristine MXene and the representative hybrid material CTAMX-PW12, in which most POM clusters seem to spread on MXene directly. The low-resolution survey (Fig. 5(b)) confirmed the existence of W (W 4d and W 4p peaks) in CTAMX-PW12. However, the W 4f peaks, the most commonly used peaks to analyze the bonding structure of W, overlap with Ti 3p peaks, which hampered the acquisition of high-resolution W 4f spectra for further analysis. Fig. 5(c) compares the C 1s spectra. Besides the C–Ti, C–C and CO peaks, CTAMX-PW12 presents an extra C–H peak at 286.2 eV from CTA cations. Meanwhile, the C–C peak, normally assigned to adventitious carbon, became stronger in CTAMX-PW12, thanks to C–C in CTA cations. Ti 2p spectra (Fig. 5(d)) can disclose how the two components combined. Ti(II) (2p3/2 455.8 eV, 2p1/2 461.5 eV) and Ti(III) (2p3/2 457.0 eV, 2p1/2 462.9 eV) peaks are associated with surface terminating groups, while Ti(IV) is associated with the over-oxidized state, like TiO2. CTAMX-PW12 spectrum presents weaker Ti(II) peaks and more intensive Ti(III) peaks than MXene, indicating that the inclusion of CTAPW12 changed the valence of Ti. Some chemical bonding was formed between CTAPW12 and surface terminating groups. This phenomenon was also reported in other direct-anchored MXene/POM hybrid materials.35
The PW12 clusters are around 1 nm. If we only consider the size, the interlayer space of around 1.4 nm can accommodate the PW12 clusters. However, TMAMX, TBAMX and DTAMX all fail to do that because of electrostatic repulsion among anions. As a result, the organic PW12 aggregates and forms nanocrystals outside the layers. MXene cannot accommodate smaller anions like Cl− even under the electric field force, owing to the negatively charged surface terminating groups.24 Thus, it is not only a question of size, but also of charge, affinity and compatibility.
CTAMX with a larger interlayer space provides a larger “charge-buffered” volume, has a higher tolerance against electrostatic repulsion and is able to accommodate PW12 clusters. Furthermore, CTAPW12 enjoys better structural compatibility with MXene. Since CTA+ is a surfactant, it can prevent PW12 clusters from aggregation, and rearrange POMs clusters into isolated clusters.27 Several studies have proved that CTA+ can interact with Keggin POMs by self-assembly, and even electrostatic layer-by-layer self-assembly, resulting in well-ordered lamellar phases.36–38 The SEM image (Fig. S2c†) confirms CTAPW12 layers-stacking morphology. We cannot rule out the possibility of the partial crystallization of CTAPW12. However, even though CTAPW12 has formed single-layer short-range orderly lamellas, the layers still can accommodate them thanks to their structural compatibility.
The observed isolated bright dots (PW12 clusters) have two possible locations: on the surface of Ti3C2Tx nanosheets and beneath the thin Ti3C2Tx layers. We speculate that PW12 clusters are mostly beneath the Ti3C2Tx layers, because Ti3C2Tx layers can confine the growth of PW12 clusters and avoid the formation of thick aggregates. Electrochemical characterization, capable of distinguishing whether the associated redox reactions are diffusion-controlled or surface capacitive, can help prove this hypothesis and is discussed below.
Dunn et al. have proposed a method to distinguish whether charge storage processes are diffusion-controlled or surface capacitive by carrying out CVs at various scan rates.39 The dependence of the current response on the scan rate can provide insights into the charge-storage mechanism according to eqn (2):
| i = avb | (2) |
![[thin space (1/6-em)]](https://www.rsc.org/images/entities/char_2009.gif) i vs. logv, in which the slope is the b value.
i vs. logv, in which the slope is the b value.
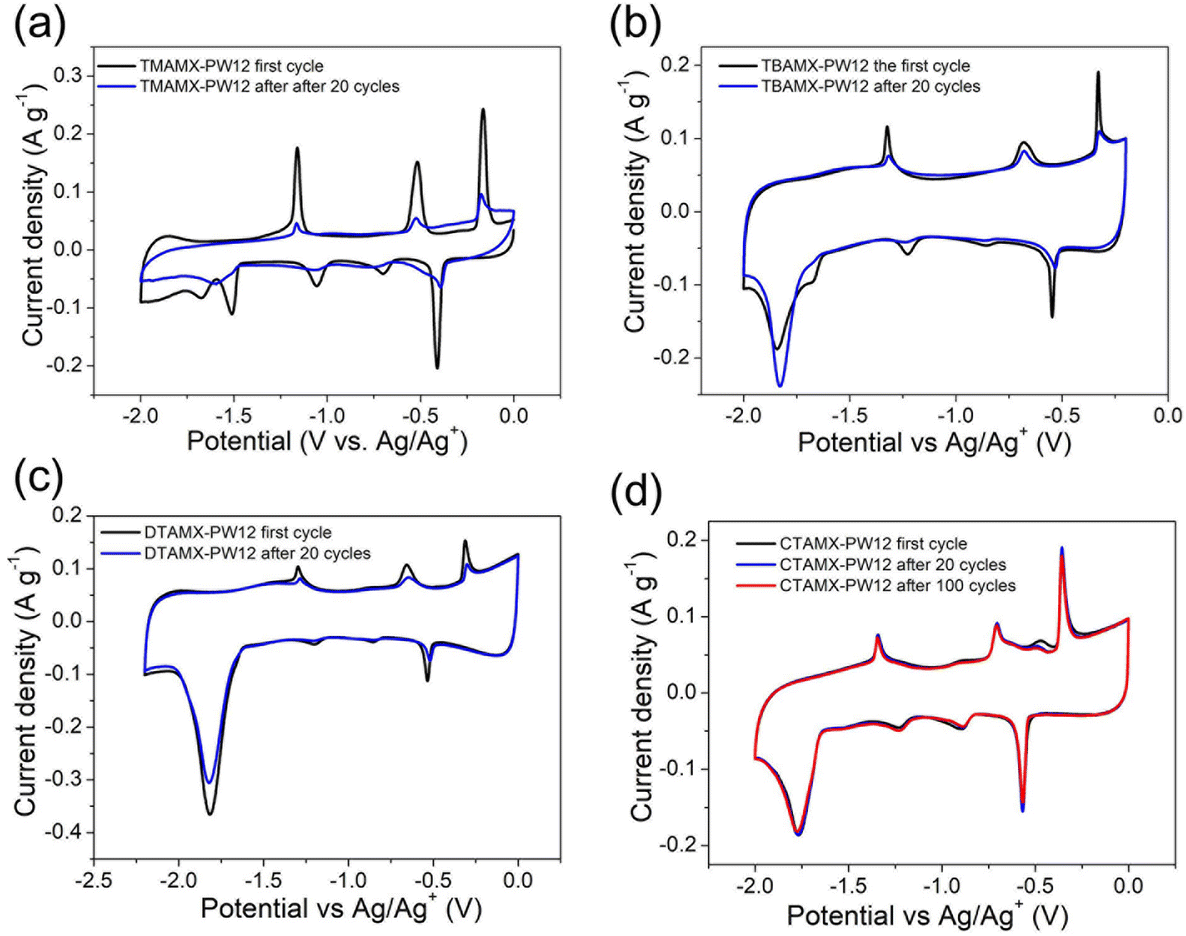
Herein, we performed CVs from 1 mV s−1 to 50 mV s−1 on three MXene/POM hybrids: TMAMX-PW12 (MXene with micro POMs aggregates), TBAMX-PW12 (MXene with nano POMs aggregates) and CTAMX-PW12 (MXene with homogeneously distributed POMs clusters), as shown in Fig. 6a, d and g. The electrochemical behaviours of the crystallized PW12 electrode are also characterized and presented in Fig. S4.† Comparing the CVs of pristine Ti3C2Tx (Fig. S3a†), PW12 (Fig. S4a†) and those of MXene/POM hybrids (Fig. 6), we can classify the redox peaks in the MXene/POM hybrids into two types: the peaks totally derived from PW12, corresponding to Re1–Re3 and Ox1 to Ox3; and the overlapped peak contributed from PW12 and Ti3C2Tx corresponding to the reduction peak at −1.8 V. The pairing of redox peaks is accomplished through carrying out CVs in various narrow potential ranges, as shown in Fig. S5.† Re1 and Ox1 are a redox pair. Ox2 is actually an overlap of two oxidation peaks, pairing with Re2 and Re3. Ox3 is associated with the reduction peak buried in the cation-intercalation peak of Ti3C2Tx (at −1.8 V).
 | ||
| Fig. 6 CVs of (a) TMAMX-PW12 (d) TBAMX-PW12 and (g) CTAMX-PW12. Linear fitting of log currents versus log scan rates plots to determine b-values of reduction peaks and oxidation peaks: (b) and (c) for TMAMX-PW12; (e) and (f) for TBAMX-PW12; (h) and (i) for CTAMX-PW12. (j) Schematic illustration of the fabrication of POMs-intercalated MXene (CTAMX-PW12). | ||
The energy storage mechanisms of pristine Ti3C2Tx and crystallized PW12 were studied (Fig. S3 and S4†). For pristine Ti3C2Tx, only the reduction peak, corresponding to the cation-intercalation, is in part diffusion-controlled (b = 0.75). The remaining rectangle shape mainly corresponds to the surface capacitive process (b = 0.92). For crystallized PW12, the redox pairs show various diffusion-controlled percentages. The Re1 and Ox1 redox pair, which presents the sharpest peaks, is mostly diffusion-controlled (b = 0.6), whereas the other peaks, especially the broad peaks, are less diffusion-controlled or even almost surface capacitive (b = 1 for Re2). This reveals the nature of the multi-step redox reaction of crystallized PW12 in the organic electrolyte: the first step is more diffusion-controlled.
We performed linear fitting on the redox peaks of the three MXene/POM hybrids, as shown in Fig. 6(b, c), (e, f) and (h–l). The figures confirm the good fit. The fitting results are listed in Table 3. The b-values of TMAMX-PW12 are close to 0.5, indicating that the redox reactions are almost 100% diffusion-controlled. This is not surprising with such large crystallized POMs particles.40 The b-values of TBAMX-PW12 increase. Several studies have pointed out that the energy storage mechanism shifts from diffusion-controlled to surface capacitive with decreasing particle size.41 TMAMX-PW12 has PW12 microcrystals while TBAMX-PW12 has PW12 nanocrystals. The redox reaction in TBAMX-PW12 becomes less diffusion-controlled since PW12 crystals are smaller.
| Ox1 | Ox2 | Ox3 | Re1 | Re2 | Re3 | |
|---|---|---|---|---|---|---|
| TMAMX-PW12 | 0.51 | 0.50 | 0.52 | 0.54 | 0.50 | 0.55 |
| TBAMX-PW12 | 0.66 | 0.57 | 0.62 | 0.55 | 0.96 | 0.67 |
| CTAMX-PW12 | 0.58 | 0.66 | 0.63 | 0.51 | 0.88 | 0.57 |
CTAMX-PW12 does not present larger b-values even though PW12 clusters are dispersed homogeneously at the nanoscale. This is quite surprising at first glance, because in other studies (such as activated carbon/POMs,26,42 reduced graphene oxide/POMs,43 polypyrrole hydrogel wrapped CNT/POMs,44 and metal–organic framework/POMs45–47) where the POMs clusters are nano-dispersed (bright dots detected in HAADF-STEM), the b-values are close to 1, revealing that the redox reactions of the nano-dispersed PW12 clusters are surface capacitive. The electrochemical behaviours of CTAMX-PW12 seem to be contrary to these other studies. However, this is evidence to prove that those nano-dispersed PW12 clusters have intercalated in Ti3C2Tx layers, and have not just spread on the Ti3C2Tx surface. The intercalation of nano-dispersed PW12 clusters remarkably reduced the crystallinity of MXene layers, leading to a FWHM (Full Width Half Maximum) of its (002) diffraction peak (Fig. 2) much wider than the other MXene/POM hybrids, in which the PW12 clusters have crystallized outside. In the other nano-dispersed PW12 hybrid materials, the PW12 clusters are anchored on the surface of the substrates. Most of the active sites on PW12 are exposed to the electrolyte directly. Their redox reactions are surface capacitive. In the case of CTAMX-PW12, the PW12 clusters are dispersed homogeneously within Ti3C2Tx layers where they are surrounded by large cationic surfactant molecules. The electrolyte ions have to diffuse along the slit between Ti3C2Tx layers to reach the PW12 clusters, restricting the redox reactions under diffusion control. Fig. 6(j) illustrates the fabrication process of the POMs intercalated MXene.
Furthermore, we studied the electrochemical stability to check whether the PW12 clusters that can be attached on Ti3C2Tx maintain redox active long term. In fact, the pristine crystallized PW12 electrode undergoes severe redox activity loss upon cycling (Fig. S4(b)†). Some studies applying pristine POMs electrodes have reported the same phenomenon.48 Therefore, most effort has been made in developing POMs-based hybrid materials whose nano-dispersion improves the cycling stability.
Fig. 7 presents CVs of MXene/POM hybrids before and after the indicated number of cycles. Their galvanostatic charge–discharge curves are presented in Fig. S5.† Comparing the CVs before and after cycling, TMAMX-PW12 shows the most remarkable difference. All the peak currents drop dramatically. For instance, only 20% of the initial peak current of Ox1 remains after 20 cycles. In order to establish the reason for this decay, we ran EDX analyses of the electrode after cycling and found a very substantial decrease of W in the sample (Fig. S6† and Table S2†). Thus, the most likely conclusion is that POMs are de-attached upon cycling. This, in turn, means that PW12 in the form of microcrystals attached to Ti3C2Tx nanosheets cannot withstand cycling.
 | ||
| Fig. 7 CVs of (a) TMAMX-PW12, (b) TBAMX-PW12, (c) DTAMX-PW12 and (d) CTAMX-PW12 before and after a few cycles at 2 mV s−1. | ||
The situations for TBAMX-PW12 and DTAMX-PW12 are better than TMAMX-PW12, but still not good enough. TBAMX-PW12 maintains 21% of the initial peak current of Ox1 after 20 cycles, and DTAMX-PW12 has 35% left. By analogy, we can conclude that also PW12 nanocrystals are lost upon cycling in the organic electrolyte. Meanwhile, the quasi-rectangles derived from Ti3C2Tx almost keep their initial shape, indicating the good stability of Ti3C2Tx in the organic electrolyte. The cation-intercalation peaks (at around −1.8 V) sharpen after cycling, which must be associated with the activation process. In pristine Ti3C2Tx, this cation-intercalation peak is less intense than in TBA or DTA-intercalated MXenes. This suggests enhanced cation-intercalation processes associated with the larger interlayer spacing provided by pre-intercalated TBA and DTA cations. Indeed, MXenes pre-intercalated with organic cations have been reported to accommodate more cations from the electrolytes, resulting in increased capacities.23,31,49 Unlike the other three MXene/POM hybrids, the CVs of CTAMX-PW12 after 20 cycles almost overlap the first one. Even after 100 cycles, the peak current of Ox1 is still 104% of the first cycle, revealing its excellent electrochemical stability.
To further analyze the electrochemical stability as well as to evaluate their charge-storage capability, we assembled a series of asymmetric devices with activated carbon positive electrodes and MXene/POM negative electrodes. Fig. 8(a–c) presents the galvanostatic charge–discharge curves. The small plateau on charge and discharge curves and the variable slope confirmed the hybrid nature. Fig. 8(d) depicts the specific capacitance at different current densities. CTAMX-PW12 delivered higher specific capacitance than TBAMX-PW12 and TMAMX-PW12 over the whole range, which must be attributed to the larger interlayer distance.31 However, compared with pristine MXene (30 F g−1 at 10 mV s−1 in the same electrolyte35), the inclusion of CTAPW12 did not enhance the capacitance remarkably. PW12 has a large molecular weight (>2800 g mol−1), making it less effective in enhancing specific capacitance but more effective in enhancing volumetric capacitance.26 We cycled the asymmetric cells to test their stability (Fig. 8(e)). TMAMX-PW12 and TBAMX-PW12 suffered a dramatic loss from the beginning; only 70% and 78% of the initial capacitance remained after 500 cycles, respectively. Their redox waves almost disappeared (Fig. 8(e) inset). By contrast, CTAMX-PW12 maintained 85% after 5000 cycles. Fig. 8(f) confirmed that the POMs were still anchored on MXene and redox active after 5000 cycles.
 | ||
| Fig. 8 Galvanostatic charge–discharge curves of (a) TMAMX-PW12, (b) TBAMX-PW12 and (c) CTAMX-PW12. (d) Specific capacitance of MXene/POM hybrids at various current densities. (e) Cycling stability test from charge–discharge data at 2 A g−1: inset are the comparison of cyclic polarization curves of TBAMX-PW12 and TMAMX-PW12 before and after 500 cycles. (f) Cyclic polarization curves of CTAMX-PW12 before and after 5000 cycles. Impedance spectra of MXene/POM hybrids (g) before and (h) after cycling. | ||
Fig. 8(g and h) compares the electrochemical impedance spectra before and after cycling. The intercepts at the very high-frequency region represent equivalent series resistance (Rs). The arc at high frequency represents charge-transfer resistance Rct. The following transitory parts between the semicircles and the final linear parts represent the Warburg impedance associated with mass transfer (diffusion). We fitted the spectra with a modified Randles circuit (Fig. S7†), and the fitted values are listed in Table S3.† All the spectra feature similar Rs thanks to the same setup. The Rct of the fresh electrodes follows this order: CTAMX-PW12 < TBAMX-PW12 < TMAMX-PW12, which agrees well with their crystal size. In these MXene/POM hybrids, MXene acts as the conductive scaffold while POMs provide extra redox activity but are poorly conductive. The POM clusters near MXene can accept electrons and quickly carry out redox reactions. By contrast, the interior clusters of large POM crystals suffer long, inefficient electron transfer, leading to larger charge-transfer resistance. After cycling, all the spectra present larger semicircles. This can be explained by the fact that the expansion and shrinkage of MXene layers caused by repeated intercalation–deintercalation of cations impairs the attachment of POMs on MXene. TBAMX-PW12 and TMAMX-PW12 suffered a larger increase in Rct, agreeing well with their worse cycling stability.
The difference between CTAMX-PW12 and the other MXene/POM hybrids must be related to microstructure. This excellent electrochemical stability is usually found in well-dispersed and well-anchored POMs-based hybrid materials, such as activated carbon/POMs,26 graphene/POMs43 and metal–organic framework/POMs.50 TMAMX-PW12, TBAMX-PW12 and DTAMX-PW12 behave like pristine crystallized PW12 electrodes because the PW12 clusters have crystallized into micro or nanoparticles outside MXene layers. The micro or nanoparticles are attached to or surrounded by multilayer Ti3C2Tx flakes. Ti3C2Tx serves as both an active component and the conductive substrate for PW12 anchoring. The conductivity within the PW12 particles is still poor.
On the contrary, in the case of CTAMX-PW12, PW12 clusters are nano-dispersed, rigidly intercalated within Ti3C2Tx layers. Every PW12 cluster has direct access to the conductive Ti3C2Tx substrate. And, last but not least, an EDX analysis of the electrode after 100 cycles showed only a minor loss of W in the sample, as compared with TMAMX-PW12 (Fig. S6† and Table S2†), all of which contribute to explaining the cycling stability. Therefore, CTAMX-PW12 does not suffer the same detachment problem as crystallized PW12 does.
Conclusion
In summary, we successfully prepared a POM-intercalated MXene through the reaction between PW12 anions and the pre-intercalated CTA cations. Some small cations (TMA+) can intercalate into Ti3C2Tx layers easily, but their expansion of the interlayer spacing is not enough to accommodate PW12 anions. CTA+ delaminated Ti3C2Tx (CTAMX) works well thanks to its shape and interlayer spacing (2 nm). The XRD pattern confirms that POM-intercalated MXene (CTAMX-PW12) still keeps a relatively large interlayer distance (1.7 nm). HAADF-STEM shows the PW12 clusters spread homogeneously. The electrochemical analyses prove that the redox reactions of PW12 are still diffusion-controlled in CTAMX-PW12. Combining the information provided by XRD patterns, HR-TEM images, HAADF-STEM images, and electrochemical characterization, we can reach the following conclusion: assisted by CTA cations, PW12 clusters can be intercalated and spread homogeneously at the nanoscale within Ti3C2Tx layers. Contrary to the other POMs/MXene hybrids tested in this work, the CTA-dispersed-POMs intercalated MXene can be reversibly and sustainably cycled in both three-electrode cells and two-electrode cells, showing a superior performance compared with the other crystallized POM-MXene hybrids.Thus, our work has shown how to intercalate and stabilize POMs within MXene, keeping the electroactivity of both in a synergic combination which could be used to harness the electrochemical activity of POMs in a variety of applications.
Conflicts of interest
There are no conflicts to declare.Acknowledgements
Partial funding from Ministerio de Ciencia Innovacion y Universidades (MCIU), the Agencia Estatal de Investigacion (AEI) and the European Regional Development Fund (FEDER) (grants RTI2018-099826-B-I00 and PID2021-128390OB-I00) is gratefully acknowledged. ICN2 is funded by the CERCA programme/Generalitat de Catalunya, and also supported by the Severo Ochoa Centres of Excellence programme, funded by the Spanish Research Agency (AEI, grant no. SEV-2017-0706). J. J Z. acknowledges his scholarship (no. 201806370211) under the China Scholarship Council. This work has been carried out within the framework of the doctoral program (PhD) of Material Science (Department of Physics) of Universitat Autonoma de Barcelona (UAB).References
- M. Naguib, M. Kurtoglu, V. Presser, J. Lu, J. Niu, M. Heon, L. Hultman, Y. Gogotsi and M. W. Barsoum, Adv. Mater., 2011, 23, 4248–4253 CrossRef CAS PubMed.
- L. Verger, C. Xu, V. Natu, H.-M. Cheng, W. Ren and M. W. Barsoum, Curr. Opin. Solid State Mater. Sci., 2019, 23, 149–163 CrossRef CAS.
- M. R. Lukatskaya, O. Mashtalir, C. E. Ren, Y. Dall'Agnese, P. Rozier, P. L. Taberna, M. Naguib, P. Simon, M. W. Barsoum and Y. Gogotsi, Science, 2013, 341, 1502–1505 CrossRef CAS PubMed.
- F. Shahzad, M. Alhabeb, C. B. Hatter, B. Anasori, S. M. Hong, C. M. Koo and Y. Gogotsi, Science, 2016, 353, 1137–1140 CrossRef CAS PubMed.
- S. J. Kim, H. J. Koh, C. E. Ren, O. Kwon, K. Maleski, S. Y. Cho, B. Anasori, C. K. Kim, Y. K. Choi, J. Kim, Y. Gogotsi and H. T. Jung, ACS Nano, 2018, 12, 986–993 CrossRef CAS PubMed.
- K. Rasool, R. P. Pandey, P. A. Rasheed, S. Buczek, Y. Gogotsi and K. A. Mahmoud, Mater. Today, 2019, 30, 80–102 CrossRef CAS.
- P. Kuang, J. Low, B. Cheng, J. Yu and J. Fan, J. Mater. Sci. Technol., 2020, 56, 18–44 CrossRef.
- A. Sarycheva, A. Polemi, Y. Liu, K. Dandekar, B. Anasori and Y. Gogotsi, Sci. Adv., 2018, 4, eaau0920 CrossRef PubMed.
- H. Chao, H. Qin, M. Zhang, Y. Huang, L. Cao, H. Guo, K. Wang, X. Teng, J. Cheng, Y. Lu, H. Hu and M. Wu, Adv. Funct. Mater., 2021, 31, 2007636 CrossRef CAS.
- S. Zhou, C. Gu, Z. Li, L. Yang, L. He, M. Wang, X. Huang, N. Zhou and Z. Zhang, Appl. Surf. Sci., 2019, 498, 143889 CrossRef CAS.
- L. Zong, H. Wu, H. Lin and Y. Chen, Nano Res., 2018, 11, 4149–4168 CrossRef CAS.
- J. Miao, Z. Lang, X. Zhang, W. Kong, O. Peng, Y. Yang, S. Wang, J. Cheng, T. He, A. Amini, Q. Wu, Z. Zheng, Z. Tang and C. Cheng, Adv. Funct. Mater., 2018, 29, 1805893 CrossRef.
- X. Yang, Q. Wang, K. Zhu, K. Ye, G. Wang, D. Cao and J. Yan, Adv. Funct. Mater., 2021, 31, 2101087 CrossRef CAS.
- M. R. Horn, A. Singh, S. Alomari, S. Goberna-Ferrón, R. Benages-Vilau, N. Chodankar, N. Motta, K. Ostrikov, J. MacLeod, P. Sonar, P. Gomez-Romero and D. Dubal, Energy Environ. Sci., 2021, 14, 1652–1700 RSC.
- M. Genovese and K. Lian, J. Mater. Chem. A, 2017, 5, 3939–3947 RSC.
- T. Kitanosono, K. Masuda, P. Xu and S. Kobayashi, Chem. Rev., 2018, 118, 679–746 CrossRef CAS PubMed.
- M. Sánchez, A. González, L. Sabio, W. Zou, R. Ramanathan, V. Bansal and J. M. Dominguez-Vera, Mater. Today Chem., 2021, 21, 100491 CrossRef.
- S. Chen, Y. F. Xiang, M. K. Banks, C. Peng, W. J. Xu and R. X. Wu, Nanoscale, 2018, 10, 20043–20052 RSC.
- M. Alhabeb, K. Maleski, B. Anasori, P. Lelyukh, L. Clark, S. Sin and Y. Gogotsi, Chem. Mater., 2017, 29, 7633–7644 CrossRef CAS.
- Y. Dall'Agnese, P. Rozier, P.-L. Taberna, Y. Gogotsi and P. Simon, J. Power Sources, 2016, 306, 510–515 CrossRef.
- J. L. Hart, K. Hantanasirisakul, A. C. Lang, B. Anasori, D. Pinto, Y. Pivak, J. T. van Omme, S. J. May, Y. Gogotsi and M. L. Taheri, Nat. Commun., 2019, 10, 522 CrossRef CAS PubMed.
- S. Zheng, C. J. Zhang, F. Zhou, Y. Dong, X. Shi, V. Nicolosi, Z.-S. Wu and X. Bao, J. Mater. Chem. A, 2019, 7, 9478–9485 RSC.
- J. Luo, W. Zhang, H. Yuan, C. Jin, L. Zhang, H. Huang, C. Liang, Y. Xia, J. Zhang, Y. Gan and X. Tao, ACS Nano, 2017, 11, 2459–2469 CrossRef CAS PubMed.
- N. Shpigel, A. Chakraborty, F. Malchik, G. Bergman, A. Nimkar, B. Gavriel, M. Turgeman, C. N. Hong, M. R. Lukatskaya, M. D. Levi, Y. Gogotsi, D. T. Major and D. Aurbach, J. Am. Chem. Soc., 2021, 143, 12552–12559 CrossRef CAS PubMed.
- A. Misra, K. Kozma, C. Streb and M. Nyman, Angew. Chem., Int. Ed., 2020, 59, 596–612 CrossRef CAS PubMed.
- J.-J. Zhu, R. Benages-Vilau and P. Gomez-Romero, Electrochim. Acta, 2020, 362, 137007 CrossRef CAS.
- Q. Liu, H. Yu, Q. Zhang, D. Wang and X. Wang, Adv. Funct. Mater., 2021, 31, 2103561 CrossRef CAS.
- J. Y. Si, B. Tawiah, W. L. Sun, B. Lin, C. Wang, A. C. Y. Yuen, B. Yu, A. Li, W. Yang, H. D. Lu, Q. N. Chan and G. H. Yeoh, Polymers, 2019, 11, 976 CrossRef PubMed.
- R. Liu and W. Li, ACS Omega, 2018, 3, 2609–2617 CrossRef CAS PubMed.
- G. Sui, Y. Zhao, Q. Zhang and Q. Fu, RSC Adv., 2016, 6, 54785–54792 RSC.
- K. Liang, R. A. Matsumoto, W. Zhao, N. C. Osti, I. Popov, B. P. Thapaliya, S. Fleischmann, S. Misra, K. Prenger, M. Tyagi, E. Mamontov, V. Augustyn, R. R. Unocic, A. P. Sokolov, S. Dai, P. T. Cummings and M. Naguib, Adv. Funct. Mater., 2021, 31, 2104007 CrossRef CAS.
- L. George, K. Shakeela, G. R. Rao and M. Jaiswal, Phys. Chem. Chem. Phys., 2018, 20, 18474–18483 RSC.
- F. Di Fonzo, A. Bailini, V. Russo, A. Baserga, D. Cattaneo, M. G. Beghi, P. M. Ossi, C. S. Casari, A. Li Bassi and C. E. Bottani, Catal. Today, 2006, 116, 69–73 CrossRef CAS.
- A. Sarycheva and Y. Gogotsi, Chem. Mater., 2020, 32, 3480–3488 CrossRef CAS.
- J.-J. Zhu, A. Hemesh, J. J. Biendicho, L. Martinez-Soria, D. Rueda-Garcia, J. R. Morante, B. Ballesteros and P. Gomez-Romero, J. Colloid Interface Sci., 2022, 623, 947–961 CrossRef CAS.
- S. Liu, D. Volkmer and D. G. Kurth, J. Cluster Sci., 2003, 14, 405–419 CrossRef CAS.
- M. Nyman, D. Ingersoll, S. Singh, F. Bonhomme, T. M. Alam, C. J. Brinker and M. A. Rodriguez, Chem. Mater., 2005, 17, 2885–2895 CrossRef CAS.
- M. Nyman, M. A. Rodriguez, T. M. Anderson and D. Ingersoll, Cryst. Growth Des., 2009, 9, 3590–3597 CrossRef CAS.
- J. Wang, J. Polleux, J. Lim and B. Dunn, J. Phys. Chem. C, 2007, 111, 14925–14931 CrossRef CAS.
- S.-C. Huang, C.-C. Lin, C.-W. Hu, Y.-F. Liao, T.-Y. Chen and H.-Y. Chen, J. Power Sources, 2019, 435, 226702 CrossRef CAS.
- Y. L. Shao, M. F. El-Kady, J. Y. Sun, Y. G. Li, Q. H. Zhang, M. F. Zhu, H. Z. Wang, B. Dunn and R. B. Kaner, Chem. Rev., 2018, 118, 9233–9280 CrossRef CAS PubMed.
- J.-J. Zhu, L. Martinez-Soria and P. Gomez-Romero, Nanomaterials, 2022, 12, 514 CrossRef CAS PubMed.
- D. P. Dubal, J. Suarez-Guevara, D. Tonti, E. Enciso and P. Gomez-Romero, J. Mater. Chem. A, 2015, 3, 23483–23492 RSC.
- M. Wang, Y. Zhang, T. Zhang, Y. Li, M. Cui, X. Cao, Y. Lu, D. Peng, W. Liu, X. Liu, T. Wang and Y. Huang, Nanoscale, 2020, 11887–11898 RSC.
- D. F. Chai, Y. Hou, K. P. O'Halloran, H. J. Pang, H. Y. Ma, G. N. Wang and X. M. Wang, ChemElectroChem, 2018, 5, 3443–3450 CrossRef CAS.
- G. Wang, T. Chen, S. Li, H. Pang and H. Ma, Dalton Trans., 2017, 46, 13897–13902 RSC.
- N. N. Du, L. G. Gong, L. Y. Fan, K. Yu, H. Luo, S. J. Pang, J. Q. Gao, Z. W. Zheng, J. H. Lv and B. B. Zhou, ACS Appl. Nano Mater., 2019, 2, 3039–3049 CrossRef CAS.
- H. Wang, S. Hamanaka, Y. Nishimoto, S. Irle, T. Yokoyama, H. Yoshikawa and K. Awaga, J. Am. Chem. Soc., 2012, 134, 4918–4924 CrossRef CAS PubMed.
- M. Xu, S. Lei, J. Qi, Q. Dou, L. Liu, Y. Lu, Q. Huang, S. Shi and X. Yan, ACS Nano, 2018, 12, 3733–3740 CrossRef CAS PubMed.
- Y. D. Zhang, B. P. Lin, J. C. Wang, P. Han, T. Xu, Y. Sun, X. Q. Zhang and H. Yang, Electrochim. Acta, 2016, 191, 795–804 CrossRef CAS.
Footnote |
| † Electronic supplementary information (ESI) available. See DOI: https://doi.org/10.1039/d2nr01410f |
| This journal is © The Royal Society of Chemistry 2022 |