
 Open Access Article
 This Open Access Article is licensed under a
 Creative Commons Attribution 3.0 Unported Licence
Small variations in reaction conditions tune carbon dot fluorescence†
Teodoro
Garcia-Millan
a,
Thomas A.
Swift
 a,
David J.
Morgan
bc,
Robert L.
Harniman
a,
Benjamin
Masheder
d,
Stephen
Hughes
d,
Sean A.
Davis
a,
Thomas A. A.
Oliver
*a and
M. Carmen
Galan
*a
a,
David J.
Morgan
bc,
Robert L.
Harniman
a,
Benjamin
Masheder
d,
Stephen
Hughes
d,
Sean A.
Davis
a,
Thomas A. A.
Oliver
*a and
M. Carmen
Galan
*a
aSchool of Chemistry, University of Bristol, Cantock's Close, Bristol, BS8 1TS, UK. E-mail: tom.oliver@bristol.ac.uk; m.c.galan@bristol.ac.uk
bCardiff Catalysis Institute, Cardiff University, Park Place, Cardiff, CF10 3AT, UK
cHarwellXPS, – ESPRC National Facility for XPS, Research Complex at Harwell (RcAH), Didcot, Oxon OX11 0FA, UK
dDST Innovations Ltd, Unit 6a Bridgend Business Centre, Bennett Street, Bridgend, CF31 3SH, UK
First published on 25th March 2022
Abstract
The development of robust and reproducible synthetic strategies for the production of carbon dots (CDs) with improved fluorescence quantum yields and distinct emission profiles is of great relevance given the vast range of applications of CDs. The fundamental understanding at a molecular level of their formation mechanism, chemical structure and how these parameters are correlated to their photoluminescence (PL) properties is thus essential. In this study, we describe the synthesis and structural characterization of a range of CDs with distinct physico-chemical properties. The materials were prepared under three minutes of microwave irradiation using the same common starting materials (D-glucosamine hydrochloride 1 and ethylenediamine 2) but modifying the stoichiometry of the reagents. We show that small variation in reaction conditions leads to changes in the fluorescent behaviour of the CDs, especially in the selective enhancement of overlapped fluorescence bands. Structural analysis of the different CD samples suggested different reaction pathways during the CD formation and surface passivation, with the latter step being key to the observed differences. Moreover, we demonstrate that these materials have distinct reversible response to pH changes, which we can be attribute to different behaviour towards protonation/deprotonation events of distinct emission domains present within each nanomaterial. Our results highlight the importance of understanding the reaction pathways that lead to the formation of this carbon-based nanomaterials and how this can be exploited to develop tailored materials towards specific applications.
Introduction
The growing field of nanotechnology has had a major impact on many research areas such as engineering, electronics, energy, environment, biology, and medicine.1,2 In this context, photoluminescent non-toxic and functional nanomaterials that can be easily prepared and tailored to specific applications are of great interest.3–5 Among the different types of luminescent nanodots, fluorescent carbon dots (CDs) have recently been described as a new class of carbon-based fluorescent nanomaterials with semi-spherical morphology, and unique optical and physico-chemical properties.6–9 Due to their tuneable photoluminescence, chemical inertness, high water solubility, low cost of fabrication and very low cytotoxicity,10–12 these materials have found applications in many research areas such as gene delivery,10,13,14 cell imaging,12 metal sensing,11,15 photo-catalysis,16 photosynthesis augmentation17 and photovoltaics.18,19CDs have been produced from a range of organic starting materials including carbohydrates,8,20 amino acids21–23 and other small molecules24 using an array of methods such as thermal decomposition, chemical oxidation and hydrothermal oxidation under autoclave and microwave-assisted conditions. The resulting carbon dots have appreciable fluorescence quantum yields, different emission profiles and response to chemical environments such as pH detection capabilities.25,26
Unlike conventional inorganic quantum dots, CDs behave as nanoscale assemblies of fluorophores,27,28 with associated large Stokes shifts.29–33 Therefore, the fluorescent properties of the CDs are dependent on the molecular structure of the assembled components and surface defects. Further, these properties are tuned by the formation of CD microstructures,34,35 which in turn depend on the chosen synthetic strategy.36
One of the biggest challenges facing the field is the development of robust and reproducible synthetic strategies that lead to well characterised materials, while obtaining improved fluorescence quantum yields and distinct emission profiles.37,38 Despite many recent developments in this rapidly evolving field,29,30,35,39,40 a fundamental understanding at a molecular level of their formation mechanism, chemical structure and how these parameters are correlated to their photoluminescence (PL) properties is still lacking due to their complex physical structure. Consequently, most CDs syntheses are a result of serendipity, rather than rational design.8,41 Thus, understanding the factors that control their emission properties is essential for the development of tailored nanomaterials for bespoke applications.
Most studies to date focus on modifying the type of reagents, e.g. starting materials and/or addition of doping agents.40,42,43 Indeed, seminal efforts in this area have shown, for instance, that modulation of the optical properties of CDs can be achieved by the synergetic hybridisation of surface functional groups,44–47 heteroatom-doping48–51 or confined graphitisation enlargements of the core.52–54 Whereas the fluorescence quantum yield can be enhanced by maintaining structural homogeneity,55 monodispersity56 or surface protection towards environmental perturbations.57,58 Moreover, some reports have demonstrated the coexistence of multiple fluorescence centres within nanoparticles, each with different luminescent properties, thus adding a new strategy to optimise the overall optical performance.59,60
Efforts from our group to develop water-soluble fluorescent carbon-based nanoprobes for biological applications with tuneable fluorescent properties have shown that even small changes in the choice of starting materials can significantly change the resulting CD structure and physicochemical properties.7–9,44 For example, replacing the nature of the N-containing agent from TTDDA9 with an amino acid8 or aryldiamine20 in sugar-based CDs affords the nanoparticles with different fluorescence maxima. However, despite the evident significant effects in the resulting CDs, little attention had been given to study these effects in a systematic manner. Herein, we demonstrate how small changes in reaction conditions using the same common starting materials can be used to generate a range of CDs with tuneable photochemical and physical properties. Analysis of the structure, composition and optical properties of the materials helped us to identify distinct surface emission domains which are responsible for the material's optical properties and observed pH response.
Results and discussion
Following on from our initial observations and to investigate the impact of reaction conditions in the final structural composition and physical characteristics of CDs, a modified three-minute microwave-assisted synthetic protocol9 using D-glucosamine hydrochloride (GlcNH2·HCl, 1) as the carbon precursor and ethylenediamine (EDA, 2) as a surface passivating agent, with varying stoichiometric ratios of reagents 1![[thin space (1/6-em)]](https://www.rsc.org/images/entities/char_2009.gif) :2 from 3:1 to 1:12, was investigated (Table 1). This systematic study generated a library of CDs exhibiting different compositions as determined by NMR (Fig. S1†).
:DOFZ ratios obtained from the 1H NMR resonance integrals – corresponding resonances for CD and DOFZ obtained at δ 3.2, 8.6 and 8.4 ppm, respectively
:2 from 3:1 to 1:12, was investigated (Table 1). This systematic study generated a library of CDs exhibiting different compositions as determined by NMR (Fig. S1†).
:DOFZ ratios obtained from the 1H NMR resonance integrals – corresponding resonances for CD and DOFZ obtained at δ 3.2, 8.6 and 8.4 ppm, respectively
| Sample | Stoichiometry of 1:2 (equiv.) |
CD:DOFZ ratio |
|---|---|---|
| CD-1 | 3:1 |
0.2 |
| CD-2 | 2:1 |
0.7 |
| CD-3 | 1:1 |
1.1 |
| CD-4 | 1:2 |
4.3 |
| CD-5 | 1:3 |
6.8 |
| CD-6 | 1:4 |
10.9 |
| CD-7 | 1:6 |
11.9 |
| CD-8 | 1:8 |
15.1 |
| CD-9 | 1:10 |
20.8 |
| CD-10 | 1:12 |
27.6 |
Fluorescence spectra of the all CDs (ranging between CD-1 to CD-10) revealed two main emission bands in the blue (460 nm) and green (510 nm) that were dependent and independent of the excitation wavelength (vide infra), respectively. The relative intensity of the blue and green fluorescence bands was also dependent on the initial D-GlcNH2·HCl:EDA (1:2) stoichiometry (Fig. 1). When excited with 390 nm light, CDs exhibited an attenuated green emission relative to the blue band. Interestingly, when excited at 450 nm, CDs made with equimolar or a higher ratio of 1 (e.g.CD-1 to CD-3, see Table 1), yielded enhanced green emission compared to CDs made with an excess of 2 (e.g.CD-8, Fig. 1). These results likely originate from the molecular and structural heterogeneity of multiple emissive molecules/centres present on the carbon dot structure and surface functionalisation. Having shown that the synthesized CDs exhibited different optical properties depending on the stoichiometry of reagents, CD-3 and CD-8 were chosen as representative case studies since all CDs shared common spectral features, albeit in different proportions.
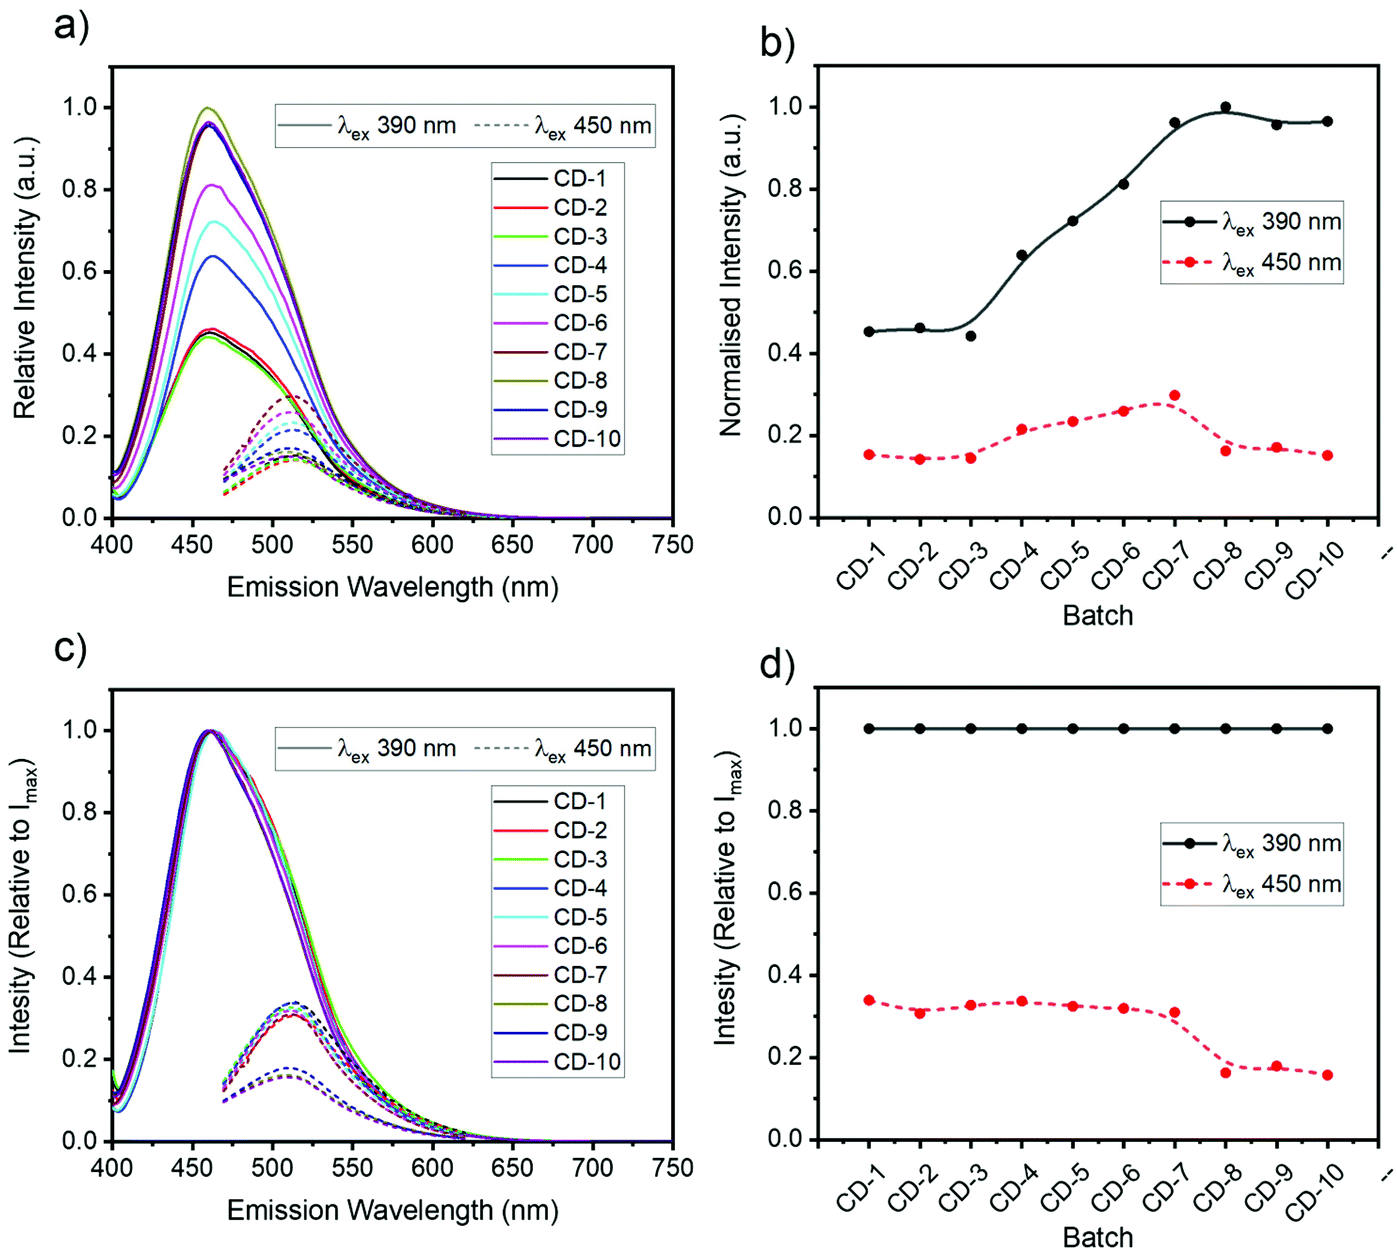 | ||
| Fig. 1 Fluorescence spectroscopy analysis of samples CD-1 to CD-10 excited at 390 nm (solid line) and 450 nm (dashed line): intensity normalised relative to CD-8 maximum (a and b) or normalised independently (c and d). | ||
Composition and structure
1H-NMR analysis was used to help elucidate the structure of the different nanomaterials after purification. Two sets of distinct signals associated to CD surface functionality at δ 1.15 and 3.45 ppm (Fig. 2 and S1†) could be assigned to sp3-protons likely linked to surface EDA, whilst aromatic peaks associated with pyrazine and other N-containing heterocycles were found between 8.6 and 8.3 ppm. Additionally, signals that could be attributed to surface-bound 2,5-deoxyfructosazine (DOFZ) were identified at δ 8.6, 8.4 and 5.0 ppm, especially for CDs that exhibited a more prominent green emission band (Table 1). Indeed, 1H-NMR analysis confirmed that when using an equimolar ratio of precursors 1 and 2, formation of DOFZ is favoured leading to CDs with DOFZ-related functionalities and an apparent enhancement in green emission. Conversely, as the ratio of EDA 2 was increased, the signals associated with DOFZ significantly reduced in intensity (see Fig. 2 and S1† and Table 1). Diffusion ordered spectroscopy (DOSY) NMR experiments of CD-3 (the CD which exhibited a significant green emission enhancement) showed that signals assigned to DOFZ had the same diffusion coefficient (3.8 × 10⁻¹⁰ m2 s−1) as signals attributed to the bulk CDs (see Fig. S2†), hence, suggesting that DOFZ is attached or adhered to the CDs. Moreover, the diffusion coefficients were correlated with the hydrodynamic radii of CDs using an approximation of the Stokes–Einstein equation, which correlated to an average radius of 0.86 nm for both CDs (Table S1†). Additionally, to confirm the presence of amino groups on the CD surface, CD-8 was reacted with succinic anhydride via carbodiimide conjugation, followed by extensive dialysis purification to yield acid-coated CDs. The presence of amino surface groups in CD-8 can be attributed to EDA-derived motifs generated during the CD surface passivation (Fig. S3†).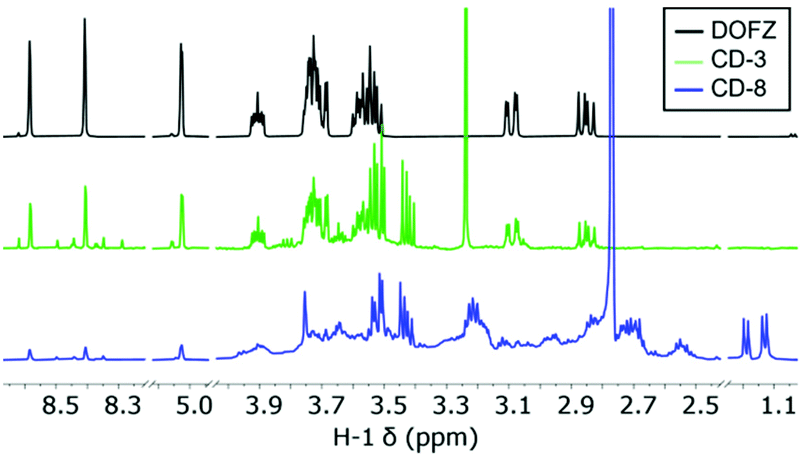 | ||
| Fig. 2 1H-NMR spectra for commercially obtained DOFZ, CD-3 and CD-8. | ||
Previous work in our group has demonstrated that, in the synthetic pathway of CDs fabricated from 1 and aminated precursors, the aldehyde of the hemiacetal can react with the amine forming iminium intermediates prior to multiple steps of degradation/carbonisation9 (Scheme 1). Conversely, DOFZ is thought to be generated from 1,2-aminoaldose self-dimerisation61 and interestingly has been found as a surface component of other green-emitting CDs where 1 was reacted with a less nucleophilic amine source such as m-phenylenediamine.20 DOFZ is not inherently fluorescent at wavelengths longer than 380 nm (Fig. S4†), however its presence in CDs with enhanced green emission, suggests those materials undergo a different synthetic pathway that leads to the formation of alternative functional groups, which results in additional green fluorophores. It is likely that in the presence of an excess of EDA 2, sugar dimerization is suppressed and pathway A is preferred (Scheme 1). In instances when the concentration of sugar 1 is higher or equal to that of the diamine, the nucleophility of the amine doping agent can bias the reaction pathway. It is interesting to note that in the case of EDA 2 or m-phenylenediamine,20 pathway B where DOFZ is formed as intermediate, leads to apparent green emissive fluorophores, while using TTDDA9 or β-aminoacids7 at similar ratios yields predominantly blue emitting CDs.
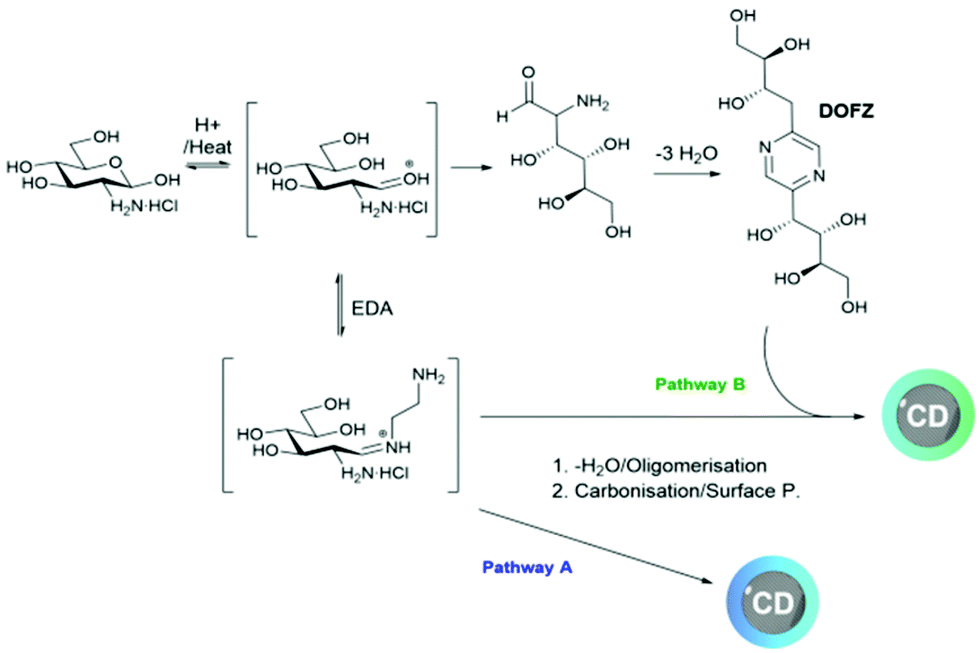 | ||
| Scheme 1 Proposed mechanism for the microwave-assisted synthesis of CDs from GlcNH2·HCl, 1 and EDA 2. | ||
In order to study the physicochemical design of the CDs, Fourier-Transform Infrared Spectroscopy (FTIR) and X-ray Photoelectron Spectroscopy (XPS) were employed to interrogate the chemical and functional group composition of CDs, and X-Ray Diffraction (XRD), Atomic Force Microscopy (AFM) and High-Resolution Transmission Electron Microscopy (HR-TEM) analyses were performed to confirm the size and crystalline carbon structure of the nanoparticles. The presence of –OH/amide groups, which are most likely on the surface, was confirmed by analysis of the FTIR spectra displayed in Fig. 3(a), where the magnitude of the O–H/N–H stretch (3271 cm−1), C–N stretch (1325 cm−1), C–O stretch (1035 cm−1) and amide C![[double bond, length as m-dash]](https://www.rsc.org/images/entities/char_e001.gif) O stretch (1640 cm−1) were observed to vary between CD-3 and CD-8. For instance, a higher ratio of amide/imine/amino groups is present in CD-8 which can be correlated with the higher amount of EDA 2 used during the synthesis. Similarly, the XPS survey (Fig. 3(b)) indicates the presence of predominantly C, O and N heteroatoms in these materials. However, the N:C and O:C content varied with respect to the stoichiometry of the starting materials. As the ratio of 2 increased 8 times from CD-3 to CD-8, the N:C ratio increased by a factor of 2.62, while the O:C content had a discrete increase of 1.06. These findings further support a higher occupation of amide/amino enriched states on the surface of CD-8 than CD-3. High-resolution XPS survey provided additional information about the functionalisation of these heteroatoms within the structure of the CDs (Fig. 3(c)). The narrow C 1s spectrum can be fitted to deconvoluted signals centred at 285.0, 286.2 and 288.2 eV, which can be attributed to C–C/CC, C–N and –COO–, respectively. While the peak in the O (1s) spectrum at ∼533 eV is likely to be O–C–O and the bold O in –O–C(O)–R. Furthermore, the deconvoluted signal for O 1s lines clearly shows an increased prominence of the peak at 531.4 eV associated with CO groups in CD-8 compared to CD-3, reflecting the greater presence of electron-withdrawing groups such as amides. The deconvolution of the N 1s signal suggests equivalent ratios of N groups within the composition of both CDs, attributed to primary amines (399.5 eV) and imide/graphite N (401.4 eV).
O stretch (1640 cm−1) were observed to vary between CD-3 and CD-8. For instance, a higher ratio of amide/imine/amino groups is present in CD-8 which can be correlated with the higher amount of EDA 2 used during the synthesis. Similarly, the XPS survey (Fig. 3(b)) indicates the presence of predominantly C, O and N heteroatoms in these materials. However, the N:C and O:C content varied with respect to the stoichiometry of the starting materials. As the ratio of 2 increased 8 times from CD-3 to CD-8, the N:C ratio increased by a factor of 2.62, while the O:C content had a discrete increase of 1.06. These findings further support a higher occupation of amide/amino enriched states on the surface of CD-8 than CD-3. High-resolution XPS survey provided additional information about the functionalisation of these heteroatoms within the structure of the CDs (Fig. 3(c)). The narrow C 1s spectrum can be fitted to deconvoluted signals centred at 285.0, 286.2 and 288.2 eV, which can be attributed to C–C/CC, C–N and –COO–, respectively. While the peak in the O (1s) spectrum at ∼533 eV is likely to be O–C–O and the bold O in –O–C(O)–R. Furthermore, the deconvoluted signal for O 1s lines clearly shows an increased prominence of the peak at 531.4 eV associated with CO groups in CD-8 compared to CD-3, reflecting the greater presence of electron-withdrawing groups such as amides. The deconvolution of the N 1s signal suggests equivalent ratios of N groups within the composition of both CDs, attributed to primary amines (399.5 eV) and imide/graphite N (401.4 eV).
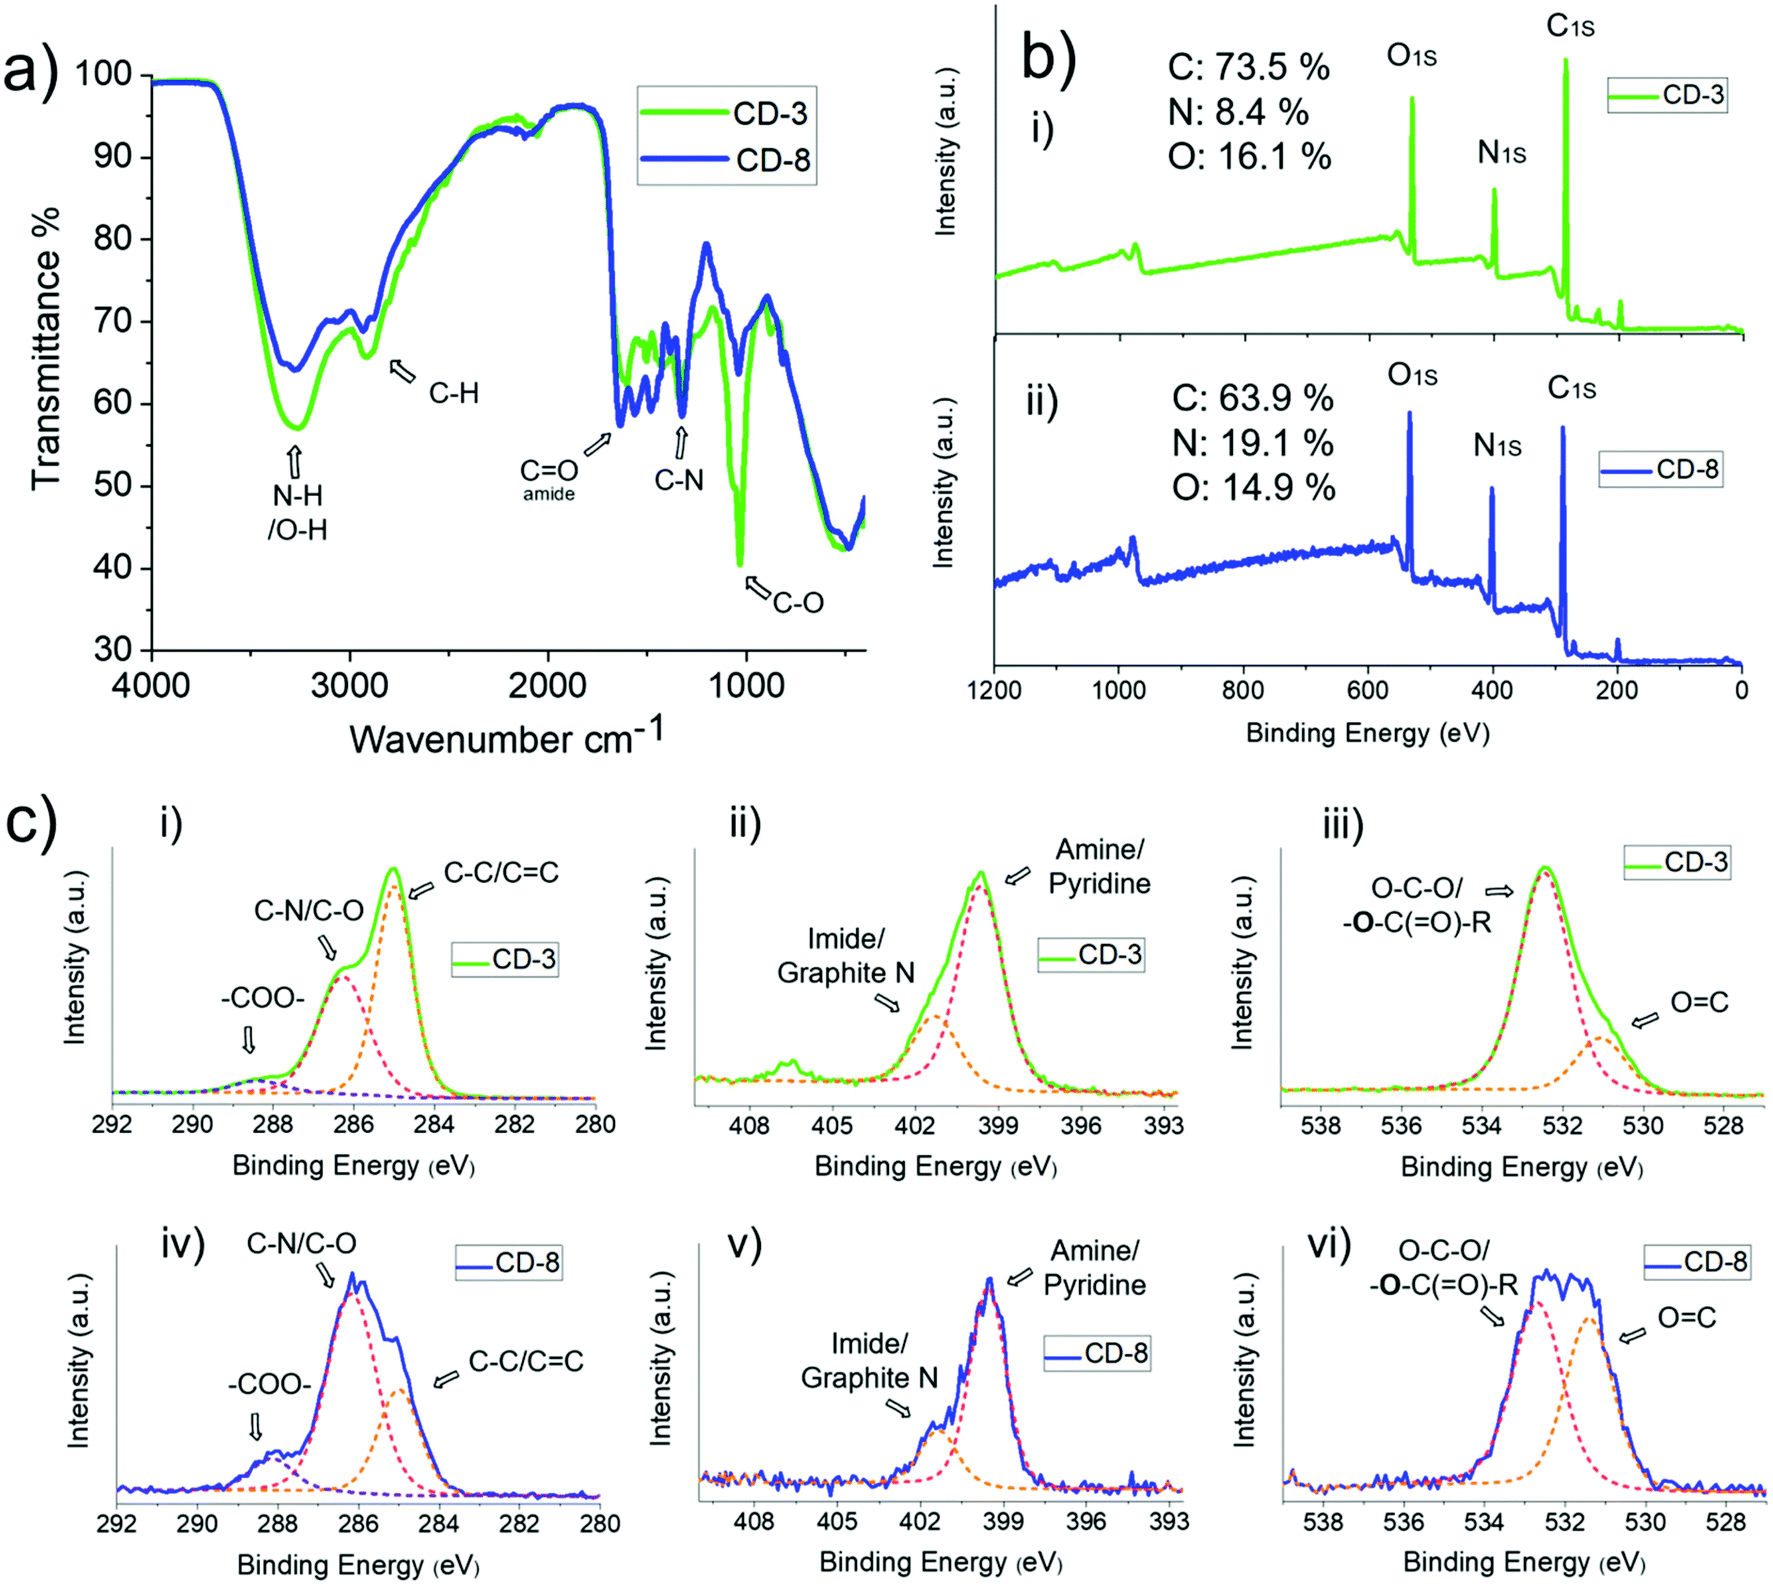 | ||
| Fig. 3 (a) FTIR, (b) XPS and (c) high-resolution XPS with deconvoluted C 1s, N 1s and O 1s signals of CD-3 and CD-8. | ||
It is established that CDs are graphitic-like entities,62 with a delocalised excited state and associated extended exciton Bohr radius, and therefore the incorporation of O and N atom containing functional groups will introduce defects. In turn, this will modify important excited-state properties such as the band-gap, and thus impact the fluorescence maxima. Graphite-like nitrogen63 seen in XPS N 1s (401.4 eV), for instance, can reduce the energy required to exceed the optical bandgap in semi-crystalline CDs and hence, red shift the absorption/excitation of the CDs with respect to non-doped graphitic materials.64,65
The HRTEM imaging of CD-3 and CD-8 exposed the nanoparticles core structure to be semicrystalline in nature (Fig. 4 and S5†). Moreover, AFM image analysis altogether with the HRTEM results, revealed narrow size distribution for quasi-spherical particles with an overall size of about 1.4 nm (refer to ESI for full statistical analysis, Fig. S6–S10†). The XRD pattern of CD-3 and CD-8 showed a broad band at 12.5° and a small shoulder at 24.5° respect to 2θ. These diffractions correspond to a lattice inter-spacing of 0.68 and 0.34 nm for the plane (002) in graphite. The XRD results in conjunction with the d-spacing seen in HRTEM of 0.25 nm (corresponding to the (100) plane), suggest that the crystallinity observed in the CDs core is consistent with graphitic carbon encompassed in confined domains.62,66 The inhomogeneity in size distribution, however, is a reflection of the varying grades of crystallinity within the ensemble and the extent of graphitic domains, causing the broadening of the XRD signals. The crystallites size was hence estimated from the broadening of the XRD spectra using the Scherrer method with a dominant dispersity of around 1.4 nm (insertion in Fig. 4, S11 and Table S2†), which is in agreement to the hydrodynamic radius determined from the DOSY NMR and the size distribution determined by AFM. According HRTEM, AFM and XRD data, we can infer that those differences in crystallinity and core size are negligible between samples CD-3 and CD-8.
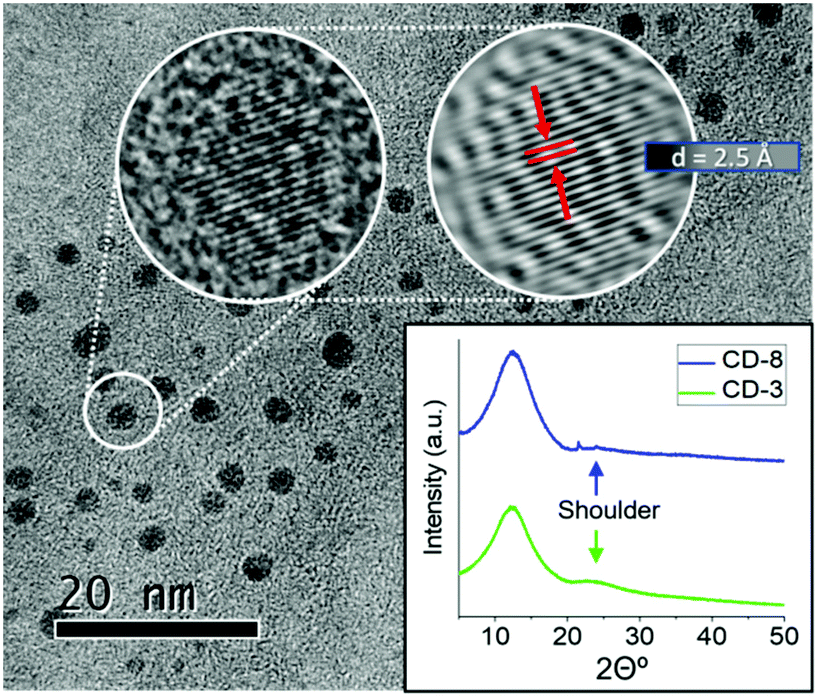 | ||
| Fig. 4 HR-TEM images of CD-8 and XRD analysis for CD-3 and CD-8. | ||
Optical properties
Steady state absorption spectroscopy was used to investigate the link between the CD composition and optical properties. The absorption spectra contain three major bands as evident in Fig. 5(a), including a strong absorption at wavelengths shorter than 260 nm associated with graphene domains, a more structured band centred at ∼275 nm attributed to DOFZ, and a final broad feature which spans into the visible, peaking at ∼350 nm. The overall absorption spectral shape can be attributed to a superposition of excited-state transitions which may originate from different chromophores, or multiple excited states of the same absorbers. This manifold of excited states can be explained in part by chemical alterations of aromatic conjugated systems/extended graphitic structures and structural heterogeneity.64,67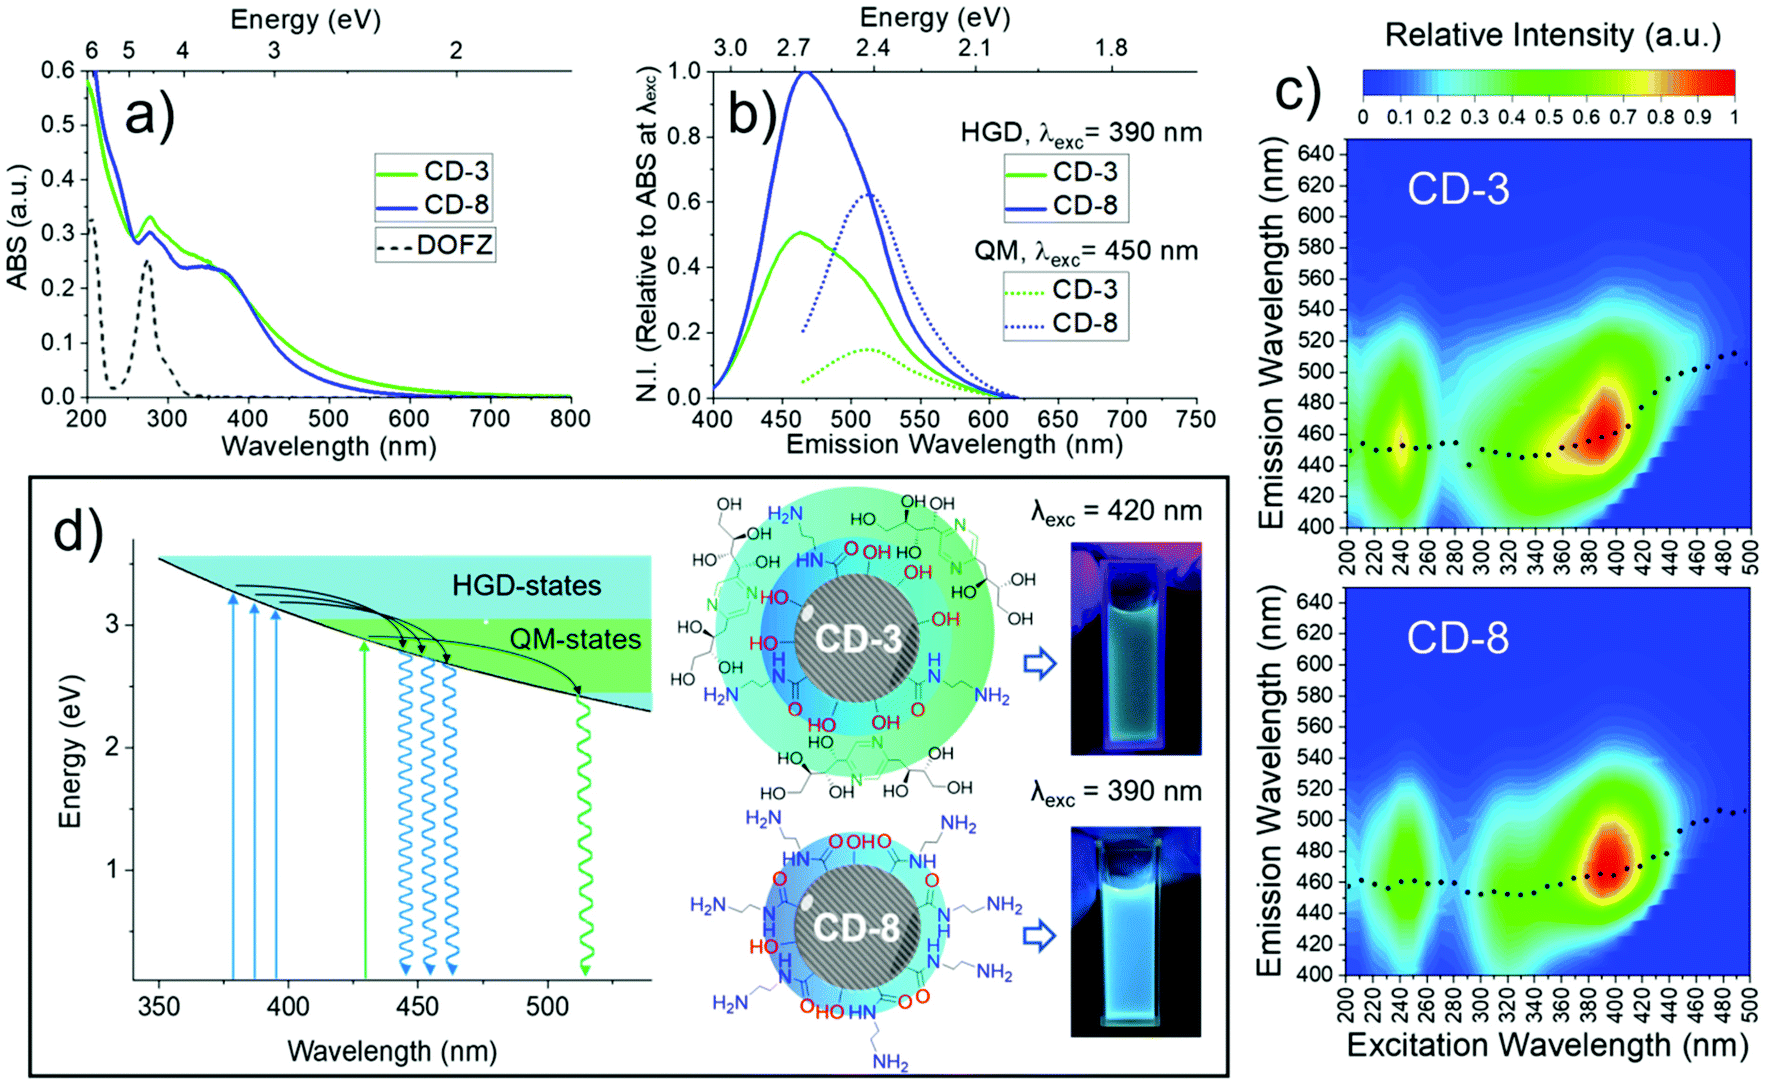 | ||
| Fig. 5 Optical properties of CD-3 and CD-8. (a) Absorption spectra. The DOFZ standard spectrum is included (dashed line). (b) Fluorescence spectra relative to absorption of each sample at the respective excitation wavelength. (c) 2D fluorescence spectra. Black dotted lines represent the maximum fluorescence wavelength at each excitation energy. (d) Schematic energy level diagram illustrating major non-radiative and fluorescent pathways associated with CD-3 and CD-8. | ||
2D fluorescence spectra in Fig. 5(c) revealed two main features; deep-UV excitation (∼240 nm) was correlated with a blue (460 nm) fluorescence band. For longer wavelength excitation, a second (major) band is evident and exhibited excitation-dependent fluorescence and hence, multicolour emission with various coordinates in the chromaticity diagram (Fig. S12†). The maximum intensity of this band was associated with 390 nm excitation (a local maximum in the absorption spectrum). Photoexcitation with wavelengths longer than 405 nm resulted in a shifted fluorescence band peaking at 510 nm (correspond to green light) and was independent of the excitation energy.
In most of the 2D spectra, the bright blue emission obscures the green-shifted fluorescence band. However, the relative fluorescence intensity of both bands varied depending on the synthetic conditions (Fig. 1). Thus, the excitation-independent behaviour of the green band is most evident for excitation wavelengths >410 nm for CD-3 and >440 nm for CD-8.
In semicrystalline CDs, the effective conjugation length scales of the sp2 domains can localise electron–hole pairs, which strongly modifies the bandgap energy gap.68 Furthermore, graphene domains are altered by compositional/structural heterogeneity, giving rise to a continuous set of confined, heteroatom doped and surface/edge passivated sp2 domains, refer here as hybrid graphene domains (HGD). As each part of the hybrid structure has an associated different bandgap, it is therefore logical that this inhomogeneity is static (e.g. preserved) and the source of the observed excitation-dependent emission.
Turning now to the fluorescence which originates from excitation of 450 nm and longer wavelengths, we infer the excitation independent (e.g. Kasha like) behaviour originates from a chemically unique chromophore. It is likely, therefore, that these two photoluminescence centres co-exists in the CD structure and are structurally homogeneous and quasi-molecular (QM) in origin.37 The emission intensity of this centre is more pronounced for CD-3, and according to the FTIR, NMR and XPS analysis is due to the incorporation of DOFZ-related functionalities in the structure of the CDs.
Despite the apparent enhancement of the QM/HGD fluorescence in CD-3, the increased optical density at wavelengths >410 nm suggests that higher emission intensity does not correspond to an improved fluorescence quantum yield, but merely reflects greater absorbance as illustrated in Fig. 5(b) (see also Table S3 and Fig. S13†).
Time correlated single photon counting (TCSPC) studies interrogated the wavelength dependent fluorescence lifetimes of CD-3 and CD-8. These studies strengthened the hypothesis that two excited states contribute to the absorption between 350 and 450 nm. All data for CD-3 and CD-8 were globally fitted to a biexponential decay (convolved with the appropriate instrument response function), and only the normalised amplitudes allowed to change as either a function of the range of fluorescence wavelengths collected or CD sample. This returned two time constants of τ1 = 1.12 ± 0.06 ns and τ2 = 6.0 ± 0.2 ns attributed to fluorescence from QM and HGDs respectively, and the associated normalized amplitudes (A1 and A2) are given in Fig. 6. As these data could be accurately modelled with the same two exponential time constants and only the relative exponential pre-factor varying, it highlights the sensitivity of fluorescence to probing overlapping QM and HGD states.
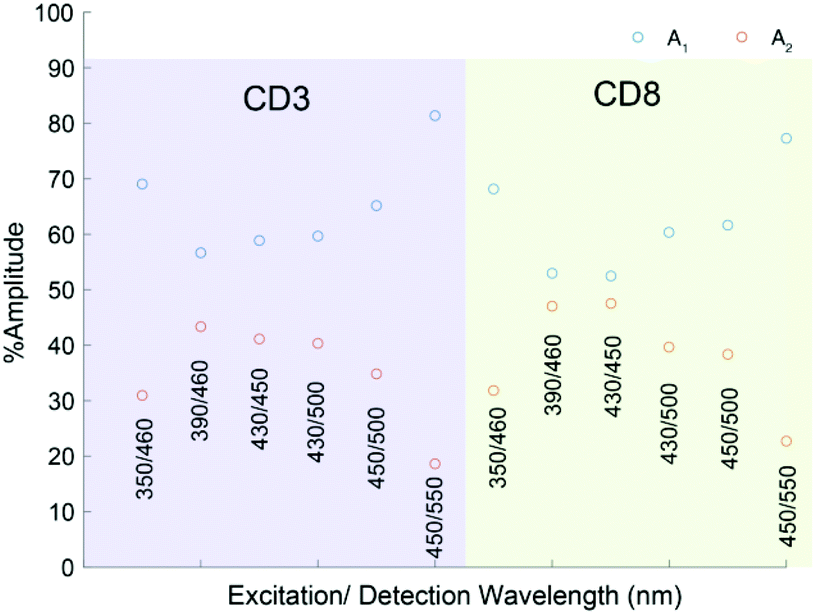 | ||
| Fig. 6 Normalised amplitudes of A1 and A2 as a function of different excitation and detection wavelength pairs for CD-3 and CD-8. | ||
The shorter lifetime component, τ1, dominates as the detected fluorescence wavelength is red-shifted from 450 nm to 550 nm, and thus assigned to QM domains. As the excitation and detection wavelengths are blue-shifted towards 390 and 450 nm respectively, the longer time constant associated with the HGD domains almost becomes equal in magnitude.
Environmental response to cupric salts and pH
Experiments using cupric salts resulted in fluorescence quenching of both the blue (HGD) and green (QM) fluorescence bands (Fig. S14†). Such observations have been made before for CDs with Cu2+, and attributed to photoinduced electron transfer from carbon nanodots to copper ions.44,69 The efficiency of CD fluorescence quenching is far more notable for CD-8 compared to CD-3, which is correlated with the CD:DOFZ ratio (Table 1) – the DOFZ content of CD-3 is 15 times higher than CD-8. Therefore, most likely, if DOFZ is dominantly located within surface domains, it could increase the overall CD radii, and increase the net distance between HGD/QM domains and bulk solution. In turn, this would increase the overall distance to the electron accepting aqueous cupric ions, and thus reduce the probability of photoinduced electron transfer. This is also manifested in the AFM where the distribution of heights is broader for CD-3.
A major advantage of the fluorescence arising from surface functionalisation is that its properties can be readily modulated by changing the surrounding chemical environment. Thus, the emission response of CD-3 and CD-8 was evaluated in a range of different pH (1–14) solutions (Fig. 7(a)). Interestingly, reversible quenching of the overall fluorescence was observed for both samples at alkaline pHs (>10). Further, a significant emission enhancement was observed for CD-8 at acidic pH < 4, while the fluorescence was quenched for CD-3 at pH < 2.5. This is likely due to the difference in surface functionalisation between the two nanoparticles, consistent with the Cu(II) quenching results. It has been shown that surface trap-states associated with CO, CN, –OH and –NH functionalisation can alter the optical properties of HGD (linked to blue emission) upon protonation/deprotonation.70,71 Thus, the strong decrease in the fluorescence intensity observed for pH above 10 can be ascribed to the deprotonation of surface states which activates its trap behaviour leading to non-radiative processes.72
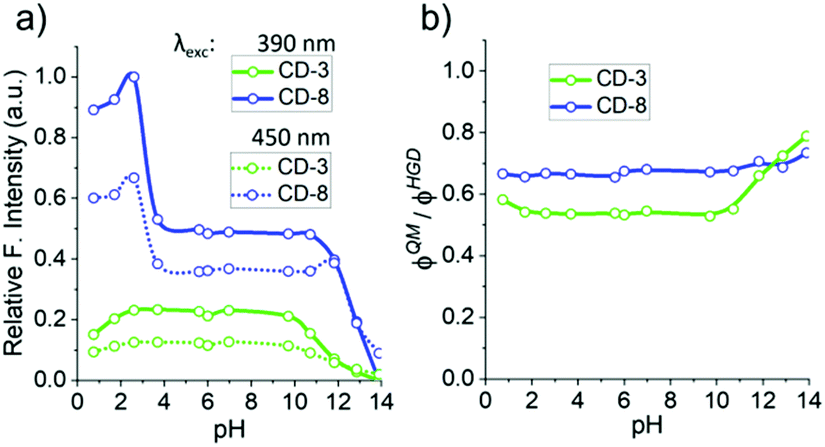 | ||
| Fig. 7 pH analysis of CD-3 and CD-8: (a) relative fluorescence intensity response to pH using an excitation wavelength at 390 nm and 450 nm. (b) Ratio of the emissions relative to the absorption of QM and HGD states using excitation wavelengths at 390 nm and 450 nm respectively. | ||
On the other hand, the dominant EDA 2 passivation in CD-8 suggests that protonation of amino groups has a significant effect on the fluorescence enhancement (pH < 4). This effect may be attributed to a significant contribution of protonated species in the ground state that can affect the excited state, as previously observed for other amino conjugated systems.73 Moreover, due to the length and flexibility of the EDA motif, it seems possible that protonation of the terminal amino group could lead to strong hydrogen bonding between the ammonium tail and surface carbonyl groups as has previously been reported.74,75 This proton-bridged cyclic structure could induce proton transfer in excited states to the carbonyl motif, and such a mechanism has been proposed for the preservation/enhancement of the fluorescent pathway in nanomaterials and aromatic molecules previously.74,75 Notably, CD-3 lacks EDA surface passivation, and the fluorescence yield at acidic pH is diminished relative to pH 7, which is likely associated with the inability to form the proposed cyclic networks.
To better understand the pH response observed, we then assessed the effect of pH changes on the individual chromophores found in CD-3 and CD-8. We screened the relative integrated emission intensity (φ) of samples in the pH scale, comparing the φ ratios of fluorescent bands that correlate to a quasi-molecular state and hybrid-graphene domains (φQM/φHGD, Fig. 7(b)). Between pH 2 and 10, the two fluorescent bands are equally affected by pH, keeping the φ ratio unchanged. However, over pH 10, the φQM/φHGD ratio raises for both samples as result of a higher quenching contribution for φHGD than for φQM. The effect is more significant for CD-3 and correlates to an apparent change to green colour in the overall emission at alkaline pHs.
Conclusions
In summary, a range of CDs with distinct physico-chemical properties were prepared using the same common starting materials, (GlcNH2·HCl 1 and EDA 2), under three minutes of microwave irradiation, but modifying the stoichiometry of the reagents. It was found that small changes in reaction conditions, led to the modulation of composition, fluorescent behaviour and response to the environment in the CDs. Compositional and structural analysis of the different CD samples suggested that the reaction pathways followed during CD formation and surface passivation differed depending on reaction conditions, with the latter step being key to the observed differences, e.g. when an excess of 2 is used, hybrid-graphene domains are formed preferentially which leads to excitation-dependent blue emitting material; while if 1 is in excess, deoxyfructosazine derived functionalities are formed which leads to additional quasi-molecular fluorophores, which in turn yields an enhancement of the green-emissive band. Moreover, we demonstrate that the CDs can respond reversibly to changes in pH and that the response is due to different behaviour towards protonation/deprotonation events of the two distinct emission domains present within each CD. Our results highlight the importance of understanding the reaction pathways that lead to the formation of this carbon-based type of nanomaterials. Moreover, gaining better insights into how small changes in synthetic protocols lead to significant changes in the surface structure and composition of CDs, can be exploited to tune the physico-chemical properties of these exciting nanomaterials towards specific applications.Conflicts of interest
No conflict of interest to disclose.Acknowledgements
MCG the European Research Council (MCG), grant number ERC-COG:648239. TGM thanks EPSRC BCFN EP/L016648/1/Conacyt. This research was also funded by TAAO acknowledges financial support from the Royal Society for a Royal Society University Research Fellowship (UF1402310, URF\R\201007) and a Research Fellows Enhancement Award (RGF\EA\180076). XPS data was collected at the EPSRC National Facility for XPS (‘HarwellXPS’), operated by Cardiff University and UCL, under contract no. PR16195. AFM, XRD, and HRTEM were carried out in the Chemical Imaging Facility, University of Bristol with equipment funded by EPSRC under Grant “Atoms to Applications” Grant ref. (EP/K035746/1).References
- S. M. Janib, A. S. Moses and J. A. MacKay, Imaging and drug delivery using theranostic nanoparticles, Adv. Drug Delivery Rev., 2010, 62(11), 1052–1063 CrossRef CAS PubMed.
- M. A. Hahn, A. K. Singh, P. Sharma, S. C. Brown and B. M. Moudgil, Nanoparticles as contrast agents for in-vivo bioimaging: current status and future perspectives, Anal. Bioanal. Chem., 2011, 399(1), 3–27 CrossRef CAS PubMed.
- G. Xu, S. Zeng, B. Zhang, M. T. Swihart, K. T. Yong and P. N. Prasad, New Generation Cadmium-Free Quantum Dots for Biophotonics and Nanomedicine, Chem. Rev., 2016, 116(19), 12234–12327 CrossRef CAS PubMed.
- J. Wen, Y. Xu, H. Li, A. Lu and S. Sun, Recent applications of carbon nanomaterials in fluorescence biosensing and bioimaging, Chem. Commun., 2015, 51(57), 11346–11358 RSC.
- P. Tallury, A. Malhotra, L. M. Byrne and S. Santra, Nanobioimaging and sensing of infectious diseases, Adv. Drug Delivery Rev., 2010, 62(4–5), 424–437 CrossRef CAS PubMed.
- X. Xu, R. Ray, Y. Gu, H. J. Ploehn, L. Gearheart, K. Raker and W. A. Scrivens, Electrophoretic analysis and purification of fluorescent single-walled carbon nanotube fragments, J. Am. Chem. Soc., 2004, 126(40), 12736–12737 CrossRef CAS PubMed.
- S. A. Hill, D. Benito-Alifonso, S. A. Davis, D. J. Morgan, M. Berry and M. C. Galan, Practical Three-Minute Synthesis of Acid-Coated Fluorescent Carbon Dots with Tuneable Core Structure, Sci. Rep., 2018, 8(1), 12234 CrossRef PubMed.
- S. Hill and M. C. Galan, Fluorescent carbon dots from mono- and polysaccharides: synthesis, properties and applications, Beilstein J. Org. Chem., 2017, 13, 675–693 CrossRef CAS PubMed.
- S. A. Hill, D. Benito-Alifonso, D. J. Morgan, S. A. Davis, M. Berry and M. C. Galan, Three-minute synthesis of sp(3) nanocrystalline carbon dots as non-toxic fluorescent platforms for intracellular delivery, Nanoscale, 2016, 8(44), 18630–18634 RSC.
- W. Liu, C. Li, Y. Ren, X. Sun, W. Pan, Y. Li, J. Wang and W. Wang, Carbon dots: surface engineering and applications, J. Mater. Chem. B, 2016, 4(35), 5772–5788 RSC.
- S. Y. Lim, W. Shen and Z. Gao, Carbon quantum dots and their applications, Chem. Soc. Rev., 2015, 44(1), 362–381 RSC.
- S. N. Baker and G. A. Baker, Luminescent carbon nanodots: emergent nanolights, Angew. Chem., Int. Ed., 2010, 49(38), 6726–6744 CrossRef CAS PubMed.
- L. Hu, Y. Sun, S. Li, X. Wang, K. Hu, L. Wang, X.-j. Liang and Y. Wu, Multifunctional carbon dots with high quantum yield for imaging and gene delivery, Carbon, 2014, 67, 508–513 CrossRef CAS.
- L. Cheng, Y. Li, X. Zhai, B. Xu, Z. Cao and W. Liu, Polycation-b-polyzwitterion copolymer grafted luminescent carbon dots as a multifunctional platform for serum-resistant gene delivery and bioimaging, ACS Appl. Mater. Interfaces, 2014, 6(22), 20487–20497 CrossRef CAS PubMed.
- X. Gao, C. Du, Z. Zhuang and W. Chen, Carbon quantum dot-based nanoprobes for metal ion detection, J. Mater. Chem. C, 2016, 4(29), 6927–6945 RSC.
- G. A. M. Hutton, B. C. M. Martindale and E. Reisner, Carbon dots as photosensitisers for solar-driven catalysis, Chem. Soc. Rev., 2017, 46(20), 6111–6123 RSC.
- T. A. Swift, D. Fagan, D. Benito-Alifonso, S. A. Hill, M. L. Yallop, T. A. A. Oliver, T. Lawson, M. C. Galan and H. M. Whitney, Photosynthesis and crop productivity are enhanced by glucose-functionalised carbon dots, New Phytol., 2021, 229(2), 783–790 CrossRef CAS PubMed.
- J. Shen, Y. Zhu, X. Yang and C. Li, Graphene quantum dots: emergent nanolights for bioimaging, sensors, catalysis and photovoltaic devices, Chem. Commun., 2012, 48(31), 3686–3699 RSC.
- X. Li, M. Rui, J. Song, Z. Shen and H. Zeng, Carbon and Graphene Quantum Dots for Optoelectronic and Energy Devices: A Review, Adv. Funct. Mater., 2015, 25(31), 4929–4947 CrossRef CAS.
- S. A. Hill, S. Sheikh, Q. Zhang, L. Sueiro Ballesteros, A. Herman, S. A. Davis, D. J. Morgan, M. Berry, D. Benito-Alifonso and M. C. Galan, Selective photothermal killing of cancer cells using LED-activated nucleus targeting fluorescent carbon dots, Nanoscale Adv., 2019, 1(8), 2840–2846 RSC.
- J. Jiang, Y. He, S. Li and H. Cui, Amino acids as the source for producing carbon nanodots: microwave assisted one-step synthesis, intrinsic photoluminescence property and intense chemiluminescence enhancement, Chem. Commun., 2012, 48(77), 9634–9636 RSC.
- S. Pandit, P. Behera, J. Sahoo and M. De, In Situ Synthesis of Amino Acid Functionalized Carbon Dots with Tunable Properties and Their Biological Applications, ACS Appl. Bio Mater., 2019, 2(8), 3393–3403 CrossRef CAS PubMed.
- Y. Xu, M. Wu, X. Z. Feng, X. B. Yin, X. W. He and Y. K. Zhang, Reduced carbon dots versus oxidized carbon dots: photo- and electrochemiluminescence investigations for selected applications, Chem. – Eur. J., 2013, 19(20), 6282–6288 CrossRef CAS PubMed.
- X. T. Tian and X. B. Yin, Carbon Dots, Unconventional Preparation Strategies, and Applications Beyond Photoluminescence, Small, 2019, 15(48), e1901803 CrossRef PubMed.
- W. Song, W. Duan, Y. Liu, Z. Ye, Y. Chen, H. Chen, S. Qi, J. Wu, D. Liu, L. Xiao, C. Ren and X. Chen, Ratiometric Detection of Intracellular Lysine and pH with One-Pot Synthesized Dual Emissive Carbon Dots, Anal. Chem., 2017, 89(24), 13626–13633 CrossRef CAS PubMed.
- Q. Xu, Y. Liu, C. Gao, J. Wei, H. Zhou, Y. Chen, C. Dong, T. S. Sreeprasad, N. Li and Z. Xia, Synthesis, mechanistic investigation, and application of photoluminescent sulfur and nitrogen co-doped carbon dots, J. Mater. Chem. C, 2015, 3(38), 9885–9893 RSC.
- S. Khan, A. Gupta, N. C. Verma and C. K. Nandi, Time-Resolved Emission Reveals Ensemble of Emissive States as the Origin of Multicolor Fluorescence in Carbon Dots, Nano Lett., 2015, 15(12), 8300–8305 CrossRef CAS PubMed.
- M. Righetto, A. Privitera, I. Fortunati, D. Mosconi, M. Zerbetto, M. L. Curri, M. Corricelli, A. Moretto, S. Agnoli, L. Franco, R. Bozio and C. Ferrante, Spectroscopic Insights into Carbon Dot Systems, J. Phys. Chem. Lett., 2017, 8(10), 2236–2242 CrossRef CAS PubMed.
- W. Wang, B. Wang, H. Embrechts, C. Damm, A. Cadranel, V. Strauss, M. Distaso, V. Hinterberger, D. M. Guldi and W. Peukert, Shedding light on the effective fluorophore structure of high fluorescence quantum yield carbon nanodots, RSC Adv., 2017, 7(40), 24771–24780 RSC.
- M. Righetto, A. Privitera, I. Fortunati, D. Mosconi, M. Zerbetto, M. L. Curri, M. Corricelli, A. Moretto, S. Agnoli, L. Franco, R. Bozio and C. Ferrante, Spectroscopic Insights into Carbon Dot Systems, J. Phys. Chem. Lett., 2017, 8(10), 2236–2242 CrossRef CAS PubMed.
- S. Kalytchuk, K. Polakova, Y. Wang, J. P. Froning, K. Cepe, A. L. Rogach and R. Zboril, Carbon Dot Nanothermometry: Intracellular Photoluminescence Lifetime Thermal Sensing, ACS Nano, 2017, 11(2), 1432–1442 CrossRef CAS PubMed.
- L. Wang, S. J. Zhu, H. Y. Wang, S. N. Qu, Y. L. Zhang, J. H. Zhang, Q. D. Chen, H. L. Xu, W. Han, B. Yang and H. B. Sun, Common origin of green luminescence in carbon nanodots and graphene quantum dots, ACS Nano, 2014, 8(3), 2541–2547 CrossRef CAS PubMed.
- B. C. M. Martindale, G. A. M. Hutton, C. A. Caputo, S. Prantl, R. Godin, J. R. Durrant and E. Reisner, Enhancing Light Absorption and Charge Transfer Efficiency in Carbon Dots through Graphitization and Core Nitrogen Doping, Angew. Chem., Int. Ed., 2017, 56(23), 6459–6463 CrossRef CAS PubMed.
- D. Mazzier, M. Favaro, S. Agnoli, S. Silvestrini, G. Granozzi, M. Maggini and A. Moretto, Synthesis of luminescent 3D microstructures formed by carbon quantum dots and their self-assembly properties, Chem. Commun., 2014, 50(50), 6592–6595 RSC.
- M. O. Dekaliuk, O. Viagin, Y. V. Malyukin and A. P. Demchenko, Fluorescent carbon nanomaterials: “quantum dots” or nanoclusters?, Phys. Chem. Chem. Phys., 2014, 16(30), 16075–16084 RSC.
- L. Shi, J. H. Yang, H. B. Zeng, Y. M. Chen, S. C. Yang, C. Wu, H. Zeng, O. Yoshihito and Q. Zhang, Carbon dots with high fluorescence quantum yield: the fluorescence originates from organic fluorophores, Nanoscale, 2016, 8(30), 14374–14378 RSC.
- V. Gude, A. Das, T. Chatterjee and P. K. Mandal, Molecular origin of photoluminescence of carbon dots: aggregation-induced orange-red emission, Phys. Chem. Chem. Phys., 2016, 18(40), 28274–28280 RSC.
- S. Ghosh, A. M. Chizhik, N. Karedla, M. O. Dekaliuk, I. Gregor, H. Schuhmann, M. Seibt, K. Bodensiek, I. A. Schaap, O. Schulz, A. P. Demchenko, J. Enderlein and A. I. Chizhik, Photoluminescence of carbon nanodots: dipole emission centers and electron-phonon coupling, Nano Lett., 2014, 14(10), 5656–5661 CrossRef CAS PubMed.
- K. A. Fernando, S. Sahu, Y. Liu, W. K. Lewis, E. A. Guliants, A. Jafariyan, P. Wang, C. E. Bunker and Y. P. Sun, Carbon quantum dots and applications in photocatalytic energy conversion, ACS Appl. Mater. Interfaces, 2015, 7(16), 8363–8376 CrossRef CAS PubMed.
- V. Strauss, J. T. Margraf, C. Dolle, B. Butz, T. J. Nacken, J. Walter, W. Bauer, W. Peukert, E. Spiecker, T. Clark and D. M. Guldi, Carbon nanodots: toward a comprehensive understanding of their photoluminescence, J. Am. Chem. Soc., 2014, 136(49), 17308–17316 CrossRef CAS PubMed.
- Y. Liu, H. Huang, W. Cao, B. Mao, Y. Liu and Z. Kang, Advances in carbon dots: from the perspective of traditional quantum dots, Mater. Chem. Front., 2020, 4(6), 1586–1613 RSC.
- M. A. Sk, A. Ananthanarayanan, L. Huang, K. H. Lim and P. Chen, Revealing the tunable photoluminescence properties of graphene, J. Mater. Chem. C, 2014, 2(34), 6954–6960 RSC.
- S. Sarkar, M. Sudolská, M. Dubecký, C. J. Reckmeier, A. L. Rogach, R. Zbořil and M. Otyepka, Graphitic Nitrogen Doping in Carbon Dots Causes Red-Shifted Absorption, J. Phys. Chem. C, 2016, 120(2), 1303–1308 CrossRef CAS.
- T. A. Swift, M. Duchi, S. A. Hill, D. Benito-Alifonso, R. L. Harniman, S. Sheikh, S. A. Davis, A. M. Seddon, H. M. Whitney, M. C. Galan and T. A. A. Oliver, Surface functionalisation significantly changes the physical and electronic properties of carbon nano-dots, Nanoscale, 2018, 10(29), 13908–13912 RSC.
- K. Yuan, X. Zhang, R. Qin, X. Ji, Y. Cheng, L. Li, X. Yang, Z. Lu and H. Liu, Surface state modulation of red emitting carbon dots for white light-emitting diodes, J. Mater. Chem. C, 2018, 6(46), 12631–12637 RSC.
- H. Ding, S. B. Yu, J. S. Wei and H. M. Xiong, Full-Color Light-Emitting Carbon Dots with a Surface-State-Controlled Luminescence Mechanism, ACS Nano, 2016, 10(1), 484–491 CrossRef CAS PubMed.
- I. Papagiannouli, M. Patanen, V. Blanchet, J. D. Bozek, M. de Anda Villa, M. Huttula, E. Kokkonen, E. Lamour, E. Mevel, E. Pelimanni, A. Scalabre, M. Trassinelli, D. M. Bassani, A. Lévy and J. Gaudin, Depth Profiling of the Chemical Composition of Free-Standing Carbon Dots Using X-ray Photoelectron Spectroscopy, J. Phys. Chem. C, 2018, 122(26), 14889–14897 CrossRef CAS.
- K. Hola, M. Sudolska, S. Kalytchuk, D. Nachtigallova, A. L. Rogach, M. Otyepka and R. Zboril, Graphitic Nitrogen Triggers Red Fluorescence in Carbon Dots, ACS Nano, 2017, 11(12), 12402–12410 CrossRef CAS PubMed.
- X. Li, S. P. Lau, L. Tang, R. Ji and P. Yang, Multicolour light emission from chlorine-doped graphene quantum dots, J. Mater. Chem. C, 2013, 1(44), 7308–7313 RSC.
- X. Gong, W. Lu, Y. Liu, Z. Li, S. Shuang, C. Dong and M. Choi, Low temperature synthesis of phosphorous and nitrogen co-doped yellow fluorescent carbon dots for sensing and bioimaging, J. Mater. Chem. B, 2015, 3(33), 6813–6819 RSC.
- Y. Xu, M. Wu, Y. Liu, X. Z. Feng, X. B. Yin, X. W. He and Y. K. Zhang, Nitrogen-doped carbon dots: a facile and general preparation method, photoluminescence investigation, and imaging applications, Chem. – Eur. J., 2013, 19(7), 2276–2283 CrossRef CAS PubMed.
- K. Hola, A. B. Bourlinos, O. Kozak, K. Berka, K. M. Siskova, M. Havrdova, J. Tucek, K. Safarova, M. Otyepka, E. P. Giannelis and R. Zboril, Photoluminescence effects of graphitic core size and surface functional groups in carbon dots: COO− induced red-shift emission, Carbon, 2014, 70, 279–286 CrossRef CAS.
- B. Ju, H. Nie, Z. Liu, H. Xu, M. Li, C. Wu, H. Wang and S. X. Zhang, Full-colour carbon dots: integration of multiple emission centres into single particles, Nanoscale, 2017, 9(35), 13326–13333 RSC.
- X. Miao, D. Qu, D. Yang, B. Nie, Y. Zhao, H. Fan and Z. Sun, Synthesis of Carbon Dots with Multiple Color Emission by Controlled Graphitization and Surface Functionalization, Adv. Mater., 2018, 30(1), 1704740 CrossRef PubMed.
- C. Scialabba, A. Sciortino, F. Messina, G. Buscarino, M. Cannas, G. Roscigno, G. Condorelli, G. Cavallaro, G. Giammona and N. Mauro, Highly Homogeneous Biotinylated Carbon Nanodots: Red-Emitting Nanoheaters as Theranostic Agents toward Precision Cancer Medicine, ACS Appl. Mater. Interfaces, 2019, 11(22), 19854–19866 CrossRef CAS PubMed.
- Z. Wang, F. Yuan, X. Li, Y. Li, H. Zhong, L. Fan and S. Yang, 53% Efficient Red Emissive Carbon Quantum Dots for High Color Rendering and Stable Warm White-Light-Emitting Diodes, Adv. Mater., 2017, 29(37), 1702910 CrossRef PubMed.
- F. Wang, Z. Xie, H. Zhang, C.-y. Liu and Y.-g. Zhang, Highly Luminescent Organosilane-Functionalized Carbon Dots, Adv. Funct. Mater., 2011, 21(6), 1027–1031 CrossRef CAS.
- Z. Tian, X. Zhang, D. Li, D. Zhou, P. Jing, D. Shen, S. Qu, R. Zboril and A. L. Rogach, Full-Color Inorganic Carbon Dot Phosphors for White-Light-Emitting Diodes, Adv. Opt. Mater., 2017, 5(19), 1700416 CrossRef.
- Y. Chen, H. Lian, Y. Wei, X. He, Y. Chen, B. Wang, Q. Zeng and J. Lin, Concentration-induced multi-colored emissions in carbon dots: origination from triple fluorescent centers, Nanoscale, 2018, 10(14), 6734–6743 RSC.
- S. Mondal, A. Yucknovsky, K. Akulov, N. Ghorai, T. Schwartz, H. N. Ghosh and N. Amdursky, Efficient Photosensitizing Capabilities and Ultrafast Carrier Dynamics of Doped Carbon Dots, J. Am. Chem. Soc., 2019, 141(38), 15413–15422 CrossRef CAS PubMed.
- H. I. Hwang, T. G. Hartman, R. T. Rosen, J. Lech and C. T. Ho, Formation of Pyrazines from the Maillard Reaction of Glucose and Lysine-.alpha.-amine-15N, J. Agric. Food Chem., 1994, 42(4), 1000–1004 CrossRef CAS.
- L. Tang, R. Ji, X. Li, K. S. Teng and S. P. Lau, Size-Dependent Structural and Optical Characteristics of Glucose-Derived Graphene Quantum Dots, Part. Part. Syst. Charact., 2013, 30(6), 523–531 CrossRef CAS.
- J. B. Xu and T. S. Zhao, Mesoporous carbon with uniquely combined electrochemical and mass transport characteristics for polymer electrolyte membrane fuel cells, RSC Adv., 2013, 3(1), 16–24 RSC.
- S. Zhu, Y. Song, X. Zhao, J. Shao, J. Zhang and B. Yang, The photoluminescence mechanism in carbon dots (graphene quantum dots, carbon nanodots, and polymer dots): current state and future perspective, Nano Res., 2015, 8(2), 355–381 CrossRef CAS.
- L. I. Cao, M. J. Meziani, S. Sahu and Y. P. Sun, Photoluminescence properties of graphene versus other carbon nanomaterials, Acc. Chem. Res., 2013, 46(1), 171–180 CrossRef CAS PubMed.
- S. Qu, X. Wang, Q. Lu, X. Liu and L. Wang, A biocompatible fluorescent ink based on water-soluble luminescent carbon nanodots, Angew. Chem., Int. Ed., 2012, 51(49), 12215–12218 CrossRef CAS PubMed.
- A. Sciortino, M. Gazzetto, G. Buscarino, R. Popescu, R. Schneider, G. Giammona, D. Gerthsen, E. J. Rohwer, N. Mauro, T. Feurer, A. Cannizzo and F. Messina, Disentangling size effects and spectral inhomogeneity in carbon nanodots by ultrafast dynamical hole-burning, Nanoscale, 2018, 10(32), 15317–15323 RSC.
- C.-X. Li, C. Yu, C.-F. Wang and S. Chen, Facile plasma-induced fabrication of fluorescent carbon dots toward high-performance white LEDs, J. Mater. Sci., 2013, 48(18), 6307–6311 CrossRef CAS.
- A. Sciortino, A. Madonia, M. Gazzetto, L. Sciortino, E. J. Rohwer, T. Feurer, F. M. Gelardi, M. Cannas, A. Cannizzo and F. Messina, The interaction of photoexcited carbon nanodots with metal ions disclosed down to the femtosecond scale, Nanoscale, 2017, 9(33), 11902–11911 RSC.
- S. Dutta Choudhury, J. M. Chethodil, P. M. Gharat, K. P. P and H. Pal, pH-Elicited Luminescence Functionalities of Carbon Dots: Mechanistic Insights, J. Phys. Chem. Lett., 2017, 8(7), 1389–1395 CrossRef CAS PubMed.
- H. Ding, X.-H. Li, X.-B. Chen, J.-S. Wei, X.-B. Li and H.-M. Xiong, Surface states of carbon dots and their influences on luminescence, J. Appl. Phys., 2020, 127(23), 231101 CrossRef CAS.
- F. Meierhofer, F. Dissinger, F. Weigert, J. Jungclaus, K. Müller-Caspary, S. R. Waldvogel, U. Resch-Genger and T. Voss, Citric Acid Based Carbon Dots with Amine Type Stabilizers: pH-Specific Luminescence and Quantum Yield Characteristics, J. Phys. Chem., 2020, 124(16), 8894–8904 CAS.
- B. Van Duuren, Effects of the Environment on the Fluorescence of Aromatic Compounds in Solution, Chem. Rev., 1963, 63(4), 325–354 CrossRef.
- Z. Qian, J. Ma, X. Shan, L. Shao, J. Zhou, J. Chen and H. Feng, Surface functionalization of graphene quantum dots with small organic molecules from photoluminescence modulation to bioimaging applications: an experimental and theoretical investigation, RSC Adv., 2013, 3(34), 14571–14579 RSC.
- J. Qian and A. M. Brouwer, Excited state proton transfer in the Cinchona alkaloid cupreidine, Phys. Chem. Chem. Phys., 2010, 12(39), 12562–12569 RSC.
Footnote |
| † Electronic supplementary information (ESI) available: Additional figures, experimental information, for ESI spectroscopy and microscopy data in PDF format. See DOI: https://doi.org/10.1039/d2nr01306a |
| This journal is © The Royal Society of Chemistry 2022 |