Temperature-dependent CO2 sorption and thermal-reduction without reactant gases on BaTiO3 nanocatalysts at low temperatures in the range of 300–1000 K

Takumi Watanabe and Tomonori Ohba *
Graduate School of Science, Chiba University, 1-33 Yayoi, Inage, Chiba 263-8522, Japan. E-mail: ohba@chiba-u.jp

Received 14th February 2022 , Accepted 4th May 2022

First published on 4th May 2022


Abstract

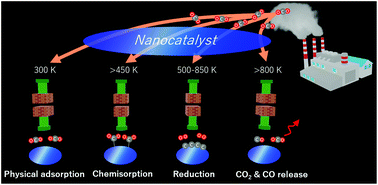
Carbon utilization techniques to mitigate the impact on global warming are an important field in environmental science. CO2 reduction is a significant step for carbon utilization. However, CO2 reduction with less energy consumption has major challenges. In this study, CO2 thermal reduction was demonstrated using nanocatalysts at temperatures lower than 1000 K, and the CO2 sorption and reduction mechanisms within the temperature range of 300–1000 K were evaluated. The physical adsorption on nanocatalysts with a crystal size of 7.4 ± 0.4 nm (10 nm-nanocatalysts) majorly occurred at 300 K and was considerably decreased beyond that temperature. CO2 chemisorption occurred above 450 K and subsequent CO2 reduction occurred above 500 K, which was expected based on the temperature-programmed reaction. CO2 reduction decreased above 900 K by the deactivation of the 10-nm nanocatalyst as a result of its crystal growth. The transmission electron microscopy images also indicated the complete reduction of CO2 into carbon products at 600 and 800 K. Therefore, an optimal condition of CO2 reduction in the temperature range of 500–800 K. The highly active thermocatalyst achieved CO2 reduction into CO and carbon products without any reducing agents even at an extremely low temperature (500 K). In summary, temperature-dependent CO2 sorption and reduction were observed on the 10-nm nanocatalyst; CO2 physical adsorption at 300–500 K, CO2 chemisorption above 450 K, CO2 reduction at 500–850 K, and CO2 and CO releases above 800 K.

Introduction

Global warming and other climate changes have several adverse impacts on the environment such as heat waves, heavy rain, loss of biodiversity, species extinction, and reduction in crop production.1 Thus, global warming should be mitigated, and the increase in the Earth's temperature should be below 1.5 K.2 To accomplish this, CO2 emissions should be decreased by 55% by 2030 in comparison with those recorded in 2010. Moreover, zero CO2 emissions should be achieved by 2050.3 Technologies for reducing CO2 emissions, such as CO2 conversion, and carbon capture and storage, are being developed.

Possible ways for chemical utilization of CO2 include CO2 re-forming of CH4, hydrogenation into formic acid and methanol, methanation, and carbonization. CO2 reduction using renewable energy resources, such as solar energy4–8 and H2,9–16 is also a sustainable method for CO2 conversion. The Sabatier reaction is the most representative methanation reaction, in which CO2 is converted into CH4 using a rare metal catalyst below 773–873 K.9 Nickel is the most common methanation catalyst used in the Sabatier reaction, achieving a turnover frequency (TOF) of 0.006 s−1 for CH4 production at 523 K.10 Using an Fe–Ni bimetallic catalyst increased the TOF of CH4 production to 0.032 s−1.10 The highest reaction TOF of 43 s−1 at 773 K has been reported using a Ru catalyst on commercial TiO2.11 The Sabatier reaction is highly exothermic and typically conducted at 500–700 K. Temperatures higher than these cause a decrease in the CH4 production, while at lower temperatures, the reaction will not reach its kinetic barrier. On the other hand, reverse water–gas shift reactions using photo-electrocatalysts produce CO from CO2 and can take place even at high temperatures because CO formation from CO2 is an endothermic reaction, although photo-electrocatalysts have several disadvantages, including low reaction rate, poor reaction selectivity and limited light wave-length for the H2 production reaction. In a photoelectric reaction, H2 is generated by a photocatalytic water decomposition and CO2 is reduced to CO via intermediates such as the formate species.16,17 The H2 generated by the photocatalytic reaction further reduces CO into methanol or other hydrocarbons by the Fischer–Tropsch synthesis.12,13 The reverse water–gas shift reaction with chemical looping cycles increases CO2 conversion into value-added products.14,15 The above metal catalysts have been used for reverse water–gas shift reaction, and a perovskite-type catalyst including rare metals showed excellent results. La0.75Sr0.25CoO3 catalyst was achieved at the TOF of 1.1–1.4 h−1 for CO production at 1123 K.15 La0.75Sr0.25FeO3 performed a 0.69–1.1 h−1 CO production rate at 823 K.14 Fe incorporation on the B site of the perovskite was useful to avoid CO2 decomposition into solid carbon and improved high CO formation rate and repeatability.14

A reduction without using any fuel, even a clean fuel such as H2, is a promising method for achieving a substantial decrease in CO2 emissions because H2 production involves CO2 emissions (0.5–13 kg CO2 per kg H2).18 Direct thermolysis of CO2 into CO and O2 is the simplest method for CO2 splitting. However, it requires high temperature (above 2300 K). Residual heat from industrial processes (generated at 473–1200 K) can be hardly used for this reaction as it is.19–22 Catalytic CO2 conversion into CO occurs on the oxygen vacancy at 1100–1600 K.23,24 In addition, higher value-added products, such as high hydrocarbons, alcohols, and solid carbons, can be produced by catalytic CO2 conversion. However, few studies have been conducted for the conversion of CO2 into graphitic materials. Carbon products are typically produced via CO2 reduction into CO and the subsequent CO disproportionation reaction into C and CO2 (2CO ⇄ CO2 + C,25 Fig. S1). In a disproportionation reaction, solid carbon generation is thermodynamically preferred in lower temperatures; however, the kinetic limitation requires a higher temperature to reduce CO2.26 Thus, kinetic and thermodynamic factors limit the effectiveness of CO disproportionation reactions in a temperature range of 800–1100 K under ambient pressure.25,27 CO2 conversion into carbon products requires high temperatures between 673 K and 1300 K. Challiwala et al. synthesized multi-walled carbon nanotubes by CO2 reduction using CH4 on a Ni catalyst at 673–873 K.28 Chen et al. synthesized carbon nanofiber from CO2 hydrogenation at 773 K by pottasium-containing Ni/Al2O3 catalysts.29 The conversion of CO2 into multilayer graphene was achieved at 1300 K using Cu–Pd alloys.30 The conversion of CO2 to a graphitic material was only achieved when the metallic substrate had a Cu content higher than 82%. Thus, highly active catalysts are required for low-temperature thermocatalytic reduction of CO2 into carbon products. We have recently reported a low-temperature partial CO2 conversion into solid carbon and nanodiamonds only at 700 K and ambient pressure using perovskite-type nanocatalysts without the need for any reducing gases such as hydrogen.31 The TOF of the CO2 reaction using nanocatalysts was 0.22–0.39 h−1. Thus, low-temperature CO2 conversion into carbon products is a thermodynamically favored reaction and has the potential for zero-energy CO2 capture or conversion.

Despite the challenges of CO2 conversion at low temperature, it is an environmentally friendly technique that should be further developed. Here the potential of CO2 conversion at extremely low temperature using BaTiO3 nanocatalysts is demonstrated, and a possible mechanism of CO2 conversion into CO and carbon products was evaluated by thermogravimetric (TG) analysis, CO2 sorption isotherms, transmission electron microscopy (TEM), scanning electron microscopy (SEM), Raman scattering spectroscopy, X-ray photoelectron spectroscopy (XPS), and mass spectroscopy at 300–1000 K.

Materials and methods

Catalyst preparation

The BaTiO3 nanocatalyst was synthesized using a solvothermal method in a glove box under a N2 atmosphere. The reagents used for the solvothermal synthesis included barium diethoxide (>99%, Kojundo Chemical Laboratory Co., Ltd, Saitama, Japan) and titanium tetraisopropoxide (>99%, Kojundo Chemical Laboratory Co., Saitama, Japan). Methanol (>99%) and methoxyethanol (>99%) were purchased from Fujifilm Wako Pure Chemical Co. (Saitama, Japan). The reagents were added to a methanol and methoxyethanol solution (3[thin space (1/6-em)]:[thin space (1/6-em)]2 (v/v)). Each mixture contained Ti (200 mM) and a total solvent volume of 10 mL. The molar ratio of Ba to Ti and H2O was 1[thin space (1/6-em)]:[thin space (1/6-em)]1[thin space (1/6-em)]:[thin space (1/6-em)]5. Solutions were stirred vigorously for 3 h. Water was then added to each precursor mixture. The mixtures were then heated in an autoclave at 400 K for 24 h. The products were finally dried at 333 K for 1 day in air.

Characterization

The X-ray diffraction (XRD) and small angle X-ray scattering patterns were obtained using an X-ray diffractometer (Smart Lab., Rigaku, Tokyo, Japan) with Cu Kα radiation (λ = 0.1541 nm) at 40 kV and 40 mA. The crystallite sizes of the nanocatalysts were calculated using the Scherrer equation32 based on the full peak widths at half-maximum, which were determined using Rietveld analysis (RIETAN-FP software33). Here, crystallite sizes are denoted as crystal sizes. A Scherrer constant of 0.89 was employed for the calculations. Rietveld refinement parameters (Rwp and S) were used to evaluate the peak-fitting accuracy.33 The hard-sphere model in the small angle X-ray scattering was adopted for particle size distribution.34 N2 adsorption isotherms were measured at 77 K to determine the particle size (BELSORP MAX, MicrotracBEL, Osaka, Japan) using N2 gas (>99.995%). The nanocatalysts were heated at 423 K and below 10−3 Pa before the N2 adsorption measurement. Specific surface areas were determined by BET analysis,35 and the particle sizes were determined using a spherical approximation.

Evaluation of the CO2 reaction

The changes in the weight of the nanocatalysts used in the CO2 reaction were evaluated under the conditions of temperature-sweep at 1, 5, and 10 K min−1 and a constant temperature of 300–1000 K for 4 h (DTG-60/60A, Shimadzu Co., Kyoto, Japan). The catalyst (approximately 50 mg) was placed in an alumina pan, and alumina powder was used here as a reference. In temperature-sweep conditions, the nanocatalyst was heated at 700 K for 8 h under an O2 atmosphere before the weight change measurements to remove the CO2 pre-chemisorbed from CO2 gas in air. To exchange the atmosphere into an inert gas, Ar gas was introduced to replace O2 for 4 h and for enough time to return to 300 K. Ar was then replaced by CO2 to measure the reduction activity with increasing temperature. In isothermal conditions, the nanocatalyst was pretreated in the same way at 700 K for the measurements at 300–700 K, whereas the pretreatment temperatures were 700 K for the isothermal measurements above 700 K. These high-purity gases (>99.9% CO2, >99.7% O2, and >99.99% Ar) were introduced at a flow rate of 100 mL min−1. CO2 adsorption measurements were also conducted after heating at 423 K below 10−3 Pa (BELSORP MAX, MicrotracBEL, Osaka, Japan). Particle structures and carbon layer thickness after heating at 400, 600, 800, and 1000 K in CO2 atmosphere for 24 h were evaluated using TEM (JEM-2100F, JEOL Co., Tokyo, Japan) at 120 kV and SEM (JSM-6335F, JEOL CO., Tokyo, Japan) at 2–5 kV. The Raman scattering spectroscopies were also measured using a Nd:YAG laser at a power of 0.1 mW (NRS-3000; JASCO, Tokyo, Japan). XPS was performed at 10 kV Mg Kα radiation (JPS-9030, JEOL Co., Tokyo, Japan). These nanocatalysts were heated under a CO2 atmosphere at 300–1000 K before the XPS measurements. A temperature-programmed reaction using a lab-made mass spectrometry system including quadrupole mass spectrometry (M-101QA-TDF; Canon Anelva, Kanagawa, Japan) was conducted to analyse the gaseous species during the CO2 reduction at 300–1000 K (the rate of temperature increase = 5 K min−1). The nanocatalyst was heated at 700 K for 8 h under O2 atmosphere before the reduction measurements to remove CO2 pre-chemisorbed from air. Temperature-programmed desorption was also conducted in the same system. The nanocatalyst and CO2 reacted at 800 K for 24 h in a quartz tube and were cooled down to room temperature, followed by a temperature sweep under vacuum.

Results and discussion

Fig. 1a shows the thermal reduction of CO2 into solid carbon products using BaTiO3 nanocatalysts in our previous work31 and other thermocatalysts with/without reducing agents.23,24,28–30,36–42 CO2 reduction without reducing agents occurs at temperatures higher than 1000 K and generates partially reduced products, such as CO, even with the assistance of catalysts. This is a result of an endothermic decomposition of CO2 into CO. Using reducing agents, such as H2, CH4, C2H4, and C2H2, enables the reaction to be conducted at lower temperatures and increases the TOF. TOFs of 1–100 h−1 are obtained at 773 K–1273 K and under 1–104 bar, respectively. We succeeded in reducing CO2 into solid carbons without any reducing agents at a rather low temperature of 700 K and ambient pressure with a TOF of 0–0.39 h−1 using BaTiO3 nanocatalysts. The TOF of the CO2 reaction on nanocatalysts of 7 nm in crystal size was decreased with CO2 reduction time, as shown in Fig. S2. This was caused by the reduced carbon deposition on nanocatalyst surfaces, as mentioned later. However, the TOF changes for long-term reaction indicated consecutive reactions of CO2 reduction despite carbon deposition. The high cyclability of CO2 reduction in CO2 flow and carbon oxidation in O2 flow at 700 K was observed, as reported previously.31 However, some reduced carbon was hardly released in the oxidation condition by graphitic carbon formation. The catalytic performance of BaTiO3 nanocatalysts was related to their crystal size, which is defined from the crystallite size calculated by Scherrer equation of XRD (Fig. 1b). Nanocatalysts larger than 10 nm exhibited low CO2 reduction activity with a TOF smaller than 0.03 h−1. CO2 reduction increased, achieving a TOF higher than 0.38 h−1, when nanocatalysts smaller than 10 nm were used. This can be attributed to the larger surface area of the nanocatalysts with lower crystal sizes and increasing the reaction sites. On the other hand, the TOF was depressed for nanocatalysts smaller than 7 nm, because the nanocrystals were easily agglomerated and reduced active sites. In a no reactant system, CO2 reduction into CO is essential as the first step of CO2 conversion into carbon polymers, and the CO disproportionation reaction then induces the production of solid carbons. However, CO2 reduction into CO hardly occurs below 1000 K because the endothermic decomposition of CO2 into CO takes place instead, although the disproportionation reaction from CO to carbons is preferred at low temperatures (Fig. S1).25 This limitation can possibly be overcome by using BaTiO3 nanocatalysts with crystal size of 7 nm. However, the mechanism of this reaction is still unclear and should be clarified to develop catalysts with higher CO2 reduction performance.
image file: d2nr00883a-f1.tif
Fig. 1 (a) TOF of CO2 conversion into graphitic carbon with nanodiamond using BaTiO3 nanocatalysts in our previous works (red).31 The closed and open symbols represent the other works on CO2 reduction with and without reactant gases, respectively, into carbon nanotubes (CNTs; blue),28,42 carbon nanofibers (CNFs; blue),29,39–41 graphene (green),30,37 amorphous carbons (black),38 and carbon monoxide (orange).23,24,36 (b) Size-dependent CO2 reduction by BaTiO3 nanocatalysts. Reprinted with the permission of Watanabe.31 Copyright © 2021 American Chemical Society.

Three BaTiO3 nanocatalysts with crystal sizes of 7.4 ± 0.4, 18 ± 1, and 190 ± 20 nm (sizes were determined from the Scherrer formula of the XRD peaks, Fig. S3a) were denoted as 10, 20, and 200 nm-nanocatalysts. The 10-nm nanocatalyst was chosen to investigate the mechanism of the reaction. The averaged particle sizes of 10-, 20-, and 200-nm nanocatalysts were calculated based on spherical assumption of specific surface areas in N2 adsorption isotherms at 77 K (Fig. S3b and Table S1), small angle X-ray scatterings (Fig. S3d and e), and TEM and SEM images (Fig. S3f–h) to be 10–11, 19–21, and 1600–2010 nm, respectively. The crystal sizes were slightly smaller than the corresponding particle sizes. Agglomeration of particles caused mesopore formation mainly in the range of 1–5 nm for the 10-nm nanocatalysts and 4–10 nm for the 20-nm nanocatalysts, whereas the 200-nm nanocatalyst rarely had pores by the agglomeration of particles. Fig. 2 shows the weight changes of the 10-, 20-, and 200-nm nanocatalysts under a CO2 atmosphere at 300–1000 K under temperature-sweep conditions. The 10-, 20-, 200-nm nanocatalysts exhibited a weight increase of 500, 100, and 20 μmol g−1, respectively, at 800 K. Larger weight increases were observed at lower heating rates (Fig. S4), indicating the slow sorption and reduction of CO2 on the nanocatalysts. The weight of the 10-nm nanocatalyst increased abruptly at 300 K when the CO2 gas was introduced. It then relatively decreased until the temperature reached 600 K, above which it started to increase again. Finally, the weight started to drastically decrease above 900 K due to the increase in the crystal size from 7 to 21 nm (Fig. S5 and S6). The weight of the 20-nm nanocatalyst exhibited the same increase and decrease at 300 K and above 900 K, respectively, as those of the 10-nm nanocatalyst, but it exhibited another increase at 450 K. The final weight of the 20 nm nanocatalyst was decreased to the level of its initial weight. The considerable weight uptake of the 10-nm nanocatalyst was expected based on the CO2 sorption isotherms at 300–600 K (Fig. S7). The sorption amounts decreased steadily with the temperature in the adsorption branch, while the adsorption hysteresis loop widened with the increase in the temperature under 0.01–10 kPa (Fig. S8). The widened adsorption hysteresis between the adsorption and desorption branches was mainly caused by the chemisorption of CO2, while the adsorption amounts decreased with the decrease in the physical adsorption of CO2. Thus, the decrease in the weight change in the 10-nm nanocatalyst from 300 K to 600 K (Fig. 2) is a result of a considerable decrease in the physical adsorption, despite the increase in the chemisorption. The anomalous increase in the desorption branch at 600 K in the pressure range of 10–100 kPa is a result of the slow CO2 reduction reaction that occurred simultaneously because the reaction was continuously observed at 700 K (Fig. S2). The 20-nm nanocatalyst exhibited a small CO2 physical adsorption and chemisorption abilities, which was one-third of the amount for the 10-nm nanocatalysts, and slight adsorption hysteresis (Fig. S7). However, chemisorption and reduction occurred at 450 K, causing the weight change in the nanocatalyst. The deactivation of the 10- and 20-nm nanocatalysts above 900 K was caused by the crystal growth due to calcination because crystal growth decreases the CO2 reduction activity (Fig. 1b). The catalytic performance of the 200-nm nanocatalyst remained low because the crystals had grown during the synthesis. The weight change of the 10-nm nanocatalyst became negative above 960 K owing to the removal of a carboxyl group from a surface carbonate form, which accompanies the crystal growth (Fig. S5). The crystal growth of nanocatalysts reduced the catalytic ability above 900 K. The negative weight change was also observed in the process involving heating only under an Ar atmosphere (Fig. S9). The isothermal weight change of the 10-nm nanocatalyst agreed with the temperature-sweep weight change (see also Fig. S10), except for that at 1000 K. The positive weight change (even at 1000 K) under isothermal conditions is caused by the removal of a carboxyl group from the surface carbonate prior to the isothermal measurements (Fig. S10). Here, CO2 release by the removal of a carboxyl group was observed above 800 K, as discussed later, although the decomposition of BaCO3 into BaO and CO2 was observed at 1200 K.43 The weight decrease of nanocatalysts in the pretreatment was neglected in the weight changes for the isothermal measurements. On the other hand, in the temperature-sweep conditions, removal of a carboxyl group on the 10-nm nanocatalysts occurred in the measurement. The different conditions thus lead to different amount changes between the temperature-sweep and isothermal measurements.


image file: d2nr00883a-f2.tif
Fig. 2 Weight changes in the nanocatalysts under CO2 atmosphere. Temperature-sweep weight changes of the 10-nm (blue), 20-nm (orange), and 200-nm nanocatalysts (black) at 1 K min−1. The green curve represents the weight changes of the 10-nm nanocatalyst under CO2 exposure for 4 h and isothermal conditions (for comparison).

Fig. 3 shows the TEM images of the 10-nm nanocatalysts after the isothermal catalytic reaction with CO2 at 400, 600, 800, and 1000 K for 24 h. The carbon products generated by CO2 reduction were observed at 600 and 800 K. On the other hand, carbon products were hardly observed at 400 K and a tiny amount was observed at 1000 K, exhibiting less catalytic reduction at a very low temperature and significant crystal growth, respectively. The weight change under isothermal conditions (Fig. 2) indicates that the amounts of carbon products at 400, 600, and 1000 K were similar to each other. The weight change at 400 K was mainly caused by CO2 physical adsorption, while physically adsorbed CO2 at 400 K was released under high vacuum in TEM column. The negligible amount of carbon products generated at 400 K and illustrated in the TEM image indicates that CO2 was mainly physically adsorbed and chemisorbed on the 10-nm nanocatalysts and hardly reduced. The trend was also observed from Raman scattering spectroscopy (Fig. S11). The 10-nm nanocatalyst after heating at 400 K had a peak at 1450 cm−1, which perfectly agreed with the as-prepared 10-nm nanocatalyst. The peak was thus assigned by the BaTiO3 structure. On the other hand, the other peaks at 1280 and 1600 cm−1 appeared for the 10-nm nanocatalyst after heating at 600 and 800 K. The peak at 1280 cm−1 appeared by vibrations of both the disordered sp3-carbon44,45 and D-band, while that at 1600 cm−1 was assigned by the G-band, as reported previously.31 The intensity ratios of the D-band (or the peak of disordered sp3-carbon) at 1280 cm−1 against the peak at 1450 cm−1 were 0.0, 1.4, and 1.1 for heating at 400, 600, and 800 K, respectively. Similarly, the intensity ratios of G-band against the peak of BaTiO3 were 0.0, 1.2, and 0.7, respectively. Graphitic carbon materials were thus obviously formed between 400 and 600 K from the Raman scattering spectroscopy. Therefore, the first weight uptake between 300 K and 500 K (Fig. 2) was mainly caused by CO2 physical adsorption and chemisorption, and the second weight uptake was caused by CO2 reduction.


image file: d2nr00883a-f3.tif
Fig. 3 Carbon layer thickness as a function of temperature. TEM image of the 10-nm nanocatalysts exposed to CO2 gas at (a) 400 K, (b) 600 K, (c) 800 K, and (d) 1000 K for 24 h. (e) Carbon layer thickness evaluated from the TEM images.

Fig. S12 shows the XPS spectra of Ti 2p, Ba 3d and O 1s of the as-synthesized 10-nm, 20-nm, and 200-nm nanocatalysts. A small Ti3+ peak was observed, which was associated with the 10- or 20-nm nanocatalyst due to the presence of an oxygen vacancy.46 The Ti3+ ratios of the 10-, 20-, and 200-nm nanocatalysts were 8–11, 1.5–1.9, and 0.1–0.2%, respectively. Smaller nanocatalysts exhibited higher oxygen vacancies and reactivities.31,47 Chemisorbed CO2 was observed in the Ba 3d and O 1s spectra of the 10-nm nanocatalyst due to the chemisorption of CO2 under an air atmosphere; however, BaCO3 was not observed in the XRD results (Fig. S3a). CO2 chemisorption and reduction were evaluated on the 10-nm nanocatalyst using XPS after heating the catalysts under a CO2 atmosphere (Fig. 4 and S13). The Ba 3d peaks slightly changed after heating under a CO2 atmosphere (Fig. 4a). The shoulder peaks were assigned to the chemisorption of CO2 because CO2 adsorption is more favorable for BaO termination than the TiO2 termination of BaTiO3 (001).48 The Ba/Ti atomic ratio of the original 10-nm nanocatalyst was 11, indicating that the Ba atoms were more exposed on the interfaces of the nanocatalysts (Fig. 5a). However, the Ba/Ti atomic ratios decreased to 5–8 after the CO2 reaction at 300–1000 K. The Ba/Ti atomic ratio (Fig. 5a) exhibited an opposite trend to the weight change illustrated in Fig. 2. In other words, the decrease in the exposed Ba atoms corresponded to the weight increase. These trends indicated that CO2 was dominantly concentrated on the Ba sites rather than the Ti sites, although the TiO2 termination was energetically favored for the titanate-type perovskite with an oxygen vacancy.48,49 Similarly, the chemisorbed CO2 was clearly observed above 600 K, which was indicated by the C 1s, O 1s, and Ba 3d peaks at 289, 532 and 781 eV, respectively (Fig. 4 and S13a).50,51 Here, the presence of chemisorbed CO2 was confirmed by a carbonate peak observed at a much lower temperature than that at which the other Ba-containing perovskite (La0.5Ba0.5CoO3; >873 K) was observed.52 In addition, the carbon products significantly increased above 600 K, which was indicated by the sp2- and sp3-bonded carbon peaks at 284.5 and 285.5 eV in the XPS results.50 However, the Ti 2p peaks hardly changed by heating under a CO2 atmosphere (Fig. S13b), which also proves that CO2 is chemisorbed on the Ba sites in a carbonate-like form (Fig. 5a). The C/Ti atomic ratios on the 10-nm nanocatalyst subjected to a CO2 flow did not change up to 500 K, while the carbon atoms considerably increased above 500 K (Fig. 5b). Furthermore, the carbon atomic ratio dropped above 900 K. These changes coincided with the weight changes of the nanocatalysts illustrated in Fig. 2.


image file: d2nr00883a-f4.tif
Fig. 4 (a) Ba 3d and (b) C 1s XPS spectra of the 10-nm nanocatalysts as a function of the CO2 reaction temperature.

image file: d2nr00883a-f5.tif
Fig. 5 (a) Ba/Ti and (b) C/Ti atomic ratios on the nanocatalysts obtained from XPS analyses. The dashed lines represent Ba/Ti and C/Ti ratios on the pristine nanocatalyst.

A temperature-programmed CO2 reduction reaction was conducted to evaluate the extruded gases during the CO2 reduction on the 10-nm nanocatalyst (Fig. 6). The pressure changes of CO2, CO, and O2 were obtained from mass spectroscopic data (m/z = 44, 28, and 32, respectively). The CO2 pressure decreased at 400–800 K, indicating CO2 consumption by CO2 physical adsorption, chemisorption, and reduction. CO2 pressure then increased at 800–1000 K, indicating CO2 emission as a result of the chemisorbed CO2 release. CO production was simultaneously observed above 800 K. Fig. S14 shows the temperature-programmed desorption of the 10-nm nanocatalysts after the isothermal catalytic reaction in a CO2 atmosphere at 800 K for 24 h. CO2 and CO desorption was observed at 800–1000 K, respectively, while O2 desorption was hardly detected, which agrees with the results of the temperature-programmed reaction (Fig. 6). The calculated desorption energy of surface carbonate (corresponded to 2000 K)53 was much higher than the actual values (800–1000 K) observed here, suggesting a weak bond between the nanocatalysts and CO2/CO. The O2 generation between 500 K and 850 K suggested the reduction of CO2 into C/CO and O2. Here, the 10-nm nanocatalyst used without the CO2 flow hardly released O2 in the temperature region (Fig. S15), indicating CO2 reduction on the 10-nm nanocatalyst at extremely low temperatures at and below 500 K.


image file: d2nr00883a-f6.tif
Fig. 6 A temperature-programmed reaction of CO2, CO, and O2 through a CO2 reduction on 10-nm nanocatalysts under CO2 flow. The dashed lines represent the background pressures without a catalyst.

Conclusions

Low temperature CO2 reduction using BaTiO3 nanocatalysts below 1000 K was demonstrated, and its mechanism was evaluated. CO2 was completely reduced into carbon products with a high TOF of 0–0.39 h−1 at 700 K without any reducing agents and reactant gases. This is a much lower temperature than those reported in previous studies. Excellent reduction performance was observed using nanocatalysts with crystal sizes smaller than 20 nm. The weight changes of the 10-nm nanocatalyst in CO2 and CO2 adsorption isotherms suggested that the CO2 physical adsorption was dominant at 300 K and that chemisorption significantly increased with the increase in the temperature in spite of the physical adsorption above 500 K. Chemisorption and reduction occurred at 450 K, and the weight of the 10-nm nanocatalyst increased again at 700 K. The crystal growth above 900 K resulted in a decrease in the weight and a significant decrease in the reduction activity. The TEM images indicated the presence of carbon products under CO2 flow conditions at 600 K and 800 K, which agrees with the expectation of the weight changes. Thus, the optimal temperature conditions to obtain carbon products by complete CO2 reduction using nanocatalysts are at 600–800 K.

The XPS results indicated that a significant amount of the carbon species was produced on the 10-nm nanocatalyst under a CO2 atmosphere at temperatures higher than 500 K. In addition, the XPS results revealed that CO2 was chemisorbed on the BaO sites to form surface carbonates. Carbon products were thus generated from CO2via CO. A temperature-programmed reaction and desorption indicated physical adsorption/chemisorption/reduction of CO2 at 400–800 K, a release of CO2 and CO above 800 K, and an O2 release between 500–850 K. The CO2 thermal catalytic reduction is summarized as follows: CO2 was chemisorbed and reduced into C, and O2 was emitted between 500 K and 850 K,54 which was followed by CO emission and the subsequent CO2 emission at and above 800 K owing to the release of pre-chemisorbed CO2 and the disproportionation reaction between CO2 and C to form CO, especially at high temperatures. Fig. 7 summarized the temperature-dependent CO2 sorption and reduction observed in this work. CO2 physical adsorption was dominant at 300 and 400 K, then decreased with increasing temperature, and finally would reach zero at 700 K. The CO2 chemisorption on the 10-nm nanocatalyst was less temperature-dependent and might be decreased above 600 K. CO2 reduction reaction was observed from 400–500 K and exhibited the maximum reaction rate at 800 K, while it abruptly decreased above 800 K. To the best of our knowledge, this is the first study to report a thermocatalytic CO2 reduction without any reducing agents and reaction gases at 500 K and to clarify the temperature-dependent CO2 reduction properties. However, further study is necessary to develop catalysts for CO2 reduction that can work at low temperatures and to clarify their reaction mechanisms.


image file: d2nr00883a-f7.tif
Fig. 7 Temperature dependence of CO2 physical adsorption, chemisorption, and reduction reaction. Physical adsorption (green) and chemisorption (blue) evaluated from the N2 adsorption isotherms. Reduction (red) evaluated from O2 release in the temperature-programmed reaction (□), carbon depositions in the XPS (◊) and TEM (×) analysis.

Author contributions

T. W. and T. O. designed all of the methodology and conducted all of the experiments and writing the initial draft. T. O. has leadership responsibility. All authors participated in composition of the manuscript. The authors declare no competing interests.

Conflicts of interest

There are no conflicts to declare.

Acknowledgements

Transmission electron microscopy and X-ray photoelectron microscopies were conducted at the Chiba Iodine Resource Innovation Center in Chiba University. This research was supported by the Suzuki Foundation, JFE 21st Century Foundation, and JSPS KAKENHI grant number JP22H04250.

Notes and references

  1. T. Kompas, V. H. Pham and T. N. Che, Earth's Future, 2018, 6, 1153–1173 CrossRef.
  2. S. Beck and M. Mahony, Nat. Clim. Change, 2017, 7, 311–313 CrossRef.
  3. H. Waisman, H. De Coninck and J. Rogelj, Environ. Res. Lett., 2019, 14, 111001 CrossRef.
  4. W.-J. Ong, L.-L. Tan, S.-P. Chai, S.-T. Yong and A. R. Mohamed, Nano Energy, 2015, 13, 757–770 CrossRef CAS.
  5. E. Liu, L. Kang, F. Wu, T. Sun, X. Hu, Y. Yang, H. Liu and J. Fan, Plasmonics, 2014, 9, 61–70 CrossRef CAS.
  6. R. Kuriki, M. Yamamoto, K. Higuchi, Y. Yamamoto, M. Akatsuka, D. Lu, S. Yagi, T. Yoshida, O. Ishitani and K. Maeda, Angew. Chem., Int. Ed., 2017, 56, 4867–4871 CrossRef CAS PubMed.
  7. N. Shehzad, M. Tahir, K. Johari, T. Murugesan and M. Hussain, J. CO2 Util., 2018, 26, 98–122 CrossRef CAS.
  8. J. Albero, Y. Peng and H. García, ACS Catal., 2020, 10, 5734–5749 CrossRef CAS.
  9. K. Stangeland, D. Kalai, H. Li and Z. Yu, Energy Procedia, 2017, 105, 2022–2027 CrossRef CAS.
  10. D. Pandey, K. Ray, R. Bhardwaj, S. Bojja, K. V. R. Chary and G. Deo, Int. J. Hydrogen Energy, 2018, 43, 4987–5000 CrossRef CAS.
  11. A. Kim, C. Sanchez, G. Patriarche, O. Ersen, S. Moldovan, A. Wisnet, C. Sassoye and D. P. Debecker, Catal. Sci. Technol., 2016, 6, 8117–8128 RSC.
  12. C.-S. Chen, W.-H. Cheng and S.-S. Lin, Catal. Lett., 2000, 68, 45–48 CrossRef CAS.
  13. T. Riedel, M. Claeys, H. Schulz, G. Schaub, S.-S. Nam, K.-W. Jun, M.-J. Choi, G. Kishan and K.-W. Lee, Appl. Catal., A, 1999, 186, 201–213 CrossRef CAS.
  14. Y. A. Daza, D. Maiti, R. A. Kent, V. R. Bhethanabotla and J. N. Kuhn, Catal. Today, 2015, 258, 691–698 CrossRef CAS.
  15. Y. A. Daza, R. A. Kent, M. M. Yung and J. N. Kuhn, Ind. Eng. Chem. Res., 2014, 53, 5828–5837 CrossRef CAS.
  16. K. Sayama and H. Arakawa, J. Phys. Chem., 1993, 97, 531–533 CrossRef CAS.
  17. Q. Sun, C.-W. Liu, W. Pan, Q.-M. Zhu and J.-F. Deng, Appl. Catal., A, 1998, 171, 301–308 CrossRef CAS.
  18. H. Nazir, C. Louis, S. Jose, J. Prakash, N. Muthuswamy, M. E. M. Buan, C. Flox, S. Chavan, X. Shi, P. Kauranen, T. Kallio, G. Maia, K. Tammeveski, N. Lymperopoulos, E. Carcadea, E. Veziroglu, A. Iranzo and A. M. Kannan, Int. J. Hydrogen Energy, 2020, 45, 13777–13788 CrossRef CAS.
  19. W. Aladayleh and A. Alahmer, J. Energy, 2015, 2015, 495418 Search PubMed.
  20. S. Y. Htwe, M. Zaw, A. KoLatt and K. K. Khaing, Iconic Res. Eng. J., 2019, 2, 169–174 Search PubMed.
  21. K. Zbigniew, Pol. Marit. Res., 2015, 22, 47–54 CrossRef.
  22. K. Zbigniew, Pol. Marit. Res., 2011, 18, 37–43 Search PubMed.
  23. Q. Jiang, Z. Chen, J. Tong, M. Yang, Z. Jiang and C. Li, Chem. Commun., 2017, 53, 1188–1191 RSC.
  24. M. M. Nair and S. Abanades, Sustainable Energy Fuels, 2018, 2, 843–854 RSC.
  25. G. S. Simate, S. E. Iyuke, S. Ndlovu, C. S. Yah and L. F. Walubita, J. Nat. Gas Chem., 2010, 19, 453–460 CrossRef CAS.
  26. D. Yu, M. Zhu, T. A. Utigard and M. Barati, Thermochim. Acta, 2014, 575, 1–11 CrossRef CAS.
  27. A. Moisala, A. G. Nasibulin and E. I. Kauppinen, J. Phys.: Condens. Matter, 2003, 15, S3011–S3035 CrossRef CAS.
  28. M. S. Challiwala, H. A. Choudhury, D. Wang, M. M. El-Halwagi, E. Weitz and N. O. Elbashir, Sci. Rep., 2021, 11, 1417 CrossRef CAS PubMed.
  29. C. S. Chen, J. H. Lin, J. H. You and K. H. Yang, J. Phys. Chem. A, 2010, 114, 3773–3781 CrossRef CAS PubMed.
  30. C. Molina-Jirón, M. R. Chellali, C. N. S. Kumar, C. Kübel, L. Velasco, H. Hahn, E. Moreno-Pineda and M. Ruben, ChemSusChem, 2019, 12, 3509–3514 CrossRef PubMed.
  31. T. Watanabe and T. Ohba, ACS Sustainable Chem. Eng., 2021, 9, 3860–3873 CrossRef CAS.
  32. A. L. Patterson, Phys. Rev., 1939, 56, 978–982 CrossRef CAS.
  33. F. Izumi and K. Momma, Solid State Phenom., 2007, 130, 15–20 CAS.
  34. J. S. Pedersen, Phys. Rev. B: Condens. Matter Mater. Phys., 1993, 47, 657–665 CrossRef PubMed.
  35. S. Brunauer, P. H. Emmett and E. Teller, J. Am. Chem. Soc., 1938, 60, 309–319 CrossRef CAS.
  36. L. Wang, T. Ma, S. Dai, T. Ren, Z. Chang, L. Dou, M. Fu and X. Li, Chem. Eng. J., 2020, 389, 124426 CrossRef CAS.
  37. M. I. Kairi, M. K. N. M. Zuhan, M. Khavarian, B. Vigolo, S. A. Bakar and A. R. Mohamed, Mater. Lett., 2018, 227, 132–135 CrossRef CAS.
  38. G. Hut, H. G. Östlund and K. van der Borg, Radiocarbon, 1986, 28, 186–190 CrossRef CAS.
  39. J. L. Pinilla, S. de Llobet, I. Suelves, R. Utrilla, M. J. Lázaro and R. Moliner, Fuel, 2011, 90, 2245–2253 CrossRef CAS.
  40. K. Nakabayashi, Y. Matsuo, K. Isomoto, K. Teshima, T. Ayukawa, H. Shimanoe, T. Mashio, I. Mochida, J. Miyawaki and S.-H. Yoon, ACS Sustainable Chem. Eng., 2020, 8, 3844–3852 CrossRef CAS.
  41. C.-S. Chen, J.-H. Lin, J.-H. Wu and C.-Y. Chiang, Catal. Commun., 2009, 11, 220–224 CrossRef CAS.
  42. Z. Li, Y. Xu, X. Ma, E. Dervishi, V. Saini, A. R. Biris, D. Lupu and A. S. Biris, Chem. Commun., 2008, 3260–3262 RSC.
  43. I. Arvanitidis, D. Siche and S. Seetharaman, Metall. Mater. Trans. B, 1996, 27, 409–416 CrossRef.
  44. S. Prawer, K. W. Nugent and D. N. Jamieson, Diamond Relat. Mater., 1998, 7, 106–110 CrossRef CAS.
  45. J. D. Hunn, S. P. Withrow, C. W. White and D. M. Hembree, Phys. Rev. B: Condens. Matter Mater. Phys., 1995, 52, 8106–8111 CrossRef CAS PubMed.
  46. J. L. Wang, J. Leroy, G. Niu, G. Saint-Girons, B. Gautier, B. Vilquin and N. Barrett, Chem. Phys. Lett., 2014, 592, 206–210 CrossRef CAS.
  47. S. Deshpande, S. Patil, S. V. Kuchibhatla and S. Seal, Appl. Phys. Lett., 2005, 87, 133113 CrossRef.
  48. K. V. Sopiha, O. I. Malyi, C. Persson and P. Wu, Phys. Chem. Chem. Phys., 2018, 20, 18828–18836 RSC.
  49. J. J. Brown, Z. Ke, W. Geng and A. J. Page, J. Phys. Chem. C, 2018, 122, 14590–14597 CrossRef CAS.
  50. S. Utsumi, H. Honda, Y. Hattori, H. Kanoh, K. Takahashi, H. Sakai, M. Abe, M. Yudasaka, S. Iijima and K. Kaneko, J. Phys. Chem. C, 2007, 111, 5572–5575 CrossRef CAS.
  51. M. Wegmann, L. Watson and A. Hendry, J. Am. Ceram. Soc., 2004, 87, 371–377 CrossRef CAS.
  52. N. Arulmozhi, W. H. Kan, V. Thangadurai and K. Karan, J. Mater. Chem. A, 2013, 1, 15117–15127 RSC.
  53. G. Rakotovelo, P. S. Moussounda, M. F. Haroun, P. Légaré, A. Rakotomahevitra, M. Rakotomalala and J. C. Parlebas, Surf. Sci., 2009, 603, 1221–1228 CrossRef CAS.
  54. Z. Li, Y. Yu, W. Li, G. Wang, L. Peng, J. Li, D. Gu, D. Yuan and H. Wu, New J. Chem., 2018, 42, 15663–15670 RSC.

Footnote

Electronic supplementary information (ESI) available: CO disproportionation, structure evaluation of nanocatalysts, heating rate dependence of weight change, crystal growth of nanocatalyst, CO2 adsorption isotherms, adsorption hysteresis of CO2, weight increase of nanocatalyst in Ar, isothermal weight change of nanocatalyst in CO2, and XPS analyses. See DOI: https://doi.org/10.1039/d2nr00883a

This journal is © The Royal Society of Chemistry 2022